1. Introduction
In recent years, industrial development has affected the earth’s climate and led to the greenhouse effect. As the application of renewable energy can reduce the impact of the greenhouse effect on the living environment, it is an important research topic for power system development. Renewable energy includes wind power, hydropower, geothermal power, biomass power, and solar power. This study focused on solar power generation (SPG) systems, as its applications have been prevalent, such as electric vehicle charging stations [
1], battery chargers [
2], street lights [
3], electric water heaters [
4], artificial satellites [
5], and household electricity [
6].
The photovoltaic module (PVM) used in the SPG is susceptible to the effects of temperature T and irradiance level G [
7], thereby reducing system efficiency [
8]. Therefore, this study focused on the research of the SPG maximum power point (MPP) [
9]. The maximum power point tracking (MPPT) technique has been frequently used in SPG. The hill-climbing (HC) algorithm architecture is inexpensive and simple to implement. MPPT can be executed after comparing two power points before and after the implementation [
10]. This intelligent sampling program based on the method of open-circuit voltage judges each sample of the marginal array power and then searches the MPP [
11]. A hybrid tracking technique was proposed to offer ample trade-off between the perturb and observe (P&O) and accelerate soft calculating technique via accurately searching the MPP [
12]. An improved maximum power trapezoidal technique was introduced for the MPPT of the SPG systems under partial shadow conditions [
13]. The proposed integrated MPPT method is the basis of iterative control and P&O technology. Moreover, the iterative control can process time interval changes to reduce steady-state vibrations and deviation [
14]. The proposed technique takes into account the nonlinear and multiple peak characteristics of the PVM output curve under partial shading and is a multiple-producer group find optimization technique for the MPPT [
15]. Optimization of the performance of the MPPT processing, in which the perturbation frequency and perturbation step length parameters need pre-setting, was developed [
16]. An alternative to using the metaheuristic approach was to combine the bat algorithm with the abandonment mechanism of the Cuckoo found in the MPP [
17]. The proposed control structure corresponds to the maximum energy considered for the MPPT method. It adopted the polynomial fuzzy model and formulated a direct maximum power-based control architecture based on the sum of square conditions [
18]. To improve the convergence speed, the grabble space jump method was combined with the fixed impedance technique to shorten the reply time of this system [
19]. A complete two-stage PVM MPPT system, which uses a superior restricted control algorithm, was proposed [
20]. To achieve the MPP, the artificial bee colony algorithm combined with a single current sensor HC was introduced [
21]. This is an intelligent control strategy to search the MPP on the P-V curve, which reduces the path extent to the actuating point. In other words, it is a fast convergence [
22]. The hybrid algorithm parallel and compact pigeon-inspired optimization is an improved pigeon technique that can quickly reach the MPP [
23]. Furthermore, the developed nonlinear sliding mode can control the MPPT algorithm for changes in G conditions [
24]. The musical chairs MPPT algorithm for the SPG is a newly proposed optimization algorithm and has fast convergence in the shading conditions [
25]. The proposed adaptive fuzzy system particle swarm optimization (PSO) based on the integrating method is fast and can stably hold the MPP [
26,
27]. The proposed uses the image recognition technique of shading, when a part of the PVM is shaded, and then uses the relay circuit to do electrical reconfiguration to enhance the power output under PSC [
28]. This developed the buck-boost converter with parallel power processing function, as well as the multiple P&O algorithms, then enhanced system performance [
29].
The HC algorithm is widely used by researchers for its low cost and easy implementation [
10]. Nevertheless, it has some shortcomings that result in low system performance, as follows: (1) under low irradiance level conditions, it is difficult for the MPPT to reach the MPP [
30]; (2) under the steady irradiance level conditions, the actuating point vibrates near the MPP [
31]; (3) under the irradiance level with rapid change conditions, the actuating point cannot capture the MPP in time [
32]; (4) the convergence speed becomes slower when the actuating point is close to the MPP [
10]; and (5) under PSC, the actuating point of the MPPT cannot easily reach the MPP [
10].
This study proposed a photovoltaic module quick regulate (PVM-QR) MPPT algorithm to analyze the relationship between the PVM Voc, Vpvm, Ipvm, Rpvm, temperature, and irradiance level. This study also drew a corresponding curve and simplified the algorithm to a mathematical equation. The proposed PVM-QR MPPT method can simply and quickly calculate temperature, irradiance level, and the key factor parameter u according to the equation. The PVM is connected to the load Ro through a boost converter, and Ro is considered in the MPPT duty cycle estimation. The proposed PVM-QR MPPT method also takes into account the actual temperature, irradiance level, Ro, and parameter u, optimizes the MPPT duty cycle, and captures the MPP instantly.
In summary, the proposed PVM-QR MPPT algorithm can greatly improve the inefficiency of the HC algorithm. In low irradiance level conditions, the proposed PVM-QR MPPT algorithm can trace to the MPP, while the actuating point can accurately capture the MPP under the steady-state of irradiance level conditions. Furthermore, the actuating point of the proposed MPPT algorithm can accurately capture the MPP in time under the conditions that irradiance level has rapid changes. Under the PSC, the MPP can be also captured by actuating point in time. The circuit with a simple design for the proposed PVM-QR MPPT algorithm is particularly suitable under uniform irradiation conditions (UIC) and PSC, which can greatly improve the system efficiency and reduce the design cost.
Under an irradiance level of 0.55 kW/m
2 and 0.2 kW/m
2 conditions, as well as PSC, the proposed PVM-QR and HC algorithms were measured, compared, and then verified. The results demonstrate the proposed PVM-QR algorithm efficiency is superior to the HC algorithm. The proposed algorithm could run at the MPP and then prevent divergence under low irradiance level conditions and PSC [
30].
In this study, the proposed PVM-QR algorithm was compared with the HC algorithm because the HC algorithm has a comparative value, as it is widely used and is low cost. This study further analyzed the shortcomings of the HC algorithm and developed the proposed PVM-QR algorithm. This proposed algorithm was verified to have the best control strategy to solve the shortcomings of the HC algorithm. Therefore, it is reasonable to compare the proposed PVM-QR algorithm with the HC algorithm.
The remainder of this paper is organized as follows:
Section 2 describes the HC algorithm, and the proposed algorithm is presented in detail in
Section 3.
Section 4 presents the experimental results, while
Section 5 includes conclusions and suggests directions for future work.
3. Proposed Algorithm
Under the conditions that irradiance level has rapid changes, the actuating point of the HC algorithm cannot immediately capture the MPP. Under stable irradiance level conditions, the actuating point of the HC algorithm will be disturbed near the MPP. Furthermore, its convergence speed is slow. The actuating point of the HC algorithm under PSC usually sticks in local MPP. This research focuses on these issues and proposes a new PVM-QR MPPT algorithm, which can track the MPP simply and quickly and avoid the HC algorithm problems causing system inefficiency.
The proposed PVM-QR MPPT algorithm can simply and quickly calculate the actual temperature and irradiance level, which considers the load Ro. Furthermore, it also calculates the duty cycle of the MPPT by the controller and drives the power converter to reach the MPP.
In this study, the single PVM parameters are shown in
Table 1, where irradiance level G is 1 kW/m
2 and temperature T = 25 °C,
Voc = 41.8 V,
Isc = 5.05 A,
VMPP = 34.5 V,
IMPP = 4.35 A, and
PMPP = 150 W.
Figure 1 displays the single PVM that was used in the experiment. This single PVM uses a PVM simulator which is Chroma (Model Number: 62100H-600S), where irradiance level G is 1 kW/m
2, temperature T = 25 °C,
Voc = 41.8 V,
Isc = 5.05 A,
VMPP = 34.5 V,
IMPP = 4.35 A, and
PMPP = 150 W.
Figure 1a illustrates the PVM
Ppvm–Vpvm characteristic curves graph: G = 1 kW/m
2 and T of 0, 25, 50, and 75 degrees, respectively.
Figure 1b shows the PVM
Ipvm–Vpvm characteristic curves graph: G = 1 kW/m
2, and T of 0, 25, 50, and 75 degrees, respectively.
The relationship between PVM
Rpvm,
Vpvm, and
Ipvm, is as follows:
First, as shown in
Figure 1a, this study analyzed the PVM
Ppvm–Vpvm characteristic curves and PVM
Ipvm–Vpvm characteristic curves as in
Figure 1b. Microsoft Excel was used to draw the relationship between
Vpvm,
Rpvm, temperature T, and irradiance level G curves (as shown in
Figure 2).
Figure 2 demonstrates seven curves showing the relationship between
Vpvm,
Rpvm, temperature T, and irradiance level G, as follows: Curve 1 to Curve 7, irradiance level G (0–1 kW/m
2), and then Curve 1 to Curve 7, temperature T (0, 10, 20, 30, 40, 50, and 60 °C, respectively). The seven curves mathematical model could be approximated as a quadratic equation as follows:
where
x,
y, and
z are parameters. Equation (2) shows the relationship between the parameters
x,
y,
z, and T, as shown in
Table 2.
According to the parameters
x,
y,
z, and temperature T shown in
Table 2, Equations (3)–(5) can be obtained as follows:
where parameter
a1 = 0.0217, and parameter
b1 = 5.3728.
where parameter
a2 = 0.3433, and parameter
b2 = −431.27.
where parameter
a3 = −38.69, and parameter
b3 = 8572.9.
Then, through Equations (2)–(5), Equation (6)
Vpvm is derived and expressed as follows:
As shown in
Figure 1a, the PVM
Ppvm–Vpvm characteristic curves were analyzed, and as shown in
Figure 1b, the PVM
Ipvm–Vpvm characteristic curves were analyzed. Microsoft Excel was used to draw the relationship between irradiance level G,
Rpvm, and temperature T curves (as shown in
Figure 3).
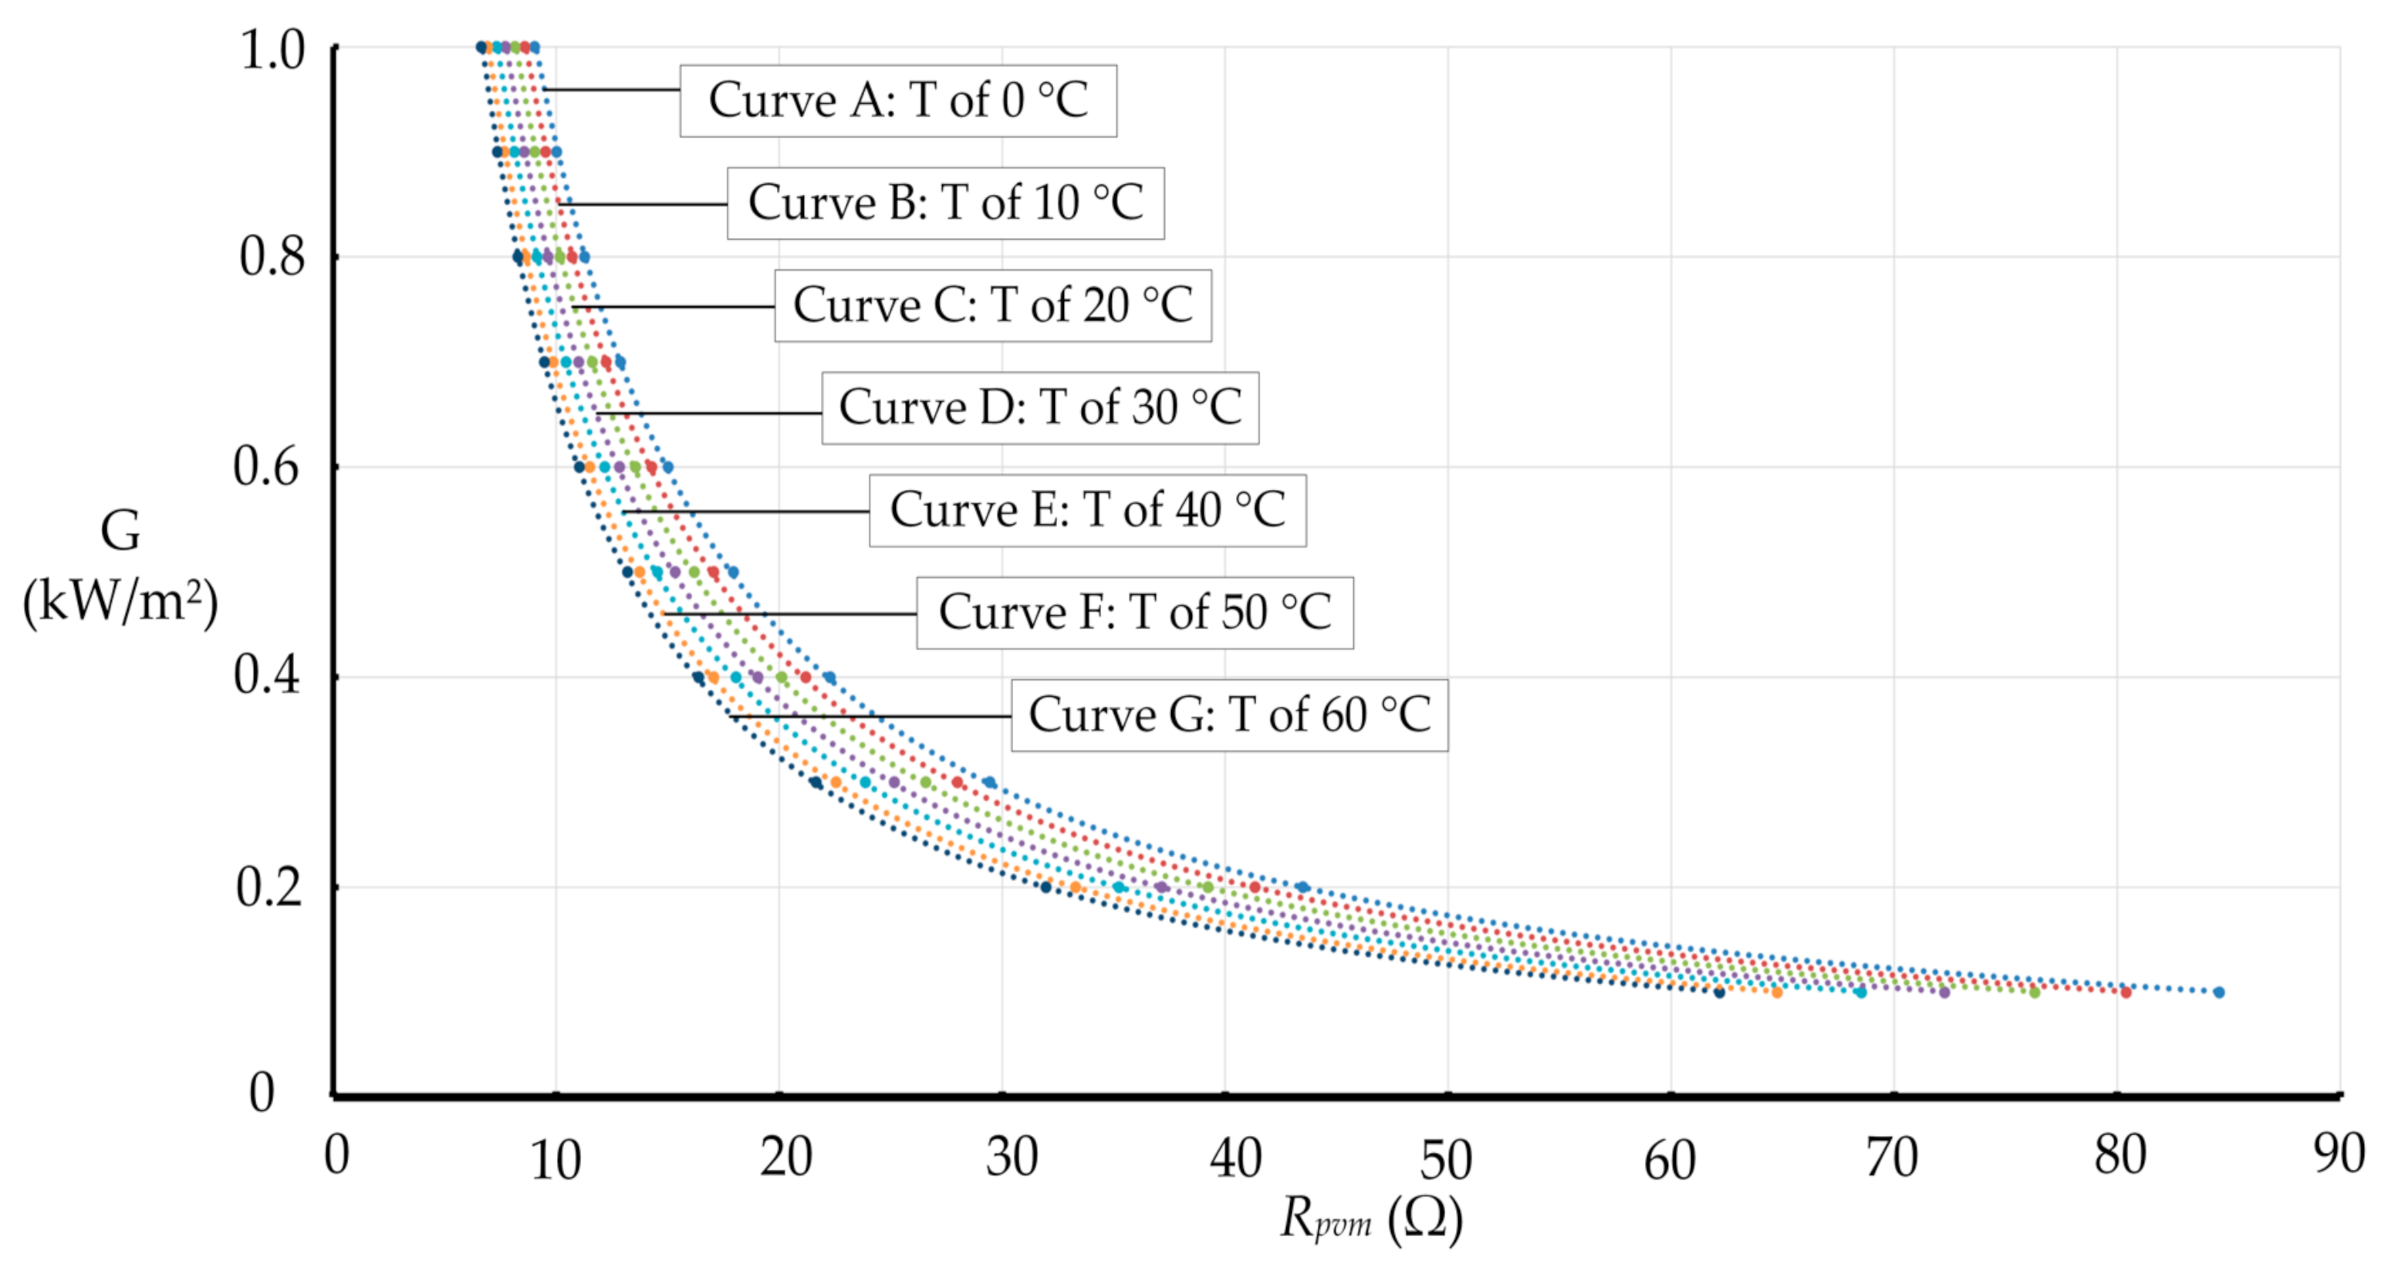
Figure 3 demonstrates seven curves showing the relationship between irradiance level G,
Rpvm, and temperature T as follows: Curve A to Curve G, irradiance level G from 0.1 kW/m
2 to 1 kW/m
2, and temperature T (0, 10, 20, 30, 40, 50, and 60 °C, respectively). The mathematical model of the seven curves can be approximated using the equation as follows:
Rpvm−1 can be obtained from Equation (7) as follows:
Given that
u is a parameter,
Figure 3 and Equation (7) show the relationship between the parameter
u and temperature T, as mentioned in
Table 3.
According to the parameter
u and temperature T shown in
Table 3, the equation is converted as follows:
where parameter
a4 = −44.571, and parameter
b4 = 9636.9.
Then, as shown in
Figure 1a, this study analyzed the PVM
Ppvm–Vpvm characteristic curves and PVM
Ipvm–Vpvm characteristic curves as in
Figure 1b. Microsoft Excel was used to draw the relationship between
Voc, temperature T, and irradiance level G straight lines (as shown in
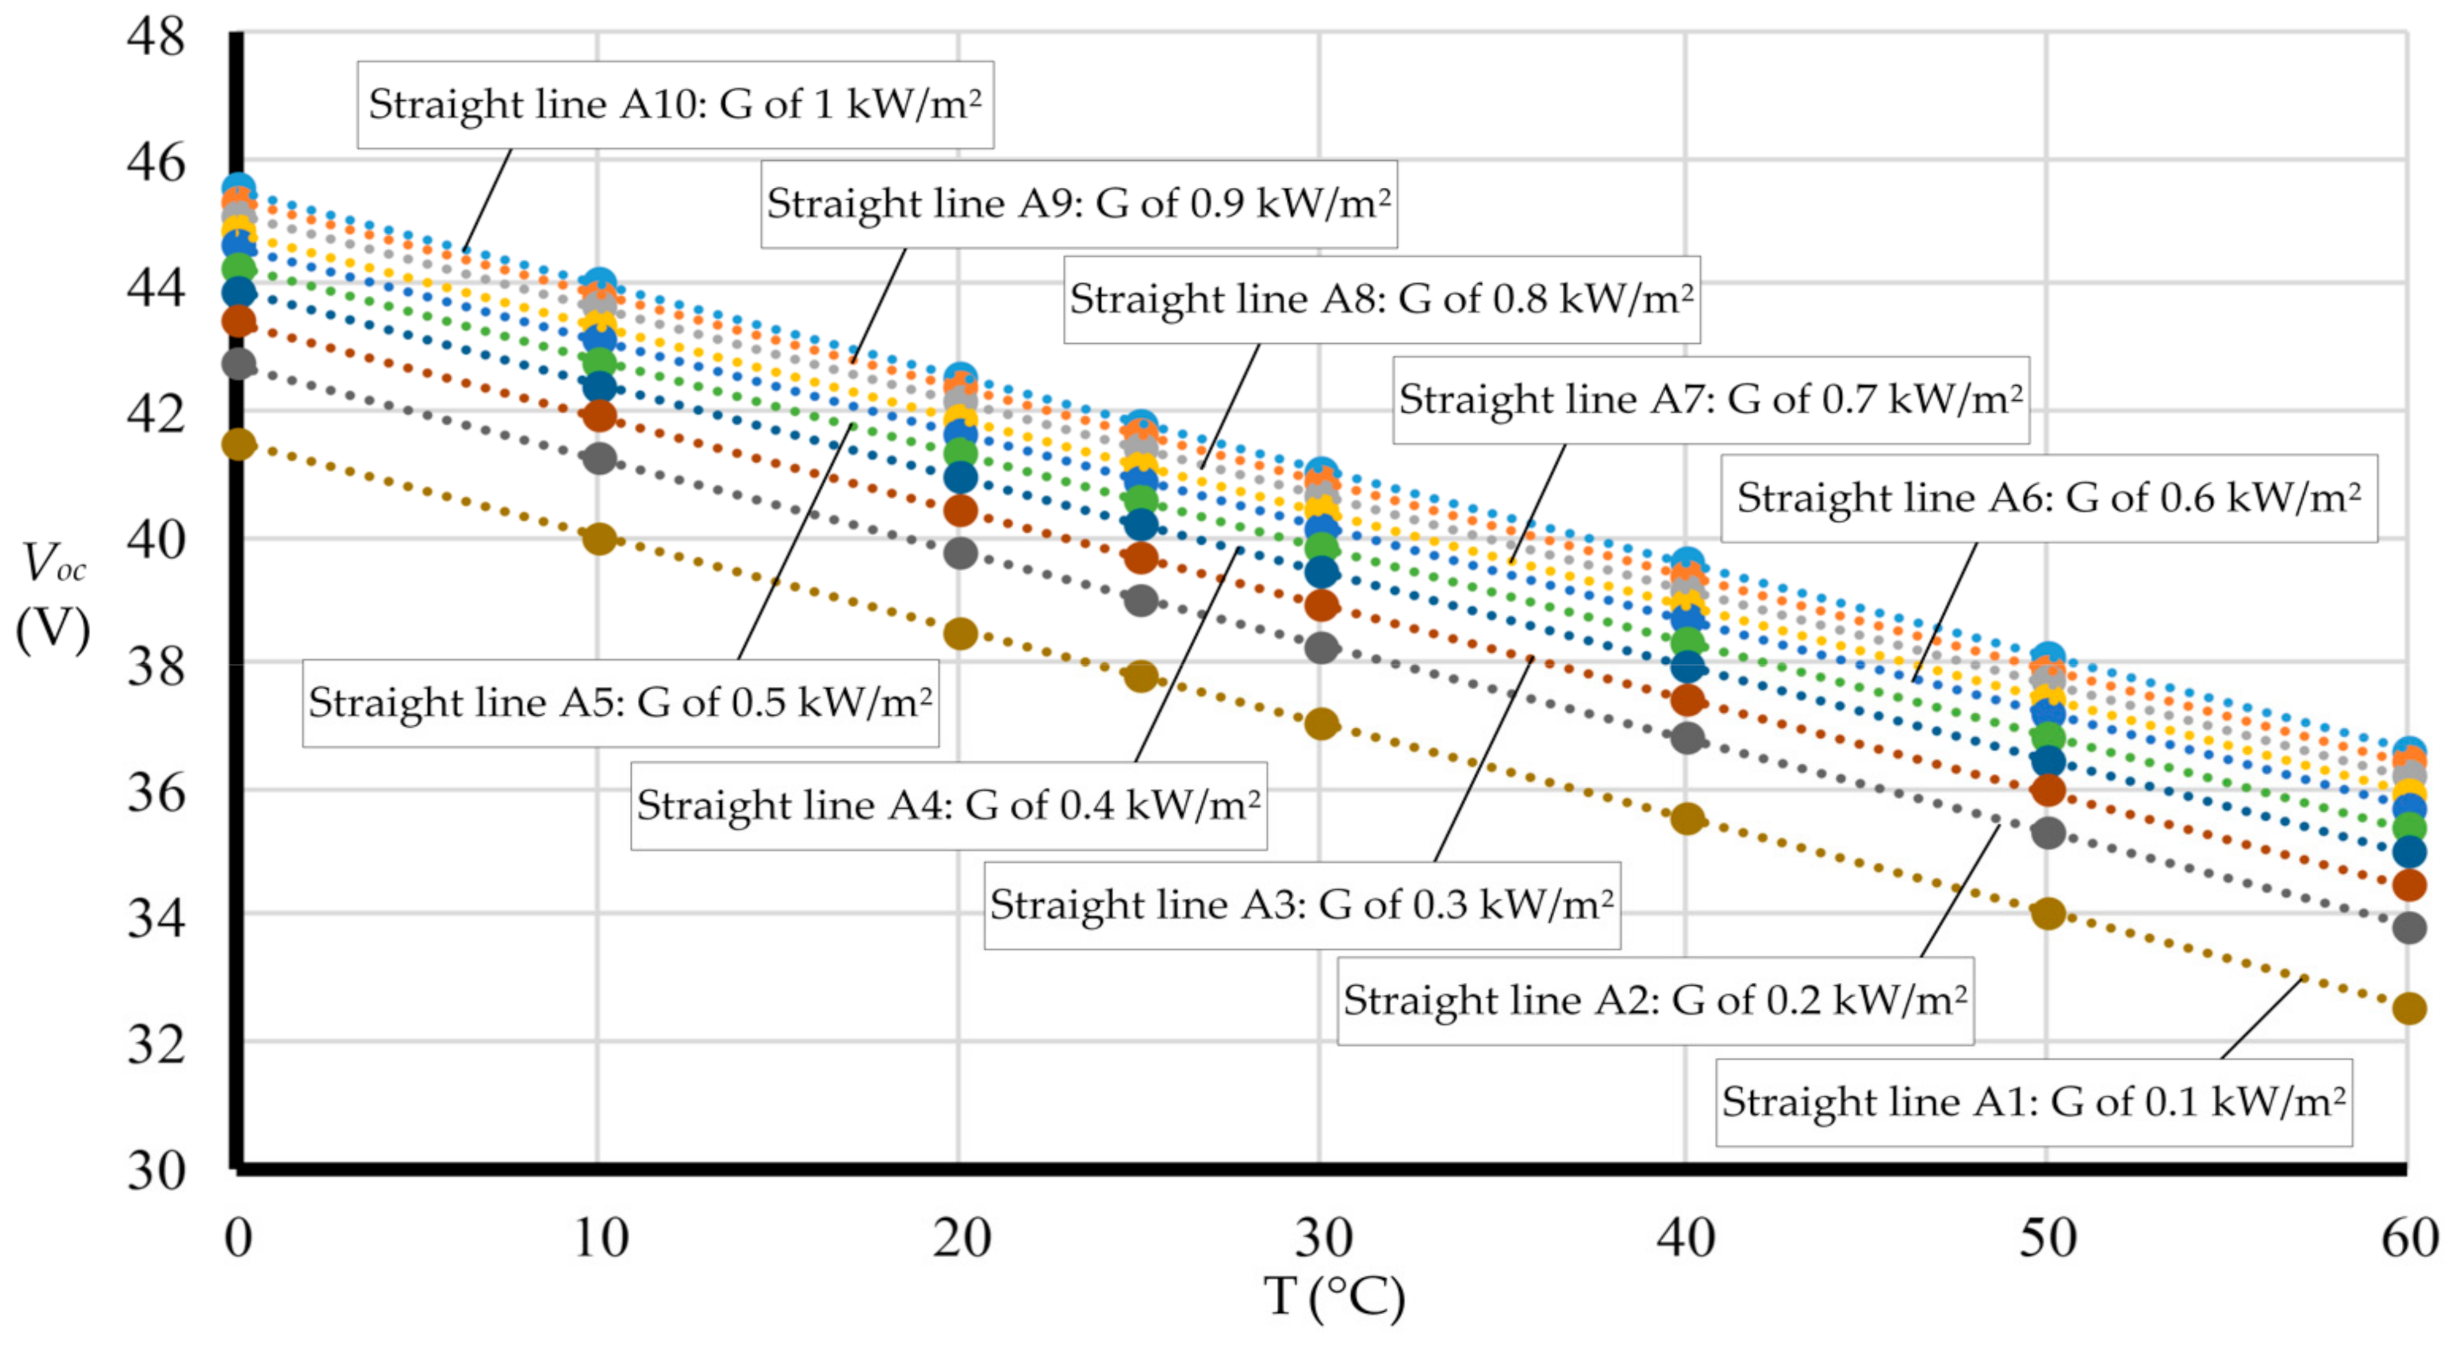
Figure 4).
Figure 4 displays ten straight lines showing the relationship between
Voc, temperature T, and irradiance level G, as follows: straight line A1 to straight line A10, temperature T from 0 to 60 °C, and then straight line A1 to straight line A10, irradiance level G from 0.1 kW/m
2 to 1 kW/m
2. The ten straight lines mathematical model could be approximated using the equation as follows:
Table 4 shows the relationship between the parameter
a5, parameter
b5, and irradiance level G. When the irradiance level changes, the parameter
a5 is constant, but the parameter
b5 will change. Then derive the relationship equation between the parameter
b5 and irradiance level G is expressed as follows:
where parameter
f = 1.016, parameter
c1 = −5 × 10
−6, parameter
d1 = 0.0091, and parameter
e1 = 40.897.
Then, Equation (11) is substituted into Equation (10), as shown in Equation (12):
Lastly, in order to calculate temperature T, therefore, Equations (7) and (9) are substituted into Equation (12), then Equation (13) is obtained. The parameters
a4,
a5,
b4,
c1,
d1,
e1, and
f are all known data, among
Voc and
Rpvm−1 can be obtained by actual measurement, so the value of temperature T can be obtained from Equation (13).
The PVM connects the boost converter, and the relationship equation between the PVM output voltage
Vpvm, the output voltage
Vo, and the duty cycle D is as follows:
In ideal conditions,
Ppvm =
Po, so the relationship equation between PVM output current
Ipvm, output current
Io, and D is as follows:
Rpvm−1, load
Ro, and D are obtained from Equations (14) and (15) as follows:
Equation (8) is substituted into Equation (16), and the relationship between the parameter
u, D, irradiance level G, and
Ro is derived as follows:
Equation (17) considers load Ro, actual irradiance level G, and parameter u, of which parameter u is obtained from the relationship between temperature and Rpvm. In Equation (17), D is the optimal duty cycle of the MPPT. This study immediately captures the MPP under the conditions that irradiance level and temperature have rapid changes. The proposed method has no slow convergence speed problem and disturbance characteristics, where the actuating point will not be disturbed near the MPP.
Figure 5 displays this proposed PVM-QR MPPT algorithm flowchart, where
Voc is PVM open-circuit voltage;
Vpvm is PVM output voltage;
Ipvm is PVM output current;
Vo represents the power converter output voltage;
Io represents the power converter output current;
a4 and
b4 are the parameters of Equation (9);
a5 is the parameter of Equation (10);
c1,
d1 e1, and,
f are the parameters of Equation (11);
u is the parameter of Equation (7);
Ro is load; G is irradiance level; T is temperature; and D is the duty cycle. First, the proposed algorithm measures
Voc,
Vpvm,
Ipvm,
Vo, and
Io, and then
Rpvm and
Ro are calculated. Second, actual temperature T is calculated by Equation (13). Third, the proposed method obtains the parameter
u via actual temperature T by Equation (9), then irradiance level G is calculated by Equation (7). Lastly,
Ro, irradiance level G, parameter
u, and D are calculated using Equation (17). If the proposed PVM-QR MPPT algorithm sensors
Io ≤ 0, then D = 0.
Figure 6 shows the proposed PVM-QR MPPT algorithm block, where
Voc represents the open-circuit voltage of PVM;
Vpvm represents the PVM output voltage;
Ipvm represents the PVM output current;
Vo represents the power converter output voltage;
Io represents the power converter output current;
a4 and
b4 are the Equation (9) parameters;
a5 is the Equation (10) parameter;
c1,
d1,
e1, and,
f are the Equation (11) parameters;
u is the Equation (7) parameter;
Ro represents load; G represents the irradiance level; T represents temperature; and D represents the duty cycle of Equation (17). If the proposed PVM-QR MPPT algorithm sensors
Io > 0, then the MPPT duty cycle is calculated by Equation (17). However, if the proposed PVM-QR MPPT algorithm sensors
Io ≤ 0, then D = 0.
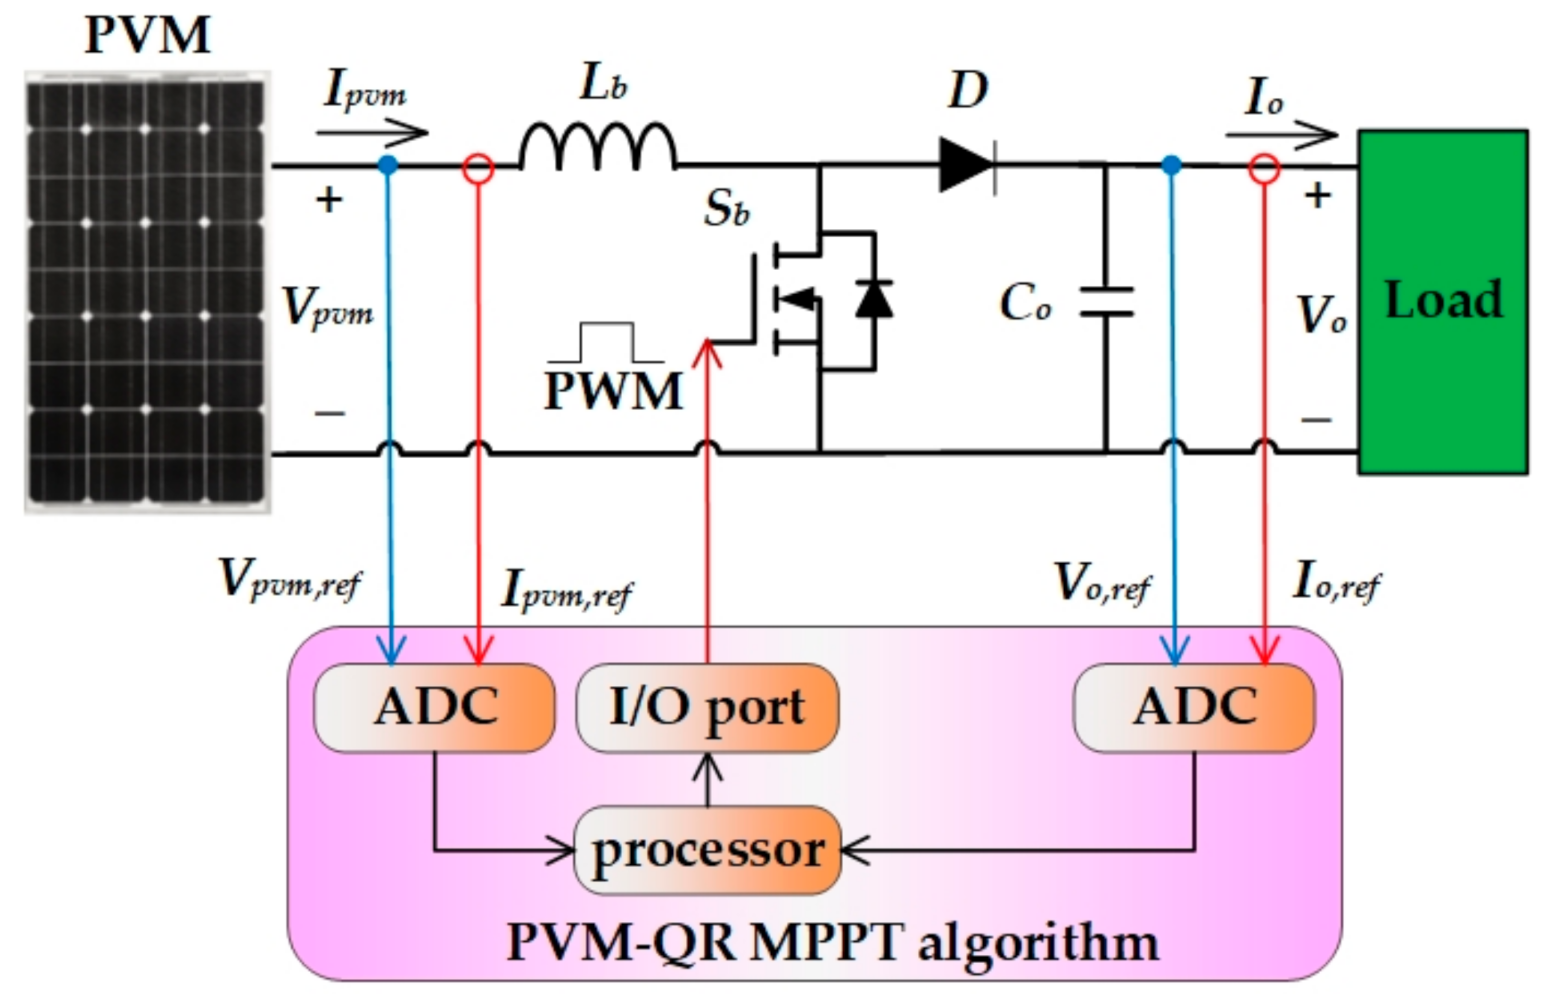
Figure 7 demonstrates the PVM connected to the power converter combined with the proposed PVM-QR MPPT controller schematic diagram. In this study, the power converter is the boost converter [
33,
34]. The PVM is a PVM simulator Chroma (Model Number: 62100H-600S), where irradiance level G and temperature T are 1 kW/m
2 and 25 °C, respectively,
Voc = 41.8 V,
Isc = 5.05 A,
VMPP = 34.5 V,
IMPP = 4.35 A, and
PMPP = 150 W. The boost converter includes an inductor
Lb and a capacitor
Co of 0.8 mH and 450 μF, respectively. The converter also includes diodes
D and a power MOSFET
Sb. In this circuit,
Vpvm,
Ipvm,
Vo, and
Io signals are sent to the MPPT controller, namely the microcontroller unit MCU (Microchip, 18F452). The MCU outputs the PWM signal (frequency = 40 kHz), controls the boost converter power MOSFET
Sb, searches the MPP, and then catches the MPP.
4. Experimental Results
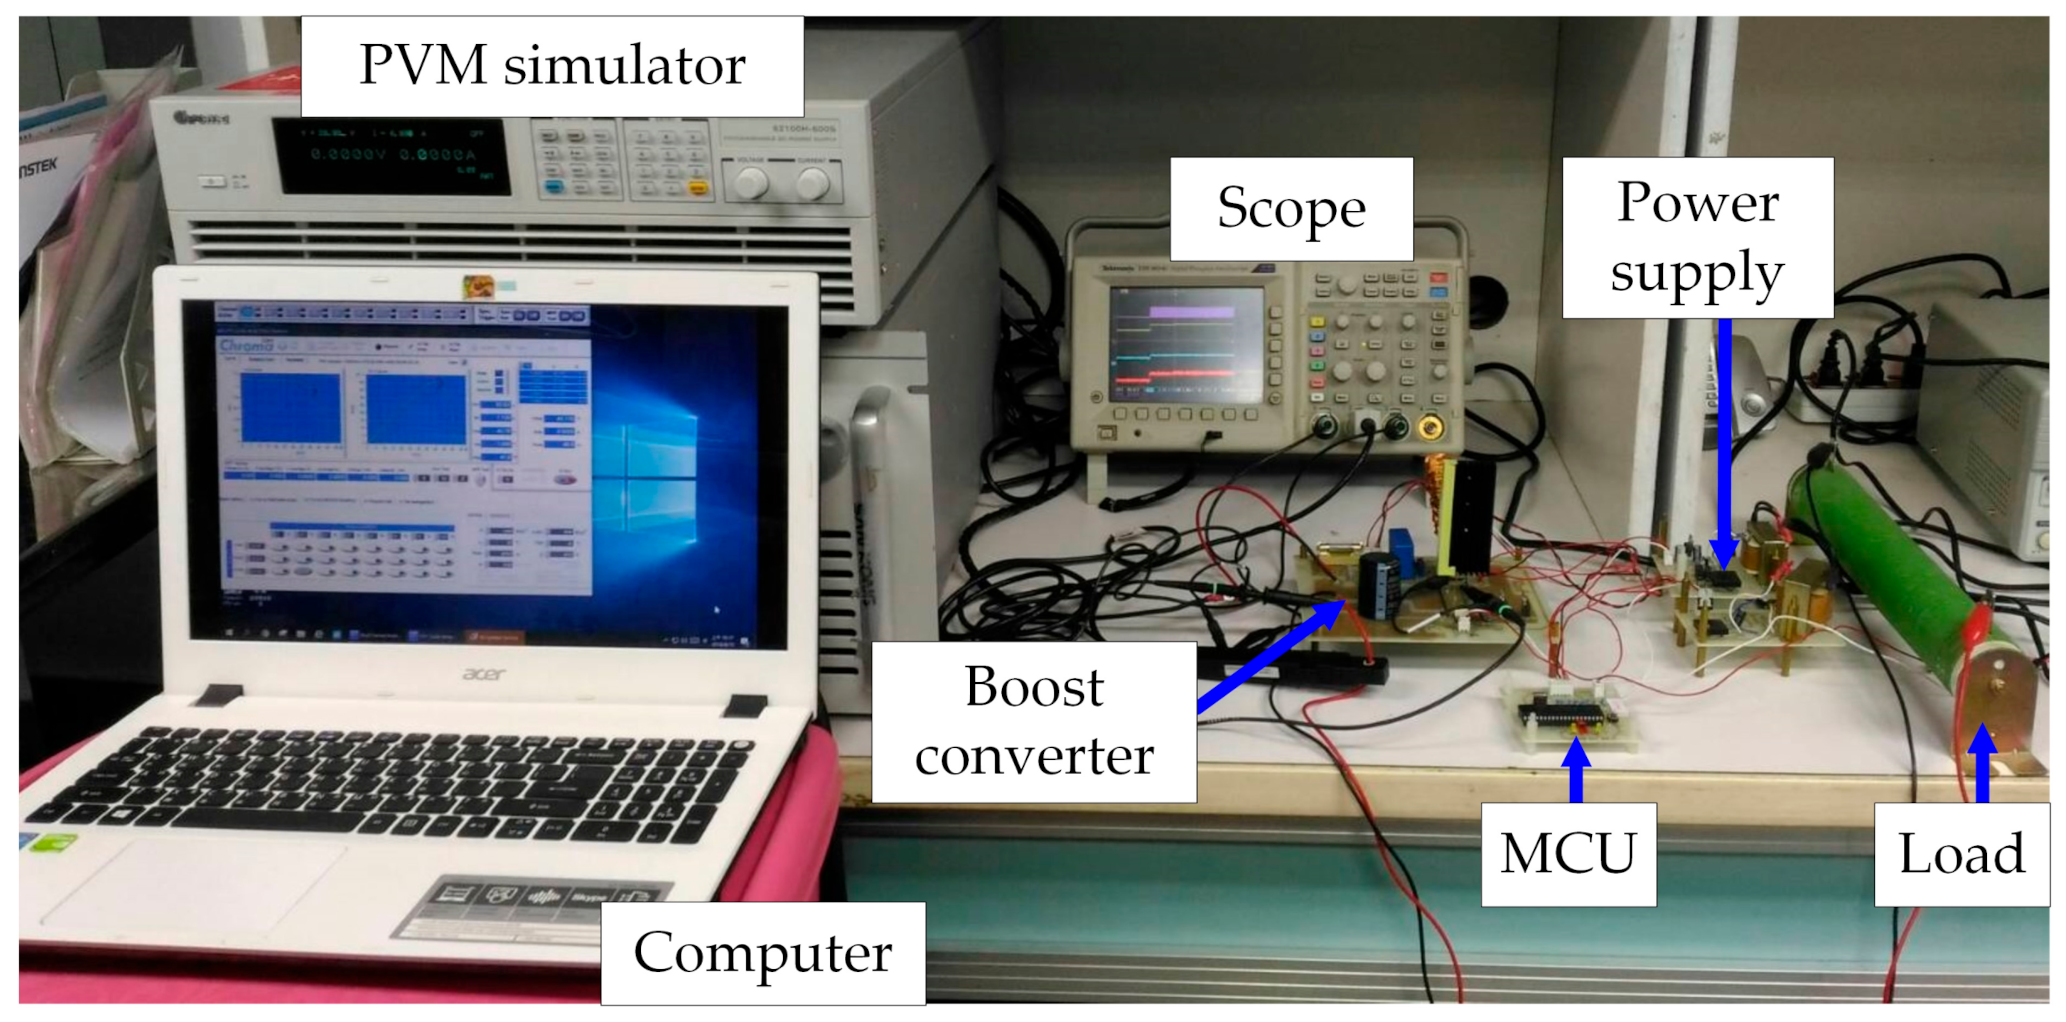
Figure 8 presents the experimental PVM and the proposed PVM-QR MPPT algorithm prototype test setup. The PVM simulator (Chroma, Model Number: 62100H-600S) was set according to specifications, where irradiance level G and temperature T are 1 kW/m
2 and 25 °C, respectively, PVM
Voc = 41.8 V,
Isc = 5.05 A,
VMPP = 34.5 V,
IMPP = 4.35 A, and
PMPP = 150 W. In the experiment, the PVM was connected to the power converter, which was then connected to the load. The MCU executed the MPPT algorithm, outputted a PWM signal of the power converter to perform the MPPT, and reached the MPP.
The MPPT efficiency of the proposed PVM-QR and HC algorithms was checked experimentally under UIC that irradiance levels are 0.55 kW/m
2 and 0.2 W/m
2. These test results showed that the efficiency of the proposed PVM-QR algorithm performed better than that of the HC algorithm, as shown in
Figure 9 and
Figure 10.
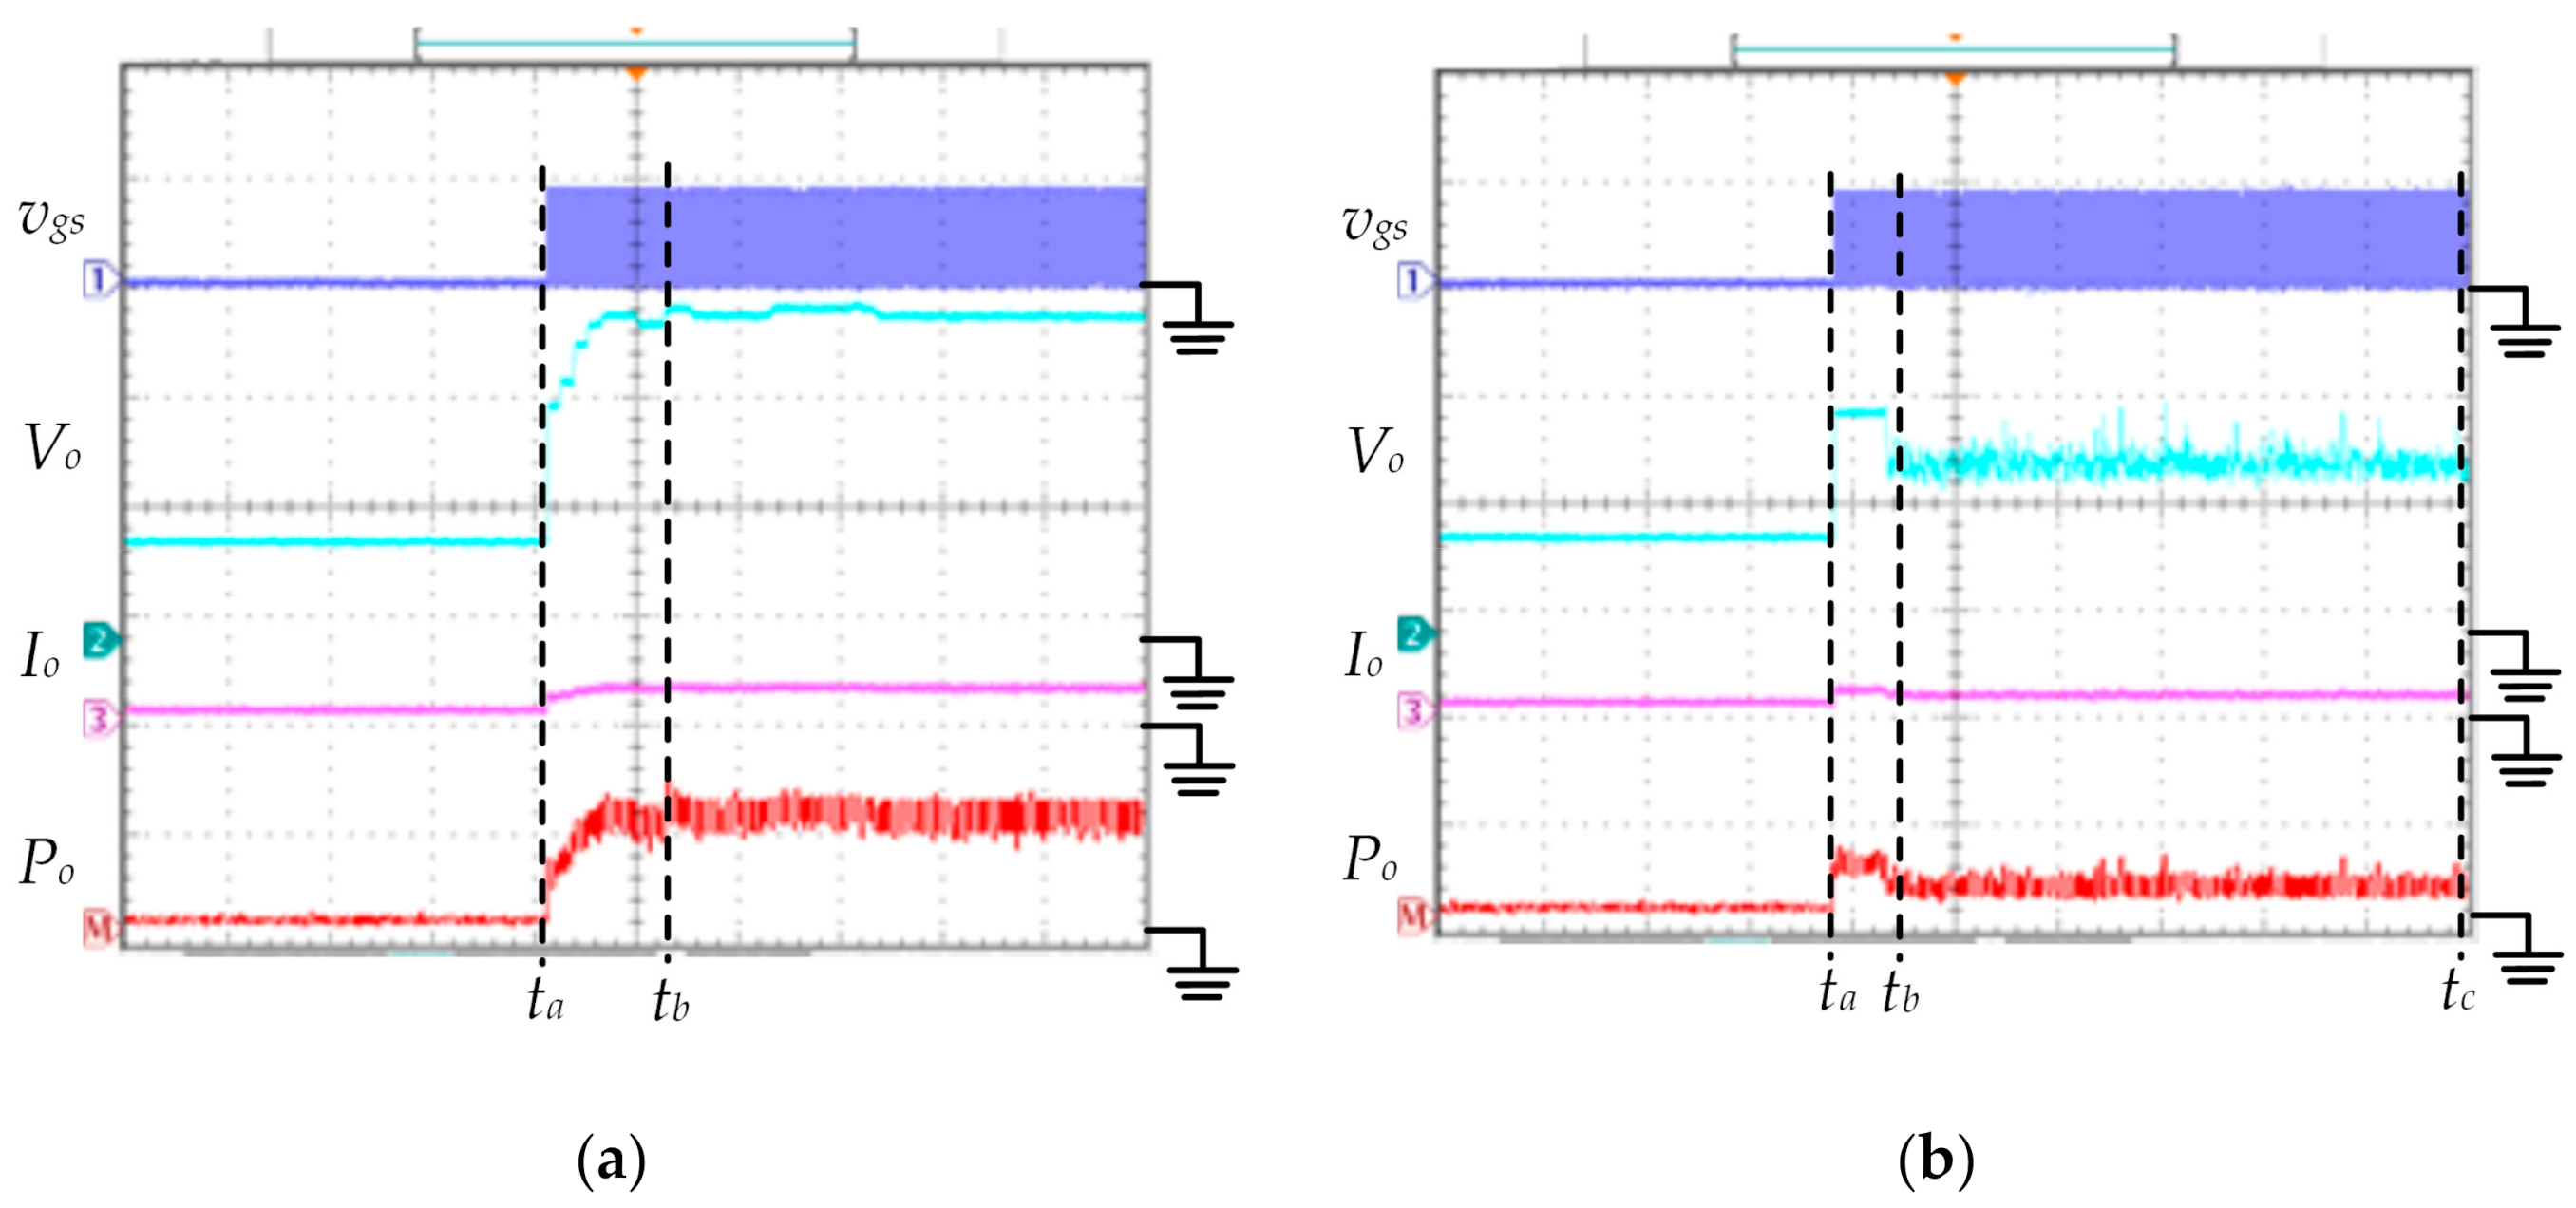
Figure 9 illustrates this proposed PVM-QR MPPT and the HC algorithms test results when irradiance level G = 0.55 kW/m
2 and temperature T = 10 °C.
Figure 9a demonstrates the testing results of the proposed algorithm, where the MCU measured the PVM
Voc = 43 V,
Rpvm = 17 Ω, and
Ro = 20 Ω. When time =
ta, the proposed algorithm MPPT starts. First, the proposed algorithm calculates temperature T ≈ 10 °C according to Equation (13) and then obtains the parameter
u = 9200 according to Equation (9). Second, it calculates irradiance level G ≌ 0.55 kW/m
2 using Equation (7). Finally, it calculates D = 0.08 using Equation (17). The proposed algorithm reaches the MPP (
VMPP = 36.6 V) and then calculates
Vo = 39.7 V according to Equation (14) (as shown in
Figure 9a), where the measured results of
Io = 1.96 A, and
Po = 78 W. Thus, the proposed algorithm can be accurately and stably controlled at the MPP (as in
Table 5).
Figure 9b displays the HC algorithm test results. When time =
ta, the HC algorithm MPPT can function. However, in the HC algorithm, from time
tb to
tc, the
Vo and
Po waveforms have shock situations for 3.5 s, which is due to the disturbance characteristics of the HC algorithm tracking the MPP. Thereby, the HC algorithm had a reduced system efficiency
Po = 65 W. The test results show this proposed PVM-QR MPPT algorithm efficiency of MPPT performs better than the HC algorithm (as shown in
Table 5).
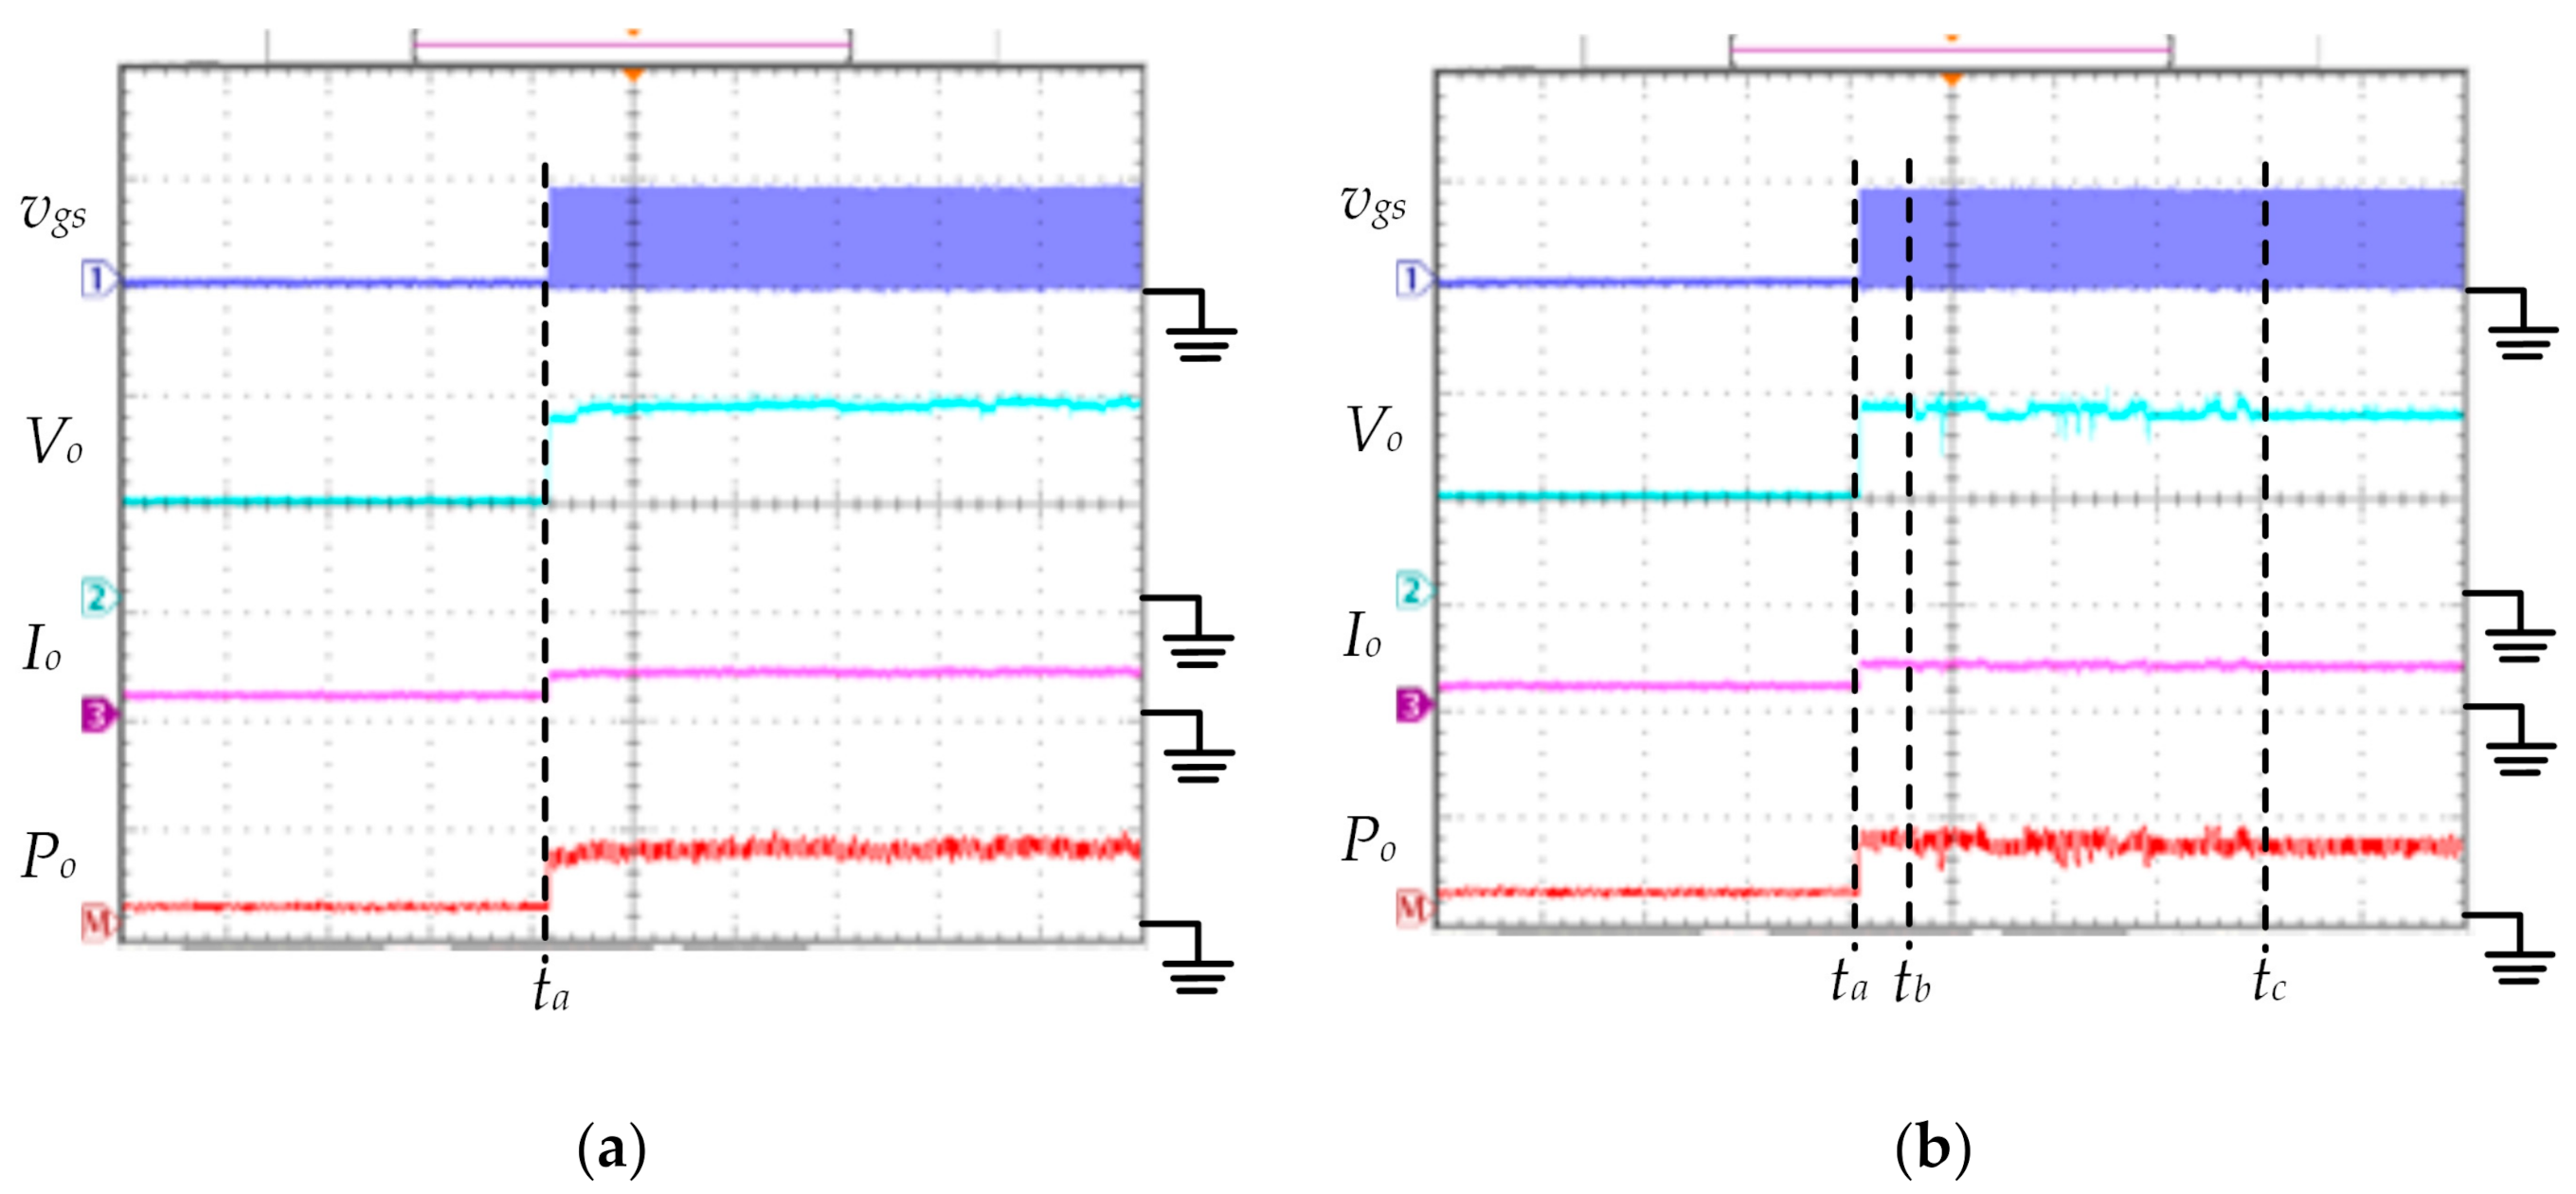
Figure 10 displays the proposed PVM-QR and the HC algorithms test results when irradiance level G = 0.2 kW/m
2 and temperature T = 60 °C.
Figure 10a displays the results of the proposed PVM-QR MPPT algorithm. When time =
ta, the proposed algorithm MPPT works. From time
ta to
tb, the proposed algorithm takes 1 s to track the MPP because the MPP is difficult to be tracked under low irradiance level conditions. The MCU then gathers the parameters PVM
Voc = 33.8 V,
Rpvm = 32 Ω, and
Ro = 40 Ω. First, the proposed algorithm calculates temperature T ≈ 60 °C according to Equation (13) and then obtains the parameter
u = 7000 according to Equation (9). Second, it calculates irradiance level G ≌ 0.2 kW/m
2 using Equation (7). Finally, it calculates D = 0.06 using Equation (17). Finally, the proposed algorithm reaches the MPP (
VMPP = 28.5 V) and then calculates
Vo = 30 V according to Equation (14) (as shown in
Figure 10a), where the measured results of
Io = 0.75 A, and
Po = 22.5 W. Similarly, the proposed algorithm can be accurately and stably operated at the MPP (as shown in
Table 5).
Figure 10b demonstrates the testing results of the HC algorithm. At time =
ta, the HC algorithm MPPT starts to function. However, in the HC algorithm, from time
tb to
tc for 5.5 s, the MPPT shows divergence. The HC algorithm has not only a disturbance characteristics problem but also a low MPPT efficiency in a low irradiance level environment. Similarly, the testing results show this proposed PVM-QR MPPT algorithm efficiency of MPPT performs better than that of the HC algorithm (as shown in
Table 5).
The MPPT efficiency of the proposed PVM-QR and HC algorithms was checked experimentally under PSC that irradiance level G is 1 kW/m
2 and temperature T = 25 °C.
Figure 11 displays the diagram of the PVM’s solar cell array for shadow simulation through a single PVM simulator soft in this study. The single PVM parameters are as shown in
Table 1, and the combination of the PVM’s solar cell array is 4 × 4. In this test, under PSC that irradiance level G = 1 kW/m
2, temperature T = 25 °C, and four solar cells in the PVM were shaded, represented by the black square (as shown in
Figure 11). Then, PVM
VMPP = 17.5 V,
IMPP = 4.68 A, and
PMPP = 82 W were measured. These test results of the proposed PVM-QR algorithm showed that the efficiency of MPPT performs better than that of the HC algorithm, as shown in
Figure 12.
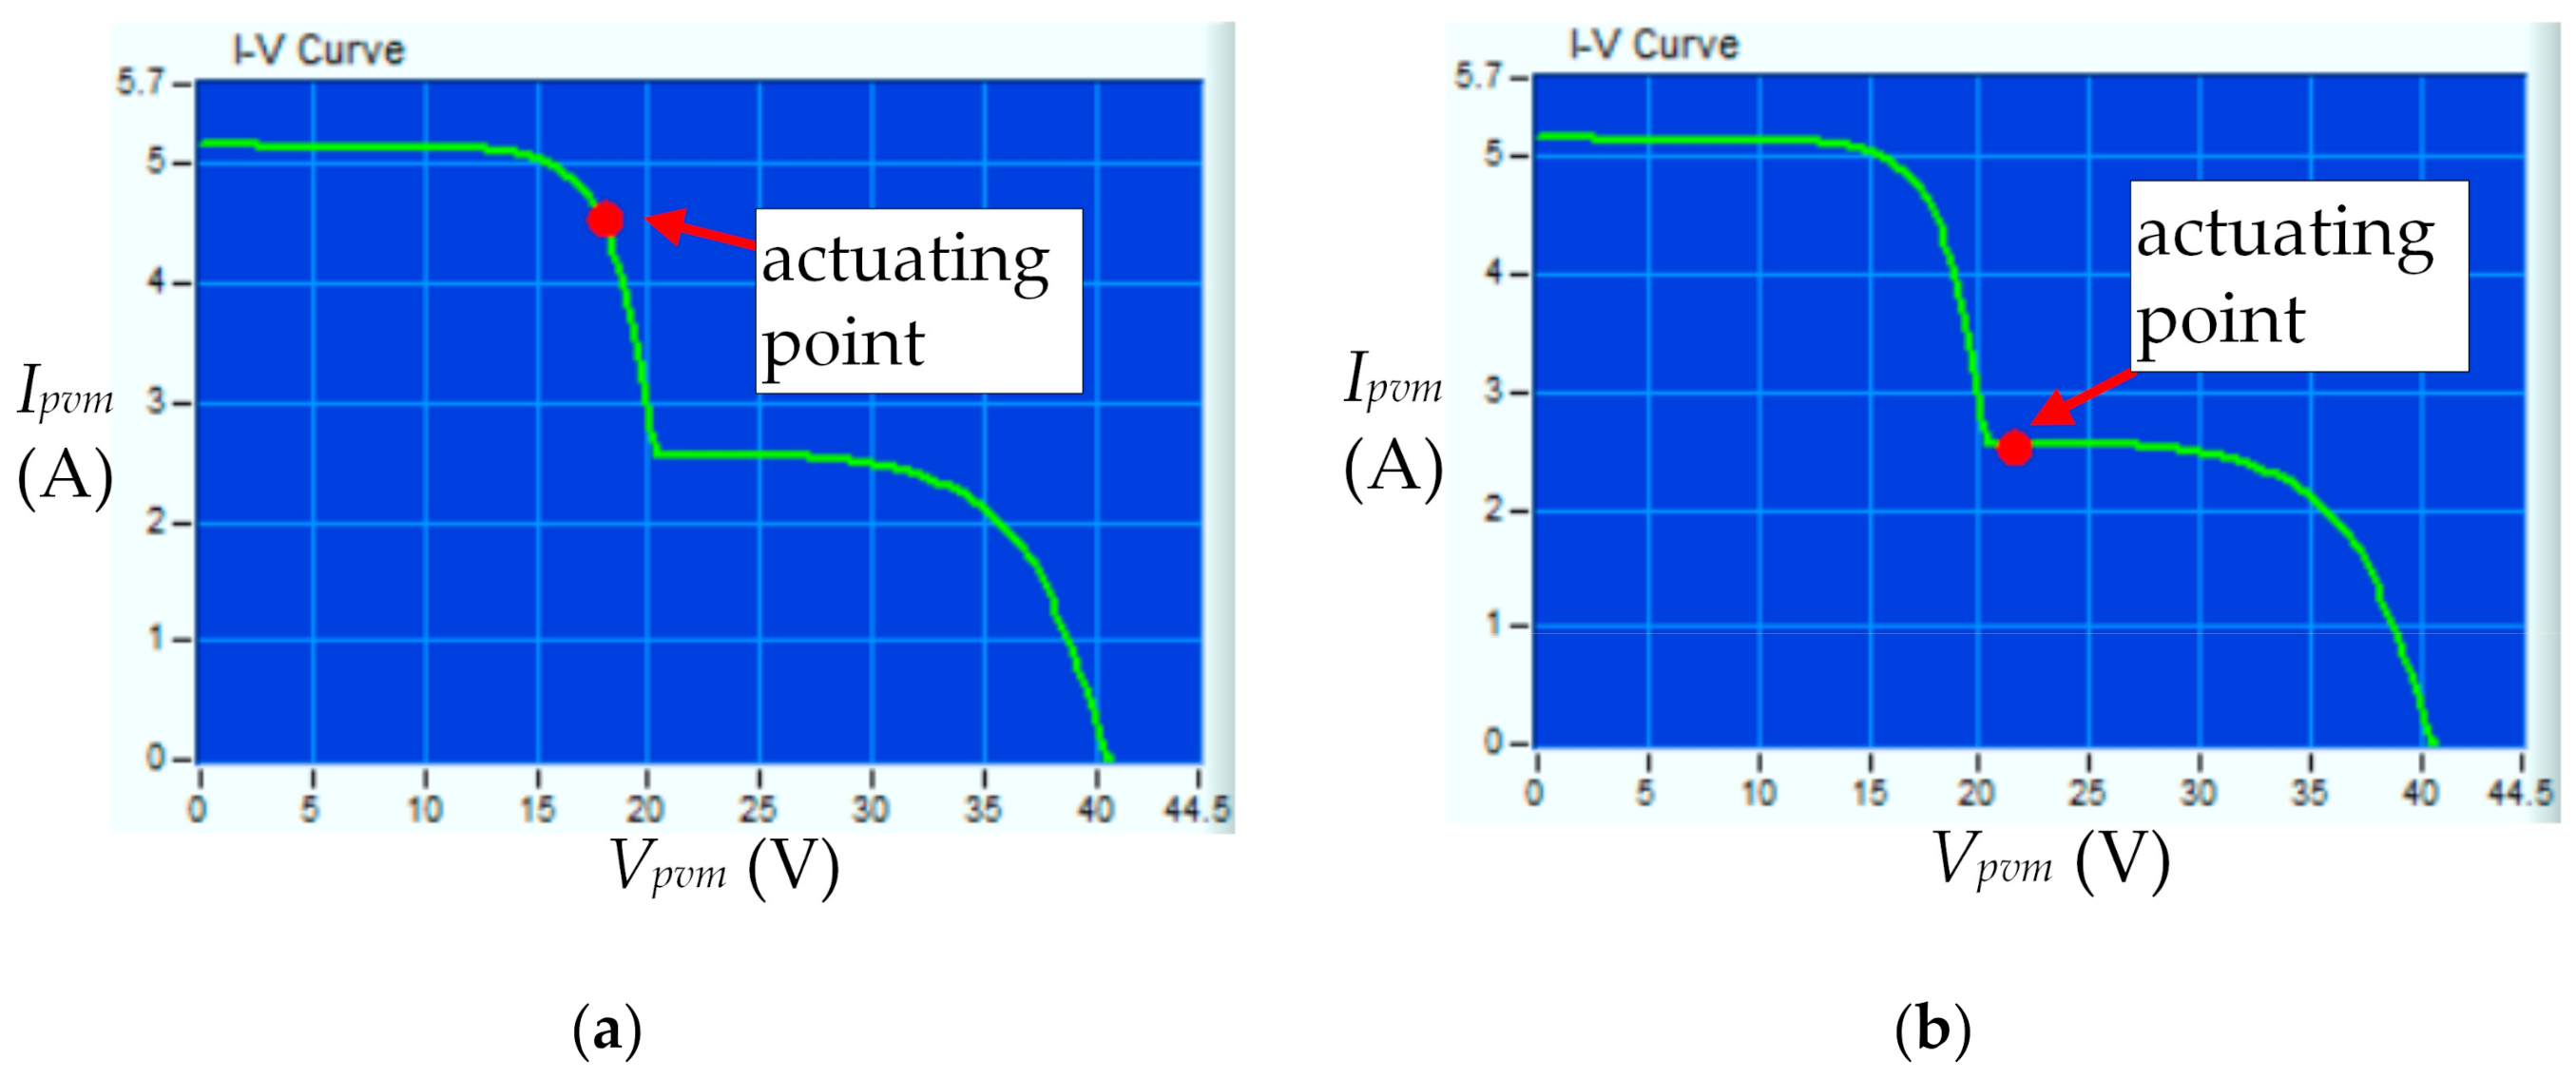
Figure 12 shows the proposed PVM-QR and the HC algorithms test results when irradiance level G = 1 kW/m
2 and temperature T = 25 °C.
Figure 12a displays the results of the proposed PVM-QR MPPT algorithm. The parameters PVM
Voc = 41.8 V,
Rpvm = 3.9 Ω, and
Ro = 20 Ω. First, the proposed algorithm calculates temperature T ≈ 25 °C according to Equation (13) and then obtains the parameter
u = 8480 according to Equation (9). Second, it calculates irradiance level G ≌ 1 kW/m
2 using Equation (7). Finally, it calculates D = 0.34 using Equation (17). The proposed algorithm reaches the MPP, where
VMPP = 17.85 V,
IMPP = 4.55 A, and
PMPP = 81.5 W (as shown in
Table 6). Similarly, the proposed algorithm can be accurately and stably operated at the MPP under UIC and PSC. This is because the equations of the proposed PVM-QR algorithm consider many key factor parameters, such as irradiance level G, parameter
u and load factors.
Figure 12b shows the testing results of the HC algorithm. The HC algorithm performs the MPPT under PSC, and it cannot easily capture the MPP. It is mainly because this algorithm only uses two power points for comparison, the actuating point has vibration problems and is difficult to escape near the local MPP, resulting in low performance of the system. The PVM output power is only 54.5 W, and the MPPT efficiency is only 66% when the HC algorithm completes the MPPT. Similarly, the testing results show the MPPT efficiency of this proposed PVM-QR MPPT algorithm is higher than HC algorithm (as shown in
Table 6).
According to Reference [
10], which presents the properties of the HC algorithm, further comparison with the proposed algorithm is shown in
Table 7. The proposed algorithm’s MPPT speed under UIC is higher than the HC algorithm. The proposed algorithm’s MPPT efficiency under PSC is better than the HC algorithm.
In summary, from the results shown in
Table 5,
Table 6 and
Table 7, it can be seen that the proposed algorithm performs better than the HC algorithm. The proposed algorithm improves the HC algorithm problems whereby the actuating point will vibrate near the MPP; the convergence speed is slow; the MPPT of the HC algorithm is difficult under low irradiance level conditions, and under PSC, the actuating point vibrates near the local MPP instead of escaping, which causes low system performance. Under UIC and PSC, the proposed PVM-QR algorithm MPPT efficiency both reaches 99%, which can greatly improve system performance.
5. Conclusions
The algorithm proposed in this study analyzed the relationship between the PVM Voc, Vpvm, Ipvm, Rpvm, temperature, and irradiance level. The temperature and irradiance level obtained from the equation can facilitate the judgment of the PVM temperature and irradiance level environments. The proposed PVM-QR MPPT algorithm can calculate the MPPT duty cycle parameter, which includes irradiance level, load, key factor parameter u, and the duty cycle of the MPPT, to capture the MPP more accurately, quickly, and stably. In addition, when Io = 0 and the MPPT duty cycle is 0, the proposed algorithm can avoid unnecessary MCU operations, which may cause system burdens. The advantages of the proposed PVM-QR MPPT algorithm include the actuating point does not oscillate; the convergence is fast, and it can track the MPP in time under irradiance level rapid change, low irradiance level, and PSC conditions.
The proposed PVM-QR MPPT algorithm considers the change in the irradiance level and load. Therefore, when the irradiance level and load are changed, the proposed algorithm can accurately capture the MPP. Additionally, the proposed circuit architecture is low cost, without the need for additional temperature and irradiance level detection devices. In the actual measurement, the proposed PVM-QR MPPT algorithm efficiency can reach 99% under the UIC that irradiance level is 0.55 kW/m2 and 0.2 kW/m2. In comparison, under UIC, this HC algorithm only has 95% efficiency when the irradiance level is 0.55 kW/m2. When the irradiance level is 0.2 kW/m2, the MPPT of the HC algorithm diverges and cannot capture the MPP. Under PSC, the proposed PVM-QR MPPT algorithm efficiency can reach 99%, while the HC algorithm efficiency is only 66%. Thus, the proposed PVM-QR MPPT algorithm greatly improves the efficiency of the HC algorithm. The contribution of this study is that the system uses a simple circuit design with the proposed PVM-QR MPPT algorithm, which is particularly suitable for UIC and PSC, to greatly promote the system performance and reduce the design cost.
In future works, the efficiency of the proposed PVM-QR algorithm on sunny days and under severe conditions, such as rainy and snowy climates, can be assessed. Moreover, the PVM can be installed on mobile devices, such as robots, vehicles, etc. The proposed algorithm can be used in collocation with different types of power converters for different loads. Lastly, the proposed algorithm can be combined with the bionic MPPT algorithm and integrated into a hybrid algorithm, further enhancing the advantages of each method and greatly improving the efficiency of the SPG systems.


