Article

Evaluation of Energy Performance and Thermal Comfort Considering the Heat Storage Capacity and Thermal Conductivity of Biocomposite Phase Change Materials

1
Department of Architectural Engineering, Soongsil University, Seoul 06978, Korea
2
Department of Urban and Architectural Environment Design, Passive House Institute Korea, Seoul 05520, Korea
*
Author to whom correspondence should be addressed.
Processes 2021, 9(12), 2191; https://doi.org/10.3390/pr9122191
Submission received: 29 October 2021 / Revised: 20 November 2021 / Accepted: 2 December 2021 / Published: 5 December 2021

Abstract

:
The application of phase change materials (PCMs) has been verified as an effective strategy for improving energy efficiency and reducing greenhouse gas emissions. Biocomposite PCMs (Bc-PCM) exhibit large latent heat, chemical stability, and a wide temperature range. In this study, thermal conductivity improved Bc-PCM (TBc-PCM) was made via vacuum impregnation with graphene nanoplatelets (GNPs). Chemical stability analysis and thermal performance analyses of the Bc-PCM and TBc-PCM were carried out as well as building energy simulations and thermal comfort analyses. Our results show Bc-PCM showed a higher heat storage capacity and enthalpy value compared to TBc-PCM. TBc-PCM exhibited a 378% increase in thermal conductivity compared to Bc-PCM. Building energy simulation results revealed that annual heating and cooling energy consumption decreased as the thickness of the PCM layer increased. In addition, the Bc-PCM with a larger PCM capacity was more effective in reducing energy consumption during the heating period. On the other hand, the cooling energy reduction effect was greater when TBc-PCM with high thermal conductivity was applied because of the high heat transfer during the cooling period. Thermal comfort evaluation revealed it was more comfortable when PCM was applied.

1. Introduction

The building sector contributes 30% of total primary energy consumption [1,2,3]. Thus, effective and sustainable ways to enhance thermal comfort conditions and energy efficiency in buildings are required [4,5]. The need to improve the energy efficiency of the built environment has led to the development of various technologies for conservation of energy and better usage for heating and cooling [6]. Thermal energy storage (TES) is a useful technique for improving energy savings and energy efficiency [7,8]. TES in a building can be implemented through sensible energy storage and latent thermal energy storage. Applying sensible heat energy storage materials, such as concrete, increases the volume and construction costs of the building. However, latent heat storage materials have a high storage density at small temperature intervals [9,10]. In this respect, the application of phase change materials (PCMs) in building envelope components has been verified as an effective strategy for building energy efficiency improvement [11] and greenhouse gas emission reduction [5,12]. PCM can absorb and release large amounts of latent heat by changing its phase as the temperature increases or decreases. The latent heat storage capacity of PCM plays an important role in resolving energy imbalance, improving energy efficiency, and protecting the environment [13,14]. PCMs can be classified as organic, inorganic, or eutectic. Organic PCMs such as paraffinic series are reliable, inexpensive, safe, non-corrosive, and chemically stable [15]. However, inorganic PCMs have high latent heat, but they are highly prone to phase segregation and super-cooling. Therefore, organic PCMs are mainly used in latent heat storage systems because they have good compatibility with other materials, no super-cooling, and high heat of fusion, and can be used over a wide temperature range [16,17]. Biocomposite PCMs (Bc-PCM) are organic waste product from the food manufacturing process, that is performed to remove the acidic fatty esters. Additionally, Bc-PCMs are highly appreciated given the fact that they are non-toxic, renewable, non-expensive and accessible [18,19]. These Bc-PCMs are encased in a sheet of plastic material and used to stabilize room temperature when installed behind drywall on walls or ceilings. They show huge latent heat, chemical stability, and a wide temperature range from −23–78 °C [15,20]. However, Bc-PCMs have a characteristic of low thermal conductivity, which severely reduces the rate of heat storage and extraction during the phase change cycles. Carbon materials can be effective enhancements to improve their low thermal conductivity [21]. In this regard, many studies have been carried out to solve the low thermal conductivity of Bc-PCMs by applying carbon materials. Wen et al. [22] prepared and studied the thermal properties of a form-stable composite (capric + lauric acid/diatomite). To increase the thermal conductivity, they further added expanded graphite (EG) to the composite. As a result, the thermal conductivity of the composite increased gradually by 39.7%, 61.6%, 77.6%, and 114.2% for EG fractions of 3%, 5%, 7%, and 10%, respectively. Wan et al. [23] manufactured a form-stable PCM using pinecone biochar as a supporting matrix for palmitic acid. In their study, the composite with a mass ratio of 6 (palmitic acid): 4 (pinecone biochar) showed the highest stability. The thermal conductivity of the manufactured composite material increased by 43.76% compared to that of pure palmitic acid. Wu et al. [24] synthesized different parameters of stearic acid (SA)/EG form-stable composite PCMs, in which liquid SA was adsorbed into EG additives with various contents. When the EG content was less than 25 wt%, the thermal conductivity of the EG/SA composite PCM increased as the EG content increased. However, when the EG content exceeded the optimum value of 25 wt%, the thermal conductivity of the EG/SA composite PCM gradually decreased. Amin et al. [25] analyzed the thermal properties of the beeswax/graphene composite PCMs. Consequently, the thermal conductivity of composite PCMs increased when the mass fraction of graphene nanosheets increased from 0.05% to 0.3%. The thermal conductivity of the composite PCMs reached 2.89 W/mK at a temperature of 40 °C and a graphene concentration of 0.3%. In this study, we aim to make a thermal conductivity improved Bc-PCM (TBc-PCM) via a vacuum impregnation process with graphene nanoplatelets (GNPs). TBc-PCM has a lower heat storage capacity compared to Bc-PCM, but has high thermal conductivity. Bc-PCM and TBc-PCM show different characteristics in terms of heat storage capacity and thermal conductivity, which may have different effects on energy reduction performance and thermal comfort when applied to buildings. Therefore, this study applied the heat storage sheet containing these two PCMs to the wall and analyzed the effect on the building energy reduction performance and thermal comfort. To confirm the chemical and thermal characteristics of the Bc-PCM and TBc-PCM, Fourier transform infrared spectroscopy (FTIR), differential scanning calorimetry (DSC), thermogravimetric analysis (TGA) and TCi analysis will be performed. We will then analyze the heating and cooling energy reductions in wooden houses using Bc-PCM and TBc-PCM through energy simulation analysis. Additionally, we will evaluate the effect of employing a PCM layer on indoor thermal comfort using Fanger’s comfort model.

2. Materials and Methods

2.1. Materials and Preparation

In this study, Bc-PCM with a latent heat capacity of 148.9 J/g and melting temperature of 29.33 °C was used, and it was provided by the Korea C&S Corporation in South Korea. GNPs for TBc-PCM preparation was provided from Asbury Graphite Mills (Bloomsbury, NJ, USA). TBc-PCM was prepared by vacuum impregnation [26,27,28]. The porous GNPs was prepared on a stainless-steel tray and dried in a vacuum oven for 2 h at 80 °C to evacuate air from the porous GNPs. Then, the porous GNPs in the tray was placed in the melted Bc-PCM until it was sufficiently submerged. The GNPs and Bc-PCM mixtures were impregnated in a vacuum oven for 2 h at 80 °C. After the impregnation process, the composite of the colloidal state was filtered through a 1 μm filter paper that was connected to a vacuum state flask to remove any over-saturated Bc-PCM from the surface of the composite. After the filtration process, the composite was dried in a vacuum oven for 24 h at 80 °C to remove remaining Bc-PCM on the surface.

2.2. Characterization Techniques

To confirm the chemical characteristic of the Bc-PCM and TBc-PCM, FTIR (FTIR: 300E Jasco) analysis was performed to observe the change of chemical groups upon curing. The samples were analyzed over the range of 650–4000 cm−1. The thermal properties of Bc-PCM and TBc-PCM, such as phase change temperature range and latent heat capacity, were measured using a differential scanning calorimeter (DSC: Q 1000). DSC measurements were carried out at heating and cooling rates of 5 °C/min, with the temperature ranging from 0–80 °C. The latent heat capacities of the Bc-PCM and TBc-PCM were determined by numerical integration of the area under the peak representing the solid–liquid phase changes [29]. Then, TGA analysis was carried out using a TGA instrument (TA Instruments, TGA Q 5000) on (2–4) mg samples within a temperature range of 30–600 °C. The thermal conductivities of the samples were analyzed using a TCi thermal conductivity analyzer (C-Therm Technologies Ltd., Fredericton, NB, Canada), a device that can measure the thermal conductivity of small samples using the modified transient plane source (MTPS) method [30].

2.3. Building Energy Simulation Modeling

In this study, DesignBuilder software, which provides a 3D comprehensive interface based on EnergyPlus, was used for the building energy simulation. EnergyPlus can simulate indoor thermal comfort and building energy consumption [31] and uses a conductive finite difference (CondFD) solution algorithm that discretizes the building envelope into different nodes to calculate heat storage properties. DesignBuilder software uses a completely implicit scheme for a homogeneous material with uniform node spacing, as shown in Equation (1).
C p ρ Δ x T i j + 1 T i j Δ t = ( k E ( T i 1 j + 1 T i j + 1 ) Δ x + k I ( T i + 1 j + 1 T i j + 1 ) Δ x )
where C p is the specific heat capacity (J/kgK), ρ is the density (kg/m3), Δ x is the thickness of the finite difference layer (m), T is the node temperature (°C), i is the node being modeled, j is previous time step, i − 1 is adjacent node to exterior of construction, i + 1 is the node adjacent to the interior of construction, j + 1 is the new time step, k E (W/mK) is the thermal conductivity of an exterior for the interface between node i and node i − 1, and k I (W/mK) is the thermal conductivity of an interior for the interface between node i and node i + 1. To calculate the thermal conductivity, the value of an exterior, k E (W/mK), for interface between i node and i − 1 node was calculated by Equation (2). The value of an interior, k I (W/mK), for interface between i node and i + 1 node was calculated by Equation (3).
k E = ( k i 1 j + 1 + k i j + 1 ) 2
k I = ( k i + 1 j + 1 + k i j + 1 ) 2
Then, this model by Equation (1) is accompanied by Equation (4) with respect to enthalpy and temperature as follows:
H i = F h t ( T i )
where H i is the node enthalpy (J/kg), and F h t is the enthalpy-temperature function.
In the ConFD algorithm, Equation (5) controls how the component is automatically discretized or divided based on the spatial discretization constant C s , the material’s thermal diffusivity,   D t (m2/s), and the time step Δ t . A default value of 3 for the spatial discretization constant is the inverse of the Fourier Number F i .
x = C s D t Δ t = D t Δ t F i
In this study, a wooden house established by the Korea Rural Community Corporation to construct a standard residential house was considered as a building model for energy simulation. The standard wooden house was 6.0 m × 6.9 m × 3.9 m, and this house has a ceiling height of 2.4 m and a total floor area of 41.92 m2. To account for real-world activity, the occupancy, equipment, and lighting schedules were set to run from 18 pm to 8 am on weekdays and all day on weekends. In the simulation, the internal heat gain of the equipment was set to 3.00 W/m2, and the illumination intensity was set to 100 lx. Heating, ventilation and air conditioning (HVAC) conditions were set to simple HVAC to minimize space heating and cooling loads, and heating and cooling setpoints were set to 20 °C and 26 °C, respectively. The simulation period was considered to be one year, and the heating and cooling setback temperatures were set at 18 °C and 28 °C according to the standards of the Ministry of Education. Korea’s Trade, Industry, and Energy (MOTIE) [32]. In this study, weather data of Chicago, Los Angeles, Miami, and Phoenix in the United States were considered to analyze how energy consumption changes when applied to different climates. Table 1 summarizes the geographical information, average temperature, humidity, wind speed, and Köppen climate classification of four cities (Dfa: hot-summer humid continental climate, Csb: warm-summer Mediterranean climate, Aw: tropical savanna climate with dry-winter characteristics, BWh: arid climate-hot desert). Bc-PCM and TBc-PCM were placed in a sheet of plastic material, which had a thickness of 10, 20 and 30 mm, and was applied between the insulation and the gypsum plaster board. Table 2 shows the construction and material properties of the modeled exterior wall, partition, and roof. Table 3 shows the material properties derived from the DSC, TCi analysis and density measurement of Bc-PCM and TBc-PCM.
Thermal comfort analysis through the predicted mean vote (PMV) index was calculated in DesignBuilder software. We analyzed and predicted PMV index using DesignBuilder, based on the building performance simulation software EnergyPlus. EnergyPlus provides a sophisticated building thermal analysis tool that allows the determination of whether the environmental control strategy will be sufficient for the occupants to be thermally comfortable. The commercial software DesignBuilder was used to estimate thermal comfort, considering the use of all possible sources and internal gains in the modeling and simulation of buildings. Fanger developed a heat balance equation and an index called PMV based on the average temperature comfortable for a person’s skin, the optimal rate of perspiration, and the human heat balance. This index shows the thermal sensation index produced by a combination of environmental parameters [33]. The PMV index is included in the ISO (International Organization for Standardization) standard 7730 [34], and it indicates 10% dissatisfaction as the boundary for a comfortable environment. A PMV of −0.5 to +0.5, was recommended to meet this requirement [35]. Fanger’s PMV index is a mathematical model that includes the quantitative combined effects of air temperature, air velocity, clothing thermal resistance, mean radiant temperature, and humidity activity level [36]. Fanger suggested that only four physical variables (air temperature, relative humidity, average radiant temperature, and air velocity) and two personal variables (clothing and activity) significantly affect thermal comfort. Fanger’s PMV formula is [37]:
PMV = ( 0.303 e 0.036 M + 0.028 ) × { ( M W ) 3.05 × 10 3 × [ 5733 6.99 ( M W ) P W ] 0.42 × [ ( M W ) 58.15 ] 1.7 × 10 5 × ( 5867 P W ) 0.0014 M ( 34 T a i r ) 3.96 × 10 8 × f c l o × [ ( T c l o + 273 ) 4 ( T m r + 273 ) 4 ] f c l o × h c × ( T c l o T a i r ) }
T c l o = 35.7 0.028 × ( M W ) I c l o × { 3.96 × 10 8 × f c l o × [ ( T c l o + 273 ) 4 ( T m r + 273 ) 4 ] f c l o × h c × ( T c l o T a i r ) }
h c = { 2.38 × | T c l o T a i r | 0.25   f o r   2.38 × | T c l o T a i r | 0.25 > 12.1 × v a i r 12.1 × v a i r   f o r   2.38 × | T c l o T a i r | 0.25 < 12.1 × v a i r }
f c l o = { 1.00 + 1.290 I c l o   f o r   I c l o < 0.078   m 2 K / W 1.05 + 0.645 I c l o   f o r   I c l o > 0.078   m 2 K / W }
where M is the metabolic rate (W/m2), W is the effective mechanical power (W/m2), P W is the water vapor partial pressure (Pa), T a i r is the air temperature (°C), f c l o is the clothing surface area factor (m2∙K/W), T c l o is the clothing surface temperature (°C), T m r is the mean radiant temperature (°C), h c is the convective heat transfer coefficient (W/m2∙K), I c l o is the clothing insulation (m2∙K/W), and v a i r is the relative air velocity (m/s). Note that the one metabolic unit (1 met) is 58.2 W/m2 and the one clothing unit (1 clo) is 0.155 m2∙K/W. The PMV is calculated based on equation in the design builder, a person with clothing values ( I c l o ) of 0.5 clo for summer and 1.0 clo for winter and metabolic rate of 130 W/m2 was considered in this study. Figure 1 shows schematic diagram of this research.

3. Results

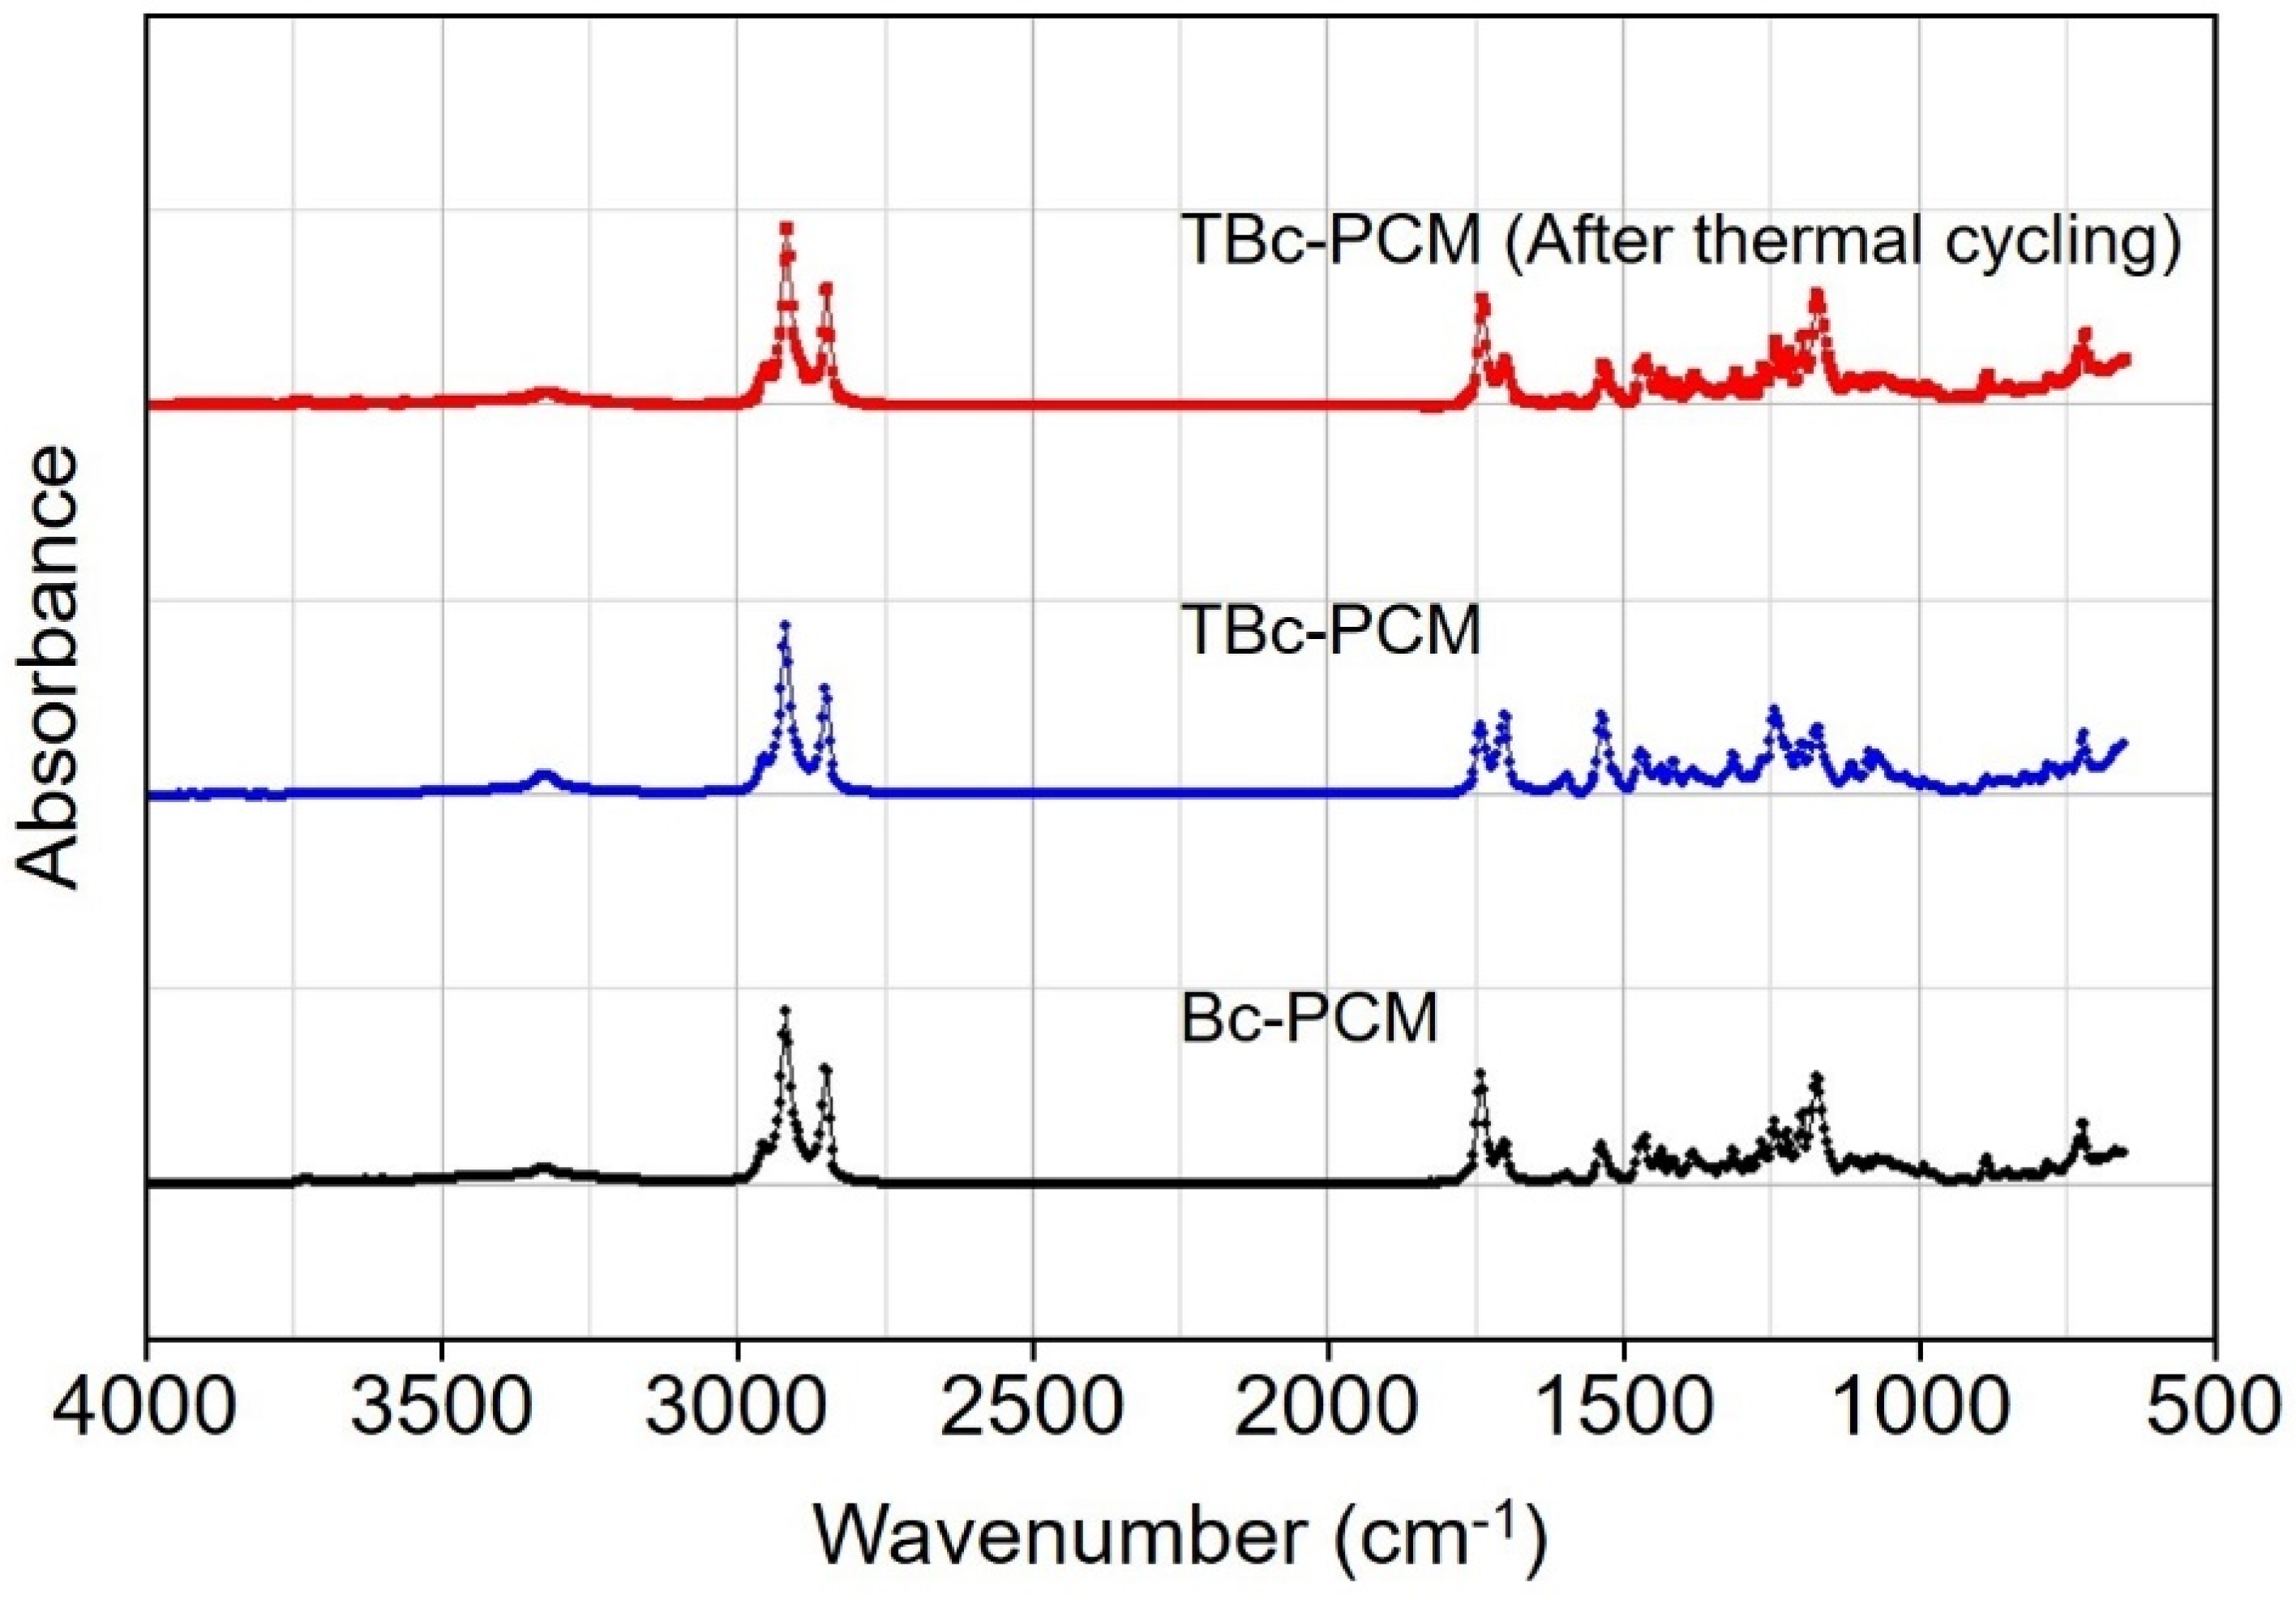
3.1. Chemical Stability Analysis of Bc-PCM and TBc-PCM

To determine the chemical stability of the Bc-PCM and TBc-PCM, FTIR analysis was performed. Figure 2 shows the FTIR analysis of Bc-PCM and TBc-PCM. In the following graphs, we confirmed that the FTIR absorption spectra of Bc-PCM and TBc-PCM are almost same, with absorption peaks of from 2935 to 2846, 1739, 1701, 1389, 1083, and 717 cm−1, caused by stretching vibration of functional groups of C−O, −CH2, and −CH3. This shows that the FTIR peaks of Bc-PCM have not changed after the impregnation process. This indicates the chemical characteristics of Bc-PCM were not changed. Additionally, the chemical stability analysis of TBc-PCM was carried after repeated thermal cycling (1000 cycles) by FT-IR analysis. As a result, it can be seen that the peak position and intensity according to the properties of TBc-PCM are not change before and after thermal cycling. These results indicate that the chemical properties of TBc-PCM did not change even after thermal cycling, indicating that there is no chemical interaction between Bc-PCM and GNPs.

3.2. Thermal Properties of Bc-PCM and TBc-PCM

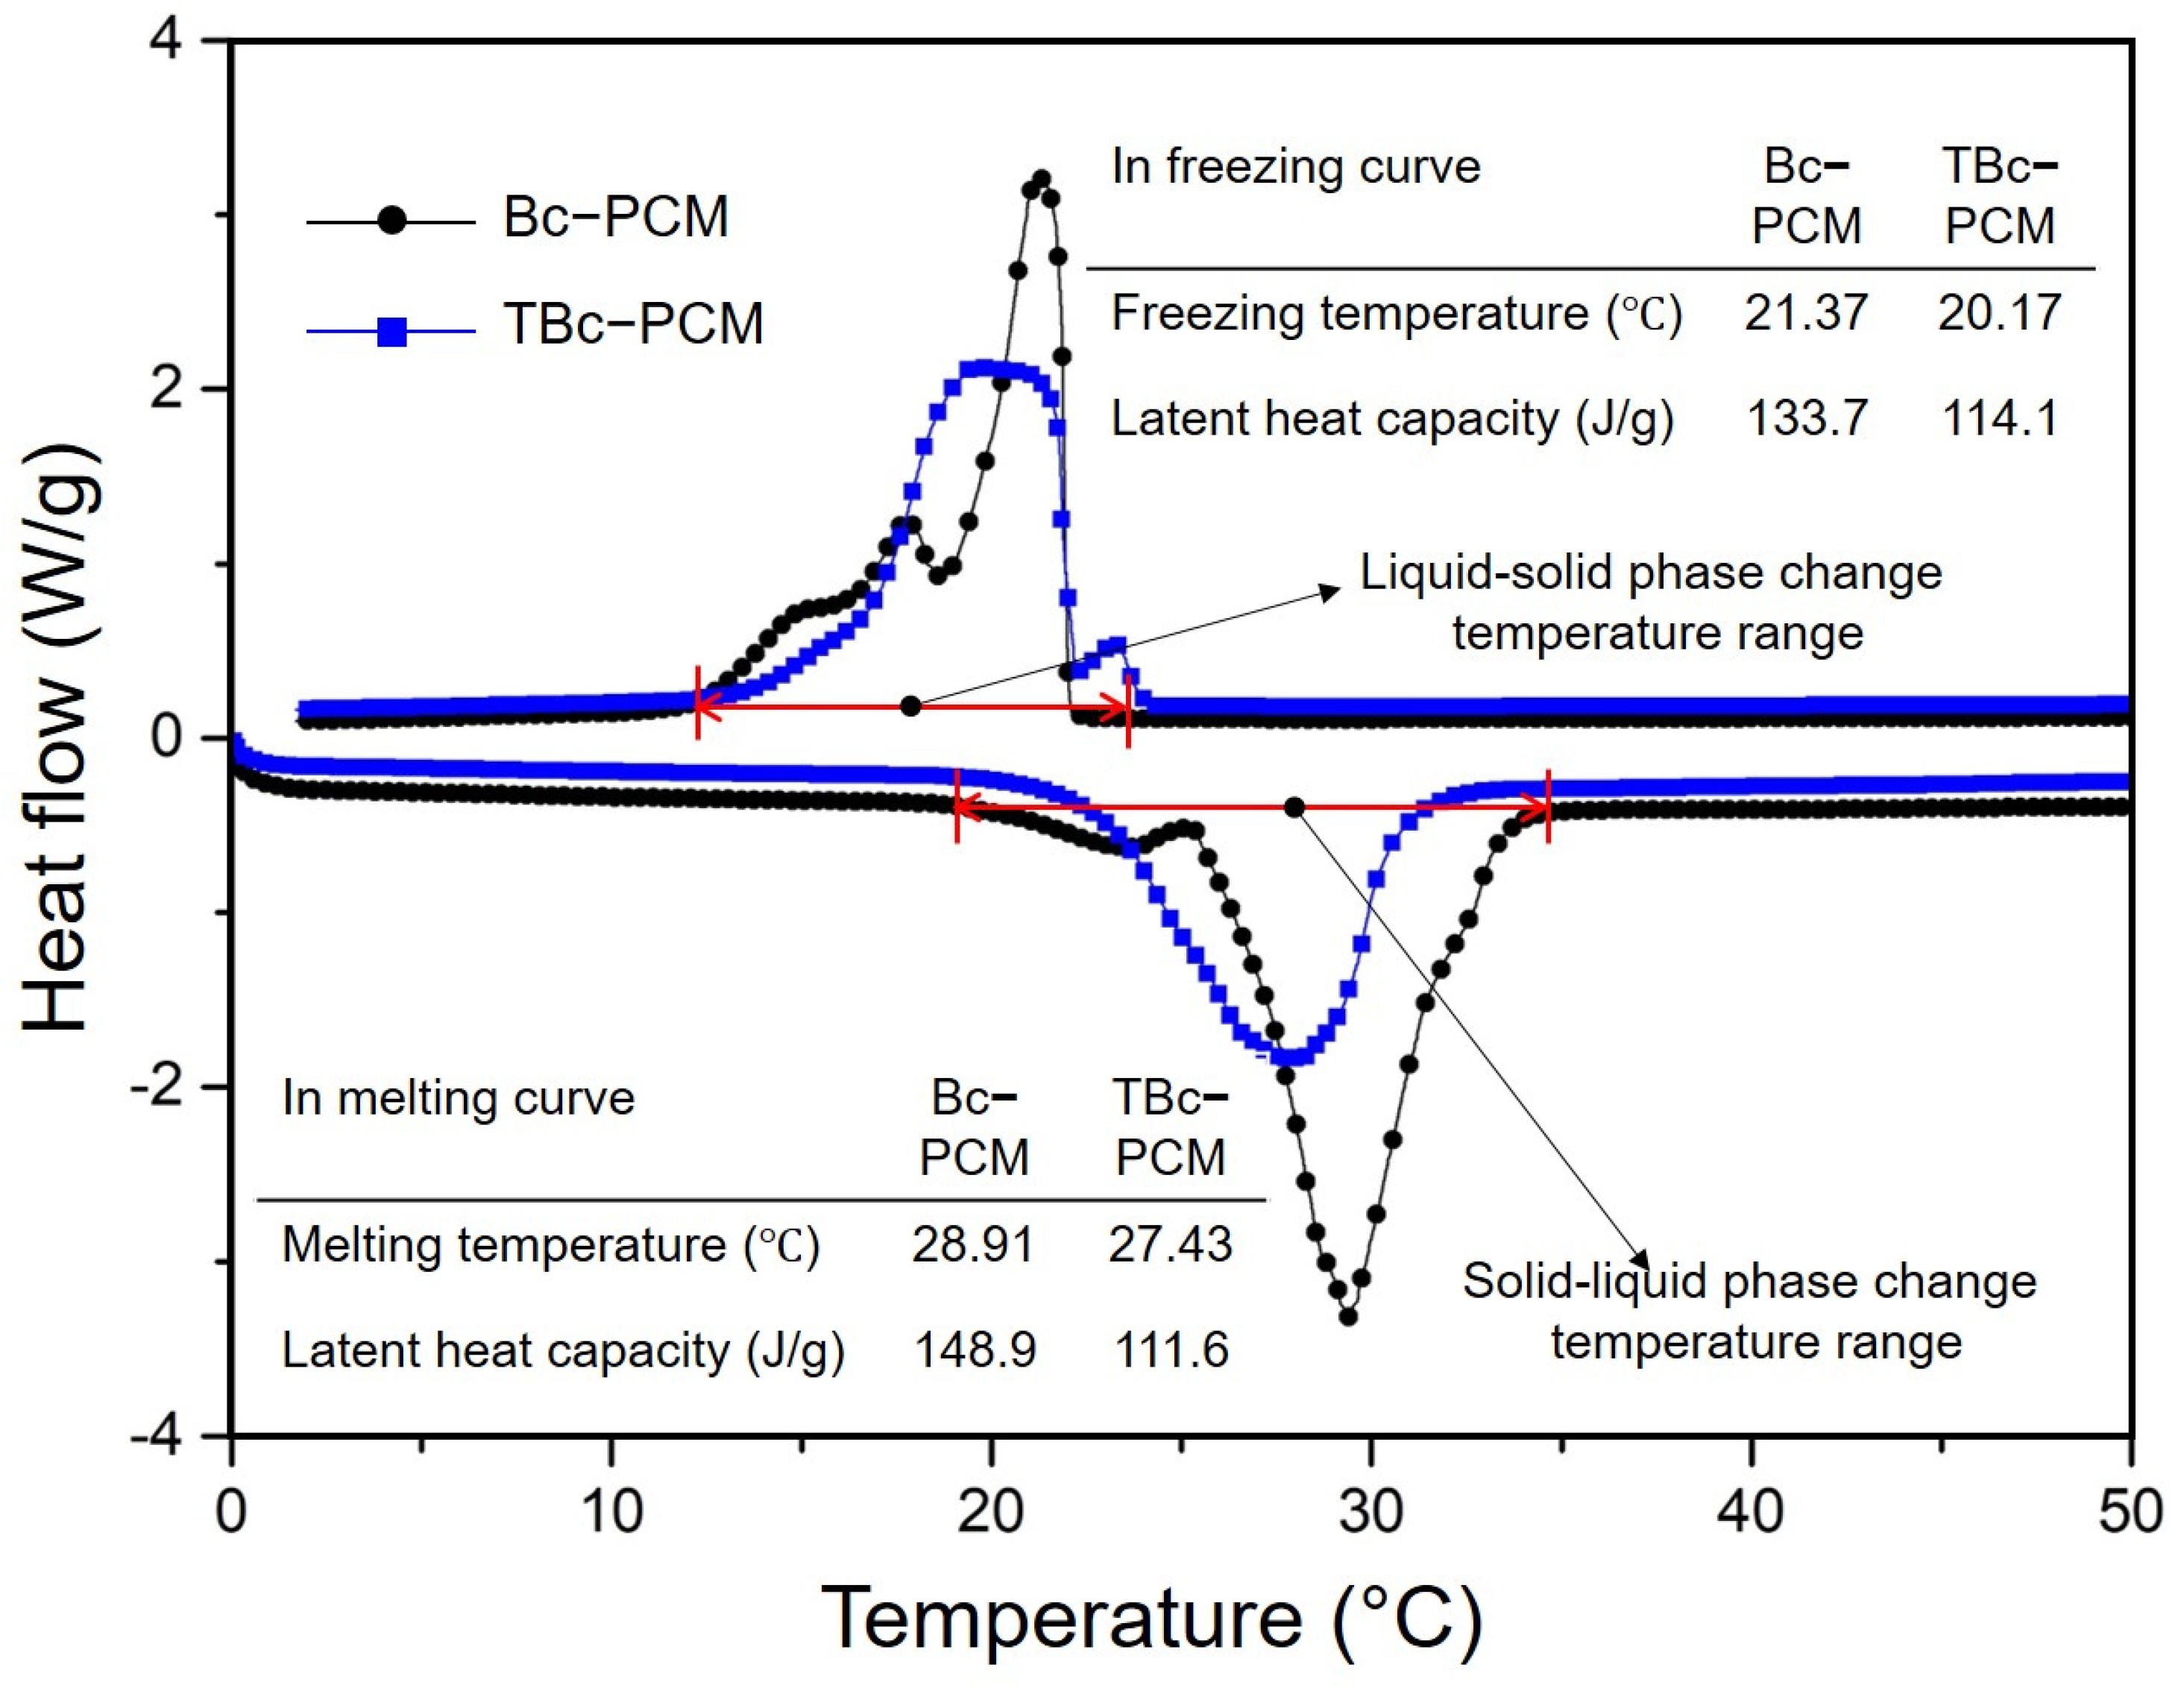
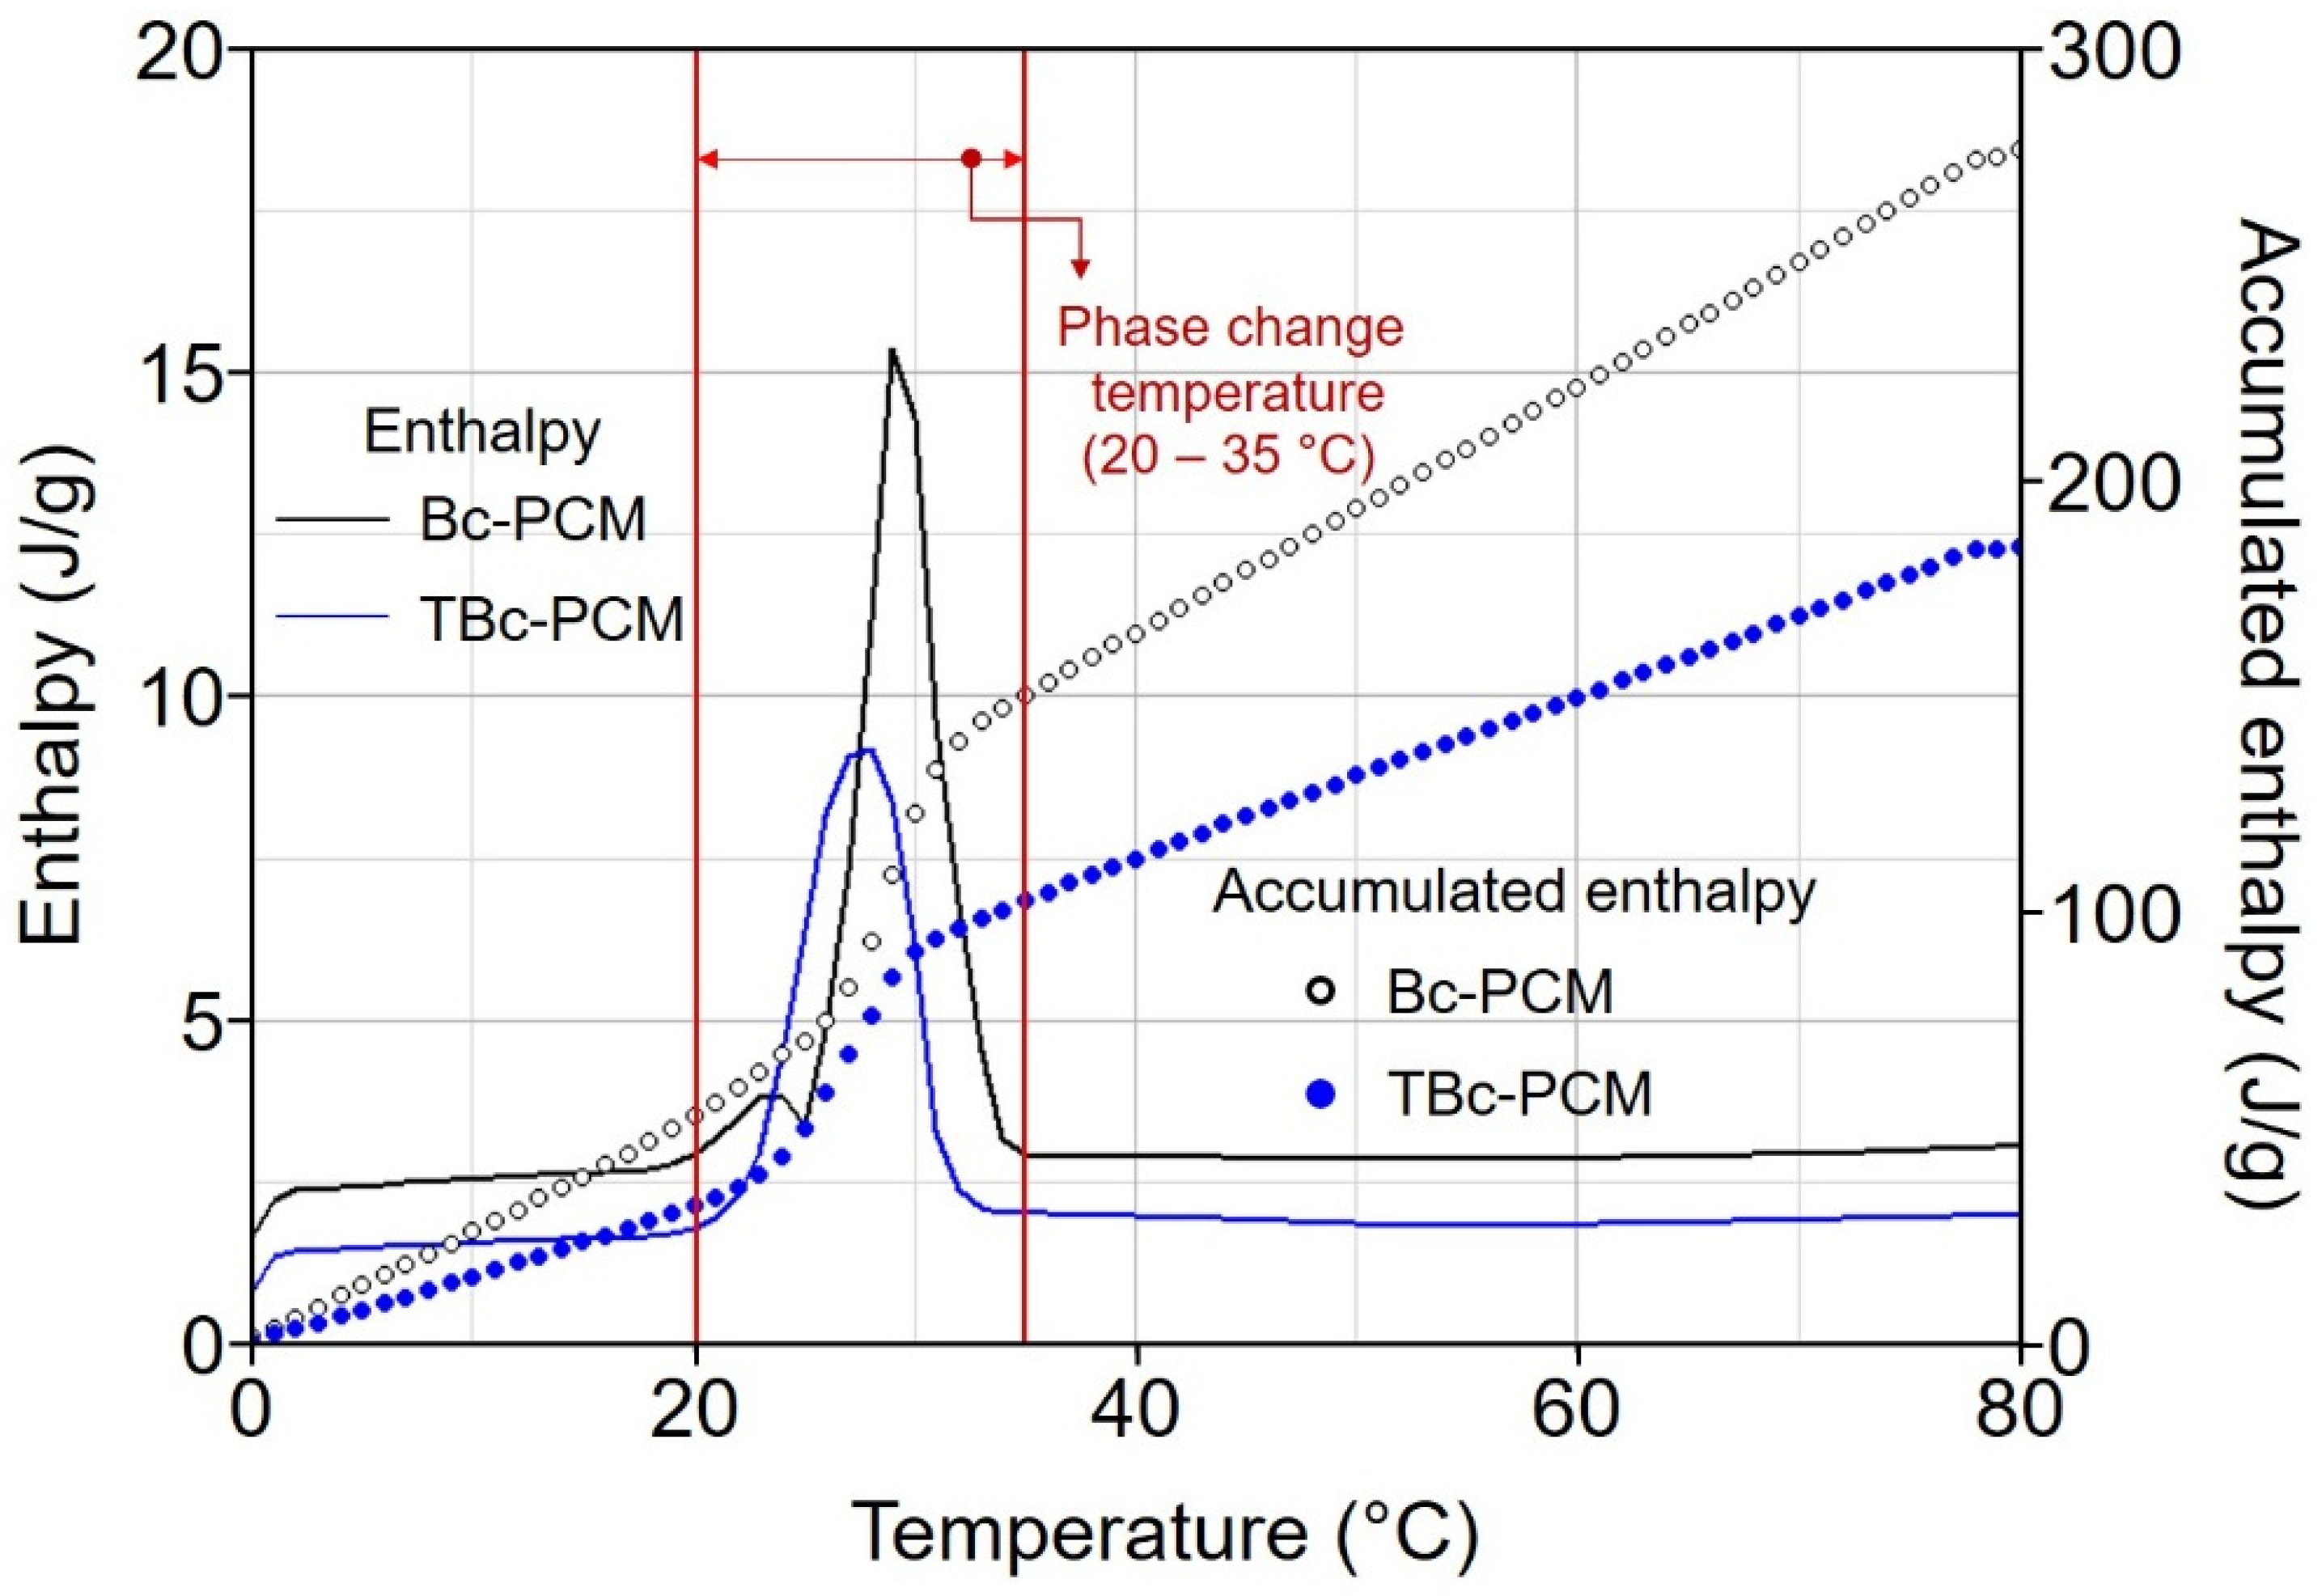
3.2.1. Heat Storage Analysis and Enthalpy Analyses

Figure 3 shows the melting and freezing temperatures and latent heat capacities of the Bc-PCM and TBc-PCM from the DSC measurements. In the graph, the phase change process of Bc-PCM occurred between 26 and 35 °C (peak temperature: 28.91 °C) during melting, and its heat capacity was 148.9 J/g. When freezing from 80 °C to 0 °C, the heat released for Bc-PCM was 133.7 J/g. For the freezing curve, the phase transition temperature range is between 21 and 10 °C (peak temperature: 21.37 °C), indicating a lower phase transition range. On the other hand, for TBc-PCM, the latent heats and peak temperature for the melting and freezing were found to be 111.6 J/g and 114.1 J/g and 27.43 °C and 20.17 °C, respectively. The latent heat capacity of the TBc-PCM was found to be nearly 74.9% of that of the Bc-PCM. In addition, as shown in Figure 3, TBc-PCM with GNPs has a lower melting temperature range than that of Bc-PCM. This shows that TBc-PCM received heat from the heat source better than Bc-PCM because GNPs has a high thermal conductivity. For the freezing curve, the peak of the TBc-PCM started at a higher temperature than that of the Bc-PCM owing to the influence of GNPs. This means that TBc-PCM has a faster heat transfer than Bc-PCM. However, since TBc-PCM has a relatively small heat capacity compared to Bc-PCM, it is necessary to check how this affects the reduction of the heating and cooling energy load. Additionally, the enthalpy accumulations of Bc-PCM and TBc-PCM were analyzed. Figure 4 shows the steep enthalpy slopes in the phase transition temperature range of the Bc-PCM and TBc-PCM due to its latent heat capacity. The solid line in the graph indicates the changing rate of the enthalpy for each temperature with an interval 1 °C and the dotted line indicates the accumulated enthalpy the integral of these peaks for the Bc-PCM and TBc-PCM. At 80 °C, the enthalpy value of Bc-PCM was 276.54 J/g and TBc-PCM was 184.64 J/g. It was found that Bc-PCM showed a higher enthalpy than TBc-PCM because the latent heat capacity of Bc-PCM was higher. These results show differences in the thermal properties of Bc-PCM and TBc-PCM, with Bc-PCM having a higher latent heat capacity and TBc-PCM having a higher thermal conductivity in energy simulation analysis.

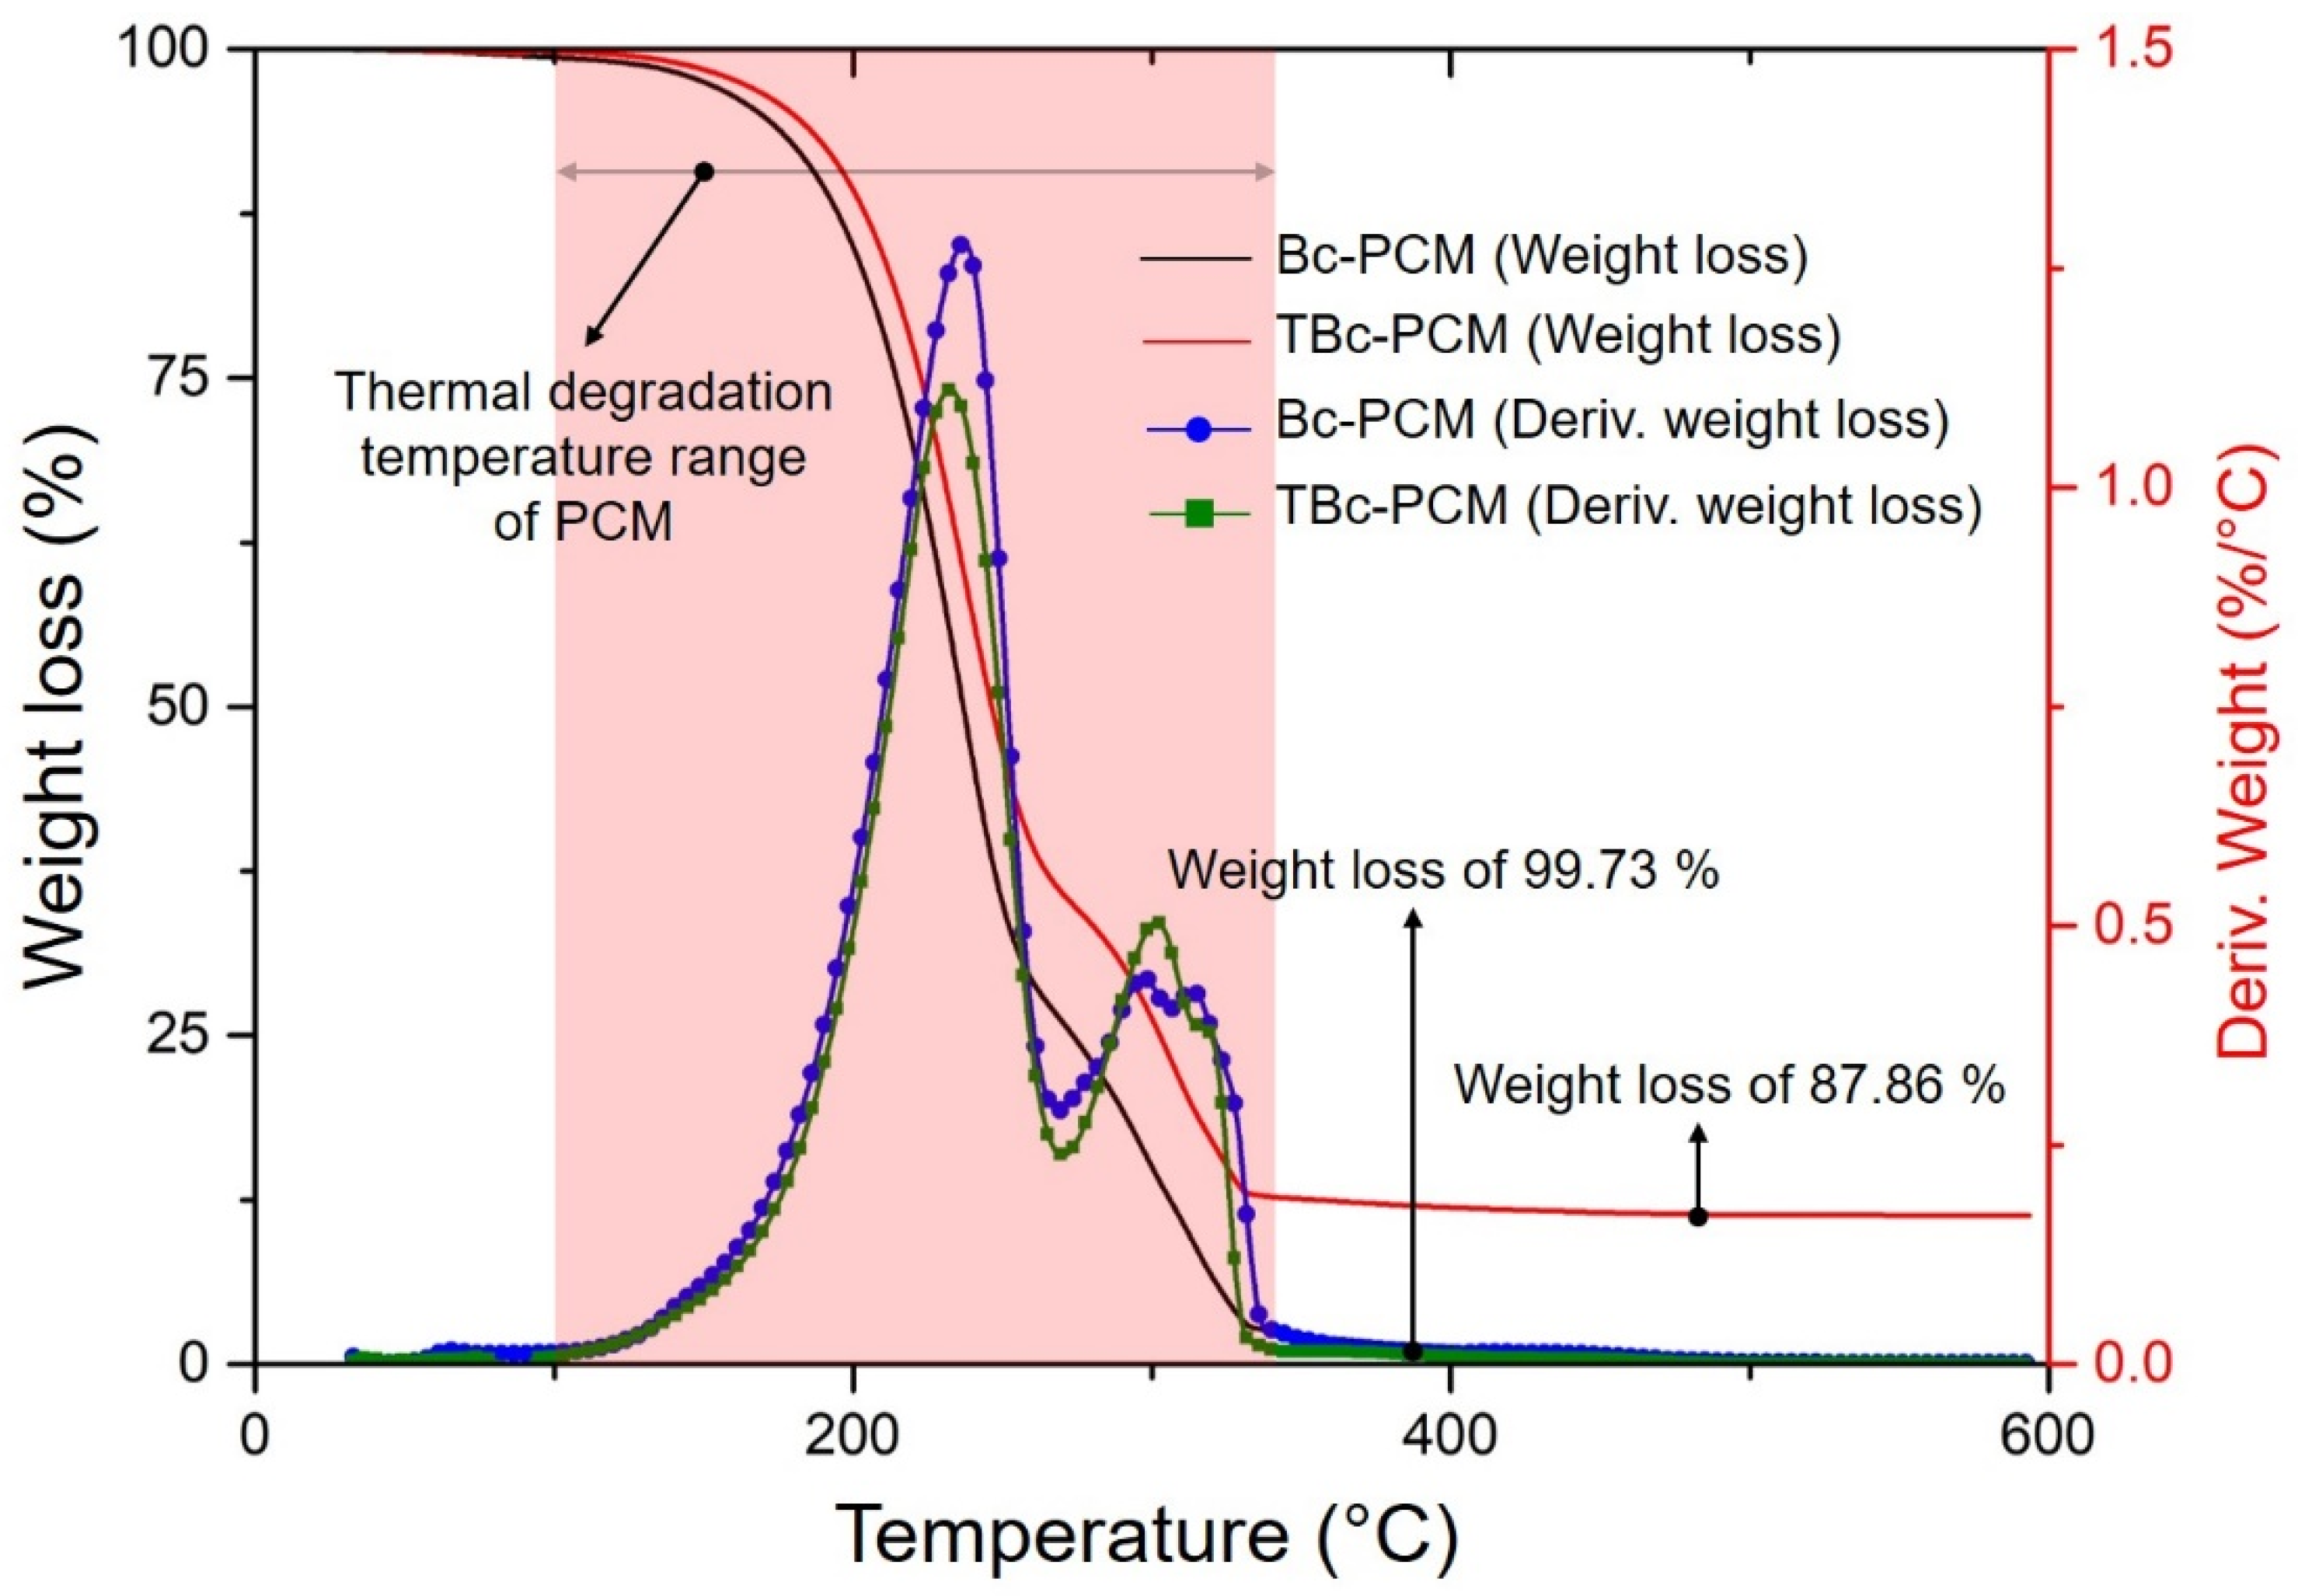
3.2.2. Thermal Durability and Thermal Conductivity Analyses

To evaluate the thermal durability of the Bc-PCM and TBc-PCM, TGA analysis was carried out. GNPs were observed to have high thermal durability because thermal degradation did not occur even at 600 °C [38]. Figure 5 shows the TGA analysis of Bc-PCM and TBc-PCM. In the TGA graph, both Bc-PCM and TBc-PCM have two curves of thermal oxidation degradation. The analysis results indicate that most weight loss occurs in the temperature range of 110–320 °C, where Bc-PCM and TBc-PCM are oxidized. In the graph, the thermal oxidation rate of both Bc-PCM and TBc-PCM represented 99.73% and 87.86%, respectively. They show that TBc-PCM left much more combustion residues, because of incorporating the contents of GNPs in the TBc-PCM. In the thermal conductivity analysis, the thermal conductivities of Bc-PCM and TBc-PCM are 0.150 and 0.568 W/mK, respectively, and the standard errors (SE) were 0.0026 and 0.0011. As a result, TBc-PCM has a 378% increase in thermal conductivity compared to Bc-PCM, indicating that GNPs improved the thermal conductivity of Bc-PCM. Owing to the rapid acceptance of heat energy by the TBc-PCM, it is expected that high thermal efficiency and heat storage properties will be applied to the building field.

3.3. Energy Simulation Analysis

3.3.1. Annual Heating and Cooling Load Reduction

Table 4 represents the annual heating and cooling energy consumption of the building models in which Bc-PCM and TBc-PCM were applied with thicknesses of 10 to 30 mm for the four cities. In this study, the reference model represents a conventional wooden frame house in which Bc-PCM and TBc-PCM are not applied to the wall. In Design Builder, the energy consumption of the building was estimated based on gas consumption for heating and electricity consumption for cooling. As shown in Table 4, the annual heating and cooling energy consumption shows a lower heating and cooling energy consumption as the thickness of the PCM layer increases. On the other hand, the cooling energy load was reduced when TBc-PCM with a low latent heat capacity but high thermal conductivity was applied. This means that the energy reduction performance of Bc-PCM and TBc-PCM is different owing to the temperature difference between the phase change temperature and the indoor room temperature. As the room temperature was maintained at a temperature lower than the phase change temperature during the heating period, heat energy was stored as sensible heat through specific heat rather than the latent heat performance of the PCM. Therefore, when the temperature difference between the phase change temperature and the room temperature was large, the PCM stored energy as sensible heat, so Bc-PCM with a larger PCM capacity was more effective than TBc-PCM because the GNPs contained in TBc-PCM had a low specific heat. In fact, when TBc-PCM was applied with a thickness of 10 mm to Chicago with a large heating load, the annual heating energy consumption increased by 20.77 kW compared to the reference model. However, when TBc-PCM was applied with thicknesses of 20 and 30 mm, a heating energy reduction effect of 23.37 and 57.01 kW was shown. On the other hand, TBc-PCM proved to be more effective during the cooling period when the temperature difference between the phase change temperature and the outside air temperature was small compared to the heating period. In addition, when the latent heat storage performance of the PCM was well expressed, it was more effective in terms of energy reduction when TBc-PCM with high thermal conductivity was applied. In Phoenix, where the cooling energy consumption is the largest, when Bc-PCM was applied by 10, 20, and 30 mm, the cooling energy reduction was 7.91, 23.19, and 30.96 kW, respectively, whereas when TBc-PCM was applied, higher energy reductions of 9.17, 24.48, and 33.71 kW were shown. As a result, applying more PCM is effective for heating periods with a large difference between the outdoor air temperature and the phase change temperature. On the other hand, applying PCMs with high thermal conductivity is more effective during the cooling period where outdoor temperature shows a small temperature difference from the phase change temperature, due to the improved latent heat storage of PCM.
Looking at the annual heating energy consumption, Chicago has a large heating energy consumption, and shows the highest reduction in heating energy consumption when 30 mm of Bc-PCM is applied. In the case of Phoenix, the heating load was higher than that of Los Angeles and Miami because of the large daily temperature difference due to the desert climate. Phoenix showed a lower heating energy consumption (83.85 kW) than Chicago (4497.49 kW), but the reduction rate was very large. In fact, when Bc-PCM 30 mm was applied, Chicago showed a reduction of 2.07%, compared to 46.65% for Phoenix. In the case of Miami, the heating energy consumption was small; therefore, even if a small amount of PCM is applied, the heating energy consumption can be reduced to zero. In the case of Los Angeles, the climate is relatively mild, and it was found that there was an effect of reducing heating energy, except for the case of applying TBc-10 mm. The consumption of cooling energy was high in the order of Phoenix, Miami, Chicago, and Los Angeles. As PCM stores more heat energy in the form of latent heat during the cooling period, the cooling energy reduction effect was higher when TBc-PCM with high thermal conductivity was applied owing to the high heat transfer. The reduction in cooling energy consumption was the highest in Phoenix, but the reduction rate was highest in Los Angeles (based on TBc-PCM 30 mm: Phoenix 4.57%, Los Angeles 42.52%). In the case of Miami, the cooling energy consumption was high, but the amount of cooling energy reduction was similar to that of Chicago. This is because the outdoor temperature in Miami was often higher than the phase transition temperature, so the latent heat storage performance of the PCM was not well revealed, so the reduction rate of cooling energy consumption was low. In conclusion, it can be seen that to reduce heating or cooling energy consumption by applying PCM, it is necessary to understand changes in the local climate and outdoor temperature for the target period.

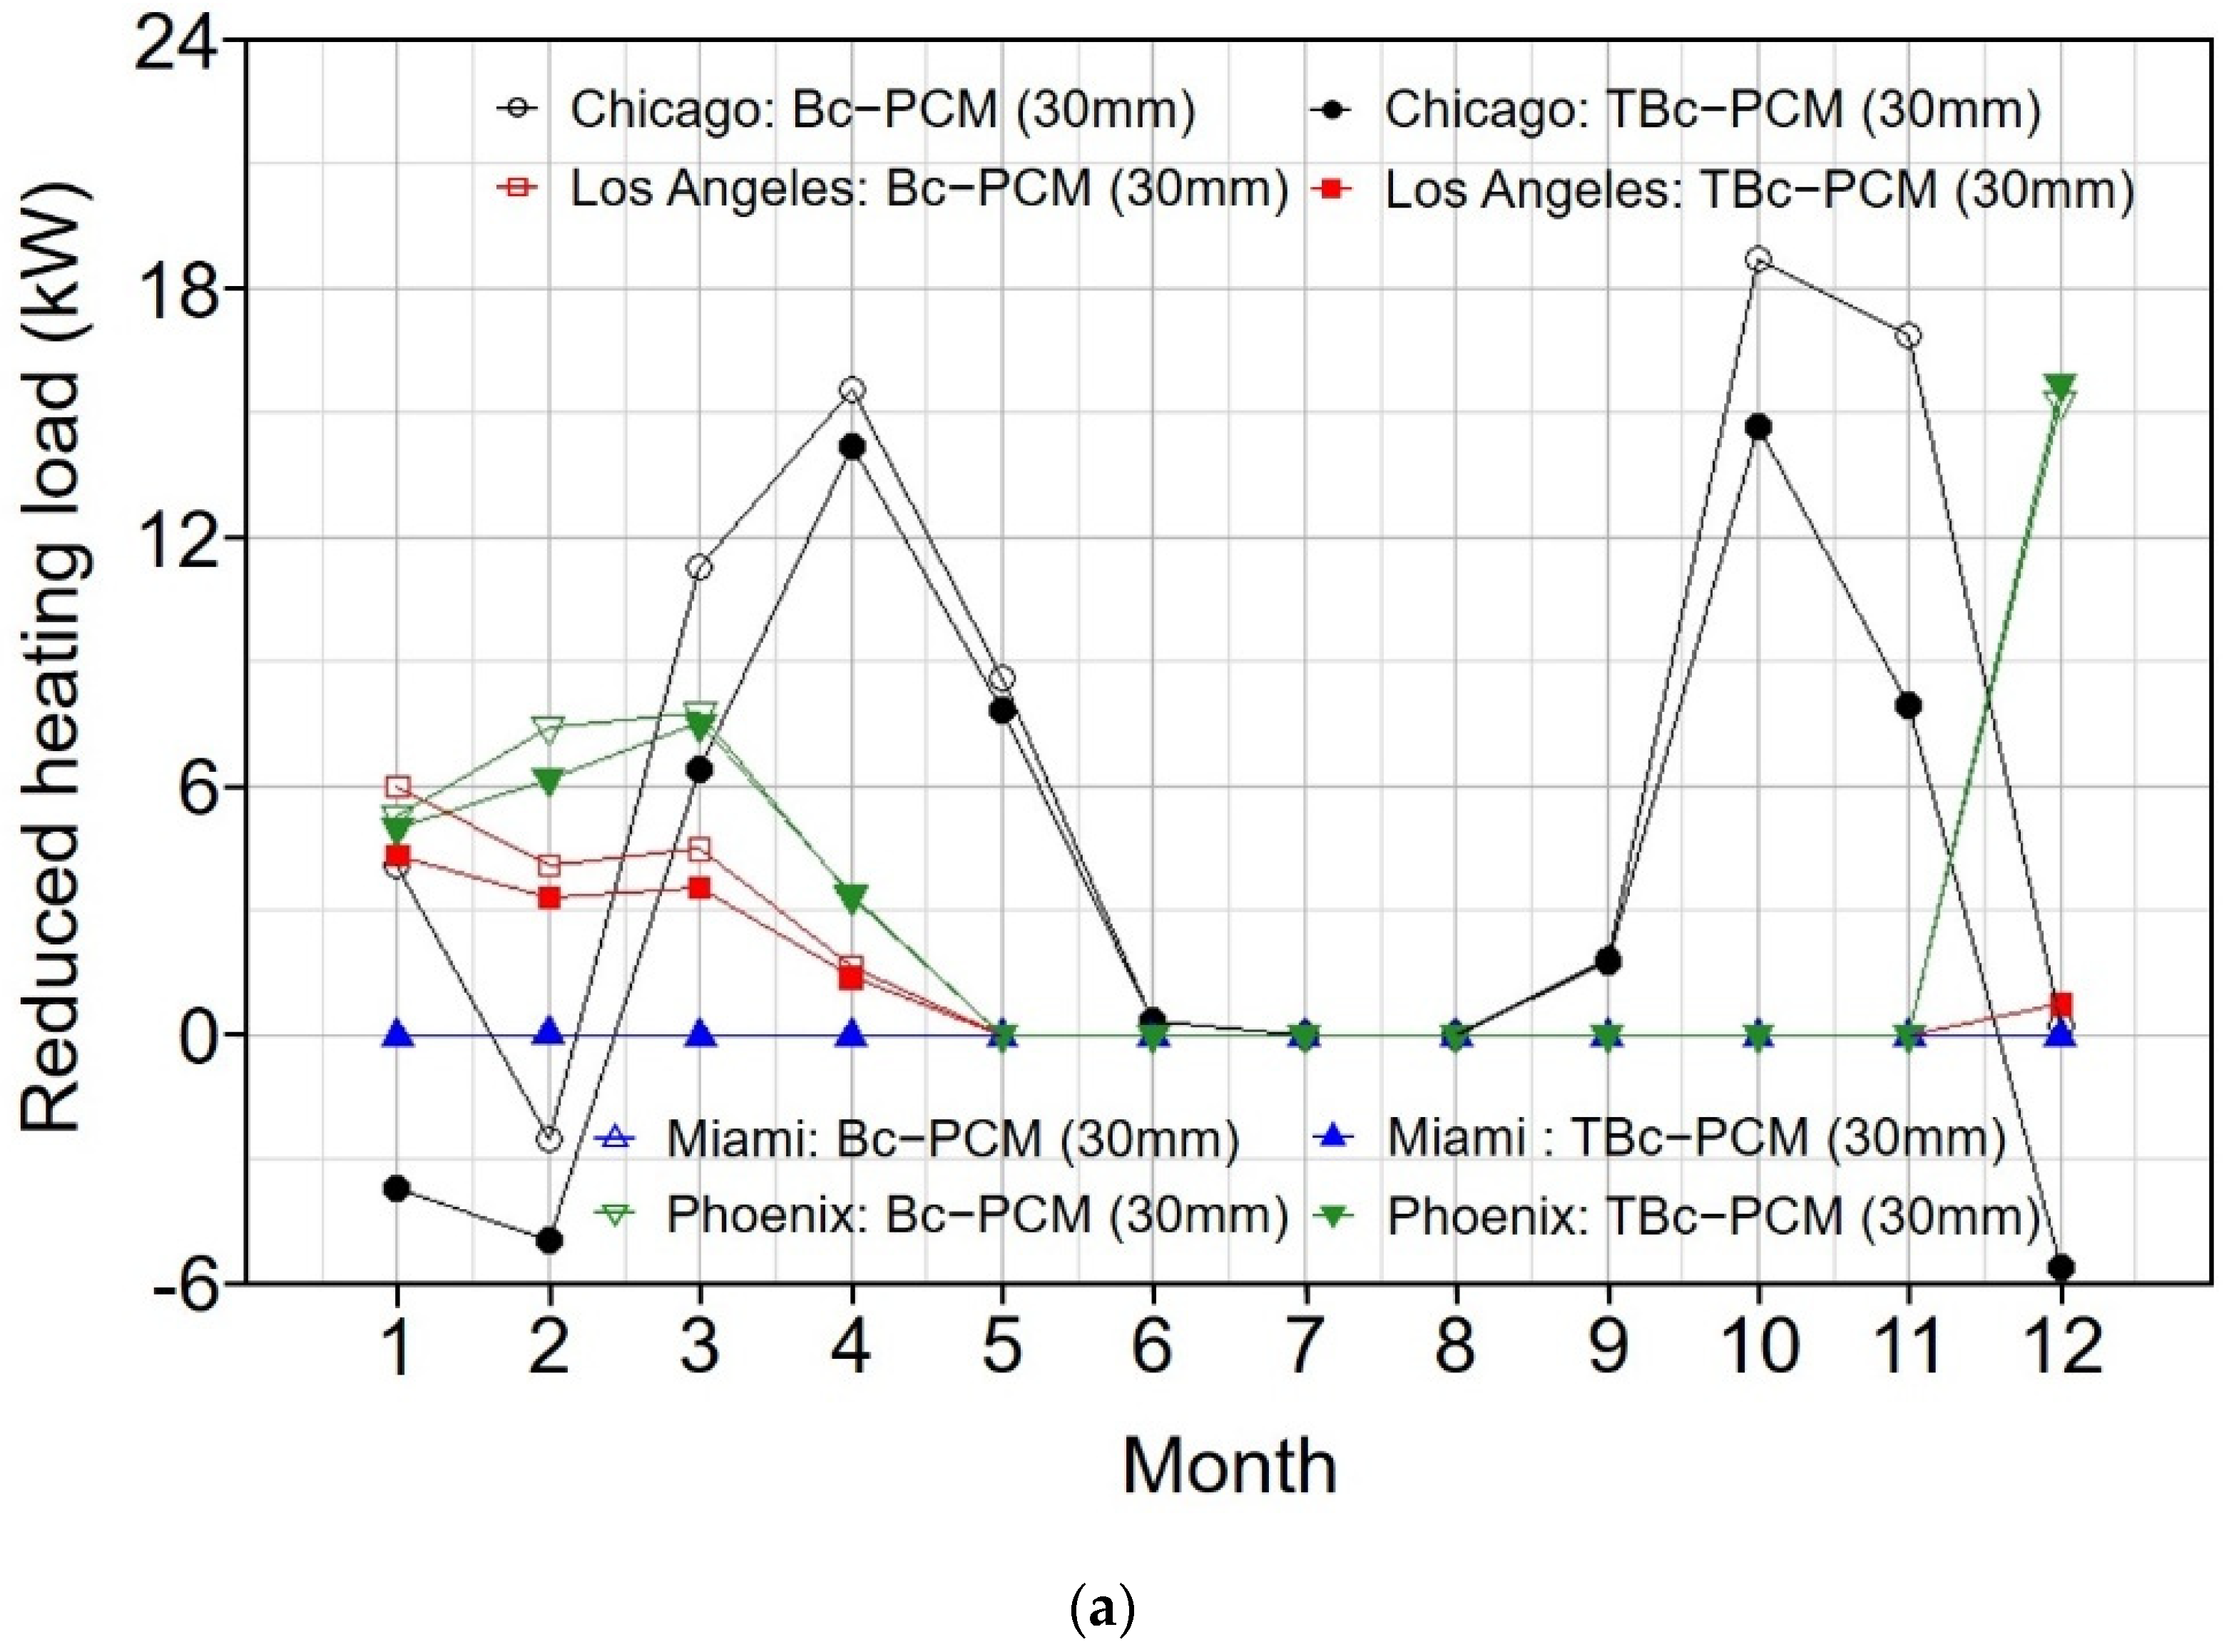
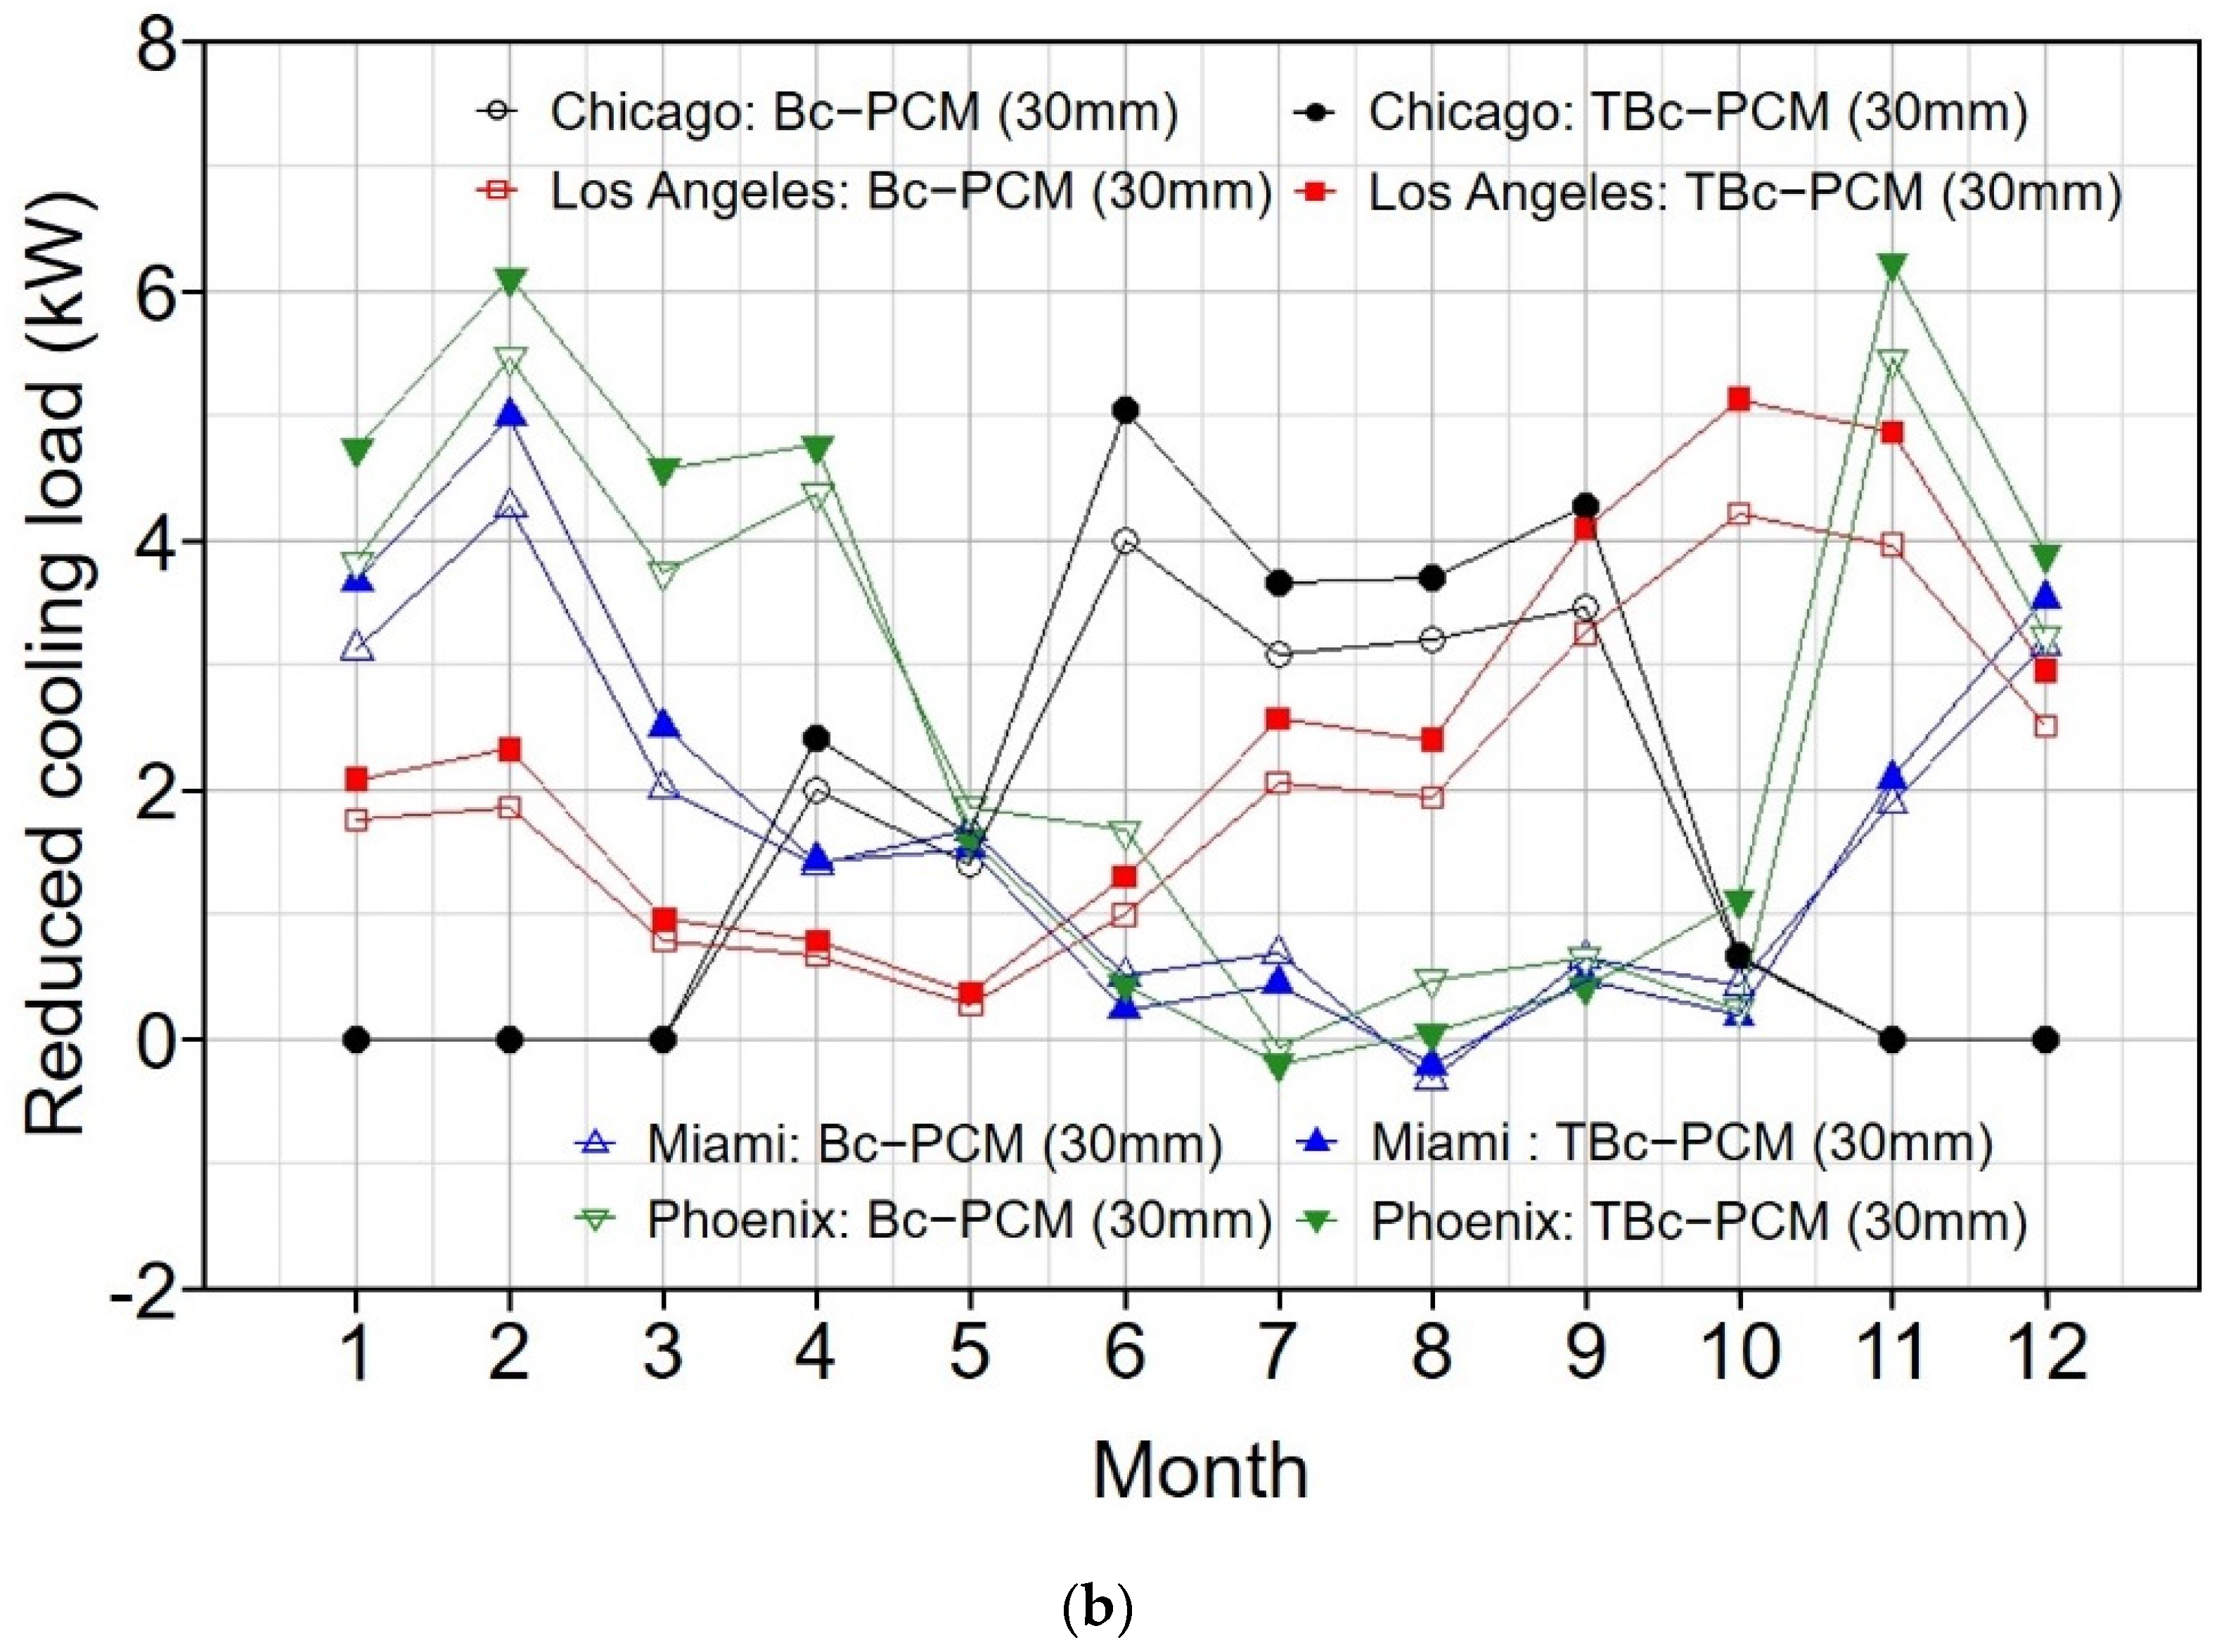
3.3.2. Monthly Heating and Cooling Load Reduction

Figure 6 shows the monthly heating and cooling load reduction for the model to which 30 mm of Bc-PCM and TBc-PCM are applied compared to the reference model. Empty points indicate the amount of reduction in heating and cooling load for each city to which Bc-PCM is applied, and filled points indicate the amount of reduction in heating and cooling load to which TBc-PCM is applied. The graph shows that Chicago consumes more heating energy during the heating period when TBc-PCM is applied compared to the reference model. First, because the outside temperature during the heating period of Chicago is lower than the phase change temperature of the PCM, the heat storage performance due to the latent heat of the PCM cannot be expected. Therefore, most of the stored energy is due to the specific heat of the PCM. In addition, when TBc-PCM was applied, the heating energy consumption was larger because the heating heat source was quickly stored in the TBc-PCM owing to its high thermal conductivity. Subsequently, the heating energy stored in the TBc-PCM leads to heat loss through heat exchange with the outdoor air through the wall, leading to an increase in the heating energy consumption. Even in the case of Bc-PCM, the heating energy consumption was higher in February than in the reference model. This is because, when the temperature difference between the outdoor and indoor is large, the heat loss from the wall is large, resulting in more heating energy consumption. In the case of Los Angeles and Phoenix, the heating energy consumption was smaller than that of the reference model. This is because, compared to Chicago, heating energy loss between indoor and outdoor was small due to the small temperature difference. In addition, when Bc-PCM was applied, the heating energy reduction effect was greater than that of TBc-PCM. In conclusion, when latent heat storage does not occur sufficiently, increasing the capacity of the PCM is more effective than applying a PCM with high thermal conductivity. In the case of Miami, the heating energy consumption was low because the outdoor temperature was relatively high during the heating period.
In the monthly cooling load reduction graph, in the case of Miami and Phoenix, the cooling energy reduction rate is rather low in summer. This is because, as the summer season approaches, the latent heat storage performance of the PCM is not expressed because the temperature difference becomes larger owing to the higher outdoor temperature than the phase change temperature. This can be confirmed by showing the lowest cooling energy reduction performance in July and August, when outdoor temperature was the highest. In addition, because the temperature difference between the outdoor temperature and the phase change temperature is small during the cooling period, the latent heat storage performance of the PCM is exhibited. Therefore, it was confirmed that the cooling energy reduction effect was large when TBc-PCM with high thermal conductivity was applied. In addition, because the latent heat storage performance of the PCM is exhibited during this period, the cooling energy reduction effect is large when TBc-PCM with high thermal conductivity is applied. In the case of Chicago, the cooling energy reduction effect was greatest during June–September, because the latent heat storage performance of the PCM was maximized during this period. In addition, the cooling energy reduction effect was greater when TBc-PCM was applied. In conclusion, the highest energy reduction effect was observed when the PCM with high thermal conductivity was applied under the condition that the latent heat performance could be maximized. In the case of Los Angeles, the highest cooling energy reduction effect was found from September to November because of the appropriate outdoor temperature for the latent heat storage of PCM. This means that when a PCM with high thermal conductivity is applied, latent heat storage occurs well, so it is effective in energy reduction.

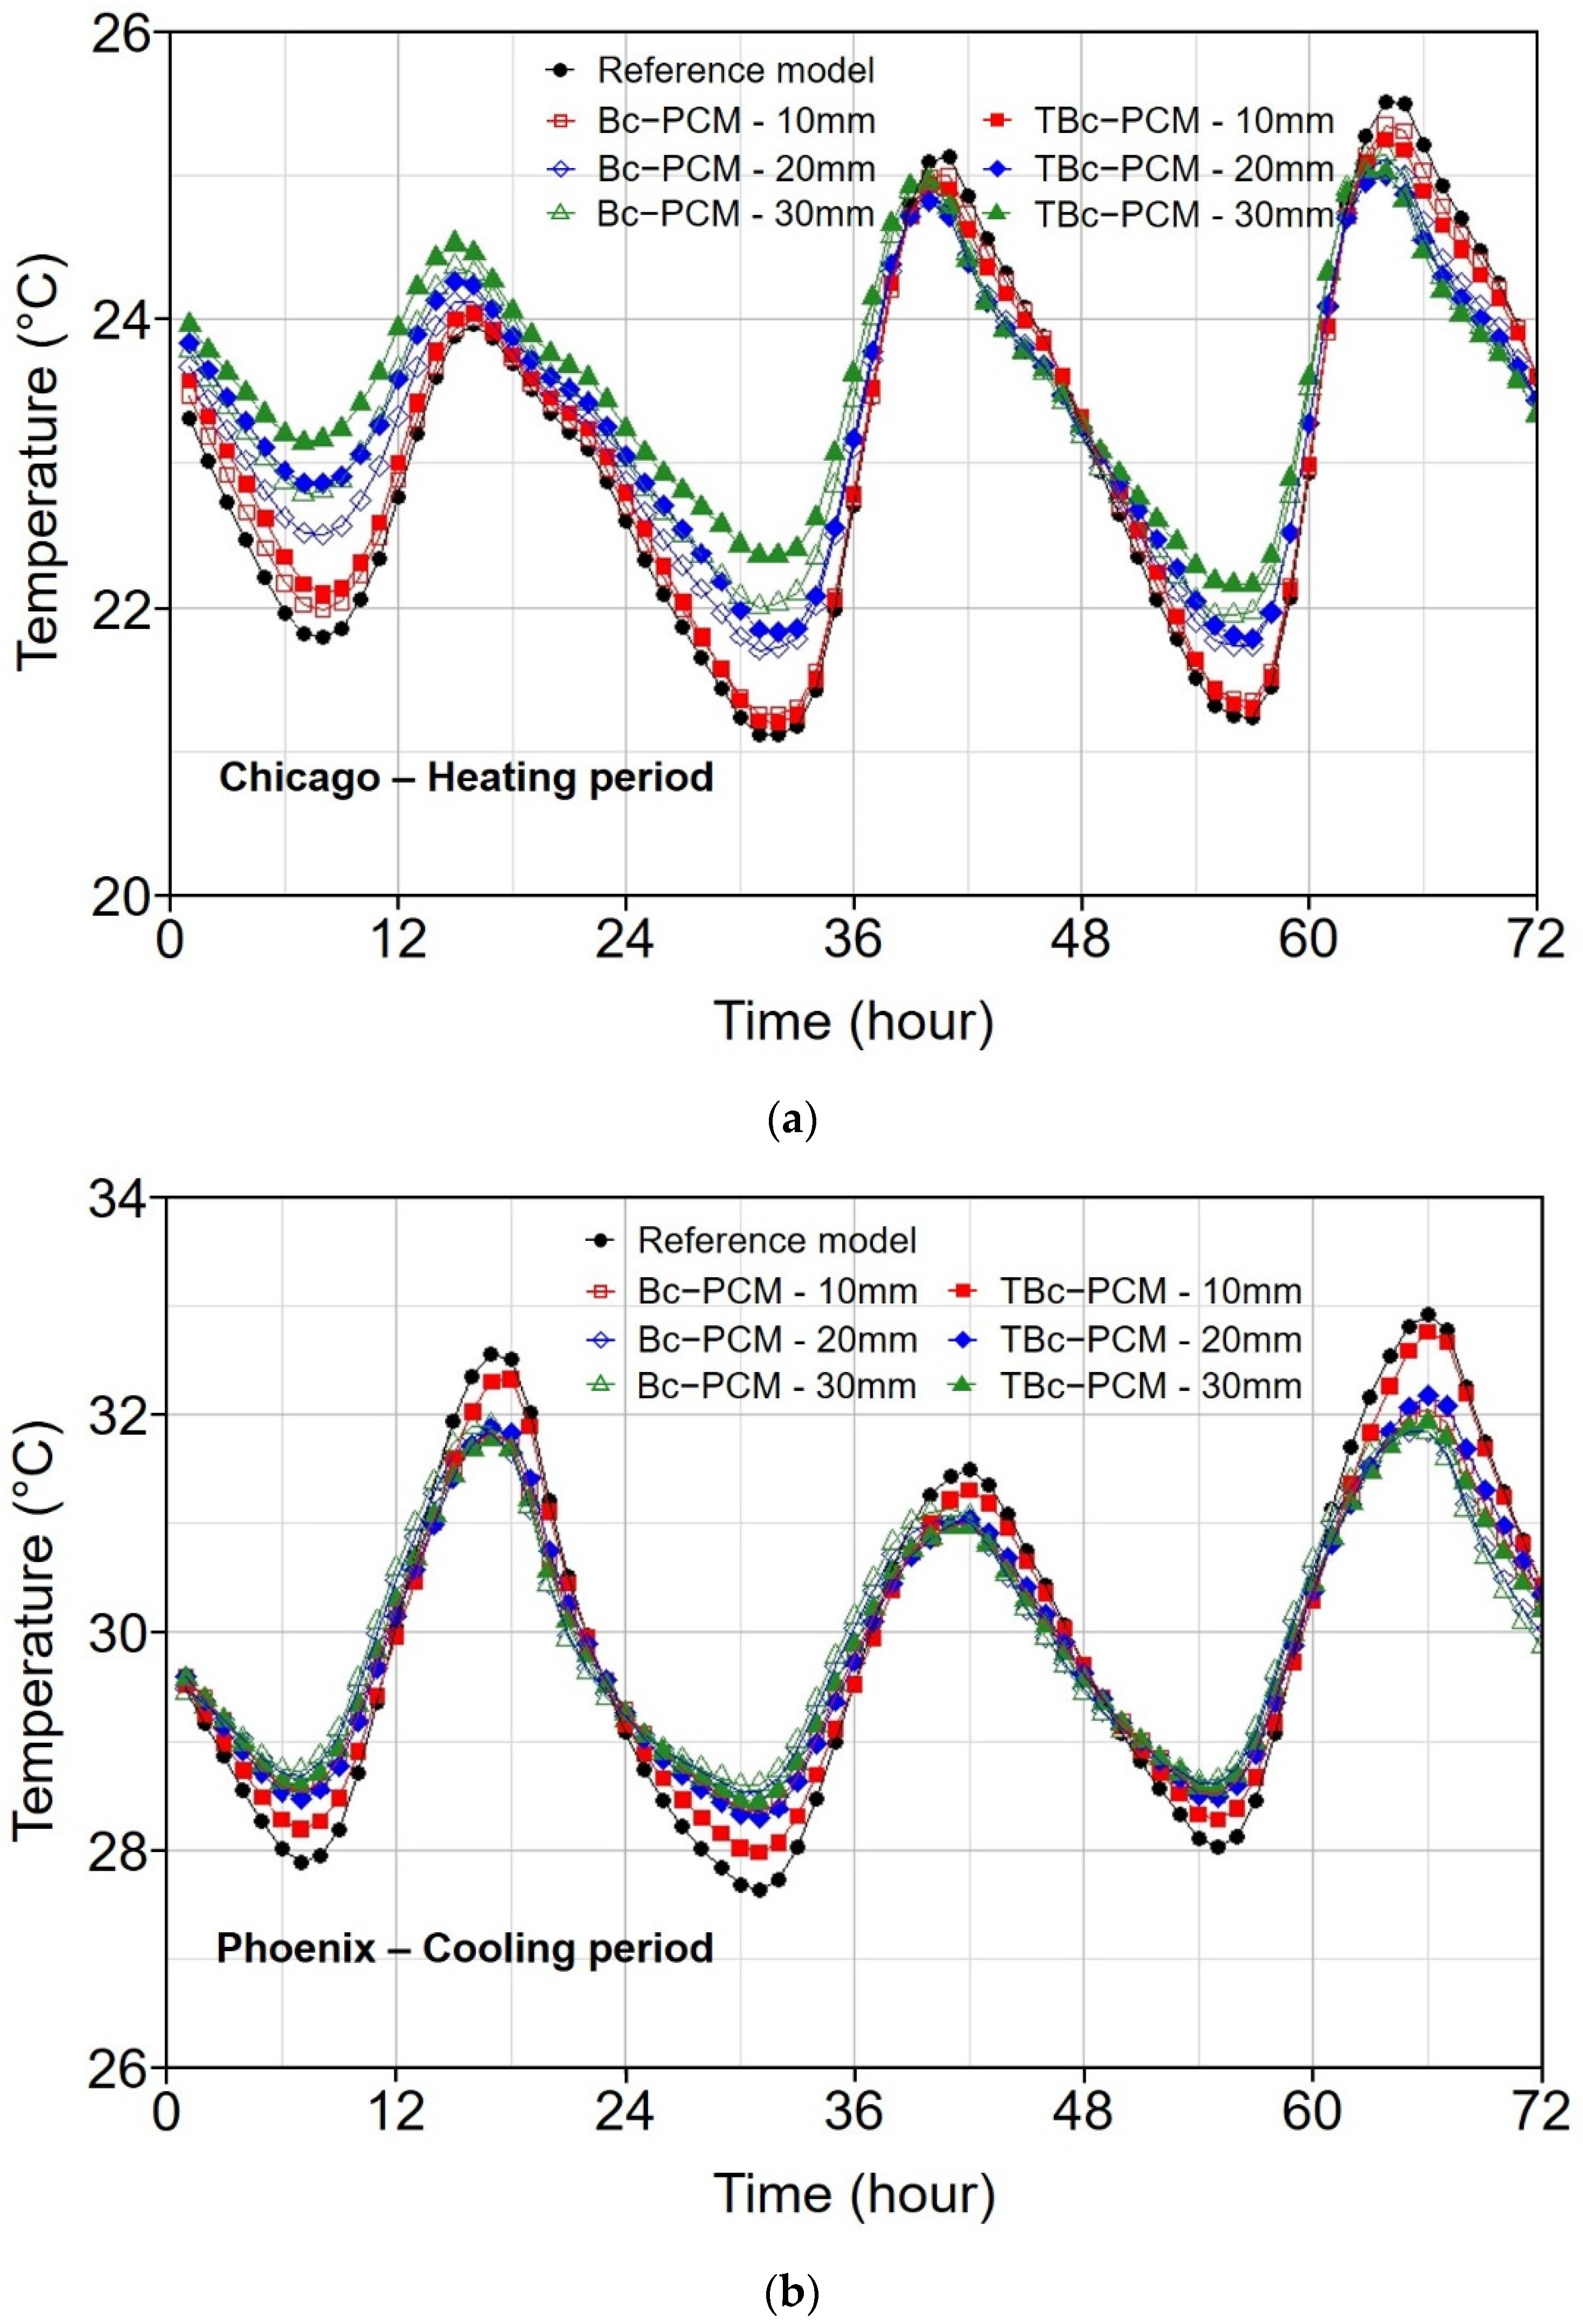
3.3.3. Surface Temperature Change Analysis

Figure 7a represents the change in the surface temperature of the indoor wall during 20–22 January in Chicago. Overall, the temperature change decreased as the PCM thickness increased. In particular, looking at the temperature when the wall surface temperature is lowered, the surface temperature is maintained higher when TBc-PCM is applied than when Bc-PCM is applied. This is because more heat generated during heating is stored in the TBc-PCM due to the higher thermal conductivity. In addition, the temperature difference of the wall to which the PCM is applied slowly decreases during free cooling, and the temperature difference between the PCM model and reference model increased during this period. However, this temperature difference gradually decreased when heating restarted.
Figure 7b shows the indoor surface temperature change in Phoenix from June to 20–22. Similarly, the wall to which a large amount of PCM was applied showed a smaller surface temperature difference. On the other hand, in the cooling period of Phoenix, the temperature difference was small when Bc-PCM was applied owing to the latent heat capacity of Bc-PCM. In addition, when TBc-PCM was applied with a thickness of 30 mm, the temperature change was similar to that when Bc-PCM of 30 mm was applied. During the cooling period of Phoenix, the room temperature was similar to the phase change temperature of the PCM. In other words, under the condition that the PCM can maximize the latent heat storage, the Bc-PCM with a large amount of PCM showed a smaller indoor surface temperature difference.

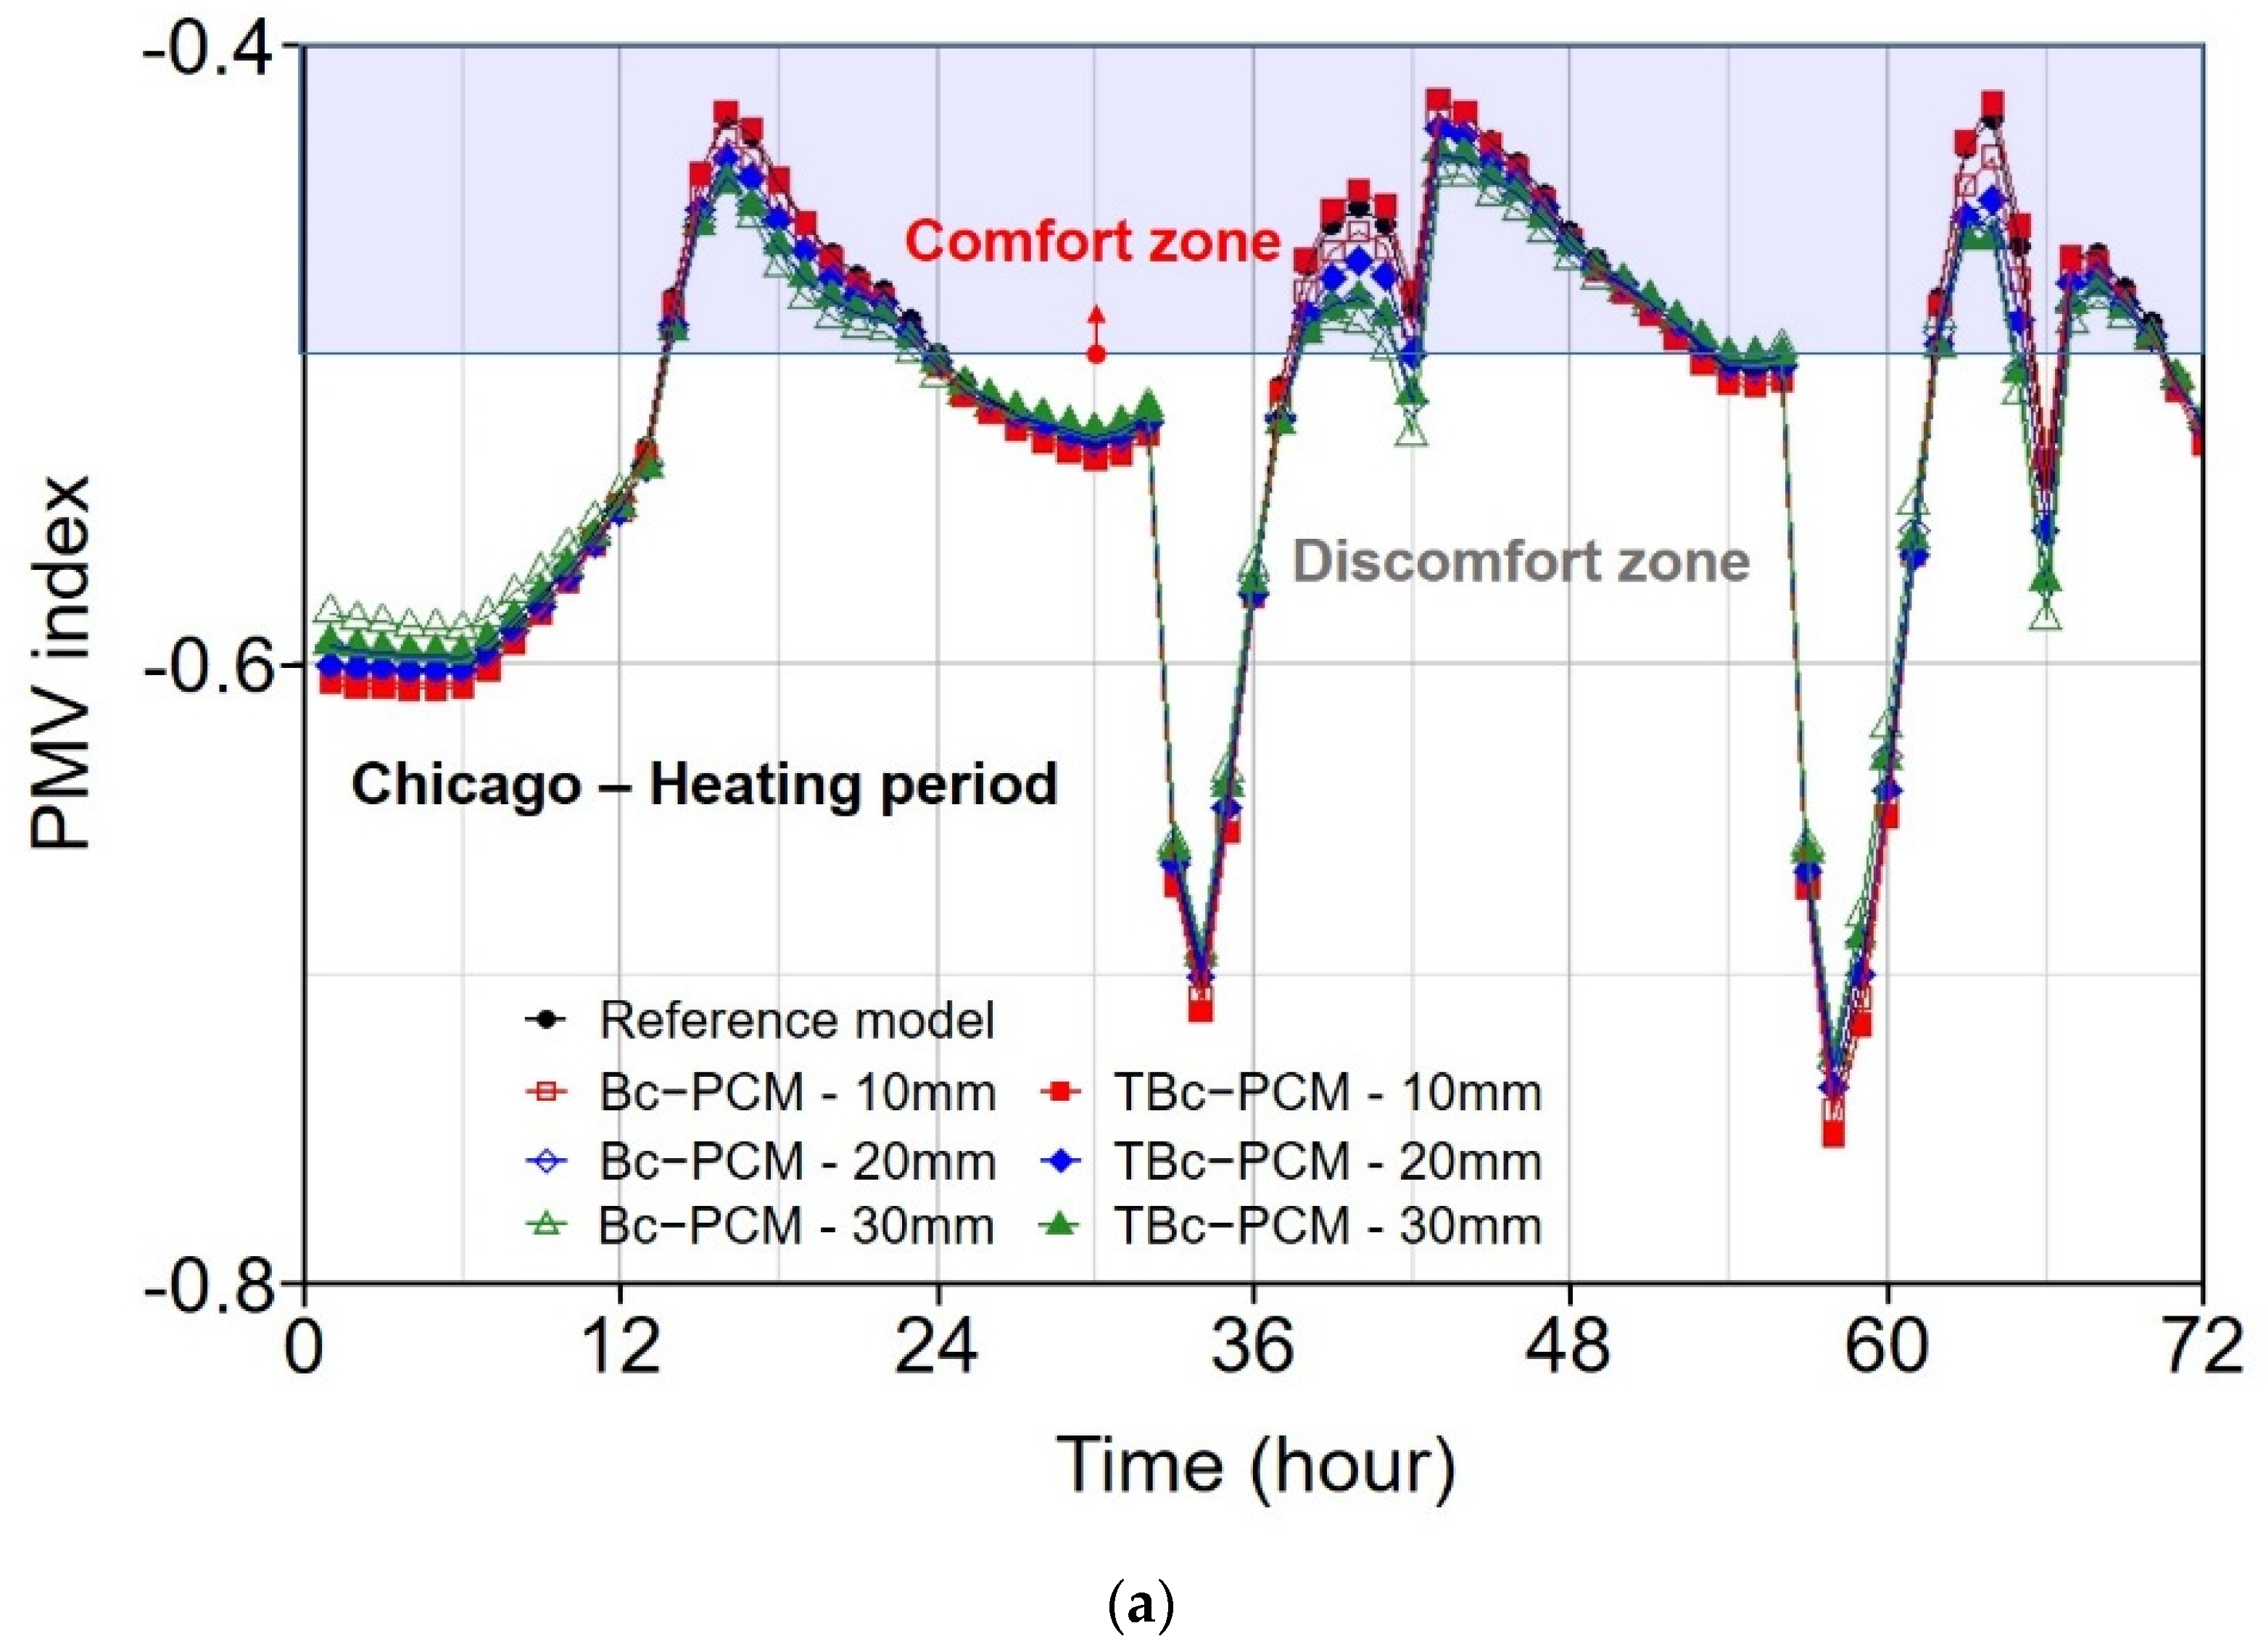
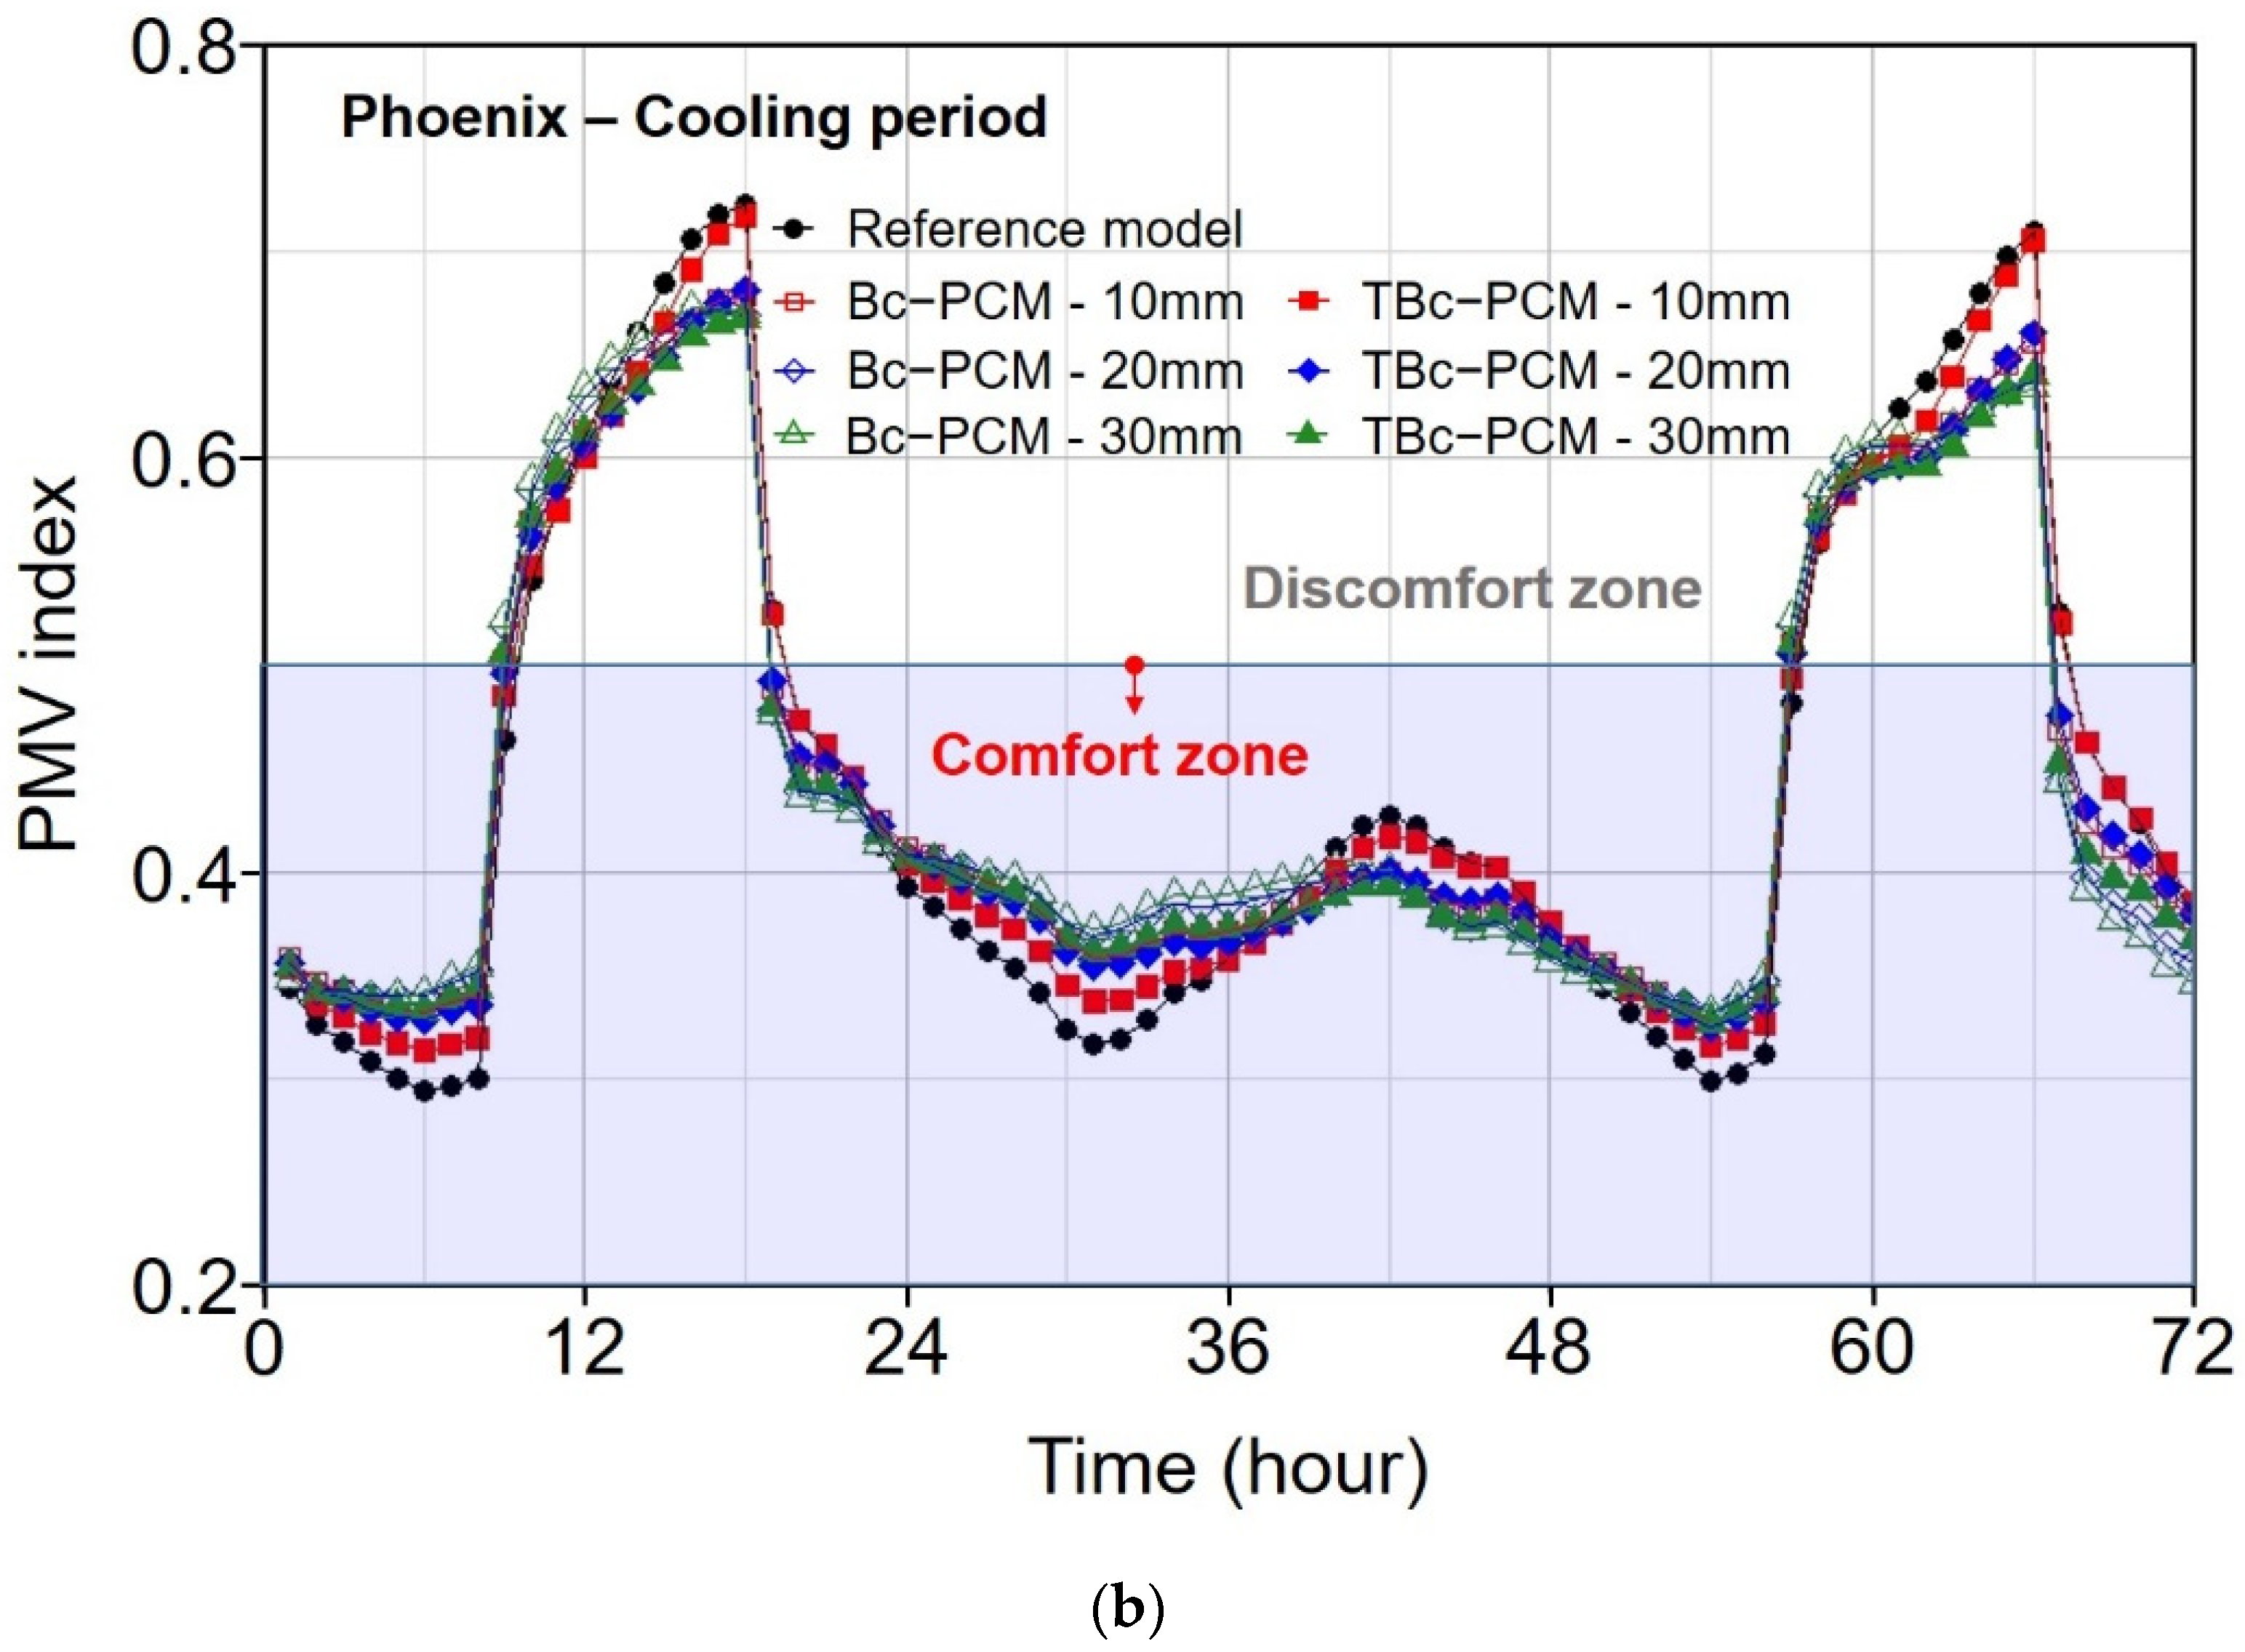
3.3.4. Thermal Comfort Evaluation through PMV Index

Figure 8a shows the change in the PMV index between 20–22 January and in Chicago. The PMV index was found to be between −0.75 and −0.42. In Figure 8a, the difference in the PMV index between the reference model and the PCM model is not significant because PCM does not store latent heat effectively. Nevertheless, the fluctuation of the PMV change decreased as the thickness of the PCM increased, and the PMV fluctuation decreased when Bc-PCM with a higher amount of PCM was applied than TBc-PCM. In addition, when 10 mm TBc-PCM was applied, the fluctuation of the PMV index change was large compared to the reference model. As mentioned in the surface temperature analysis, heat generated during heating is quickly transferred to TBc-PCM with higher thermal conductivity, but because the amount of PCM that can store heat is insufficient, it causes a rapid increase and decrease in the indoor surface temperature. In other words, the high thermal conductivity and small amount of heat storage caused a sudden change in the surface temperature, which influenced the mean radiant temperature ( T m r ), resulting in a more rapid PMV change. Evola et al. [39] introduced a new parameter for evaluating indoor comfort conditions and the frequency of thermal comfort (FTC). The FTC is defined as the percentage of time that indoor thermal comfort conditions are met within a given period.
F T C = ( ( P s τ D ) / P s ) × 100
where P s is the period of the simulation and τ D is the time at which the PMV index is outside the comfort range. During the simulation period, the FTC in Chicago showed no significant difference, ranging from 48.6–45.8%. However, the lowest PMV was found when the PCM was applied with a thickness of 10 mm and the reference model. This means that it is advantageous in terms of thermal comfort to increase the amount of sensible heat storage of PCM by increasing the thickness of the PCM under the temperature condition with a large difference from the phase change temperature. In addition, when PCM was applied, the PMV index was closer to the comfort zone (in the case of PMV > −0.5) in the discomfort zone, so it was found to be more comfortable.
Figure 8b shows the change in PMV index between 20–22 June and in Phoenix, with values between 0.29–0.72. Unlike Chicago, Phoenix’s PMV showed a larger difference between the reference model and the PCM applied model. This is because the latent heat storage of the PCM occurred well, evidenced by the fluctuation range of the PMV value being smaller when PCM was applied. In addition, when Bc-PCM was applied, the fluctuation range of the PMV was smaller, similar to the surface temperature analysis result, which was attributed to the effect of large latent heat capacity and low thermal conductivity. During the simulation period, there was no significant difference in the FTC between the models in Phoenix, ranging from 72.2–73.6%. However, as in Chicago, when PCM was applied, the PMV index was closer to the comfort zone (in the case of PMV < +0.5) in the discomfort zone, so it was analyzed as more comfortable.

4. Conclusions

In this study, a TBc-PCM was fabricated using a vacuum impregnation process with Bc-PCM and GNPs. Bc-PCM and TBc-PCM were placed in a sheet of plastic material, which had a thickness of 10, 20 and 30 mm, and was applied between the gypsum plaster board the insulation. To confirm the chemical and thermal properties of the Bc-PCM and TBc-PCM, FTIR, DSC, TGA, and TCi analyses were performed. In addition, to confirm the energy reduction and thermal comfort performance, building energy simulation, and thermal comfort analysis were carried out for the four cities using DesignBuilder software based on EnergyPlus.
  • In the FTIR-analysis shows that the characteristics of Bc-PCM in TBc-PCM were not changed after impregnation process. Thermal property analyses revealed that Bc-PCM showed a higher heat capacity and enthalpy value compared to TBc-PCM. Thermal conductivity analysis showed that TBc-PCM exhibited a 378% increase in the thermal conductivity compared to Bc-PCM.
  • In the building energy simulation results, when the temperature difference between room temperature and the phase change temperature was large (heating period), the PCM stored energy as sensible heat, so Bc-PCM with a larger PCM capacity is more effective in terms of energy consumption reduction. On the other hand, because PCM stores more heat energy in the form of latent heat during the cooling period, the cooling energy reduction effect was higher when TBc-PCM with high thermal conductivity was applied owing to the high heat transfer.
  • In the monthly heating and cooling load reduction analysis, the highest energy reduction effect was observed when the TBc-PCM with high thermal conductivity was applied under the condition that the latent heat performance could be maximized. In conclusion, when applying biocomposite PCM (28–30 °C of phase change temperature range), it is effective to apply TBc-PCM (High thermal conductivity) in the cooling season, and it is advantageous in terms of energy reduction by applying Bc-PCM (High latent heat capacity) to the heating season.
  • In the surface temperature change analysis, the temperature change decreased as the thickness of the PCM increased. In addition, under the condition that the PCM can maximize the latent heat storage, the Bc-PCM with a large amount of PCM showed a smaller temperature difference.
  • In the thermal comfort evaluation through the PMV index, the high thermal conductivity and the small amount of heat storage caused a sudden change in the surface temperature, which had an effect on the mean radiant temperature, resulting in a more rapid PMV change. We also found that the PMV index was closer to the comfort zone in the discomfort zone when PCM was applied. In conclusion, the application of PCM is advantageous in terms of energy reduction and thermal comfort. However, to maximize these performances, it is necessary to understand the heat storage capacity and thermal conductivity of PCMs.

Author Contributions

Conceptualization, S.-G.J. and J.L.; methodology, T.L.; validation, S.-G.J., T.L. and J.L.; data curation, T.L.; writing—original draft preparation, S.-G.J.; writing—review and editing, S.-G.J., T.L. and J.L.; visualization, S.-G.J.; supervision, J.L. All authors have read and agreed to the published version of the manuscript.

Funding

This work was partly supported by the Technology development Program of MSS (S3071188) and the Basic Science Research Program through the National Research Foundation of Korea funded by the Ministry of Education (NRF-2020R1A6A1A03044977).

Institutional Review Board Statement

Not applicable.

Informed Consent Statement

Not applicable.

Data Availability Statement

The data presented in this study are available in the article.

Conflicts of Interest

The authors declare no conflict of interest.

References

  1. Memon, S.A. Phase change materials integrated in building walls: A state of the art review. Renew. Sustain. Energy Rev. 2014, 31, 870–906. [Google Scholar] [CrossRef]
  2. Pérez-Lombard, L.; Ortiz, J.; Pout, C. A review on buildings energy consumption information. Energy Build. 2008, 40, 394–398. [Google Scholar] [CrossRef]
  3. Ramakrishnan, S.; Wang, X.; Sanjayan, J.; Wilson, J. Thermal performance of buildings integrated with phase change materials to reduce heat stress risks during extreme heatwave events. Appl. Energy 2017, 194, 410–421. [Google Scholar] [CrossRef]
  4. Pigliautile, I.; Chàfer, M.; Pisello, A.L.; Pérez, G.; Cabeza, L.F. Inter-building assessment of urban heat island mitigation strategies: Field tests and numerical modelling in a simplified-geometry experimental set-up. Renew. Energy 2020, 147, 1663–1675. [Google Scholar] [CrossRef]
  5. Piselli, C.; Prabhakar, M.; de Gracia, A.; Saffari, M.; Pisello, A.L.; Cabeza, L.F. Optimal control of natural ventilation as passive cooling strategy for improving the energy performance of building envelope with PCM integration. Renew. Energy 2020, 162, 171–181. [Google Scholar] [CrossRef]
  6. Diaconu, B.M. Thermal energy savings in buildings with PCM-enhanced envelope: Influence of occupancy pattern and ventilation. Energy Build. 2011, 43, 101–107. [Google Scholar] [CrossRef]
  7. Iten, M.; Liu, S.; Shukla, A. A review on the air-PCM-TES application for free cooling and heating in the buildings. Renew. Sustain. Energy Rev. 2016, 61, 175–186. [Google Scholar] [CrossRef]
  8. Jeon, J.; Lee, J.H.; Seo, J.; Jeong, S.-G.; Kim, S. Application of PCM thermal energy storage system to reduce building energy consumption. J. Therm. Anal. Calorim. 2010, 111, 279–288. [Google Scholar] [CrossRef]
  9. Cabeza, L.F.; Castell, A.; Barreneche, C.d.; De Gracia, A.; Fernández, A. Materials used as PCM in thermal energy storage in buildings: A review. Renew. Sustain. Energy Rev. 2011, 15, 1675–1695. [Google Scholar] [CrossRef]
  10. Pandey, B.; Banerjee, R.; Sharma, A. Coupled EnergyPlus and CFD analysis of PCM for thermal management of buildings. Energy Build. 2021, 231, 110598. [Google Scholar] [CrossRef]
  11. Baetens, R.; Jelle, B.P.; Gustavsen, A. Phase change materials for building applications: A state-of-the-art review. Energy Build. 2010, 42, 1361–1368. [Google Scholar] [CrossRef] [Green Version]
  12. Sharma, V.; Rai, A.C. Performance assessment of residential building envelopes enhanced with phase change materials. Energy Build. 2020, 208, 109664. [Google Scholar] [CrossRef]
  13. Tyagi, V.V.; Buddhi, D. PCM thermal storage in buildings: A state of art. Renew. Sustain. Energy Rev. 2007, 11, 1146–1166. [Google Scholar] [CrossRef]
  14. Jeong, S.-G.; Cha, J.; Kim, S.; Seo, J.; Lee, J.-H.; Kim, S. Preparation of thermal-enhanced epoxy resin adhesive with organic PCM for applying wood flooring. J. Therm. Anal. Calorim. 2014, 117, 1027–1034. [Google Scholar] [CrossRef]
  15. Sharma, R.; Ganesan, P.; Tyagi, V.; Metselaar, H.; Sandaran, S. Developments in organic solid–liquid phase change materials and their applications in thermal energy storage. Energy Convers. Manag. 2015, 95, 193–228. [Google Scholar] [CrossRef] [Green Version]
  16. Keshteli, A.N.; Sheikholeslami, M. Nanoparticle enhanced PCM applications for intensification of thermal performance in building: A review. J. Mol. Liq. 2019, 274, 516–533. [Google Scholar] [CrossRef]
  17. Wi, S.; Chang, S.J.; Kim, S. Improvement of thermal inertia effect in buildings using shape stabilized PCM wallboard based on the enthalpy-temperature function. Sustain. Cities Soc. 2020, 56, 102067. [Google Scholar] [CrossRef]
  18. Noël, J.A.; Kahwaji, S.; Desgrosseilliers, L.; Groulx, D.; White, M.A. Phase change materials. Storing Energy 2016, 2, 249–272. [Google Scholar]
  19. de Albuquerque Landi, F.F.; Fabiani, C.; Pisello, A.L. Palm oil for seasonal thermal energy storage applications in buildings: The potential of multiple melting ranges in blends of bio-based fatty acids. J. Energy Storage 2020, 29, 101431. [Google Scholar] [CrossRef]
  20. Fabiani, C.; Pisello, A.L.; Barbanera, M.; Cabeza, L.F. Palm oil-based bio-PCM for energy efficient building applications: Multipurpose thermal investigation and life cycle assessment. J. Energy Storage 2020, 28, 101129. [Google Scholar] [CrossRef]
  21. Yu, S.; Jeong, S.-G.; Chung, O.; Kim, S. Bio-based PCM/carbon nanomaterials composites with enhanced thermal conductivity. Sol. Energy Mater. Sol. Cells 2014, 120, 549–554. [Google Scholar] [CrossRef]
  22. Wen, R.; Zhang, X.; Huang, Z.; Fang, M.; Liu, Y.; Wu, X.; Min, X.; Gao, W.; Huang, S. Preparation and thermal properties of fatty acid/diatomite form-stable composite phase change material for thermal energy storage. Sol. Energy Mater. Sol. Cells. 2018, 178, 273–279. [Google Scholar] [CrossRef]
  23. Wan, Y.-C.; Chen, Y.; Cui, Z.-X.; Ding, H.; Gao, S.-F.; Han, Z.; Gao, J.-K. A promising form-stable phase change material prepared using cost effective pinecone biochar as the matrix of palmitic acid for thermal energy storage. Sci. Rep. 2019, 9, 1–10. [Google Scholar]
  24. Wu, S.; Li, T.; Yan, T.; Dai, Y.; Wang, R. High performance form-stable expanded graphite/stearic acid composite phase change material for modular thermal energy storage. Int. J. Heat Mass Transf. 2016, 102, 733–744. [Google Scholar] [CrossRef]
  25. Amin, M.; Putra, N.; Kosasih, E.A.; Prawiro, E.; Luanto, R.A.; Mahlia, T. Thermal properties of beeswax/graphene phase change material as energy storage for building applications. Appl. Therm. Eng. 2017, 112, 273–280. [Google Scholar] [CrossRef]
  26. Fang, X.; Zhang, Z. A novel montmorillonite-based composite phase change material and its applications in thermal storage building materials. Energy Build. 2006, 38, 377–380. [Google Scholar] [CrossRef]
  27. Fang, X.; Zhang, Z.; Chen, Z. Study on preparation of montmorillonite-based composite phase change materials and their applications in thermal storage building materials. Energy Convers. Manag. 2008, 49, 718–723. [Google Scholar] [CrossRef]
  28. Zhang, D.; Zhou, J.; Wu, K.; Li, Z. Granular phase changing composites for thermal energy storage. Sol. Energy 2005, 78, 471–480. [Google Scholar] [CrossRef]
  29. Jeong, S.-G.; Jeon, J.; Seo, J.; Lee, J.-H.; Kim, S. Performance evaluation of the microencapsulated PCM for wood-based flooring application. Energy Convers. Manag. 2012, 64, 516–521. [Google Scholar] [CrossRef]
  30. Cha, J.; Seo, J.; Kim, S. Building materials thermal conductivity measurement and correlation with heat flow meter, laser flash analysis and TCi. J. Therm. Anal. Calorim. 2012, 109, 295–300. [Google Scholar] [CrossRef]
  31. Zhang, A.; Bokel, R.; van den Dobbelsteen, A.; Sun, Y.; Huang, Q.; Zhang, Q. An integrated school and schoolyard design method for summer thermal comfort and energy efficiency in Northern China. Build. Environ. 2017, 124, 369–387. [Google Scholar] [CrossRef]
  32. Park, J.H.; Berardi, U.; Chang, S.J.; Wi, S.; Kang, Y.; Kim, S. Energy retrofit of PCM-applied apartment buildings considering building orientation and height. Energy 2021, 222, 119877. [Google Scholar] [CrossRef]
  33. Fanger, P.O.; Melikov, A.K.; Hanzawa, H.; Ring, J. Turbulence and draft. The turbulence of airflow has a significant impact on the sensation of draft. ASHRAE J. 1989, 31, 18–25. [Google Scholar]
  34. Fanger, P. Moderate Thermal Environments Determination of the PMV and PPD Indices and Specification of the Conditions for Thermal Comfort; ISO 7730 1984; International Organization for Standardization: Geneva, Switzerland, 1984. [Google Scholar]
  35. Chowdhury, A.A.; Rasul, M.; Khan, M.M.K. Thermal-comfort analysis and simulation for various low-energy cooling-technologies applied to an office building in a subtropical climate. Appl. Energy 2008, 85, 449–462. [Google Scholar] [CrossRef]
  36. Ekici, C. Measurement uncertainty budget of the PMV thermal comfort equation. Int. J. Thermophys. 2016, 37, 48. [Google Scholar] [CrossRef]
  37. International Organization for Standardization. ISO 7730: Ergonomics of the Thermal Environment: Analytical Determination and Interpretation of Thermal Comfort Using Calculation of the PMV and PPD Indices and Local Thermal Comfort Criteria; International Organization for Standardization: Geneva, Switzerland, 2005. [Google Scholar]
  38. Jeong, S.-G.; Chang, S.J.; We, S.; Kim, S. Energy efficient thermal storage montmorillonite with phase change material containing exfoliated graphite nanoplatelets. Sol. Energy Mater. Sol. Cells 2015, 139, 65–70. [Google Scholar] [CrossRef]
  39. Evola, G.; Marletta, L.; Sicurella, F. A methodology for investigating the effectiveness of PCM wallboards for summer thermal comfort in buildings. Build. Environ. 2013, 59, 517–527. [Google Scholar] [CrossRef]
Figure 1. Schematic diagram of the research.
Processes 09 02191 g001
Figure 2. FTIR analysis of Bc-PCM and TBc-PCM.
Processes 09 02191 g002
Figure 3. Heat storage analysis of Bc−PCM and TBc−PCM.
Processes 09 02191 g003
Figure 4. Enthalpy properties of Bc-PCM and TBc-PCM.
Processes 09 02191 g004
Figure 5. Thermal durability analysis of Bc-PCM and TBc-PCM.
Processes 09 02191 g005
Figure 6. Monthly reduced (a) heating and (b) cooling energy load for four cities.
Processes 09 02191 g006aProcesses 09 02191 g006b
Figure 7. Monthly reduced (a) heating and (b) cooling energy load for four cities.
Processes 09 02191 g007
Figure 8. PMV index changes in (a) Chicago during heating period and (b) Phoenix during cooling period.
Processes 09 02191 g008aProcesses 09 02191 g008b
Table 1. Geographical information for four climates.
CityLatitude (°)Longitude (°)Elevation (m)Average Temperature (°C)Average Relative Humidity (%)Average Wind Speed (m/s)Köppen Climate Classification
Chicago41.99−87.9120516.6669.983.58Dfa
Los Angeles33.94−118.41999.9870.334.56Csb
Miami25.82−80.30924.3172.544.34Aw
Phoenix33.44−111.9933722.5236.312.98BWh
Table 2. Material properties and constructions of the modeled exterior wall, partition, and roof.
Thickness (m)Thermal Conductivity (W/mK)Specific Heat (J/kgK)Density (kg/m3)Thermal Resistance (m2∙K/W)
Exterior wall
Plaster board0.030.251000900
PCM composite layerVariable
EPS (Expanded Polystyrene)0.030.04150015
Glass fiber insulation0.1550.03584012
OSB (Oriented standard board)0.0120.131700650
Air gap0.038 0.18
Cement board0.0090.2552040520.00
Partition
Plaster board0.00950.251000900
Air gap0.012 0.18
Plaster board0.00950.251000900
Roof
Plywood0.0050.152500560
PCM layerVariable
EPS 0.0750.04150015
Glass fiber insulation0.1590.03584012
OSB0.0120.131700650
Asphalt0.0030.710002100
Table 3. Material properties of plain Bc-PCM and TBc-PCM.
Thickness (m)Thermal Conductivity (W/mK)Specific Heat (J/kgK)Density (kg/m3)
Bc-PCM0.010.150Variable860
0.02
0.03
TBc-PCM0.010.568Variable860
0.02
0.03
Table 4. Annual energy consumptions and reduction rates of building models.
Heating Load (kW)
ReferenceBc-PCMTBc-PCM
10 mm20 mm30 mm10 mm20 mm30 mm
Chicago4497.494495.67
(1.82)
4441.73
(55.76)
4404.51
(92.98)
4518.26
(−20.77) 1
4474.12
(23.37)
4440.48
(57.01)
Los Angeles44.0141.16
(2.85)
31.78
(12.23)
26.96
(17.05)
45.22
(−1.21) 1
35.83
(8.18)
30.63
(13.38)
Miami0.020
(0.02)
0
(0.02)
0
(0.02)
0
(0.02)
0
(0.02)
0
(0.02)
Phoenix83.8577.58
(6.27)
57.48
(26.37)
44.73
(39.12)
81.57
(2.28)
60.35
(23.50)
46.13
(37.72)
Cooling Load (kW)
ReferenceBc-PCMTBc-PCM
10 mm20 mm30 mm10 mm20 mm30 mm
Chicago101.5196.30
(5.21)
88.12
(13.39)
83.71
(17.80)
94.12
(7.39)
85.42
(16.09)
80.10
(21.41)
Los Angeles70.2761.10
(9.17)
50.06
(20.21)
45.96
(24.31)
56.29
(13.98)
45.04
(25.23)
40.39
(29.88)
Miami587.29585.39
(1.9)
574.78
(12.51)
567.77
(19.52)
584.38
(2.91)
573.45
(13.84)
566.37
(20.92)
Phoenix737.74729.83
(7.91)
714.55
(23.19)
706.78
(30.96)
728.57
(9.17)
713.26
(24.48)
704.03
(33.71)
1 ( ) shows the reduced heating and cooling loads of the building models. Note that the (−) values indicate an increase in the heating and cooling loads.
Publisher’s Note: MDPI stays neutral with regard to jurisdictional claims in published maps and institutional affiliations.

