Abstract
In this research, foaming technology was applied to obtain powdered yogurt from commercial yogurt at lower temperatures than the typical temperatures used during the dehydration process; the viability of lactic acid bacteria (LAB) was evaluated after the application of different drying techniques (conventional drying, freeze drying, and vacuum drying). Three different formulas (F1, F2, and F3) based on a foaming agent (albumen), stabilizers (guar gum), and prebiotics sources (inulin and agave syrup) were developed. Foam stability was evaluated at different pH values through optimum time of foam (OTF), medium drainage time (MDT), and drainage volume (DV). Foam expansion (FE) and foam density (FD) were measured. The OTF ranged from 6 to 10 min. The MDT ranged from 4.3 to 27.3 min, depending on pH, while the DV varied from 14.1 to 16.2 mL only in F1. No drainage was evidenced in F2 and F3, showing the best stability. The F2 and F3 produced the best FE and FD values. The dried yogurt with different techniques showed a survival rate (SR) of up to 85% Log-CFU/mL, even with the conventional drying method. Sensorial trials were carried out in reconstituted product, with the freeze-dried yogurt showing higher scores. The foam formulas developed demonstrate the efficacy of both the dehydration of yogurt and the preservation of LAB.
1. Introduction
Trends in the development of new technologies for obtaining dehydrated products have increased in recent years; however, the applications of these technologies are often limited due to the negative effects on some physical, chemical, and sensorial characteristics of the finished product [1,2]. Different technologies have been directed toward obtaining a product that retains its characteristics. A disadvantage of dehydration is the application of temperature, depending on the nature of the raw material; as a result of this, the use of strategies that reduce the dehydration temperature and at the same time allow us to obtain a product with acceptable attributes is essential. Yogurt is a popular food around the world because it is a source of probiotics; it also possesses nutritional and therapeutic values. A disadvantage that yogurt presents is its short shelf life, which ranges between 1 and 7 days, depending on the storage conditions [3]. New technologies to enhance its shelf life have focused on the optimization of drying conditions to produce yogurt powder. A dry yogurt powder is desirable since it possesses a long shelf life and does not require high transportation costs [4]. One of the most important challenges in obtaining a dehydrated yogurt is preserving the characteristics of the probiotic, considering the benefits it provides [5]. The viability and activity of yogurt bacteria (lactic acid bacteria, LAB) are important commercial considerations for survival throughout shelf life, considering that food legislation in many countries stipulate that these bacteria must be viable and abundant at the time of consumption. The survival of these microorganisms is important to maintain the functionality of the product [6]. Several dry techniques have been evaluated regarding this application, considering factors that could affect the physicochemical, rheological, and microbiological characteristics of the final product, while aiming at preserving the characteristics of the original product as much as possible. Some techniques, such as straining, pressing or centrifugation, and ultrafiltration to remove the whey and to concentrate the total solids before drying, have been applied to facilitate the drying process; these techniques not only raise costs but also limit the efficacy of the drying techniques. Freeze drying and spray drying are the common drying methods utilized for obtaining dehydrated yogurt. Despite the losses of flavor and aroma compounds, freeze drying results in better survival of bacteria (losses ranged from 1 to 2 CFU-Log/mL), while spray drying could vary, depending on the inlet or outlet air temperatures and atomizing pressure. However, despite the efforts, the results have not been consistent because these technologies are very expensive, and the product obtained has had important nutritional and LAB losses [3]. One of the methods used for food preservation is foaming technology; this method is applied in different foods using edible foams. It is an economical alternative to produce a high-quality food powder through the proper selection of foaming method, foaming agents, and stabilizers [7]. This process can be used for the large-scale production because of its retention of nutritional quality, rapid drying at lower temperature, and easy reconstitution. In addition, this technique is cheaper than both freeze or spray drying, making it more suitable for the food industry. The development of a foaming technology based on different formulas that allows us to obtain a powdered yogurt through practical drying methods, and at the same time enables us to foment the survival of LAB in the final product, may contribute to the improvement of the drying process in the yogurt industry.
2. Materials and Methods
2.1. Yogurt
White plain commercial yogurt was purchased from retail food markets in the metropolitan area of Monterrey, Nuevo León, Mexico. Yogurt samples were kept at 4 °C until used (no more than 24 h).
2.2. Foam Formula Performance
In our formulations, a decision was made to use guar gum as a stabilizing agent; it was also decided to add other functional ingredients that provide a health benefit and act as a prebiotic for the viability of the LAB. The ingredients used for the performance of foam formula were yogurt, egg albumen (EA) (foaming agent; PIASA Co., Apodaca, Mexico), guar gum (GG) (as a stabilizing agent; Sigma-Aldrich, Toluca, Mexico), agave syrup (AS) (Agaviótica Co., Monterrey, Mexico), and inulin (as a prebiotic source and at the same time probiotic protectant; Agaviótica Co., Monterrey, Mexico). The concentration of each ingredient is shown in Table 1. Three formulas (F1, F2, and F3) were developed, varying the amount of guar gum. In order to establish the best formulation according to its stability, three aspects had to be determined: optimum time of foam (OTF), medium drainage time (MDT), and drainage volume (DV).

Table 1.
Ingredients of each formula for the development of the foams.
2.2.1. Optimum Time of Foam (OTF)
Before mixing the ingredients, optimum time of foam (OTF) of the egg albumen was determined by preliminary assays mixing 3% of egg albumen in water (w/v) at different times and pH values (4.5, 7.0, 7.2) at room temperature; the pH was adjusted with 2 N HCl [8]. This analysis was carried out to determine the influence of pH on the foaming capacity of albumen. The pH range analyzed was chosen according to the possible variability of the final formulation with all its ingredients, according to Liang and Kristinsson (2005) [8] and Mounir (2018) [9]; this range (4.5 to 7.2) is the most commonly used in food systems. Briefly, 3 g of egg albumen (w/v) were mixed with 97 mL of distilled water in a foamer (Froth au Lait Inc. Mod. FNS-W, Torrance, CA, USA) at 500 rpm ranging from 0 to 20 min at different pH (4.5, 7.0 and 7.2). The mix was placed into a graduated cylinder (250 mL, Corning, NY, USA), and the volume over time was measured in milliliters. OTF was defined as the time in which egg albumen produced the maximum volume of foam.
2.2.2. Preparation of the Foam
Once the OTF was determined, three foam formulas were prepared as suggested by Krasaekoopt and Bhatia (2012) [10], with some modifications. Briefly, the guar gum (in different concentrations) was completely hydrated with distilled water constantly stirred at 500 rpm (IKA T50 Ultra Turrax). After that, the albumen powder, agave inulin powder, and agave syrup were added and mixed for five more minutes. Subsequently, the mixture was sonicated (Sonic Ruptor 250, Omni International brand) at an amplitude of 80% for 5 min. The yogurt previously homogenized at 200 rpm/5 min was added to the mixture. Then, the entire mixture was homogenized (200 rpm, IKA T50 Ultra Turrax) for five minutes. The final pH of the system was measured with a potentiometer (Hanna mod. RS232), resulting in 7.2, while the pH was adjusted to 4.5 and 7.0 with 2 N HCl to obtain three variants of each formulation [8]. Subsequently, the entire mixture was foamed for ten minutes (Froth au Lait Inc. Model FNS-W foamer). The final percentages of each ingredient for each formula are reported in Table 1.
2.3. Stability Foam Analysis
2.3.1. Medium Drainage Time (MDT) and Drainage Volume (DV)
Three different formulas varying the quantity of guar gum were developed and analyzed in order to obtain a stable foam formulation. Concentrations of guar gum were 0.25% for formula 1 (F1), 0.375% for formula 2 (F2), and 0.5 for formula 3 (F3) (Table 1). Once each formula was prepared, the Medium Drainage Time (MDT) was determined by placing the foam into a graduated cylinder (50 mL). MDT was measured as a function of the time in which the separation of phases began in a maximum time of 1 h [9]. For the Drainage Volume (DV), 50 mL of the foam was poured into a Buchner filter (80 mm diameter) and placed in a 50 mL graduated cylinder. The volume of fluid drained in a time of 60 min is reported as the DV [11].
2.3.2. Foam Expansion (FE)
The expansion indicates the ability of foam to incorporate air into its structure. Since no significant differences in MDT and DV were evidenced in F2 and F3 in the different pH, this assay was carried out only in the final natural pH of the system for each formula (7.2). This was determined using the method described by Krasaekoopt and Bhatia (2012) [10] as follows:
where V1 = final volume of yogurt foam (cm3); V0 = initial volume of yogurt (cm3).
Foam expansion = [(V1 − V0)]/V0] × 100
2.3.3. Foam Density (FD)
The foam density analyses were carried out according to Abbasi and Azizpour (2016) [11], with slight modifications. First, 50 mL of the foam were placed in a 50 mL graduated cylinder at room temperature (22–25 °C) to later weigh the samples and calculate the FD with the following formula:
FD = [Foam weight (g)]/[Foam volume (cm3)].
2.4. Yogurt-Foam Drying
Once a stable foam formulation was obtained, it was dried by three different methods: conventional method (tunnel), vacuum, and freeze drying. Using the Abbasi and Azizpour method (2016) [11], with some modifications, the conventional method was carried out in a commercial hot air tunnel drier. The drier (Procom Mexico, Model LO2001) consisted of a tunnel with an electrical heater, and constant air speed (1.1 m/s), as measured by an anemometer (Testo 405, Testo AG, Lenzkirch, Germany). The temperature was controlled at 47 ± 2 °C. The foams were scattered in metal trays with a final thickness of 0.5 cm. The trays were placed in the tunnel drier for approximately 4 h. The vacuum-drying method was performed in an oven at 47 °C ± 2 °C with a controlled, constant pressure of 65 mm Hg. The foams were placed in the same way mentioned above and remained there until they were completely dried (4 h approximately). The freeze-drying method was carried out in a freeze drier (Telstar HT-40) according to manufacturer’s instructions. Briefly, 20 mL of the produced yogurt foam were placed in vials of 50 mL and frozen to −80 °C for 24 h. The samples were subsequently freeze dried in the freeze drier operating at −45 °C in the condensation chamber under vacuum and a pressure of 0.09 mbar for 24 h or until complete desiccation. After drying, a yogurt powder was obtained through each method, and was then vacuum-packed in a plastic bag. Each package was stored at room temperature (20 °C) for further analyses.
2.5. Viability of Lactic Acid Bacteria (LAB) in Powdered Yogurt
The determination of LAB viability in the rehydrated powdered yogurt was conducted according to the method mentioned by Li et al. (2012) [1]. Briefly, one gram of rehydrated powdered yoghurt was diluted with 9 mL of 0.85% sterile saline solution and was mixed uniformly with a vortex mixer. Appropriate serial dilutions were made prior to pour plating in duplicate onto De Man Rogosa-Sharpe media (MRS, DBBL-Difco, Becton & Dikinson). The plates were incubated in a CO2 cubette at 37 °C/48 h. The average counts were calculated from plates of 30 to 300 colonies, and the results were expressed in CFU/g of the sample. Survival rate (SR) was calculated according to Izadi et al (2014) [12], with some modifications.
where No is the number of bacteria in yogurt before drying and N after drying.
% SR = [Log N / Log No)] × 100
Viability of LAB during Storage of Powdered Yogurt
After drying, the powdered yogurt was vacuum-packed (High vacuum-Torrey, MOD. EVD-4) under sterile conditions (sterile bag) and stored at a temperature of 20 °C. In order to evaluate the viable LAB cells over time, plate counts were performed as mentioned above [1] over a period of eight months (240 days, at intervals of 30 days). All determinations were performed in triplicate. Fresh yogurt was used as control.
2.6. Rehydration Analysis
The rehydration of yogurt was conducted according to the Kadam and Balasubramanian method (2011) [13], with some modifications. Briefly, the moisture of the sample (fresh yogurt) was determined. After that, preliminary assays were conducted by adding the respective quantity of water to its original moisture content. Since the procedure was intended to obtain a hydrated formulation, very similar to the original yogurt, the amounts of water were modified according to the viscosity measurement.
2.6.1. Determination of the Viscosity of Rehydrated Yogurt
In order to determine the amount of water that is suitable to obtain the viscosity most similar to that of the commercial reference yogurt, a rotational test was performed using a ReolabQC rheometer (Anton Paar, Graz, Australia) to measure the rheological parameters of the rehydrated yogurt. The consistency coefficient (k) and flow behavior index (n) of the rehydrated yogurt were obtained as a function of the shear rate (1–100 s−1) with CC-27 geometry at a temperature of 25 °C [14].
2.6.2. Chemical Composition of Rehydrated Yogurt
The chemical composition of the rehydrated yogurt was determined. The commercial and reconstituted (85% water) yogurt samples were analyzed. These analyses were carried out in triplicate using the methodologies established by the A.O.A.C (2000) [15], which were moisture, ash, protein, fat, nitrogen-free extract (ELN), and total sugar.
2.7. Sensory Evaluation
According to the results obtained from viscosity, the rehydrated yogurt with 85% water showed a greater resemblance to commercial yogurt. Therefore, this sample was used for the overall acceptability test. The sensory evaluation was carried out by means of an affective test of the yogurt reconstituted from powdered yogurt obtained from the three drying methods. The product was evaluated by a hedonic test to measure the acceptability level based on four attributes: appearance, smell, taste, and texture. The panelists were untrained, in an age range of 18–24 years. Panelists evaluated each attribute with a code generated on a scale of 0 to 10, in which 0 indicates “Do not like it at all” and 10 indicates “Like it very much”. The order of presentation of the samples was balanced and presented in transparent vessels with a capacity of 15 mL using 3-digit random codes in a balanced presentation [16].
2.8. Statistical Analyses
All measurements were performed in triplicate, and ANOVA was performed with a confidence level of 95% (p ≤ 0.05) using SPSS 20 software (IBM, SPSS Inc., Chicago, IL, USA). In order to determine the statistically significant difference between values, a one-way variance analysis and a Tukey test were performed.
3. Results and Discussion
3.1. Foam Performance and Stability
3.1.1. Optimum Time of Foam (OTF)
During the development of a foam formulation, it is important to maintain its stability. According to Abbasi and Azizpour (2016) [11], the stability of the foam is necessary for rapid drying and good quality of the resulting product. This stability is influenced by the interactions among foaming and stabilizer agents. Egg albumen (EA) possesses excellent properties for foaming due to its large amount of protein and its ability to incorporate air [17]. Previous studies on foam-mat drying techniques reported that 3% EA is suitable to get a good foam expansion [10]; nevertheless, this foam could collapse after 20 min of whipping. Additionally, the pH could exert an effect on the EA foam expansion [9]. To establish these parameters, the OTF for albumen was performed at different pH (4.5–7.2). Results are presented in Table 2 and are reported in millimeters (mm). The maximum foam expansion of EA was visibly evident in the range of 6 and 10 min, with no significant differences; this includes the range of pH observed (4.5–7.2). After 10 min of whipping, the foam begins to decrease, the pH being 7.2, which showed the minor value (42.3 ± 0.5). These results are in agreement with Krasaekoopt and Bhatia (2012) [10], who reported the best expansion in the range of 9 to 12 min with 3% EA. Therefore, we expect an optimal performance of albumen in this pH range when it is incorporated into the formulation.
Table 2.
Optimum time of foam (OTF) of 3% aqueous egg albumen solution.
3.1.2. Medium Drainage Time (MDT) and Drainage Volume (DV)
According to Jangam and Mujumdar (2010) [18], the stability of the system is influenced by interactions between foaming agents, stabilizers, and other ingredients added to the foam formula. The concentration of both the ingredients and stabilizers used in the foaming process is very important for the foam stability; the quality of the foam will depend on the nature of the product to be processed. Stabilizers such as glycerol monostearate (GMS), xanthan gum (XG), and methylcellulose (MC) have been used in different formulations and the concentrations reported are in the ranges of 0.25–0.75% [7,10]. Based on these data, we developed three different formulations (F1, F2, F3) incorporating guar gum as a stabilizer in concentrations ranging from 0.25% to 0.5%. Additionally, ingredients such as inulin (1% p/v) and agave syrup (1% v/v) were added to the formulation as a prebiotic source (see Materials and Methods section, Table 1). The final pH of the system was 7.2 and was modified for each formulation to 4.5 and 7 (see Material and Methods, Section 2.2.2). Foam stability can be measured by the presence of drainage over a period of time (MDT) as well as by the amount of drainage (DV). All the formulas (F1, F2, F3) were tested on these parameters. The results of MDT showed that F1 presented an MDT ranging from 4.3 ± 1.5 to 36 ± 3.6 min, depending on pH; the pH 4.5 being the one that presented drainage in the shortest time. On the other hand, F2 and F3 did not show drainage within 60 min for any pH value (Table 3). The DV was determined as a function of the amount of drainage in a time interval of 60 min. F1 presented DV values ranging from 14.1 ± 2 to 16.2 ± 2.1 mL, representing approximately 28–32% of drainage. Moreover, no significant differences were evidenced for any pH value in F1 (Table 4). On the other hand, the F2 and F3 showed a minimum drainage (less than 1 mL). Other studies have reported a minimum drainage volume in various foam formulations, depending on the type and concentration of stabilizers, including Bael foam-methylcellulose (1.5 mL) [19], cherry foam-methylcellulose (3.3 mL) [11], shrimp foam-xanthan gum (0–8 mL) [7], and yogurt foam-methylcellulose (0 mL) [10]. In general, drainage decreases when the amount of stabilizer is increased. As a result, a more stable foam is obtained. According to Abbasi and Azizpour (2016) [11], the amount of drainage is also naturally dependent on the viscosity of the liquid phase, which can always be increased by adding the concentrator agents. The tendency observed in our results agrees with these previous reports; the greater the amount of GG is, the greater the stability obtained. According to Sangamithra et al. (2015) [7] and Mounir (2018) [9], the foams that do not collapse in one hour are considered stable and optimal for drying. Based on these data, F2 and F3 are considered stable and feasible for drying. Since there were no significant differences in MDT and DV values for F2 and F3 regardless of pH, we select the pH of the final system (7.2) for further analyses.
Table 3.
Medium Drainage Time (MDT) in a maximum time of 60 min of the different foam-based formulations.
Table 4.
Drainage Volume (DV) in 60 min.
3.1.3. Foam Expansion (FE) and Foam Density (FD)
The quality of the foam, which depends on the type of foaming agents or stabilizers such as polysaccharides or gums [9], can be evaluated throughout foam expansion (FE) and foam density (FD). In our formulation, we used EA as a foaming agent, and GG as a foaming and stabilizer agent, and we added inulin and AS as prebiotic sources. Table 5 shows the percentage of foam expansion of each formulation at the final pH (7.2). The FE is the result of the air incorporated during foaming, which will allow it to dry with higher quality in a short period of time. The maximum expansion values were evidenced in F2 and F3 (81.9 ± 4.7 to 78.6 ± 2.7%, respectively), while F1 produced a lower value (19.7 ± 2.7%). The FD is another important parameter for evaluating whipping properties (Table 5). As more air is incorporated during foaming, major expansion and lower values of FD are observed [10]. Our results show FD values ranging from 0.822 ± 0.01 to 0.547 ± 0.03 g/cm3. Significant differences in FD values (p ≤ 0.05) were evidenced only for F1 compared with F2 and F3; the major FD being for F1 and the minor for F2. According to Bag et al. 2011 [19], low FD values are desirable, as they indicate a high incorporation of air and improved drying rates. Previous reports mention that the optimal FD ranges for good drying are 0.2–0.6 g/cm3. The FD of formulations 2 and 3 are in that range, while F1 is out of the optimal range. In addition, this last formulation exhibits drainage (Table 4 and Table 5). Our results are similar to those reported by Krasaekoopt and Bhatia (2012) [10], who reported a maximum expansion in yogurt foam of 70% and a density of 0.69 g/cm3 using 3% albumen and 0.5% methylcellulose as a stabilizer. On the other hand, high FD values affect the drying rates, increasing the time and decreasing the quality of the product obtained [9]. Although F2 and F3 were stable, they were not significantly different (p < 0.05) for DV, FD, and FE values. Under these circumstances, F2, which had good stability, the lowest amount of GG, and feasible values of FD and DV, was selected for further experiments based on economic reasons.
Table 5.
Foam expansion and foam density of the formulations at final pH of the system (7.2).
3.2. Viability of LAB in Powdered Yogurt: Survival Rate (SR) and Storage Survival (SS)
Since LAB have been associated with health benefits, the number of survivors as a function of survival rate (SR) after the drying process in powdered yogurt is very important. Some researchers have reported that survival depends on several factors, such as drying temperatures, yet it also depends on the initial counts of the product before drying [3]. The initial inoculum in fresh yogurt before drying was in ranges of 9.2 to 9.6 Log-CFU/g, since LAB losses in a range of 0.5 to 3 Log-CFU/g have been reported, and a minimum limit of 6.0 Log-CFU/g is recommended for probiotic products; a good SR of LAB in the dried product is expected. With respect to this, Koc et al. (2010) [20] reported a better survival ratio in spray-dried yogurt at an outlet temperature of 60 °C with losses of approximately 1 log with final counts ranging from 106 to 107 (≈88% SR). They reported major LAB losses with increasing outlet air temperatures due to the thermal degradation of microorganisms. Bielecka and Majkowska (2000) [21] reported ≈70% survival (CFU/mL) in spray-dried yogurt at outlet temperatures of 60 °C, and the bacterial population was decreasing in the final product with increasing temperature. On the other hand, Krasaekoopt and Bhatia (2012) [10] reported a minimal loss of 0.5 Log-CFU (≈96% of SR) in mat-dried yogurt in oven at 60 °C, with counts ranging between 107 and 108 CFU/g in the final product. In our study, the foam mat of yogurt was dried by three methods (tunnel at 47 °C, vacuum at 47 °C, and freeze drying at a condenser temperature of −45 °C). Our results showed an SR ranging from 85 to 98% with counts at levels of 107 to 109 CFU/g in the final product, depending on the type of drying (Figure 1). The best SR was for the tunnel method with an SR of 98% (0.17 Log-CFU of loss), while the vacuum method obtained the lowest value (85%, 1.5 Log-CFU of loss). The freeze-dried method presented an SR of 93% (0.7 Log-CFU of loss). No significant differences (p < 0.05) were observed for this last method compared with the other two methods, but a significant difference was observed between the tunnel method and vacuum (Figure 1). Previous reports indicate that some techniques, such as freeze drying, could cause metabolic injury by damaging the membrane integrity of the microorganisms during the freezing process and are influenced by various factors, such as the nature and composition of their cell wall [3,22]. Even so, higher SR values have been reported in the freeze-drying technique compared with spray drying, but a major disadvantage is the cost of these two methods. In our research, the vacuum-drying method presented the lowest values of SR with a loss of approximately 1.5 Log-CFU (Figure 1); no significant differences were evidenced compared with the freeze-drying method. Ukuku et al. (2006) [23] mention that vacuum treatment could result in a significant reduction of bacteria, depending on several combinations of factors, such as temperature and exposure time, as they reported a loss of ≈1–2 Log-CFU. According to Izadi et al. (2014) [12], the minimum number of bacteria needed to provide any desired effect must be approximately 106 to107 CFU/mL; our results showed that the recovery of LAB after the drying process are in a range of 107 to 109 (SR ≈ 85 to 98%), so our foam-mat drying yogurt formulations could be an effective technique for the preservation of LAB during the drying process. Nevertheless, an additional issue of dehydrated yogurt is the survival of probiotic bacteria during storage; the powdered yogurt was vacuum packed and stored at room temperature (20 °C). Enumeration of LAB was carried out over time and reported as a function of 30-day intervals over a period of 240 days. Results are shown in Figure 2. As we can see, the viability of LAB in vacuum drying was strongly affected compared to the other two types of drying. In the vacuum-dried yogurt, the amount of LAB decreased dramatically to levels of 3.5 Log-CFU/mL at the end of storage. This could be attributed to the damage caused by the vacuum applied during drying. According to Ukuku et al. (2006) [23], vacuum treatments could affect some of the microorganisms, thus causing population decay. On the other hand, tunnel and freeze drying resulted in a total loss of ≈1.7–1.1 Log-CFU/mL with final counts in levels of 107 (7.3 to 7.4 Log-CFU/mL) at the end of storage; according to Akalin and Erişir (2008) [24], probiotic bacteria with a minimum count of 106 to 107 CFU/g in the final product is suitable. They reported a loss of 0.4 to 0.8 Log-CFU/g during 90 days of storage in probiotic ice cream with inulin and fructo oligo saccharides (FOS) added as a prebiotic source. Capela et al. (2006) [22] reported an improvement in the viability of LAB in fresh yogurt when prebiotics (inulin and/or FOS) were added. Additionally, Allegeyer et al. (2010) [25] reported a higher survival rate in yogurt beverages when inulin was added. According to our results and these previous reports, we theorize that a possible prebiotic effect caused by the addition of inulin and agave syrup in our formulation could be occurring, so new studies to corroborate this fact will be carried out.
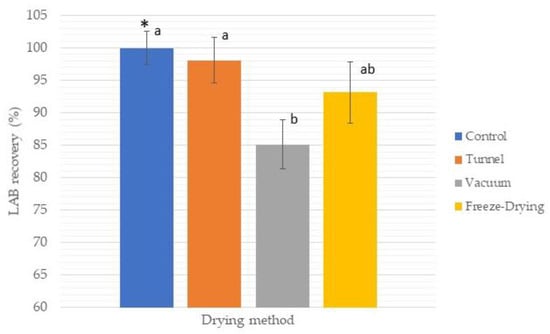
Figure 1.
Survival rate (SR) after different methods of drying (tunnel, vacuum, and freeze drying) of F2. Fresh yogurt was used as control. Average of three repetitions. * Bars represents standard deviation. Different letters (a, b) are significantly different.
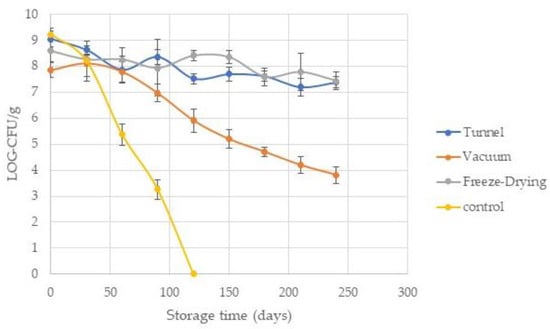
Figure 2.
LAB viability (Log-CFU/g) on powdered yogurt obtained by different drying methods as a function of storage time at 20 °C. Fresh yogurt at storage temperature of 4 °C was used as control. Average of mean values of three repetitions ± standard deviation (represented by bars).
3.3. Rehydration of Powdered Yogurt: Consistency Coefficient (k) and Flow Behavior Index (n)
The rehydration of yogurt is normally carried out based on the original concentration of total solids [20]; however, some authors mention that rheological behavior such as viscosity of the original product could change in the reconstituted product. Viscous nature is very important and is represented by consistency coefficient (k); the k values are directly proportional to viscosity (major k values, higher viscosity) and represent a stronger and more stable network structure. On the other hand, the pseudoplasticity is represented by flow index values (n), and it is inversely proportional (minor values of n, higher pseudoplasticity). An acceptable product should have certain values of k and n, depending on its nature. Hence, for the optimal rehydration of the yogurt, the parameters of k and n were evaluated in the final product. Three different reconstitutions were made (85, 83.3, and 81% water) based on the visual aspect of the reconstituted yogurt compared with the original and at the same time, in ranges nearly the same as the original moisture content of the fresh yogurt (83.92 ± 0.45%). The results presented in Table 6 correspond to the yogurt obtained by tunnel method, taking as a reference for the rehydration of the powdered yogurt obtained by the other two methods. Results showed no significant differences in the k values when rehydrated with 85% water (5.74 ± 1.10 Pa·sn) compared with commercial yogurt (Table 6). Conversely, no significant differences in n values were observed when rehydrated with 81% water (0.3595 ± 0.02 Pa·sn Table 6). Our results are in accordance with Krasaekoopt and Bhatia (2012) [10], who reported a viscosity of the rehydrated product ranging from 3.18 to 7.06 Pa·s, depending on the drying temperature. They found that there are lower values for those samples dried at temperatures higher than 60 °C and attributed these low values to the damage caused in the proteins. In our study, we dried the product at 47 °C so that damage to the proteins would be minimized. As we can see in Table 6, the k and n values are influenced by the amount of water added. The greater the amount of water, the lower the k values and higher the n values. According to Ma and Boye (2013) [26], the incorporation of water in the system reduces the viscosity and causes changes in the elastic modulus. Behnia et al. (2013) [27] reports that the higher the concentration of the product, the lower the values of n and therefore, the higher the pseudoplasticity results; this is in agreement with the results obtained in our procedures. Despite the differences evidenced in the k and n values with respect to the commercial yogurt, the values of both parameters in any of the three reconstituted products are within the ranges reported for yogurt [27,28].
Table 6.
Determination of the viscosity (k and n parameters) of rehydrated yogurt.
3.4. Chemical Composition of Rehydrated Yogurt
The chemical composition analysis was carried out for rehydrated yogurt obtained by the tunnel method (85% water), in addition to the commercial yogurt that was taken as a basis for comparison. In the production of yogurt, the formula plays an important role in the chemical composition of the final product [29]. The results obtained are shown in Table 7, indicating a significant difference for protein in rehydrated and commercial yogurt, obtaining 4.66 and 3.75%, respectively. The increase in the presence of protein may be due to the formulation to produce powdered yogurt containing EA. The CXS-243-2003 [30] for fermented milk establishes that it must contain a minimum amount of 2.7% milk protein. Likewise, in the total fat parameter, 1.30% was obtained in rehydrated yogurt and 2.65% in commercial yogurt, indicating in the same CODEX for milk fat, which must be less than 10%; within these two important parameters, rehydrated yogurt complies with the regulations, even when significant differences are observed when compared with commercial yogurt. The nitrogen-free extract portion includes the most soluble carbohydrates: sugars and starch, among others. Due to the differences in the formulation components, commercial yogurt presents 9.07% carbohydrates, presenting a significant difference with respect to rehydrated yogurt with 8.50%. The latter is made up of a base of almost 50% natural yogurt, including components such as guar gum, inulin, and agave syrup, which can reduce the amount of carbohydrates present. Qingfeng et al. (2020) [31], who studied the behavior of yogurt sweetened with different components, report 7.2% for yogurt that was only formulated with milk and the culture without adding sugars or sweeteners, increasing to 13.32% when sucrose was added to the formulation, coupled with the natural presence of lactose in milk. Considering the same for total sugars, which is mainly considered lactose as sugar coming mainly from milk, a reduction of almost 50% of this component is observed in rehydrated yogurt, being 2.45% compared to 5.15% for commercial yogurt. It is important to mention that the lactic acid bacteria present in the yogurt are viable so they continue to ferment, and the content of carbohydrates present can be variable, and therefore, these are the cause of the difference found in this parameter for the previously mentioned commercial yogurt.
Table 7.
Chemical composition.
3.5. Sensory Evaluation
Once the chemical composition of yogurt was determined, an acceptability test was performed. A sensory evaluation of the reconstituted yogurt was carried out, taking commercial yogurt as a reference. The mean of acceptability was obtained through four different attributes: appearance, smell, taste, and texture. Results of sensory evaluation are shown in Figure 3. A significant difference was evidenced among the samples obtained by different drying methods and the control sample, the latter being the one that showed greater acceptability in all attributes. The commercial yogurt showed an overall score in acceptability of 7.6, which was followed by that obtained by freeze drying and tunnel methods with values of 7.0 and 4.8, respectively, while the lowest value was for the vacuum-dried yogurt with 3.1. The smell, appearance, and flavor attributes showed the same tendency: the freeze-dried yogurt being the one with the highest scores (7.3, 8.0, and 5.5, respectively), followed by the yoghurt obtained by the tunnel method (5.8, 4.6, and 3.9, respectively), and the lowest scores were for the vacuum-dried yogurt (4.3, 1.8, and 3.1, respectively). No significant differences in scores for the texture attribute were observed between the control (7.6) and the freeze-dried yogurt (7.7). However, tunnel and vacuum drying showed lower values (5.1 and 3.0, respectively), with the same trend being observed. Krasaekoopt and Bhatia (2012) [10] reported a “moderate” level of acceptance as a result of a sensory evaluation in yogurt mat-dried by the conventional method at different temperatures (50, 60, and 70 °C); therefore, there are still more studies to be done to improve the acceptability of the product. Finally, it is necessary to consider that drying methods could impact the quality of the final product, exerting a change in some properties and sensory characteristics when rehydrated [4,32]. It is a formidable challenge to preserve the characteristics of fresh yogurt after drying. Studies to improve these formulations toward the acceptability of the rehydrated product and its similarity to the original product must be carried out.
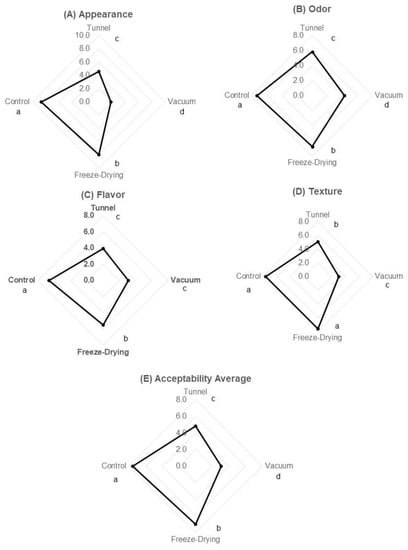
Figure 3.
Sensory evaluation of reconstituted yogurt. The figure shows scores of (A) appearances, (B) odor, (C) flavor, (D) texture, and (E) acceptability average. The yogurt obtained by freeze-drying method presented the highest score, while the one obtained by vacuum method showed the lowest. Different letters (a, b, c, d) show significant differences.
4. Conclusions
In this research, foaming technology was used to obtain dehydrated yogurt by means of three types of drying at low temperatures. Inulin and agave syrup considered prebiotics were incorporated into the formulation. It was possible to obtain stable foams with no drainage at different pH. The survival rate after drying was kept above 85%, while the storage viability was between 106 and 107 after eight months. The sensory evaluation showed that the yogurt obtained by the freeze-drying method was the most widely accepted, which was followed by that obtained from the tunnel drying method. Foaming technology facilitates drying at low temperatures and allows a dehydrated yogurt with acceptable LAB levels to be obtained so that it could be considered as functional. In addition, the chemical composition of the dehydrated yogurt showed that the nutritional characteristics were maintained in the rehydrated yogurt. The product obtained would have the advantage of not requiring refrigeration conditions, providing an alternative for the low-income population in marginalized areas; it could be used as an alternative product in disaster areas. This would represent an opportunity for the generation of new economical and nutritious products worldwide.
Author Contributions
Conceptualization, J.G.B.-G. and S.C; methodology, J.G.B.-G., S.C., K.G.G.-A.; software, C.G.-R. and C.A.A.-G.; formal analysis, C.A.A.-G., K.D.-S. and A.S.; investigation, C.T.-A., S.C. and J.G.B.-G.; resources, S.C., C.A.A.-G. and J.G.B.-G.; data curation, S.C. and C.T.-A.; writing—original draft preparation, S.C., C.T.-A. and C.G.-R.; writing—review and editing, S.C., C.T.-A. and C.G.-R.; visualization, C.A.A.-G. and K.G.G.-A.; supervision, J.G.B.-G. and S.C.; project administration, S.C.; funding acquisition, S.C. All authors have read and agreed to the published version of the manuscript.
Funding
This research was funded by SEP-PRODEP, grant number UANL-PTC-922.
Institutional Review Board Statement
Not applicable.
Informed Consent Statement
Not applicable.
Data Availability Statement
The raw data supporting this article’s conclusions will be made available, upon reasonable request, to the corresponding author.
Conflicts of Interest
The authors declare no conflict of interest.
References
- Li, C.; Wang, Y.; Li, Q.; Xu, N. Yogurt Starter Obtained from Lactobacillus plantarum by Spray Drying. Dry. Technol. 2012, 30, 1698–1706. [Google Scholar] [CrossRef]
- Qiu, L.; Zhang, M.; Tang, J.; Adhikari, B.; Cao, P. Innovative technologies for producing and preserving intermediate moisture foods: A review. Int. Food Res. J. 2019, 116, 90–102. [Google Scholar] [CrossRef]
- Kumar, P.; Mishra, H.N. Yoghurt Powder—A Review of Process technology, storage, and utilization. Food Bioprod. Process. 2004, 82, 133–142. [Google Scholar] [CrossRef]
- Koç, B.; Sakin-YIlmazer, M.; Kaymak-Ertekin, F.; BalkIr, P. Physical properties of yoghurt powder produced by spray drying. J. Food Sci. Technol. 2014, 51, 1377–1383. [Google Scholar] [CrossRef]
- Manjula, K.; Viswanath, C.; Suneetha, C. Physico-Chemical, sensory and microbial quality of yoghurt fortified with sapota pulp. Int. J. Mat. Sci. Chem. 2012, 1, 4–6. [Google Scholar]
- Sfakianakis, P.; Tzia, C. Conventional and innovative processing of milk for yogurt manufacture; Development of texture and flavor: A Review. Foods 2004, 3, 176–193. [Google Scholar] [CrossRef]
- Sangamithra, A.; Venkatachalam, S.; John, S.G.; Kuppuswamy, K. Foam Mat Drying of Food Materials: A Review. J. Food Process. Preserv. 2015, 39, 3165–3174. [Google Scholar] [CrossRef]
- Liang, Y.; Kristinsson, H.G. Influence of pH-induced unfolding and refolding of egg albumen on its foaming properties. J. Food Sci. 2005, 70, 222–230. [Google Scholar] [CrossRef]
- Mounir, S. Foam mat drying FMD. In Drying Technologies for Foods: Fundamentals and Applications: Part III. Edition: Part 3; NIPA: New Delhi, India, 2018; pp. 169–191. Available online: https://www.researchgate.net/publication/320566592 (accessed on 22 October 2021).
- Krasaekoopt, W.; Bhatia, S. Production of Yogurt Powder Using Foam-Mat Drying. Au J. Technol. 2012, 15, 166–171. [Google Scholar]
- Abbasi, E.; Azizpour, M. Evaluation of physicochemical properties of foam mat dried sour cherry powder. LWT-Food Sci. Technol. 2016, 68, 105–110. [Google Scholar] [CrossRef]
- Izadi, M.; Eskandari, M.H.; Niakousari, M.; Shekarforoush, S.; Mahammad, A.; Izadi, Z. Optimisation of a pilot-scale spray drying process for probiotic yoghurt, using response surface methodology. Int. J. Dairy Technol. 2014, 67, 211–219. [Google Scholar] [CrossRef]
- Kadam, D.M.; Balasubramanian, S. Foam mat drying of tomato juice. J. Food Process. Preserv. 2011, 35, 488–495. [Google Scholar] [CrossRef]
- Castillo, S.; Rodríguez, A.; Bautista-Villarreal, M.; García-Solano, N.; Gallardo-Rivera, C.; Báez-González, J.G.; Sánchez-García, E.; García-Alanis, K.G. Rheological and Nutritional Characterization of Sweet Corn By-Product (Cob) to Develop a Functional Ingredient Applied in Dressings. Front. Nutr. 2021, 8, 1–10. [Google Scholar] [CrossRef]
- AOAC. Official Methods of Analysis of the AOAC, 17th ed.; American Official Analytical Chemists: Washington, DC, USA, 2000. [Google Scholar]
- Espinosa-Páez, E.; Hernández-Luna, C.E.; Longoria-García, S.; Martínez-Silva, P.A.; Ortiz-Rodríguez, I.; Villarreal-Vera, M.T.; Cantú-Saldaña, C.M.C. Pleurotus ostreatus: A potential concurrent biotransformation agent/ingredient on development of functional foods (cookies). LWT-Food Sci. Technol. 2021, 148, 111727. [Google Scholar] [CrossRef]
- Hardy, Z.; Jideani, V.A. Foam-mat drying technology: A review. Crit. Rev. Food Sci. Nutr. 2017, 57, 2560–2572. [Google Scholar] [CrossRef]
- Jangam, S.V.; Mujumdar, A.S. Basic Concepts and Definitions, in Drying of Foods, Vegetables and Fruits; Jangam, S.V., Mujumdar, A.S., Eds.; TPR Group of National University of Singapore: Singapore, 2010; Volume 1, pp. 1–30. ISBN 978-981-08-6759-1. [Google Scholar]
- Bag, S.K.; Srivastav, P.P.; Mishra, H.N. Optimization of Process Parameters for Foaming of Bael (Aegle marmelos L.) Fruit Pulp. Food Bioproc. Technol. 2011, 4, 1450–1458. [Google Scholar] [CrossRef]
- Koc, B.; Yilmazer, M.S.; Balkır, P.; Ertekin, F.K. Spray Drying of Yogurt: Optimization of Process Conditions for Improving Viability and Other Quality Attributes. Dry. Technol. 2010, 495–507. [Google Scholar] [CrossRef]
- Bielecka, M.; Majkowska, A. Effect of spray drying temperature of yoghurt on the survival of starter cultures, moisture content and sensory properties of yoghurt powder. Nahr. Food 2000, 44, 257–260. [Google Scholar] [CrossRef]
- Capela, P.; Hay, T.K.C.; Shah, N.P. Effect of cryoprotectants, prebiotics and microencapsulation on survival of probiotic organisms in yoghurt and freeze-dried yoghurt. Int. Food Res. J. 2006, 39, 203–211. [Google Scholar] [CrossRef]
- Ukuku, D.O.; Fan, X.; Kozempel, M.F. Effect of vacuum-steam-vacuum treatment on microbial quality of whole and fresh-cut cantaloupe. J. Food Prot. 2006, 69, 1623–1629. [Google Scholar] [CrossRef][Green Version]
- Akalin, A.S.; Erişir, D. Effects of inulin and oligofructose on the rheological characteristics and probiotic culture survival in low-fat probiotic ice cream. J. Food Sci. 2008, 73, 1–5. [Google Scholar] [CrossRef]
- Allegeyer, L.C.; Miller, M.J.; Lee, S.Y. Sensory and microbiological quality of yogurt drinks with prebiotics and probiotics. J. Dairy Sci. 2010, 93, 4471–4479. [Google Scholar] [CrossRef]
- Ma, Z.; Boye, J.I. Advances in the Design and Production of Reduced-Fat and Reduced-Cholesterol Salad Dressing and Mayonnaise: A Review. Food Bioproc. Technol. 2013, 6, 648–670. [Google Scholar] [CrossRef]
- Behnia, A.; Karazhiyan, H.; Niazmand, R.; Mohammadi Nafchi, A. Rheological properties of low-fat yogurt containing cress seed gum. Agric. Sci. 2013, 4, 29–32. [Google Scholar] [CrossRef]
- Codină, G.G.; Franciuc, S.G.; Mironeasa, S. Rheological Characteristics and Microstructure of Milk Yogurt as Influenced by Quinoa Flour Addition. J. Food Qual. 2016, 39, 559–566. [Google Scholar] [CrossRef]
- Wang, W.; Bao, Y.; Hendricks, G.M.; Guo, M. Consistency, microstructure and probiotic survivability of goats’ milk yoghurt using polymerized whey protein as a co-thickening agent. Int. Dairy J. 2012, 24, 113–119. [Google Scholar] [CrossRef]
- CXS 243-2003. Standard for Fermented Milks; Revised; Food Agriculture Organization (FAO): Rome, Italy, 2018. [Google Scholar]
- Qingfeng, B.; Zonghao, L.; Chongwei, Y.; Xiaomeng, S.; Yunqing, J.; Jianjun, C.; Mingruo, G. Physiochemical, rheological, microstructural, and antioxidant properties of yogurt using monk fruit extract as a sweetener. J. Dairy Sci. 2020, 103, 10006–10014. [Google Scholar] [CrossRef]
- Carvalho, M.J.; Pérez-Palacios, T.; Ruiz-Carrascal, J. Physico-chemical and sensory characteristics of freeze-dried and air-dehydrated yogurt foam. LWT-Food Sci. Technol. 2017, 80, 328–334. [Google Scholar] [CrossRef]
Publisher’s Note: MDPI stays neutral with regard to jurisdictional claims in published maps and institutional affiliations. |
© 2021 by the authors. Licensee MDPI, Basel, Switzerland. This article is an open access article distributed under the terms and conditions of the Creative Commons Attribution (CC BY) license (https://creativecommons.org/licenses/by/4.0/).