Article

Effects of Chemical Properties and Inherent Mineral Matters on Pyrolysis Kinetics of Low-Rank Coals

1
CHN Energy Shendong Coal Group Co., Ltd., Yulin 719399, China
2
School of Chemical & Environmental Engineering, China University of Mining and Technology (Beijing), Beijing 100083, China
*
Author to whom correspondence should be addressed.
These authors contributed equally to this work and should be considered co-first authors.
These authors contributed equally to this work and should be considered co-second authors.
Processes 2021, 9(12), 2111; https://doi.org/10.3390/pr9122111
Submission received: 22 October 2021 / Revised: 1 November 2021 / Accepted: 3 November 2021 / Published: 24 November 2021
(This article belongs to the Topic Energy Storage and Conversion Systems)

Abstract

:
The kinetics during the pyrolysis process depend on both chemical structure and inherent mineral matters in coal, but normally, only one of these components is investigated in literature. In the present work, four low-rank coals were pyrolyzed in a thermogravimetric analyzer at a heating rate of 10 K/min in a constant nitrogen stream at a temperature up to 900 °C to study the pyrolysis behavior and kinetics. Two of the samples were raw coal (R-YL) and clean coal (C-YL) obtained through the washing process. The results showed that the coal-washing process mainly affected the inorganic part (mineral matters) and structure in coal, which did not largely change the chemical properties. The pyrolysis behavior in primary stage (before 550 °C) was mainly affected by the chemical properties of coal, while the pyrolysis behavior in higher temperature also depended on inherent mineral matters. The kinetics of four coals were obtained using the Coats–Redfern (CR) method with five theoretical models. The difference of E value was almost negligible for R-YL and C-YL, also showing that the coal-washing process did not largely change the chemical properties. The higher frequency factor A for clean coal C-YL showed a more porous structure due to the coal-washing process. The apparent activation energy E in the third stage was affected by the thermodynamic property of inherent minerals.

1. Introduction

The continued development of the world economy requires more and more energy consumption, a large part of which comes from coal, especially in China [1,2]. However, the quantity of high-rank coal is limited and the low-rank coal accounts for 55% of Chinese proven reserves [3]. The typical characteristics of low-rank coals, such as a high moisture content, low calorific value and high volatile content, restrict the direct utilization of low-rank coals. The common utilization technologies of low-rank coal include combustion, liquidation, gasification and pyrolysis. By pyrolysis process, the moisture content of low rank coal can be significantly reduced and the calorific value can be greatly increased, which can largely upgrade the quality of low-rank coal. In addition, it is also the first step in the process of combustion, liquidation and gasification. Therefore, pyrolysis is one of the most important thermal conversion processes for low-rank coal. In addition, the kinetics of coal pyrolysis has proved to be effective in providing information for mathematical modeling, which is important to describe reaction characteristics, optimize process parameters and design new reactors [4]. Important kinetic parameters including activation energy E, pre-exponential factor A and reaction order n can be obtained from kinetic analysis. Therefore, it is important to obtain the kinetic parameters and influence factors during the coal pyrolysis process.
Coal processing/washing, apart from regulating the size of the ore, physically separates the grains of valuable minerals from the gangue minerals to produce an enriched portion or concentrate, containing most of the valuable minerals and a tailing predominantly containing the gangue minerals [5]. Through coal washing, the ash content of raw coal can be obviously reduced, thus increasing the production rate during the pyrolysis, gasification or liquefaction processes. In addition, the organic chemical structure might be also changed during the coal-washing process by the addition of some chemicals such as surfactant and flotation reagents. The removed minerals and changed chemical properties would affect the experimental behavior and the kinetics, which was rarely reported.
It is known that the chemical properties have a significant effect on the pyrolysis process, since pyrolysis is a thermochemical decomposition of organic material at elevated temperatures without the participation of oxygen and a catalyst. For example, the char yield of low-rank coal was definitely higher than that of high-rank coal [6,7,8]. Casal et al. [9] studied the influence of chemical structure on the kinetics of coal pyrolysis with different coal ranks and found that kinetic parameters were correlated not only with rank but also with the infrared reactivity index and the amount of volatile matter released. Song et al. [10] reported that the chemical properties play an important role in the pyrolysis reactions and distributions of gas products, but they did not study the effects on kinetics.
Previous studies also showed that mineral matter affected the pyrolysis process. Most researchers focused on the effects of alkali and alkali earth metals (AAEM) [11,12,13] on the primary pyrolysis stage, in which volatile products, including gases and tars, were released from the particles, leaving the carbon-rich solid. The AAEM could lower the characteristic temperature and promote decomposition [14]. The alkali metals Na and K were considered to be the most effective catalytic minerals for pyrolysis process [15,16,17]. Liu et al. [18] found that CaO was active for oxygen functional groups cracking in coal to produce CO [19] and could also promote dehydrogenization from aliphatic components. Gong et al. [20] found that when the temperature was higher than 800 °C, the Fe2O3 decomposed to FeO, which produced more volatiles through the mechanism, such as those of Na and K.
In the present work, the pyrolysis behaviors of four low-rank coals, raw coal from Shendong Coal-to-Liquid Coal Preparation Plant (R-YL), clean coal of R-YL (C-YL), Neimeng (NM) and Yunnan (YN) coal, and the kinetics were investigated in a thermogravimetric analyzer (TGA). The C-YL coal was obtained by washing R-YL coal from a coal-washing plant to reduce the ash content. The aim was to investigate the pyrolysis behaviors of four low-rank coals, especially the effect of organic chemical properties and inherent mineral matters. Based on experimental data, kinetic parameters (activation energy E and the frequency factor A) for volatiles released during the pyrolysis of low-rank low coals were determined by using the Coats–Redfern method and five theoretical models.

2. Materials and Methods

2.1. Materials

Four low-rank coal samples were used in this study, raw coal from Shendong Coal-to-Liquid Coal Preparation Plant (R-YL), clean coal of R-YL (C-YL), Neimeng (NM) and Yunnan (YN) coal. The C-YL coal was obtained by washing R-YL coal from a coal-washing plant. The raw materials were pre-dried and milled to obtain a particle size of less than 10 µm. All samples were heated to 105 °C and maintained at this temperature for 24 h in an air-dried oven to eliminate the moisture. The ultimate, proximate and ash analyses of each raw sample are shown in Table 1.

2.2. X-ray Fluorescence Spectrometric (XRF) Analysis

Four low-rank coals were ashed at 815 °C in accordance with GB/T 212-2008. Then, the ashed samples were subjected to X-ray fluorescence spectrometric (XRF) analysis for determination of the major element compositions, including SiO2, Al2O3, Fe2O3, CaO, Na2O, MgO, K2O and SO3, as shown in Table 1.

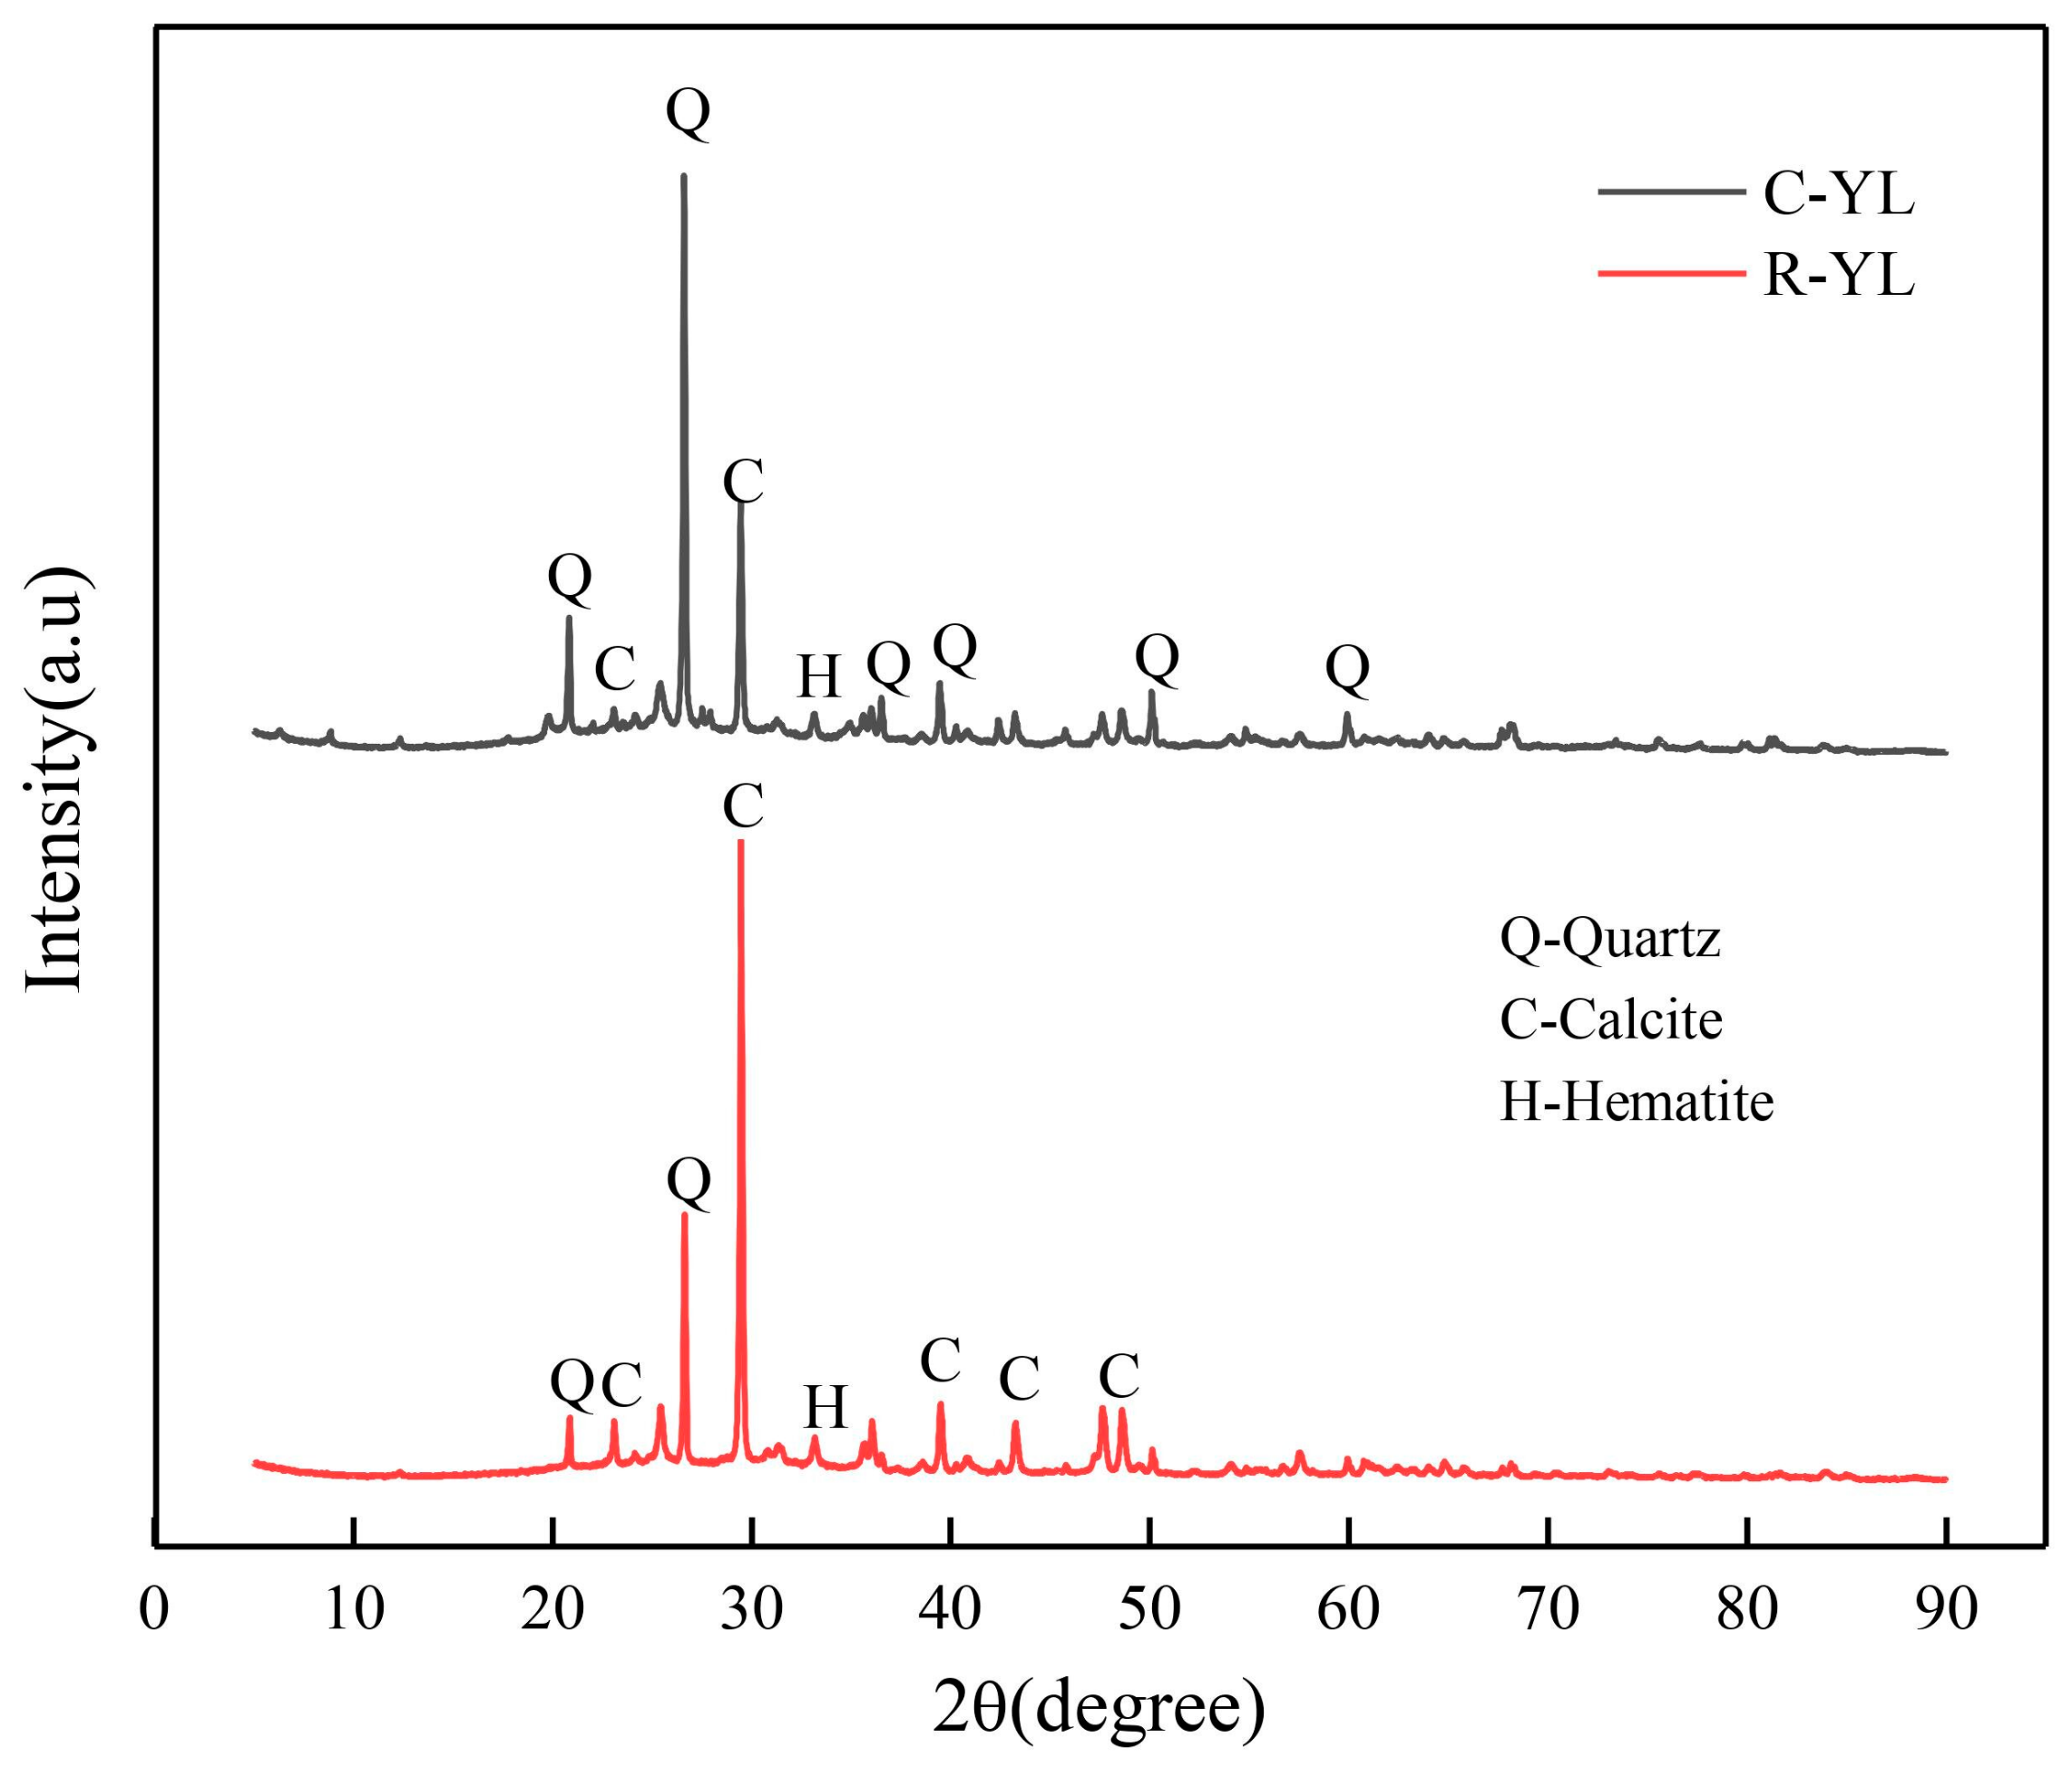
2.3. X-ray Diffraction (XRD) Analysis

Mineralogy characteristics of four low-rank coals were analyzed using X-Ray diffraction (XRD) analysis, as shown in Figure 1 and Figure 2. Low-temperature ash of coal samples was obtained by burning samples at 250 °C in muffle furnace for 60 h prior to XRD analysis. Two raw coals were analyzed using a Japanese Rigaku D/max-2500PC X-ray diffractometer (Rigaku Corporation, Tokyo, Japan) with a Cu tube. The XRD pattern was recorded over a 2θ range of 5–70° with a step size of 0.02°. The scanning speed was 2°/min. The accelerating voltage and the tube current of the X-ray diffractometer were 40 kV and 150 mA, respectively.

2.4. Diffuse Reflectance Fourier Transform Infrared Spectroscopy (DRIFTS)

Coal samples with a particle size of <0.063 mm were left to dry at 35 °C overnight before analysis. The spectra of the coals were measured using a collector diffuse reflectance accessory fitted to a Nicolet iS10 FT-IR spectrometer. A mercury cadmium telluride detector (MCT-A) that operates at a sub-ambient temperature was used for the analysis. Data were collected in the range of 400–4000 cm−1 by applying 32 scans at a resolution of 4 cm−1 to each sample, as shown in Figure 3.

2.5. Thermogravimetric Analysis

To investigate the effects of the inherent minerals on the kinetics of pyrolysis, raw coal from Shendong Coal-to-Liquid Coal Preparation Plant (R-YL), clean coal of R-YL (C-YL), Neimeng (NM) and Yunnan (YN) coals were pyrolyzed in thermogravimetric analyzer (Mettler-Toledo TGA/DSC 1) at 10 K /min from room temperature to 900 °C and atmospheric pressure. Nitrogen was used as the carrier gas (at 50 mL/min) in order to ensure an oxygen-free environment. During the process, the weight of the sample was recorded continuously as a function of time and temperature. The mass loss (TG) and the reaction rate (DTG) curves were calculated based on the weight data. The pyrolysis experiments were made 3 times for each sample to show the precision of TGA. The repeatability and reproducibility were good for all samples, at a 99% confidence level.

2.6. Evaluation of Thermogravimetric Analysis

The pyrolysis behaviors of both samples can be compared in terms of the following parameters: (1) temperature at the end of the first and second stage (T1, T2), (2) temperature at the first and second maximum reaction rate (Tmax1, Tmax2), (3) first and second maximum reaction rate (Dmax1, Dmax2) and (4) mass loss at the end of the first and second stage and the whole process (M1, M2, Mmax).

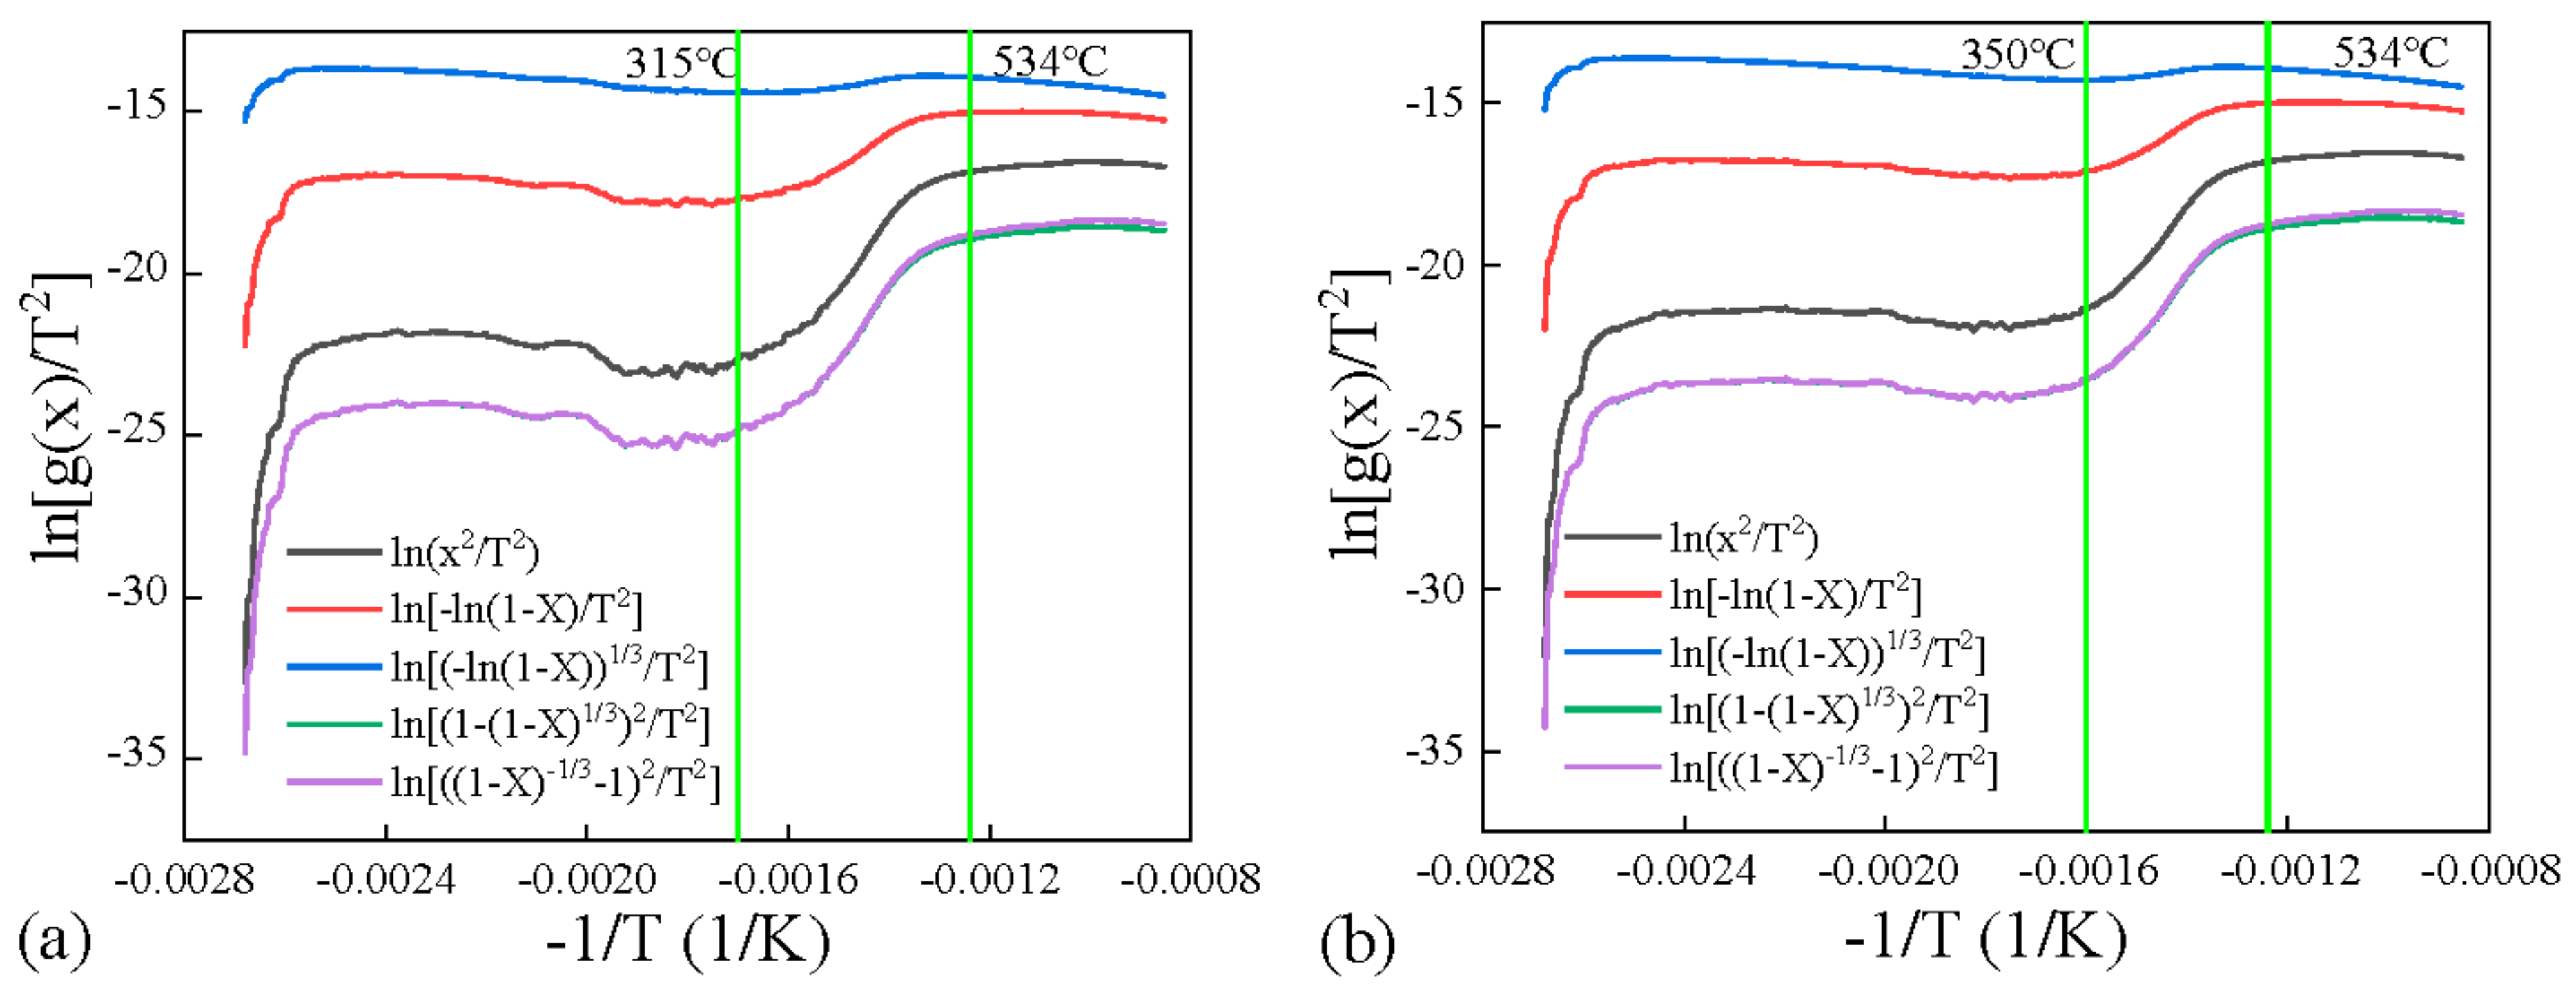
2.7. Kinetics of Pyrolysis

The reaction rate for the decomposition of a solid depends on the temperature and the amount of substance [4,21]. The rate equation for the kinetic analysis can be expressed as:
d α dt = k · f α
where k is the rate constant, f(α) represents a hypothetical model of reaction mechanism and α is the conversion of the feedstock according to Equation (2):
α = m 0 m t m 0 m f
where m0 is the initial mass of the sample, mt is the mass at time t and mf is the final mass at the end of pyrolysis. Theoretically, every kinetic model employs a rate law that follows the fundamental Arrhenius rate expression:
k = A   e x p   E R T
where T is the absolute temperature in K and R is the universal gas constant (8.31 kJ/mol), k(T) is the temperature-dependent reaction rate constant, A is the frequency factor or pre-exponential factor and E is the activation energy of the reaction.
The Coats–Redfern (CR) method [22,23] was applied in this study to obtain the volatile release kinetics for the pyrolysis of wheat straw, German brown coal and their blends. Under a constant heating rate β, Equation (3) can be rearranged to:
d α d T = A β · e x p E R T · f α
The CR method applied in Equation (4) uses a Taylor series expansion to obtain the following expression:
I n g α T 2 = I n A R β E 1 2 R T E E R T
Equation (5) can be simplified by recognizing that for usual values of E, the term 2RT/E can be neglected (2RT/E≪1). By choosing an appropriate reaction mechanism (g(α) or f(α)), a straight line can be obtained from single heating rate data by plotting ln[g(α)/T2] versus −1/T. E can be derived from the slope of the line E/R and A can be obtained from its intercept ln(AR/βE). For reaction mechanisms g(α), 5 theoretical models were used in the present study and are shown in Table 2 [8].

3. Results and Discussion

3.1. Characteristics of Raw Samples
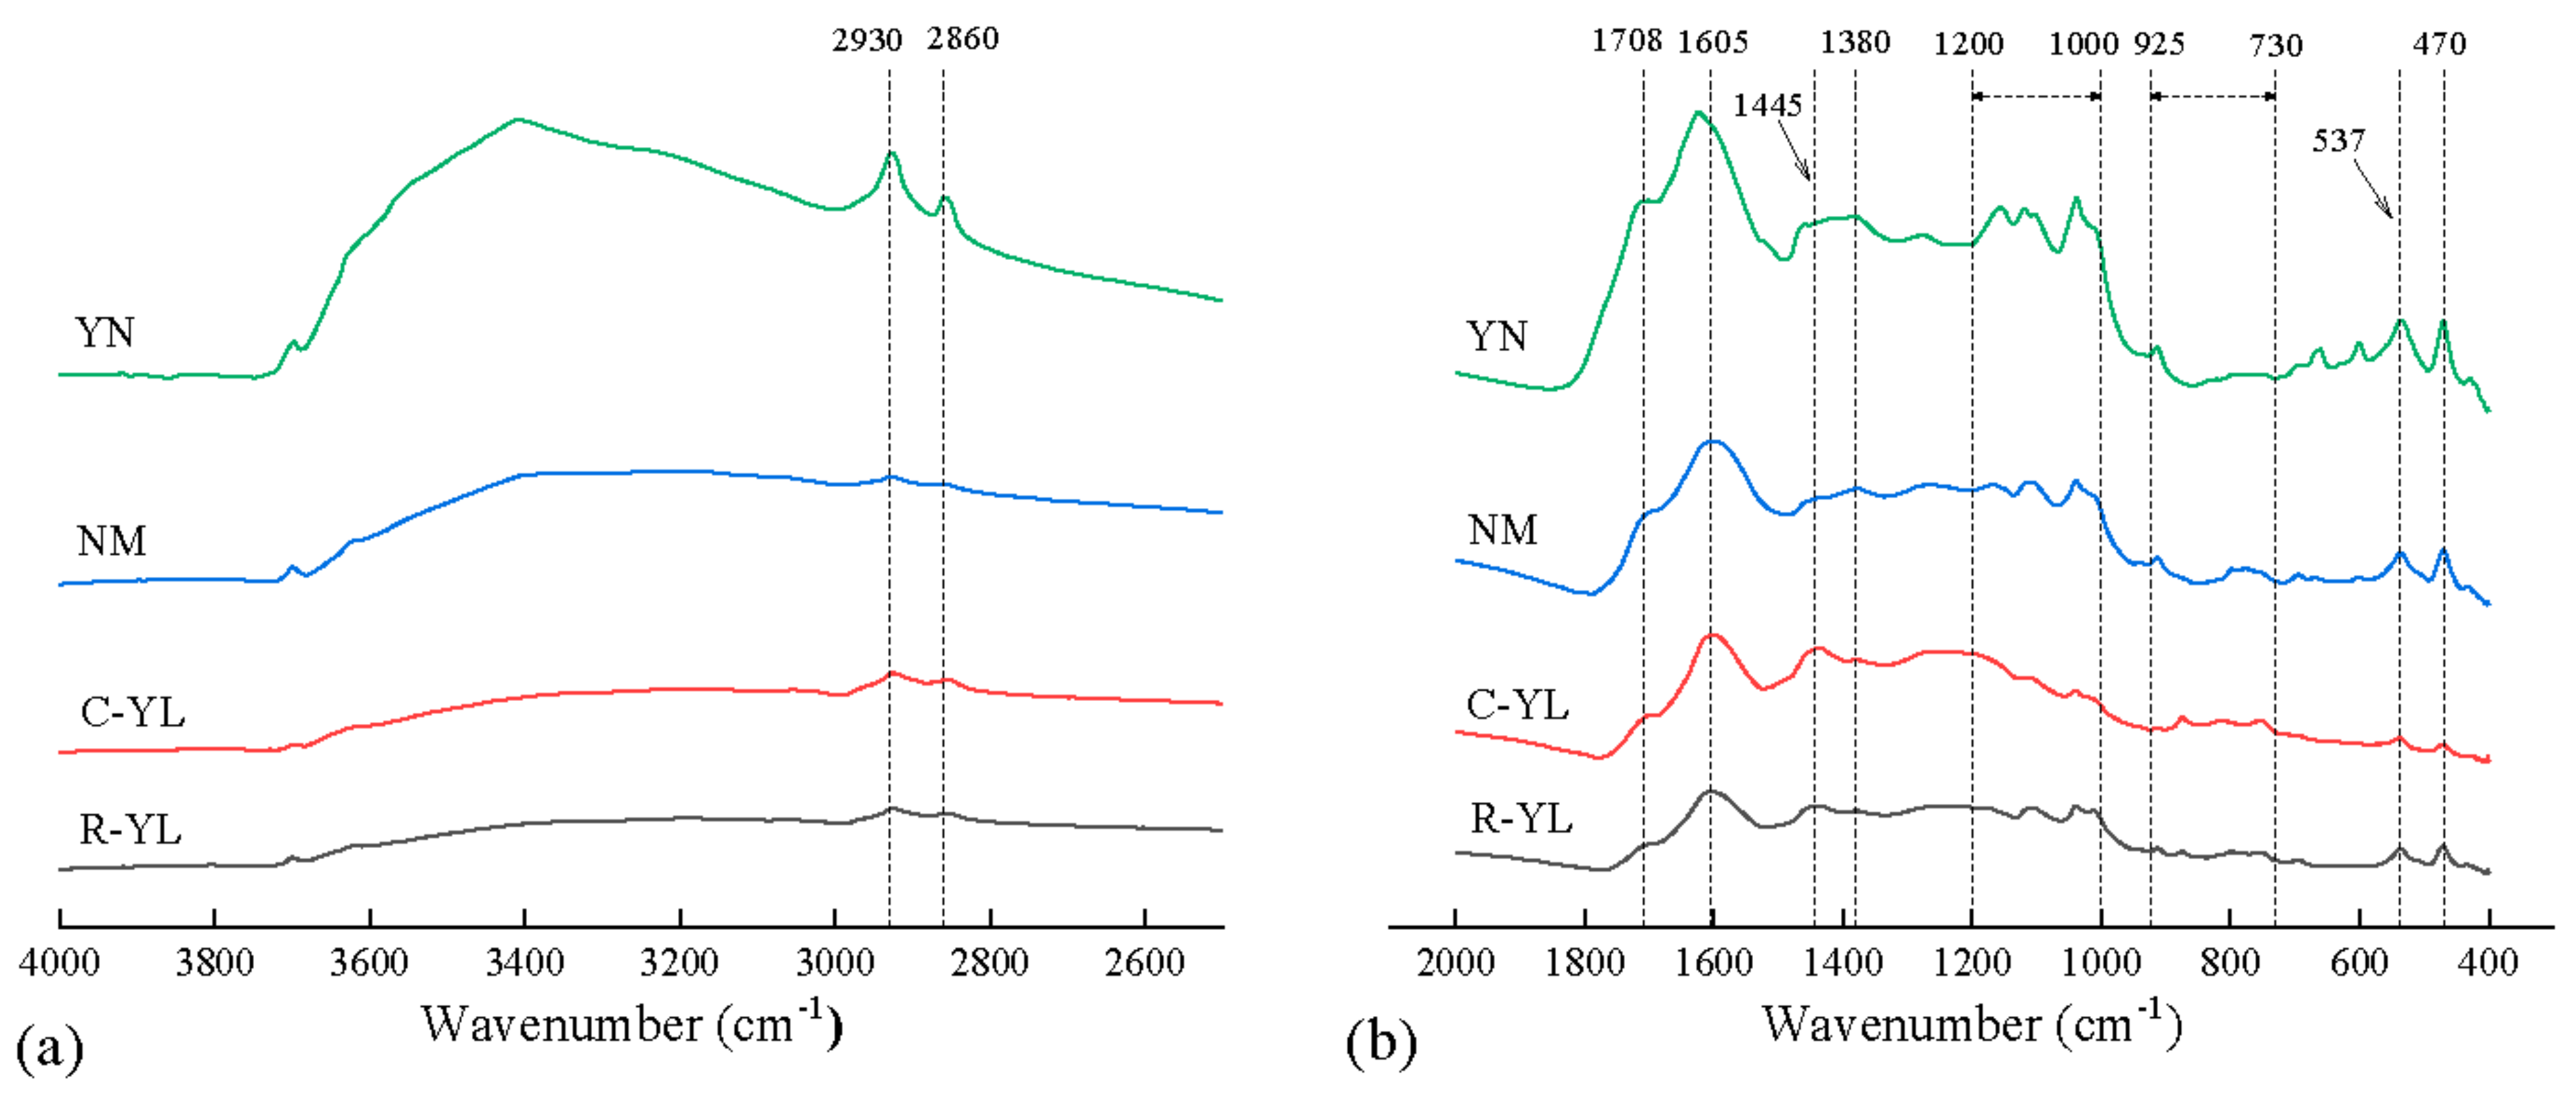
For the ultimate and proximate analysis in Table 1, the moistures of four samples were similar, around 9.5 wt.%. The volatile matter of NM and YN was (more than 50 wt.%) higher than that of R-YL and C-YL (around 45 wt.%). The ash content of YN coal was the highest (25.30 wt.%), and the ash content of YL after coal washing decreased from 9.12 to 4.69 wt.%. For proximate analysis, by washing, the fixed carbon content of clean coal C-YL increased from 77.86 for raw coal to 86.77 wt.%, and the oxygen content decreased from 16.17 to 6.73 wt.%, which should have important effects on pyrolysis process.
For the ash composition analysis in Table 1, the contents of Na2O, CaO and Fe2O3 in raw YL coal were reduced by the coal-washing process, especially CaO, which decreased from 39.29 to 18.85 wt.%. The effects of mineral matter, originally present in the carbonaceous matrix, could act as a catalyst for the pyrolysis reactions. This is mainly supposed for the alkali and alkaline earth metals, as well as calcium [18] and iron [19]. The catalytic effects caused by mineral matter can be represented by the index of basicity or the alkali index [12], where a high index of basicity indicates strong catalytic effects. It is defined in the following way:
Index   of   basicity = w A Fe 2 O 3 + CaO + MgO + Na 2 O + K 2 O SiO 2 + Al 2 O 3
where w(A) is the ash content of the sample and Fe2O3, CaO and so on represent the content of various ash compounds in oxide form. Based on this equation, the calculated basicity of raw coal R-YL was 1.92, showing high basicity. Through coal washing, the calculated basicity for clean coal decreased to 0.68, showing acidity. It was found that the coal-washing process not only reduced the ash content, but also changed the mineral composition, which would have effects on the pyrolysis process. The index of basicity for NM and YN coal was 0.60 for both, showing acidity.
For mineral matters analyzed by XRD as shown in Figure 1 and Figure 2, the main minerals in R-YL coal were quartz, calcite and hematite. After washing, the content of calcite largely decreased, in agreement with the large decrease in CaO content analyzed by XRF. YN coal contained much more pyrite, in agreement with high sulfur content. For NM coal, although the sulfur content was low, the pyrite and pyrrhotite can be detected by XRD. There were also litter kaolinite, calcite and calcium sulfate in YN coal, and gypsum and calcite in NM coal.

3.2. FTIR Analysis

The FTIR analysis was conducted to characterize the functional groups in the complex macromolecular structures of low-rank coals. The FTIR spectra of different low-rank coals exhibited similar absorption bands and characteristic absorption peaks. Figure 3 displays the infrared spectra corresponding to coals R-YL, C-YL, NM and YN. It can be seen that YN had an obvious absorption peak at 3410 cm−1, which is mainly attributed to -OH, and a small amount of N-H functional group vibration. The absorption peaks at 2925 cm−1 and 2857 cm−1 corresponding to the aliphatic CH2 antisymmetric and CH3 symmetric stretching vibration were also more obvious for YN coal. Low-rank YN coal has more aromatic oxygen-containing functional groups, such as hydroxyl and carboxyl groups, which was observed at 1708 cm−1. The content in R-YL and C-YL was approximate, though C-YL contained less oxygen. The aromatic C=C stretching absorption bands (at ca. 1600 cm−1) for C-YL was a little higher than that of R-YL, which is consistent with the higher carbon content for C-YL. The bands assigned to the aromatic C–H out-of-plane bending modes (ca. 700–900 cm−1) are inconspicuous in the spectra of the low-rank coal. This was consistent with the study by Casal [9], which showed the aromatic C–H band was only noticeable in the spectra of the bituminous coals, not in low-rank coals. Finally, the aromatic disulfide-S-S- (537 cm−1) and thiol-SH (470 cm−1), were also highest for YN. The content for raw coal R-YL was a little higher than that of C-YL, which is consistent with the sulfur content shown in Table 1, showing that the sulfur content can be deducted by the coal-washing process.

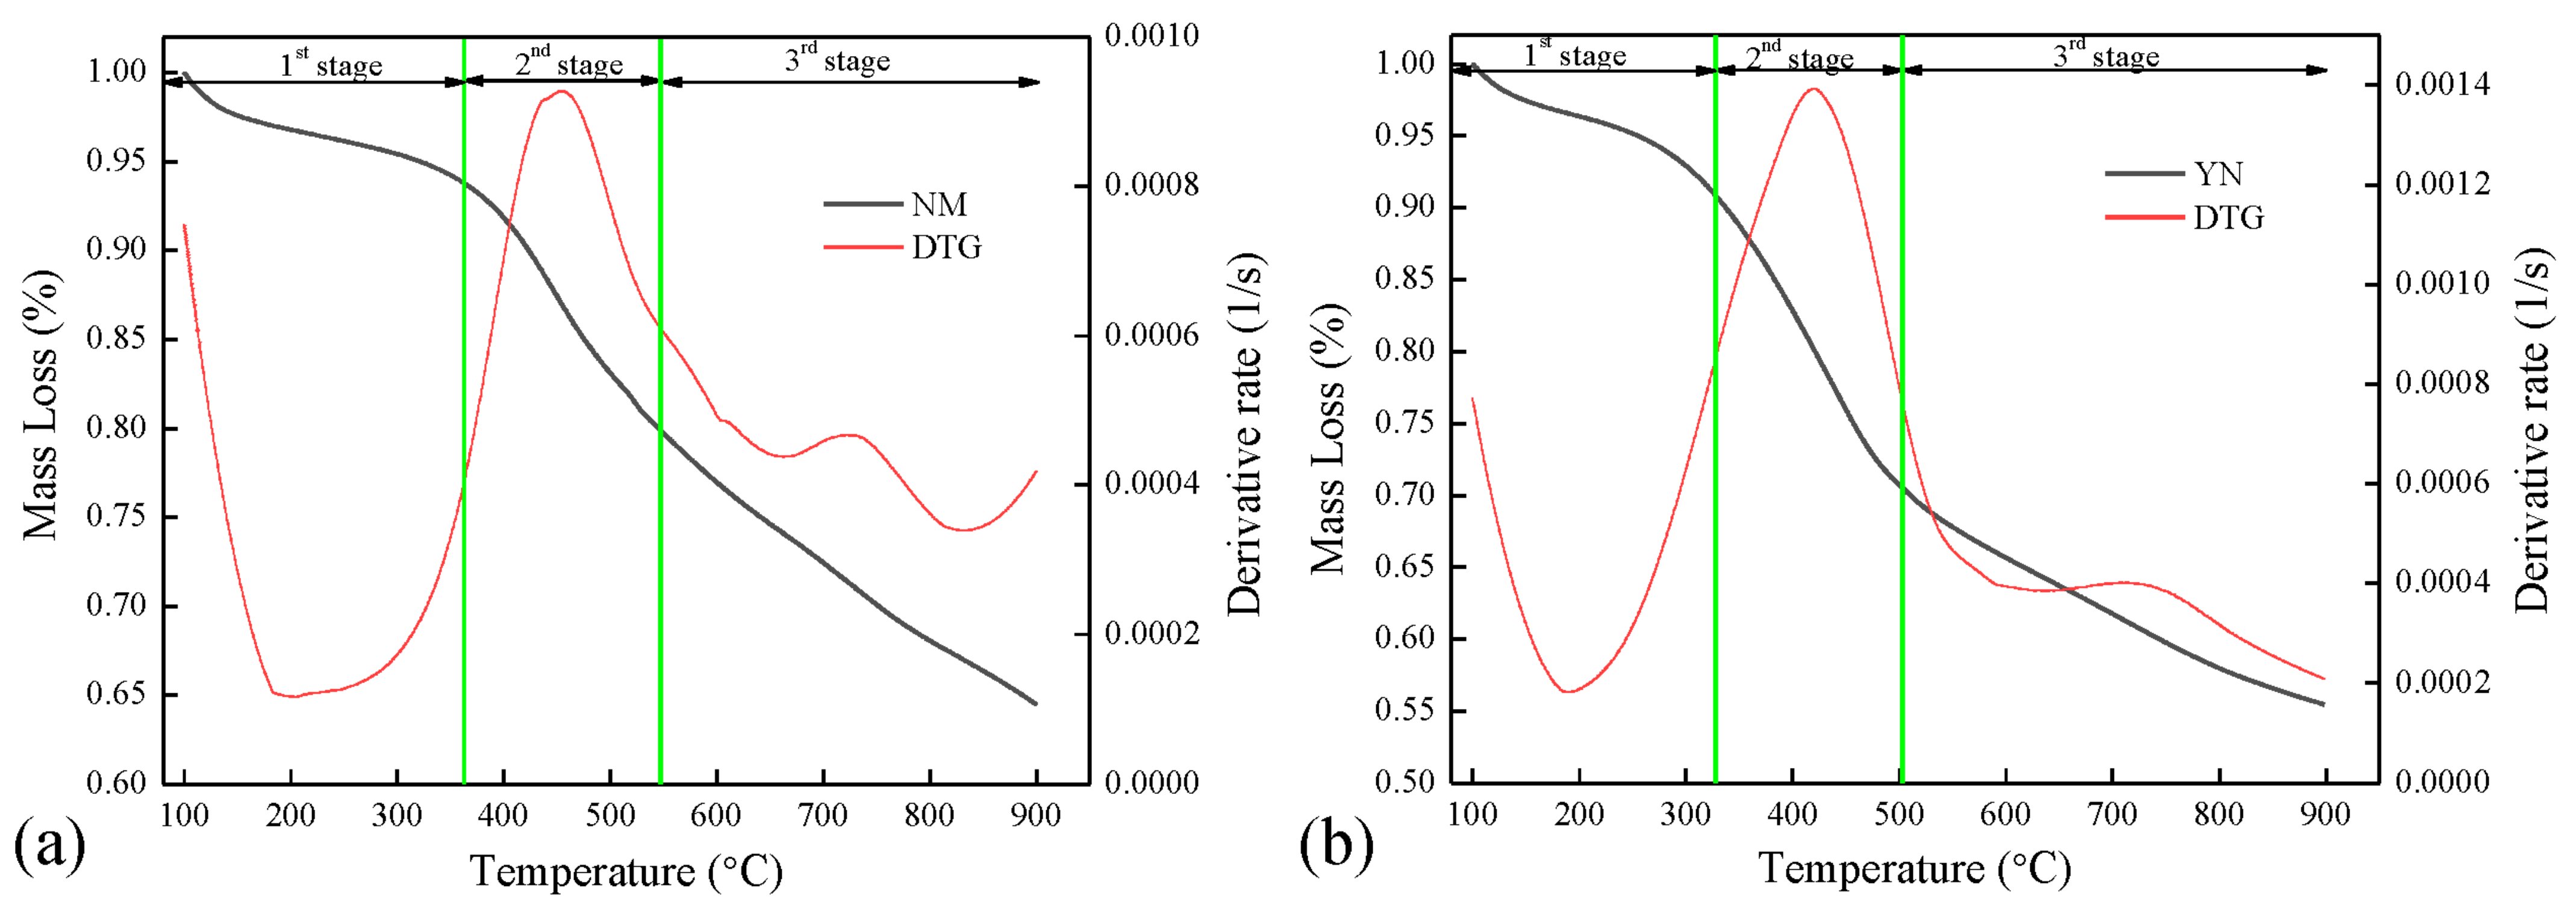
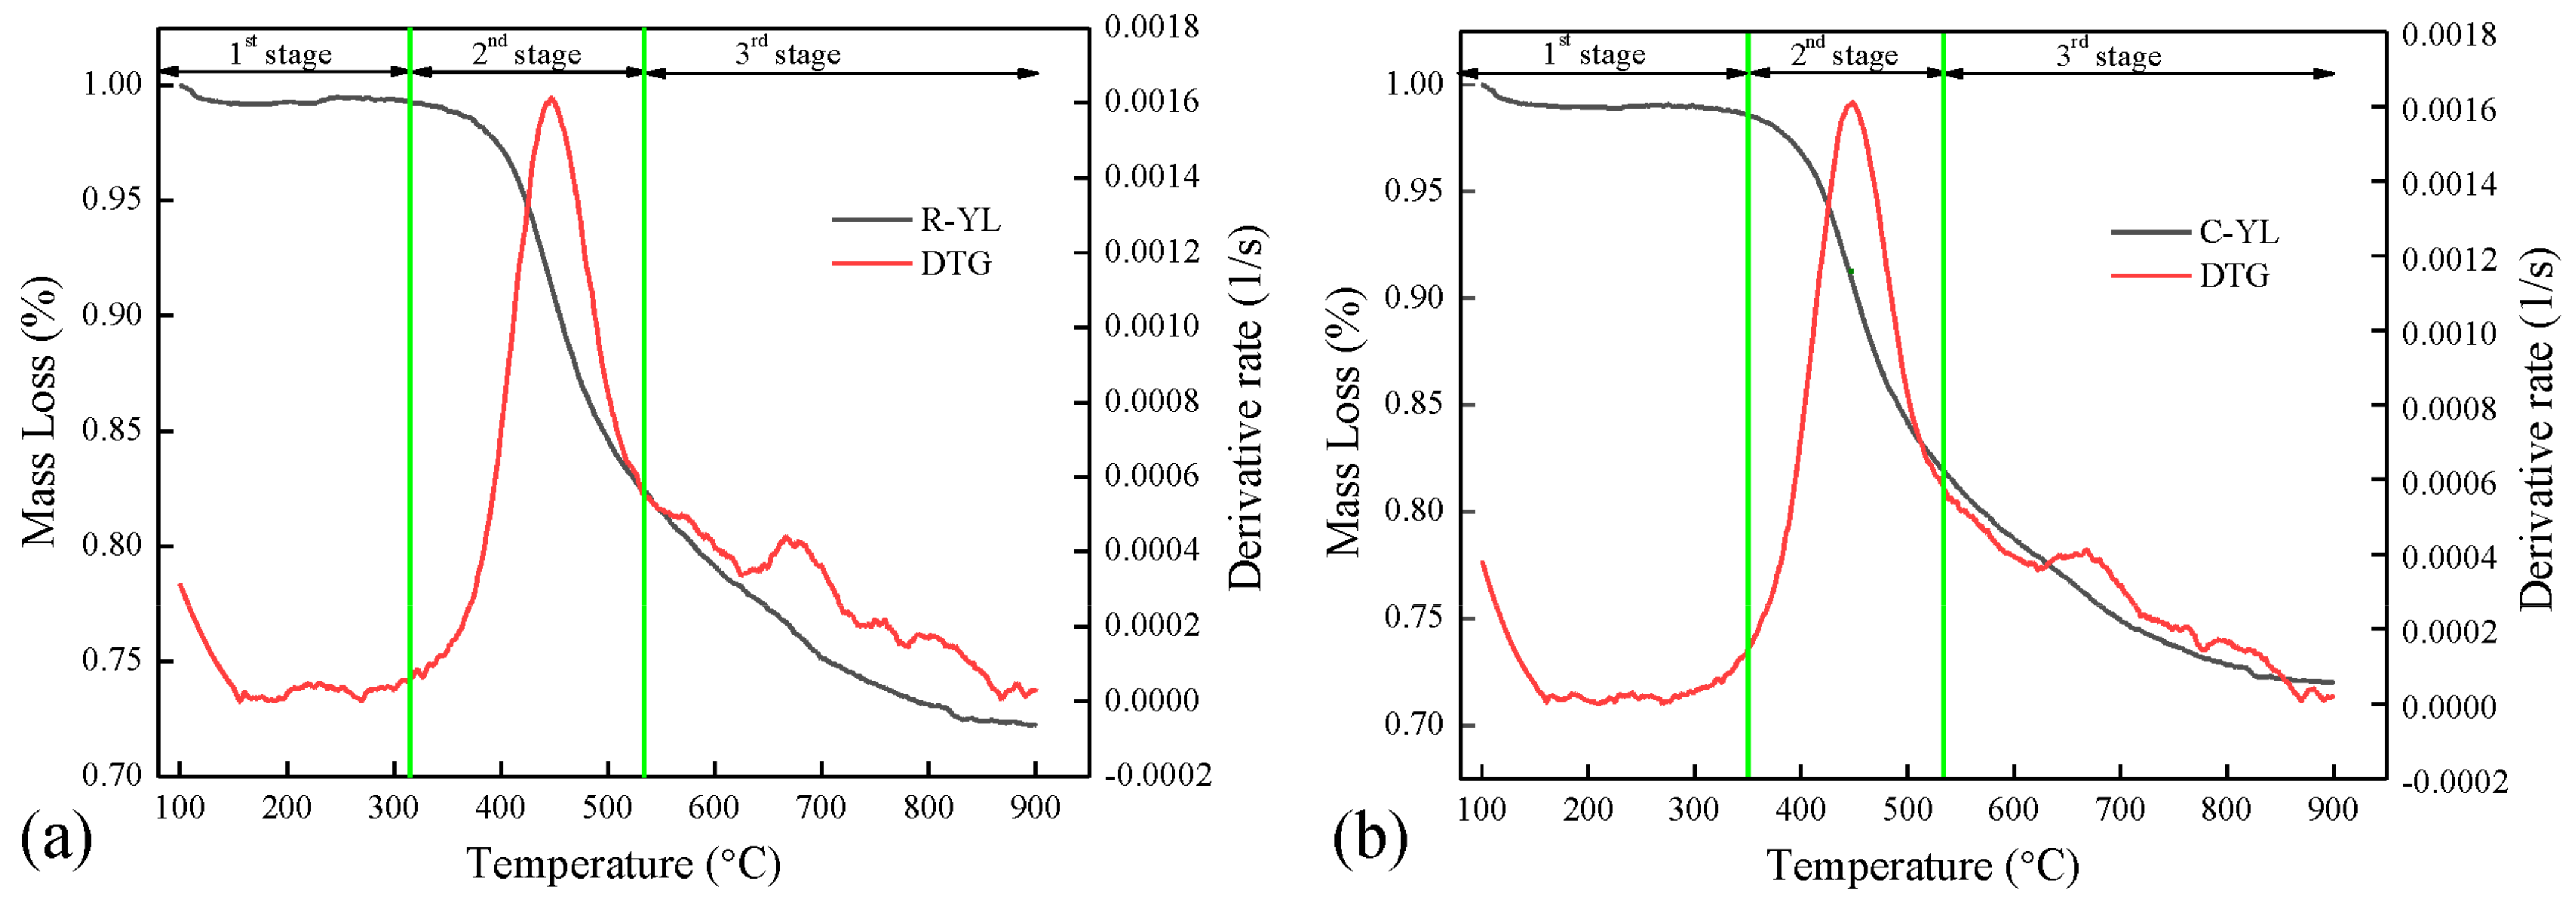
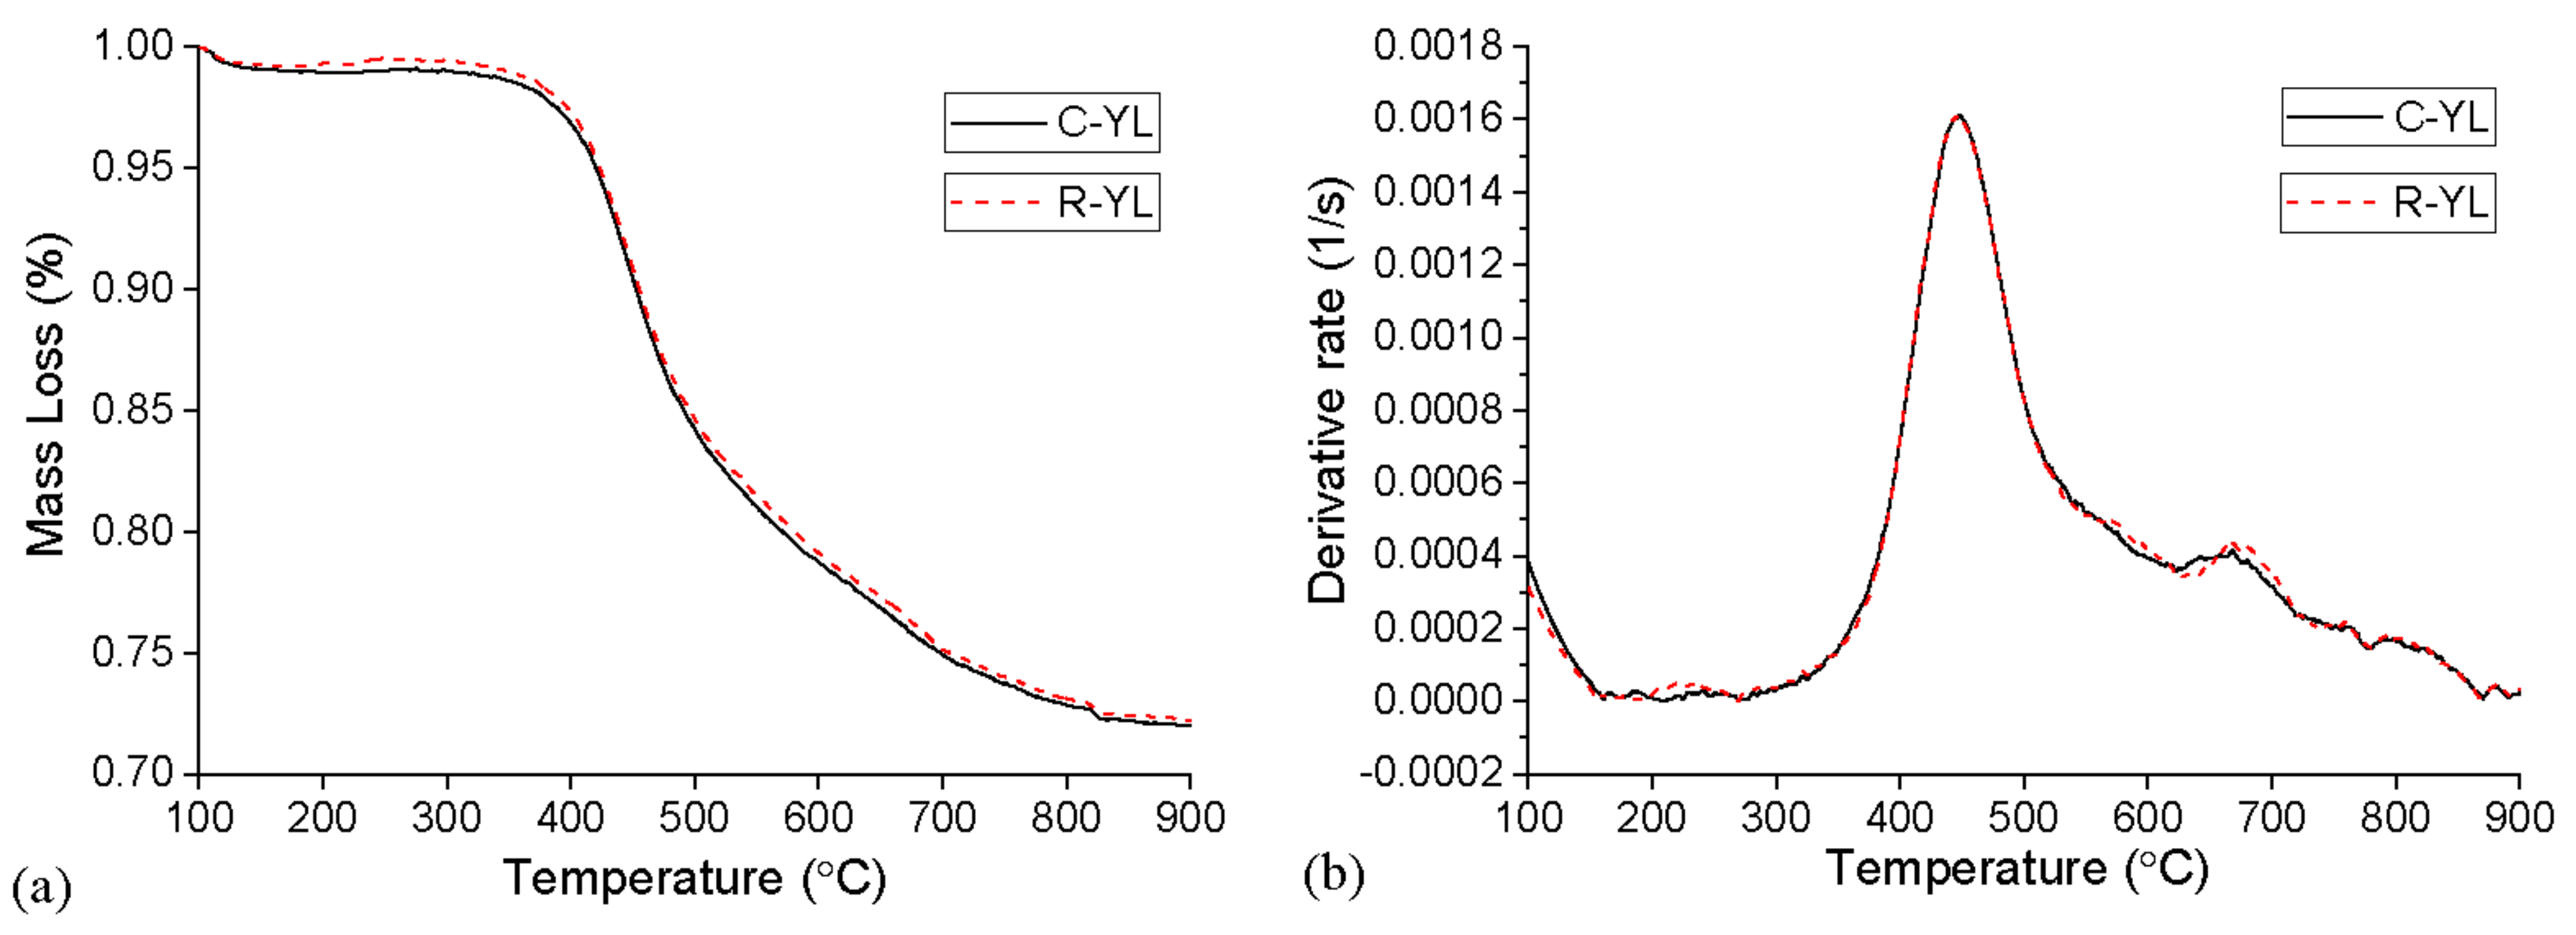
3.3. Pyrolysis Behavior in Thermogravimetric Analyzer

In this section, the pyrolysis behaviors of four low-rank coals at a heating rate of 10 K/min, from room temperature to 900 °C and atmospheric pressure, were studied and are shown in Figure 4 and Figure 5, utilizing mass loss (TG) and reaction rate (DTG) plots. The derived TG and DTG curves were normalized to a temperature of 100 °C to eliminate the effects of moisture in the samples. The characteristic temperatures and reaction rate are shown in Table 3. As a whole, the pyrolysis processes of the four fuels were characterized by a three-stage thermal degradation, and the decomposition of the fuels mainly takes place in the second stage. The stage temperatures were determined by drawing tangents to adjacent curves with different slopes, and the intersections of the tangents were the temperature points.
The end temperature of stage one T1 represents the beginning temperature for decomposition. In stage one, only water and a few peripheral mobile phases from the macromolecular structure decomposed. From Table 3, it can be seen that the beginning temperature for the decomposition of R-YL was similar as that of C-YL. Table 1 shows a much higher oxygen content for R-YL coal (around 16 wt.%), compared to 6.73 wt.% for C-YL. However, the FTIR analysis showed R-YL and C-YL contained similar aromatic oxygen-containing functional groups, including hydroxyl and carboxyl groups, leading to approximate T1. The starting temperature was 360 °C for NM and 326 °C for YN (higher oxygen content). The mass loss at stage one M1 was around 1.0 wt.% for R-YL and C-YL and a little higher for NM (6.0 wt.%) and YN (9.3 wt.%) coal.
The second stage was from around 300 to 550 °C, where large amounts of volatiles were produced in a narrow temperature range, leading to the maximum reaction rates Dmax1. R-YL and C-YL coals had almost same reaction rate of 0.0016 s−1 and corresponding temperatures Tmax1 at around 445 °C. The Tmax1 for YN coal was the lowest at 420 °C, and Dmax1 was 0.0014 s−1. NM coal had the lowest reaction rate of 0.0009 s−1 at the highest temperature, 475 °C, showing that the decomposition of NM coal was more difficult compared to other samples. In addition, it was found that the Dmax1 of R-YL and C-YL was almost the same and higher than that of YN and NM. Using FTIR analysis, it was found that the functional group and aliphatic C–H content were lower than YN and NM coal; the behavior here might be caused by catalytic minerals in YL coal. R-YL contained much more CaO, Na2O and Fe2O3, while C-YL had the highest amount of K2O, which was regarded as the most effective catalytic minerals for coal decomposition. In terms of the end temperature of stage two T2, the lowest T2 was for YN coal at 503 °C, compared to around 540 °C for other samples. The mass loss at stage two M2 was around 30 wt.% for YN coal and 20 wt.% for other coals. The much larger amounts of volatiles and lower characteristic temperatures showed that YN coal contained many more thermally unstable functional groups, such as oxygen containing functional groups, alkyl side chains and bridged bonds, which were consistent with findings from the FTIR analysis.
The third stage was 500–900 °C, where the remaining macromolecular structures of coal, mainly dense polycyclic aromatic compounds in the immobile phase, decomposed further at a relatively lower rate, producing a mass loss of about 10 wt% for R-YL and C-YL and 15 wt% for NM and YN. The mass loss of NM and YN was obviously higher than that of YL coal. From Table 3, the lower characteristic temperatures for NM and YN showed their low rank, containing less polycyclic aromatic compounds or weak chemical bond energy, which decompose more easily at high temperatures. In addition, it might also be caused by more mineral decomposition at high temperatures. The second peak Dmax2 for NM (0.0005 1/s) was little higher than that of YN and YL coal (0.0004 1/s). The decomposition temperatures Tmax2 for NM and YN (727 °C) coal were higher and lasted for a longer reaction time compared to that of YL (668 °C), leading to the increased decomposition of minerals. The gypsum, calcite and little pyrite in NM, and the calcite, calcium sulfate and large amounts of pyrite in YN would decompose at high temperatures. To be compared, only calcite in YL coal could decompose in this stage.
From the above discussion, there was no apparent difference between R-YL and C-YL. Figure 6 was drawn to better compare the pyrolysis behavior of them. It can be seen that the mass loss of raw coal was always a little less than that of C-YL, but the final mass loss was almost the same. Their reaction rate plots nearly overlapped, except the peaks at around 250 °C and 670 °C. For R-YL, the higher peak at around 250 °C may be caused by more carboxy groups, and the higher peak at around 670 °C was due to more thermolabile minerals.
Through the comparison of the pyrolysis behavior among four coals, it can be seen that the decomposition in stage one and two (before 550 °C) was mainly affected by organic structure and composition in coals, while the pyrolysis behavior in stage three was not only dependent on organic parts but also the inorganic parts, that is, mineral matters in coals. In addition, some catalytic minerals also have effects on pyrolysis behavior in stage two, especially for the alkali and alkali earth metals.

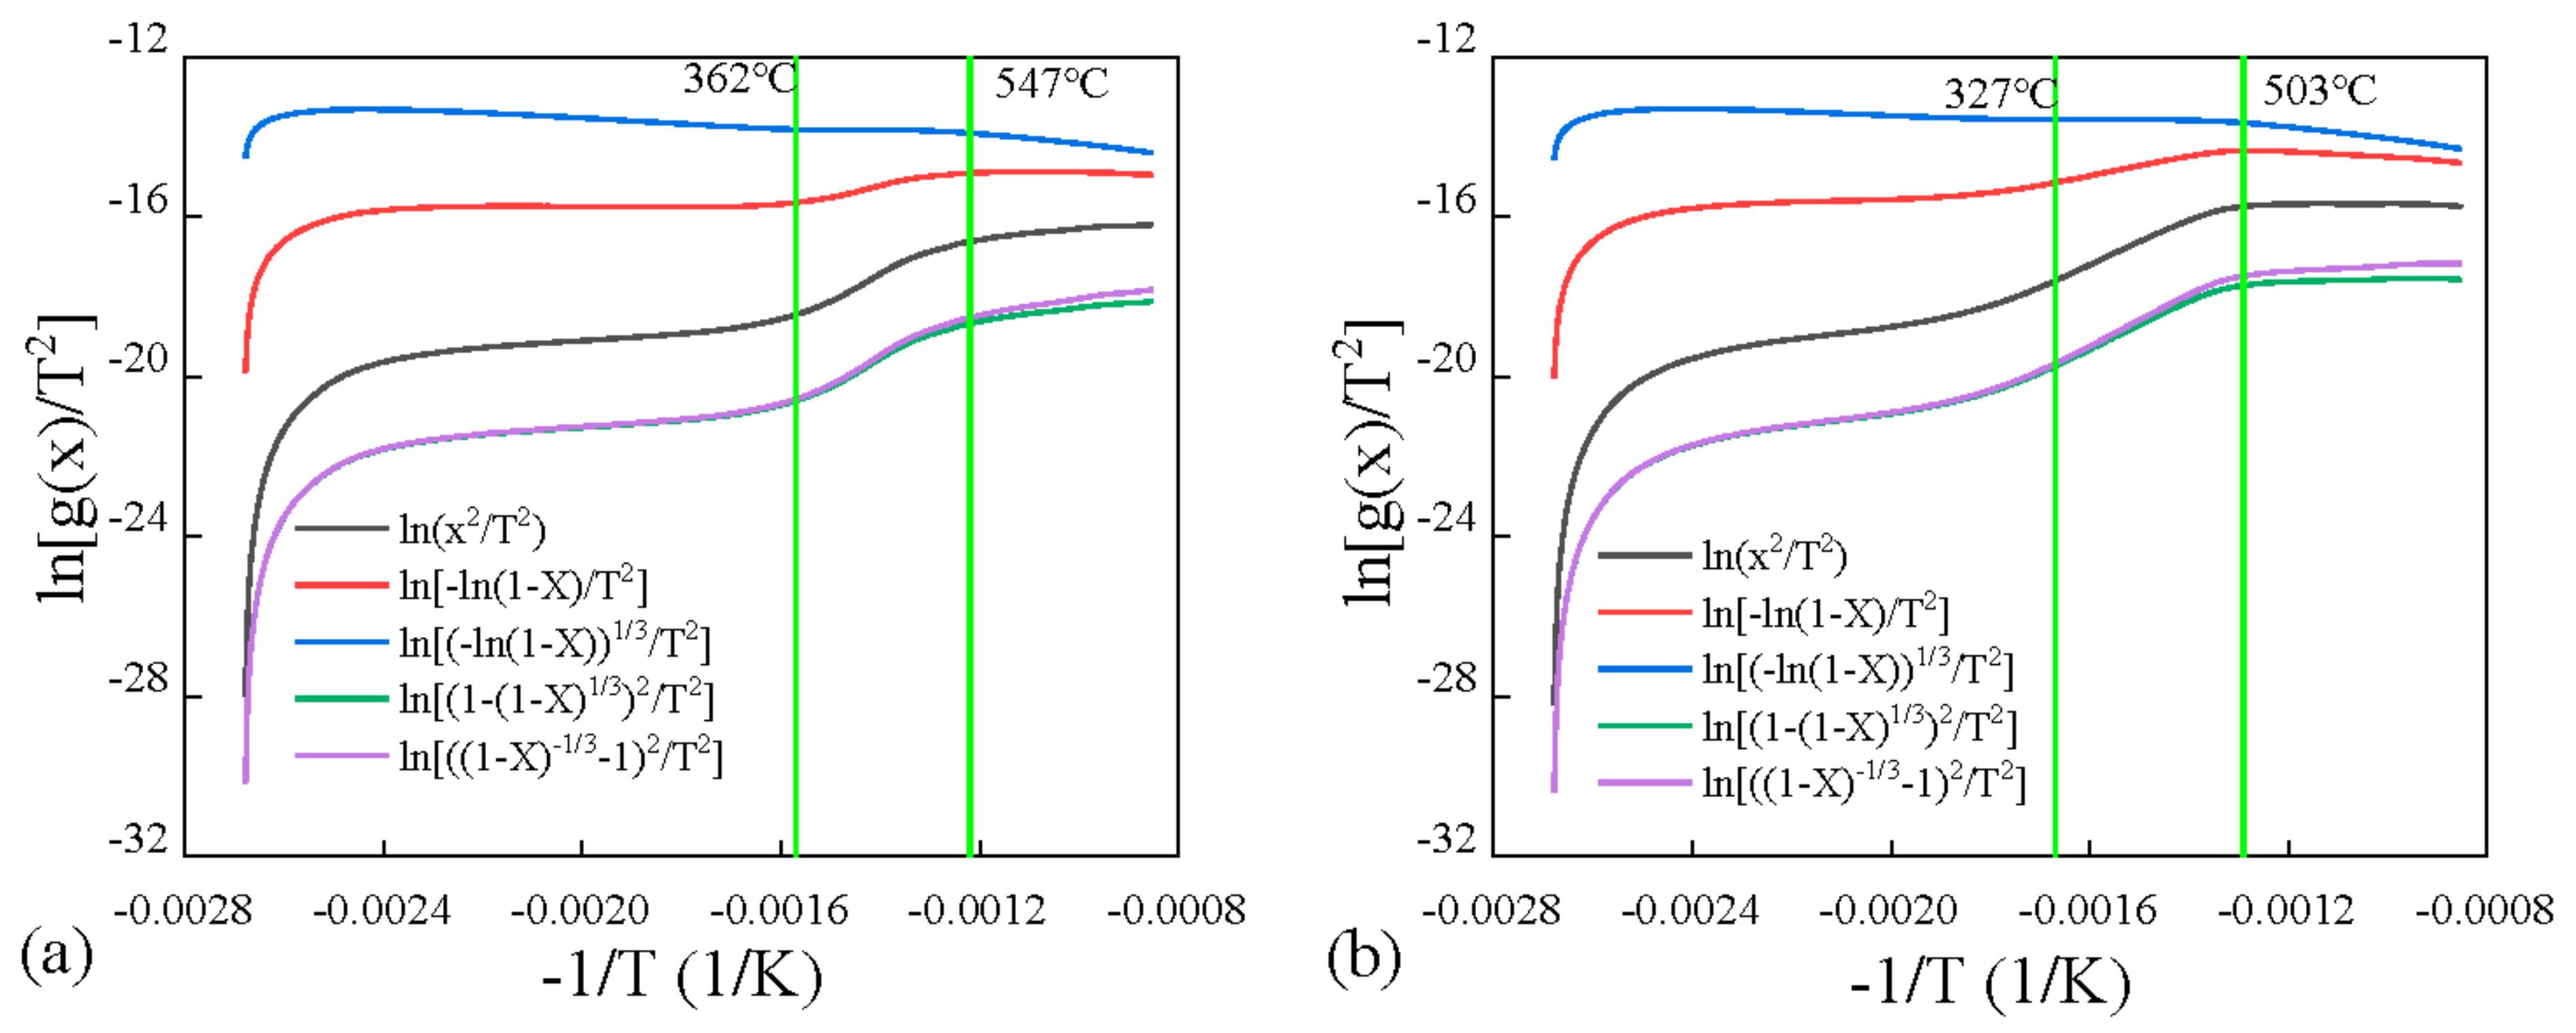
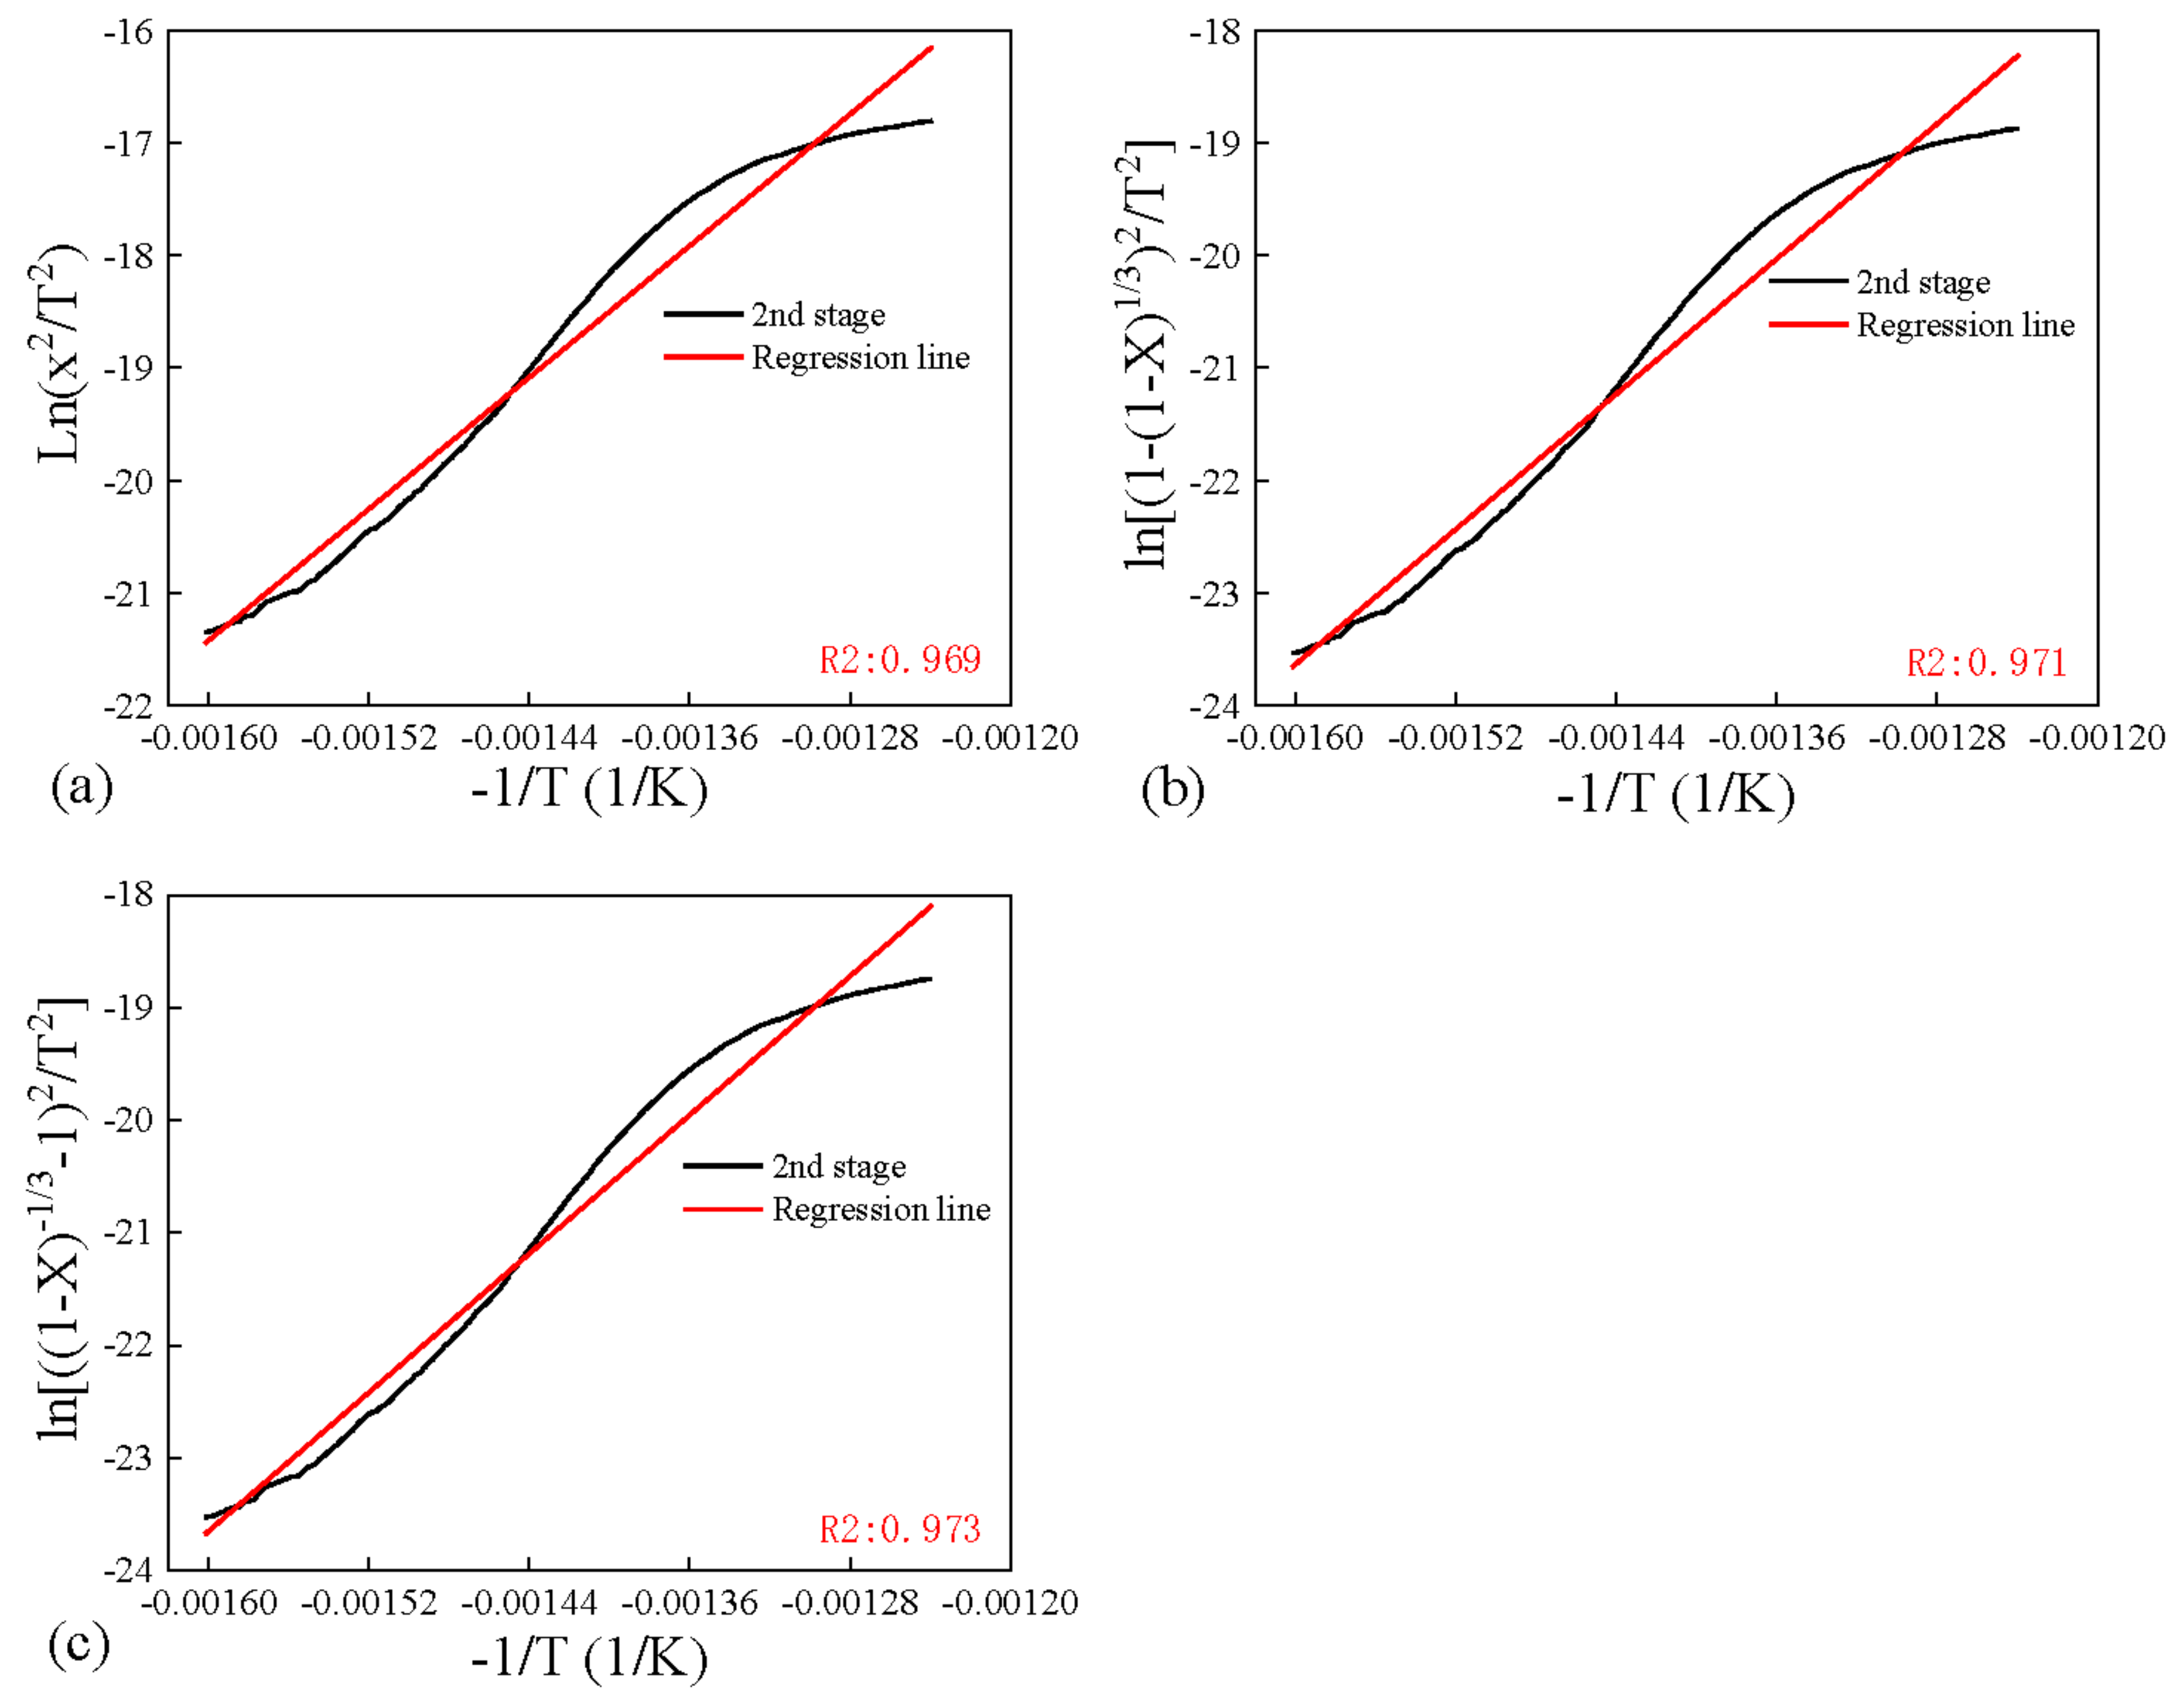
3.4. Pyrolysis Kinetics of Four Coals

The kinetics was obtained by applying Coats–Redfern method, which was widely used in literature for pyrolysis. Five models with different reaction mechanisms were applied and compared in Figure 7 and Figure 8 for four coals. It can be found that the diffusion (Zhuravlev equation) model fitted the experiments best due to positive slope in the high temperature range, compared to negative values for other models. And most R2 values when linear fitting this model were the highest for the Zhuravlev equation model in the second stage, as shown in Figure 9. Therefore, the diffusion (Zhuravlev equation) model was applied for fitting all samples to obtain kinetic parameters.
By linear fitting the plots of diffusion (Zhuravlev equation) model at different temperature stages, activation energies E for all four low-rank coals were obtained and are shown in Table 4.
The parameters illustrated in this section were in the range of values obtained by different authors when applying Coats–Redfern method to brown coal pyrolysis [24,25,26,27]. Detailed results are shown in the following:
(1)
In the primary pyrolysis stage (300~550 °C), the apparent activation energy E for R-YL and C-YL were similar, around 130 KJ/mol. Although the index of basicity of R-YL was 1.92, showing high basicity, it did not have a significant effect on activation energy E here. The frequency factor A for clean coal C-YL was obviously lower than that for raw coal, showing the change of chemical structure. Through coal washing, the raw coal R-YL was processed to remove minerals in heavy liquid or water, and finally dried to produce clean coal. All the processes could change the chemical structure. For example, a lower mineral and water content led to more porous structure for C-YL, leading to a higher frequency factor A. As shown in Figure 6, the mass loss for C-YL was always little higher than that of R-YL. In addition, the E value of NM and YN coal was much lower than that of C-YL and R-YL, around 50 KJ/mol. The contents of volatile matter for NM and YN in Table 1 were obviously higher than that of C-YL and R-YL, showing their lower rank. This is also reflected in the FTIR analysis, where the absorption bands for aliphatic C–H and C=O were higher for low-rank coals C-YL and R-YL.
(2)
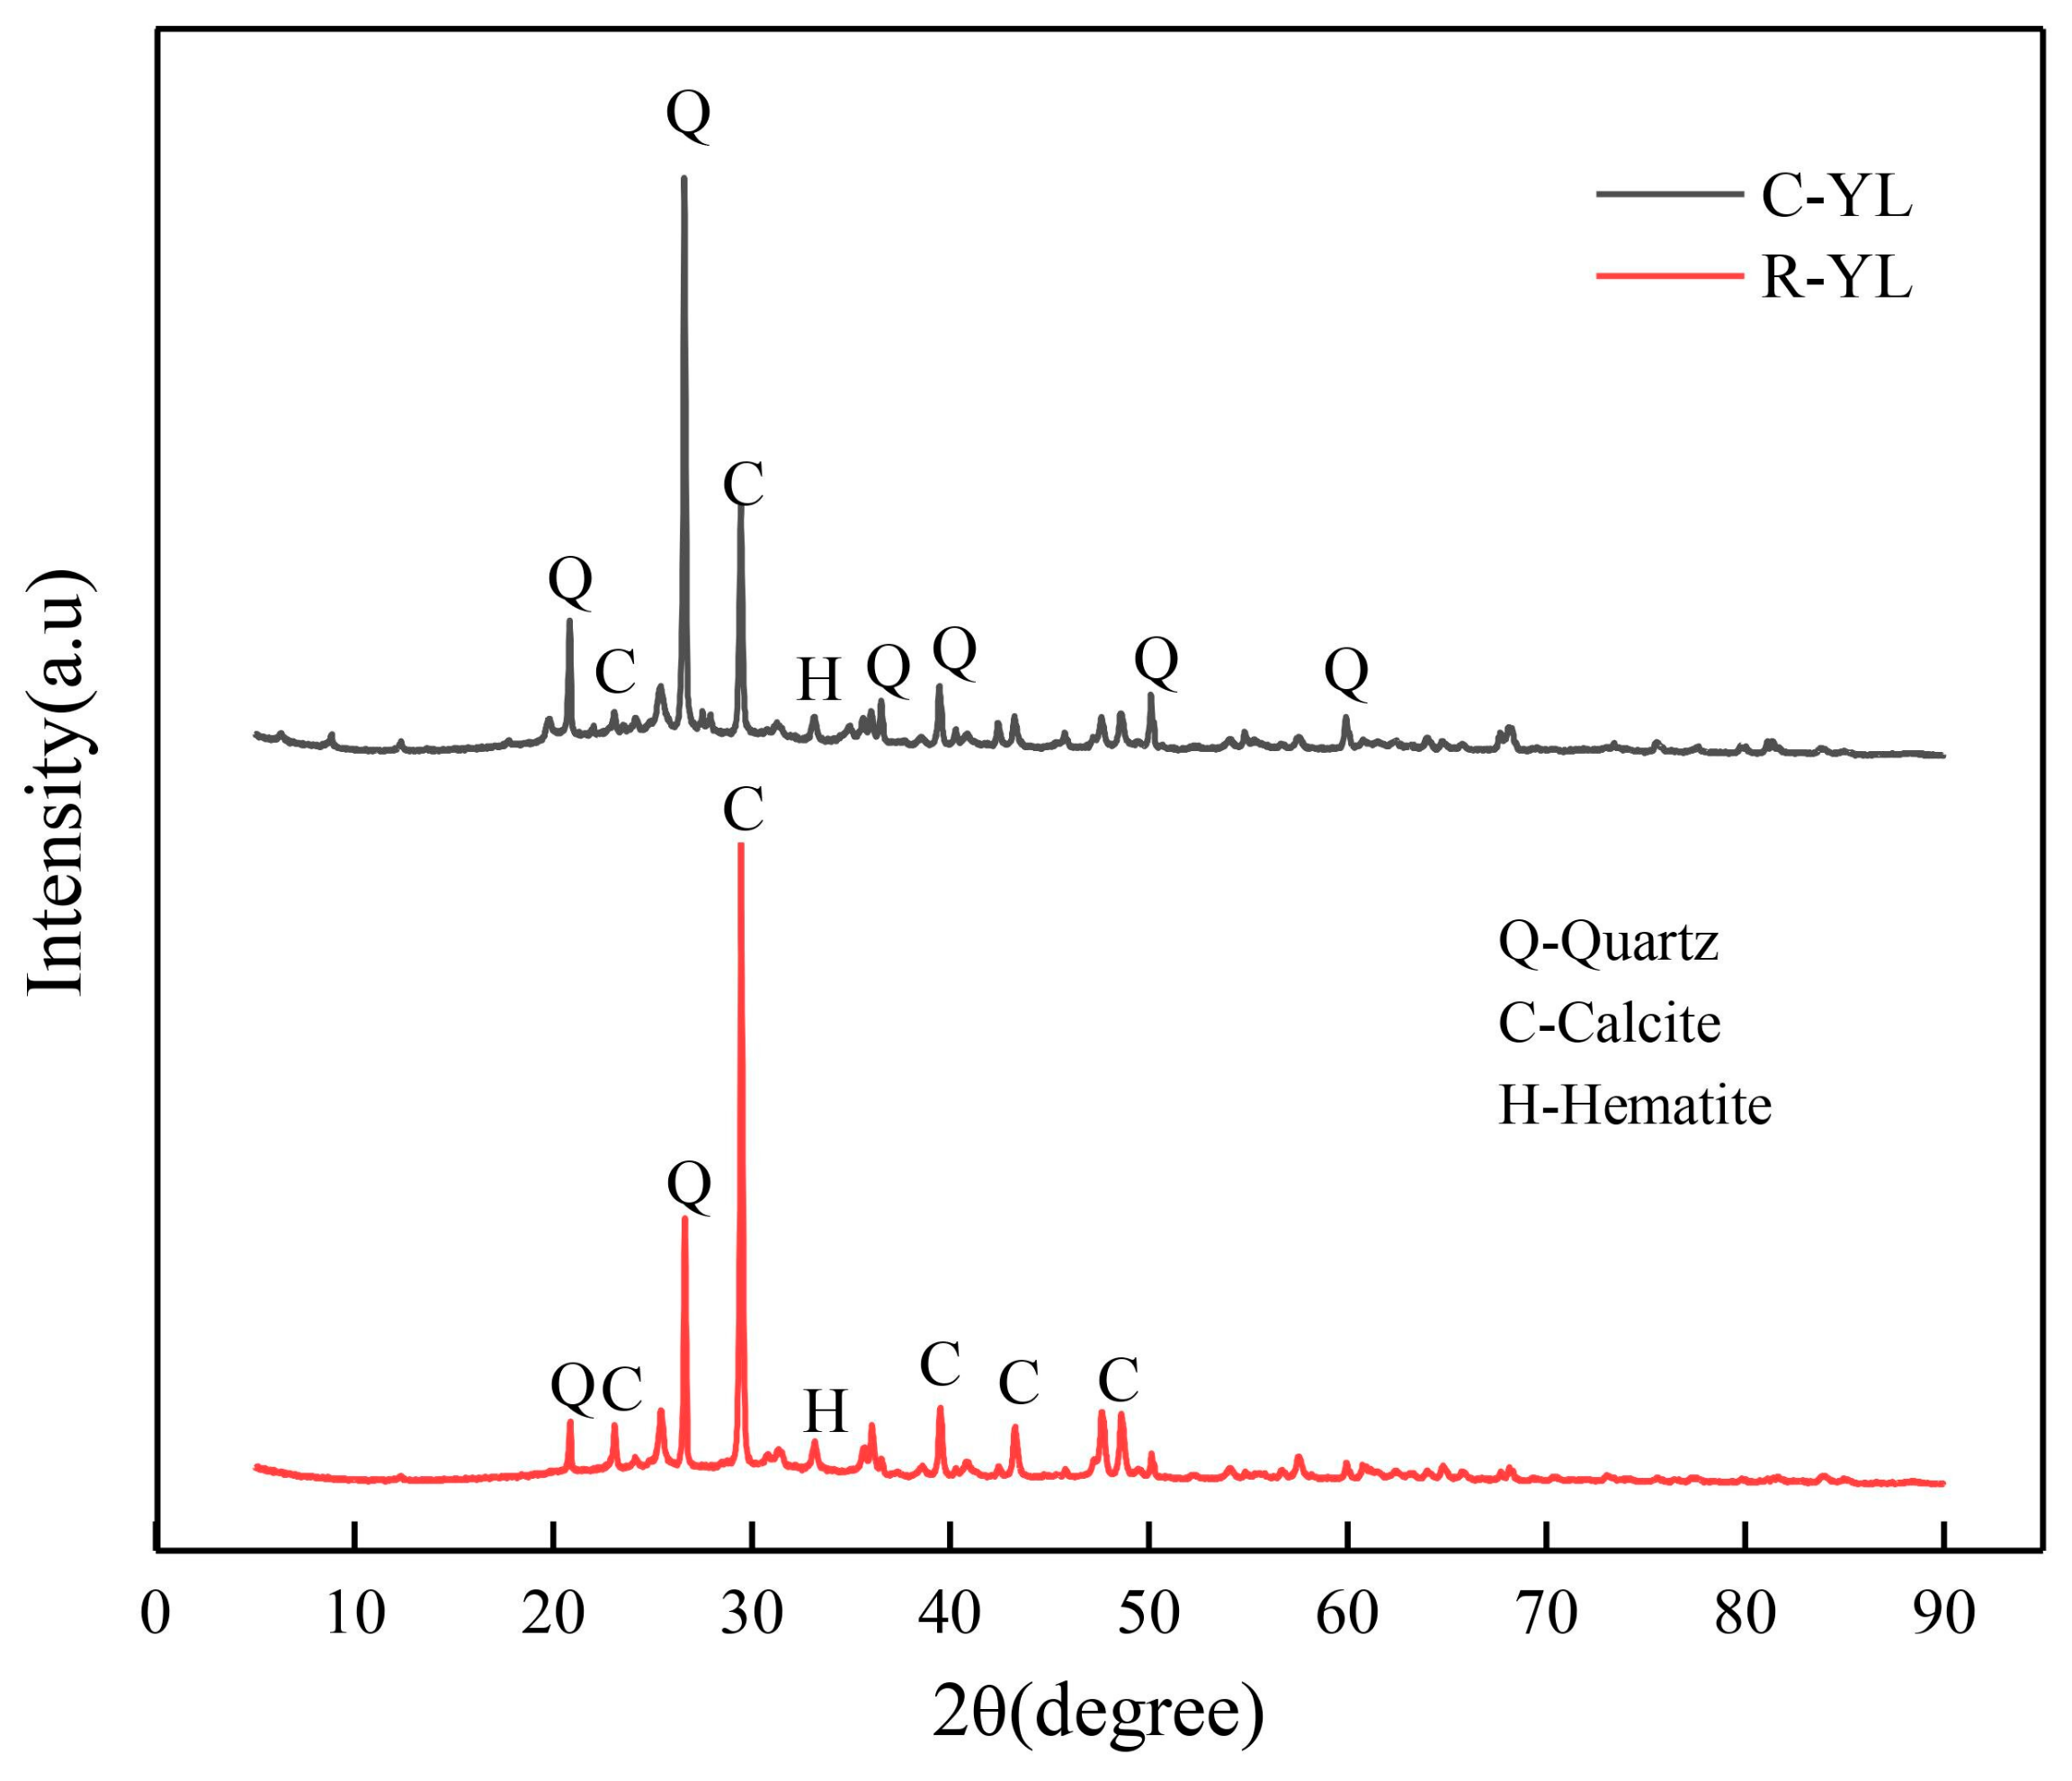
In the third stage (500~900 °C), the apparent activation energy E and frequency factor A for R-YL and C-YL were also almost the same. Although the E values for NM and YN were similar in the primary stage, the E value was highest for NM coal (16.85 KJ/mol), and YN coal had the lowest apparent activation energy (6.3 KJ/mol), showing that the chemical property was not the predominant effect in the third stage. From Figure 2, it can be seen that NM had a much higher quartz and calcite content, which was difficult to decompose when the temperature was lower than 900 °C. The much pyrite contained in YN coal can decomposed at 540 °C, leading to the lowest E value. While the calcite in R-YL and quartz in C-YL was difficult to decompose in the third stage. Therefore, it can be understood that the apparent activation energy E in the third stage was more affected by the thermodynamic property of inherent minerals, not by the index of basicity.

4. Conclusions

The present study mainly focused on the effects of chemical properties and inherent mineral matters on the pyrolysis kinetics of low-rank coals. Four low-rank coals were selected, and two of them were raw coal R-YL and clean coal C-YL obtained through the coal-washing process. From the discussions, it can be concluded that:
(1)
Through the coal-washing process, the ash content decreased from 9.12 to 4.69 wt.%, and the index of basicity changed from 1.92 (high basicity) to 0.68 (acidity). Regarding the chemical property, the C=O absorption and aromatic C=C stretching absorption bands for C-YL were almost the same as that of R-YL, showing that coal washing mainly changed inherent mineral matters.
(2)
For pyrolysis behavior, the highest mass loss was for YN coal, showing its low rank. The mass loss of C-YL was a little higher than that of R-YL during pyrolysis process. The decomposition in stage one and two (before 550 °C) was mainly affected by the chemical properties in coals, while the pyrolysis behavior in stage three also depended on inherent mineral matters.
(3)
for the pyrolysis kinetics, in the primary pyrolysis stage (300~550 °C), the apparent activation energy E was mainly affected by their chemical properties. NM and YN coal, with higher aliphatic C–H and C=O, had lower E values. The difference in the E value was almost negligible in R-YL and C-YL, also showing that the coal-washing process did not largely change the chemical properties, but it could change its structure, leading to higher frequency factor A for clean coal C-YL. In the third stage (500~900 °C), the apparent activation energy E in third stage was affected more by the thermodynamic property of inherent minerals, not by the index of basicity.

Author Contributions

Conceptualization, Z.Z.; methodology, R.C.; formal analysis, H.Z., Z.W. and Z.Z.; investigation, H.Z., Z.W., L.Z. and Y.T.; writing—original draft preparation, Z.Z. and L.Z.; writing—review and editing, L.Z. and H.Z.; visualization, H.Z.; supervision, L.Z.; funding acquisition, Z.Z. All authors have read and agreed to the published version of the manuscript.

Funding

The authors gratefully acknowledge the research materials and the investigation assistance provided by the Coal-to-oil Coal Preparation Plant of Shendong Coal Group Co., LTD., the National Science Foundation of China, grant number 51804313, and the Yue Qi Young Scholar Project, China University of Mining &Technology, Beijing (2020QN10).

Data Availability Statement

All data used to support the findings of this study are included within the article.

Conflicts of Interest

The authors declare no conflict of interest.

References

  1. Zhou, L.; Guo, H.; Wang, X.; Chu, M.; Zhang, G.; Zhang, L. Effect of occurrence mode of heavy metal elements in a low rank coal on volatility during pyrolysis. Int. J. Coal Sci. Technol. 2019, 6, 235–246. [Google Scholar] [CrossRef] [Green Version]
  2. Zhou, L.M.; Guo, H.; Chu, M.; Chang, Z.B.; Wang, X.B.; Zhang, G.J.; Gong, Y.Q.; Qu, Y. Effects of occurrence mode of Cd in low rank coal on its volability during pyrolysis process. J. China Coal Soc. 2019, 44, 323–331. [Google Scholar] [CrossRef]
  3. Peng, Z.; Wenbo, L.; Jiangpeng, L. Status and development suggestion of low rank coal upgrading technologies. Clean Coal Technol. 2015, 21, 37–40. [Google Scholar] [CrossRef]
  4. Li, D.; Zhao, N.; Feng, Y.; Xie, Z. Thermogravimetric Analysis of Coal Semi-Char Co-Firing with Straw in O2/CO2 Mixtures. Processes 2021, 9, 1421. [Google Scholar] [CrossRef]
  5. Kelly, E.G.; Spottiswood, D.J. Introduction to Mineral Processing; Wiley: New York, NY, USA, 1982. [Google Scholar]
  6. Xu, K.; Hu, S.; Xiang, J.; Sun, L.; Lu, T.; Shuai, C. Analysis on the Behavior of Pressurized Pyrolysis of Shengli Lignite. Proc. CSEE 2011, 31, 15–20. [Google Scholar] [CrossRef]
  7. Wang, X.; Ju, F.; Yang, H. Kinetics and Properties Analysis of Shenfu Coal Pressurized Pyrolysis. Proc. CSEE 2011, 31, 40–44. [Google Scholar] [CrossRef]
  8. Masnadi, M.S.; Habibi, R.; Kopyscinski, J.; Hill, J.M.; Bi, X.; Lim, C.J.; Ellis, N.; Grace, J.R. Fuel characterization and co-pyrolysis kinetics of biomass and fossil fuels. Fuel 2014, 117, 1204–1214. [Google Scholar] [CrossRef]
  9. Casal, M.D.; Vega, M.F.; Diaz-Faes, E.; Barriocanal, C. The influence of chemical structure on the kinetics of coal pyrolysis. Int. J. Coal Geol. 2018, 195, 415–422. [Google Scholar] [CrossRef]
  10. Song, H.; Liu, G.; Zhang, J.; Wu, J. Pyrolysis characteristics and kinetics of low rank coals by TG-FTIR method. Fuel Process. Technol. 2017, 156, 454–460. [Google Scholar] [CrossRef]
  11. Zhou, L.; Zhang, G.; Reinmöller, M.; Meyer, B. Effect of inherent mineral matter on the co-pyrolysis of highly reactive brown coal and wheat straw. Fuel 2019, 239, 1194–1203. [Google Scholar] [CrossRef]
  12. Yin, H.Y.; Wang, M.J.; Wang, J.H.; Bao, W.R.; Chang, L.P. Effects of calcium and sodium additives on the pyrolysis characteristics of Pingshuo demineralized coal. Clean Coal Technol. 2010, 3, 1006–6772. [Google Scholar] [CrossRef]
  13. Yang, J.; Cai, N.; Zhang, Y. Experimental study for the effect of catalysts on the release of gasous products during pyrolysis of lignite. J. Eng. Thermophys. 2009, 30. [Google Scholar] [CrossRef]
  14. Xiong, J.; Zhou, Z.; Xu, S. Effects of alkali metal on rate of coal pyrolysis and gasification. CIESC J. 2011, 62. [Google Scholar]
  15. Huang, Y.F.; Kuan, W.H.; Chiueh, P.T. Pyrolysis of biomass by thermal analysis-mass spectrometry (TA-MS). Bioresour. Technol. 2011, 102, 3527–3534. [Google Scholar] [CrossRef] [PubMed]
  16. Jia, C. Study on Gasification and Pyrolysis Characteristics of Biomass. Master′s Thesis, Northeast Dianli University, Jilin, China, March 2007. [Google Scholar] [CrossRef]
  17. Teh, J.S.; Teoh, Y.H.; How, H.G.; Sher, F. Thermal Analysis Technologies for Biomass Feedstocks: A State-of-the-Art Review. Processes 2021, 9, 1610. [Google Scholar] [CrossRef]
  18. Liu, H.; Zhou, J.; Wang, J. Effects of Ca-based additives on behaviors of slow and fast coal pyrolysis. Mod. Chem. Ind. 2011, 31, 70–72. [Google Scholar] [CrossRef]
  19. Franklin, H.D.; Peter, W.A.; Howard, J.B. Mineral matter effects on the rapid pyrolysis and hydropyrolysis of a bituminous coal. 1. Effects on yields of char, tar and light gaseous volatiles. Fuel 1982, 61, 155–160. [Google Scholar] [CrossRef]
  20. Gong, X.; Guo, Z.; Wang, Z. Effects of Fe2O3 on pyrolysis reactivity of demineralized higher rank coal and its char structure. CIESC J. 2009, 60, 30. [Google Scholar] [CrossRef]
  21. Orfao, J.J.M.; Antunes, F.J.A.; Figueiredo, J.L. Pyrolysis kinetics of lignocellulosic materials—Three independent reactions model. Fuel 1999, 78, 349–358. [Google Scholar] [CrossRef]
  22. Coats, A.W.; Redfern, J.P. Kinetic parameters from thermogravimetric data. Nature 1964, 201, 68–69. [Google Scholar] [CrossRef]
  23. Coats, A.W.; Redfern, J.P. Kinetic parameters from thermogravimetric data. J. Polym. Sci. Part B Polym. Lett. 1965, 3, 917–920. [Google Scholar] [CrossRef]
  24. Vamvuka, D.; Kakaras, E.; Kastanaki, E.; Grammelis, P. Pyrolysis characteristics and kinetics of biomass residuals mixtures with lignite. Fuel 2003, 8, 1949–1960. [Google Scholar] [CrossRef]
  25. Haykiri-Acma, H.; Yaman, S. Synergy in devolatilization characteristics of lignite and hazelnut shell during co-pyrolysis. Fuel 2007, 86, 373–380. [Google Scholar] [CrossRef]
  26. Zhang, Y.; Zhao, M.; Linghu, R.; Wang, C.; Zhang, S. Comparative Kinetics of Coal and Oil Shale Pyrolysis in a Micro Fluidized Bed Reaction Analyzer. Carbon Resour. Convers. 2019, 2, 217–224. [Google Scholar] [CrossRef]
  27. Lu, Y.; Wang, Y.; Zhang, J.; Wang, Q.; Zhao, Y.; Zhang, Y. Investigation on the characteristics of pyrolysates during co-pyrolysisof Zhundong coal and Changji oil shale and its kinetics. Energy 2020, 200, 117529. [Google Scholar] [CrossRef]
Figure 1. XRD analysis of R-YL and clean C-YL.
Processes 09 02111 g001
Figure 2. XRD analysis of NM and YN.
Processes 09 02111 g002
Figure 3. DRIFT spectra of R-YL, C-YL, NM and YN coals, (a) 2600–4000 cm−1, (b) 400–2000 cm−1.
Processes 09 02111 g003
Figure 4. Pyrolysis of R-YL and C-YL in TGA, 10 K/min, 1 bar, (a) R-YL, (b) C-YL.
Processes 09 02111 g004
Figure 5. Pyrolysis of NM and YN in TGA, 10 K/min, 1 bar, (a) NM, (b) YN.
Processes 09 02111 g005
Figure 6. Comparison of R-YL and C-YL in TGA, 10 K/min, 1 bar, (a) TG, (b) DTG.
Processes 09 02111 g006
Figure 7. Kinetics obtained by applying Coats–Redfern method for (a) R-YL, (b) C-YL.
Processes 09 02111 g007
Figure 8. Kinetics obtained by applying Coats–Redfern method for (a) NM, (b) YN.
Processes 09 02111 g008
Figure 9. Models obtained by applying Coats–Redfern method for C-YL, (a) Diffusion C, (b) Diffusion D, (c) Diffusion E.
Processes 09 02111 g009
Table 1. Characteristics of four low-rank coals.
SampleR-YLC-YLNMYN
Ultimate analysis (wt.%), daf
Carbon, C77.8686.7777.4165.74
Hydrogen, H5.025.486.607.19
Nitrogen, N0.951.022.161.57
Sulfur, S0.500.330.553.48
Oxygen, O (diffa), a16.176.7313.2222.02
Proximate analysis (wt.%), daf
Moisture/ad9.649.529.169.51
Ash/d9.124.699.9525.30
Volatile matter/daf46.0245.3352.7654.63
Fixed Carbon/daf53.9854.6747.2445.37
Ash analysis (wt.%), b
Na2O2.541.742.950.17
MgO0.950.961.234.61
K2O0.202.710.380.90
CaO39.2918.8523.3015.04
Fe2O314.6712.965.8811.66
Al2O310.6615.8416.6423.34
SiO219.4338.9739.3530.48
Index of basicity, c1.920.680.600.60
a Calculated by difference, b Only oxides in index of basicity are shown here, c index   of   basicity = Fe 2 O 3 +   CaO   +   MgO   +   Na 2 O   +   K 2 O SiO 2 +   Al 2 O 3 .
Table 2. Pyrolysis models with different reaction mechanisms for TGA.
ModelsSymbolf(α)g(α)
Chemical reaction (first order)A1 − α−In(1 − α)
Random nucleation and nuclei growth
(three dimensional)
B3(1 − α)[−In(1 − α)]2/3[−In(1 − α)]1/3
Diffusion (one-way transport, plane)C1/2αα2
Diffusion (three-way transport, spherical)D(2/3)(1 − α)2/3/1 − (1 − α)1/3[1 − (1 − α)1/3]2
Diffusion (Zhuravlev equation)E(2/3)(1 − α)5/3/1 − (1 − α)1/3[(1 − α)−1/3 − 1]2
Table 3. Pyrolysis of four low-rank coal in TGA, 10 K/min, 1 bar.
SampleT1
(°C)
M1
(wt.%)
Tmax1
(°C)
Dmax1
(1/s)
T2
(°C)
M2
(wt.%)
Tmax2
(°C)
Dmax2
(1/s)
Mmax
(wt.%)
R-YL3401.04460.001653318.06660.000428
C-YL3481.44450.001653417.86680.000428
NM3606.04570.000954620.07270.000535
YN3269.34200.001450329.57270.000445
Table 4. Kinetic parameters E and A for pyrolysis of four coals.
SampleTemperature/°CEa/(KJ/mol)A/(mol−1)R2/(2nd Stage)
R-YL315~534 °C132.137.27 × 1050.97
C-YL350~533 °C128.114.20 × 1050.97
NM362~547 °C52.671.51 × 1000.99
YN327~503 °C50.424.48 × 1000.99
R-YL534~698 °C15.441.32 × 10−30.98
C-YL534~694 °C14.571.16 × 10−30.99
NM547~759 °C16.852.23 × 10−30.99
YN503~760 °C6.35.32 × 10−40.98
Publisher’s Note: MDPI stays neutral with regard to jurisdictional claims in published maps and institutional affiliations.

