
A Comparison of Uric Acid Optical Detection Using as Sensitive Materials an Amino-Substituted Porphyrin and Its Nanomaterials with CuNPs, PtNPs and Pt@CuNPs


Abstract
:1. Introduction

| Sensitive Material | Method of Detection | Detection Range | Limit of Detection | Advantages/Disadvantages | Ref |
|---|---|---|---|---|---|
| Porphyrin–graphene oxide hybrid nanosheets using as porphyrin 5,10,15,20-Tetra (4-pyridyl)-21H, 23H-porphine | Sensitive Electrochemical Detection | 20 to 5000 μM | 1 μM | - wide linear range - quick response - low level of detecting - excellent repeatability and stability; - good biocompatibility - high conductivity - quick mass transport - synergistic catalytic effect between porphyrin and RGO | [21] |
| Flexible microneedle electrode array-based biosensor and multi-channel portable electrochemical analyzer | Electrochemical method | 100 to 1200 μM | 4 μM | - simultaneous detection of multiple analytes - excellent sensing capabilities to these analytes - high sensitivity - linear ranges covering the concentration for clinical diagnosis -small size, low cost | [18] |
| Mn(III)-5-(4-Amino-phenyl)-10,15,20- triphenyl- porphyrin Graphene modified GCE | Electrochemical methods: differential pulse voltammetry and amperometric techniques | 0.5 to 500 μM and 20 to 290 μM | 0.30 μM and 1.74 μM | -excellent electrocatalytic Activity - good stability - high selectivity towards UA -low fabrication costs - wide linear ranges - low detection limit - potential to use in the clinical detection | [22] |
| Chloro [3,7,12,17-tetra- methyl-8,13- divinyl- porphyrin- 2,18- dipropanoato (2−)] Fe(III)/multi-wall carbon nanotubes | Electrochemical method | 5.80 µM to 1.30 mM | 0.30 µM | - low cost - high selectivity and sensitivity | [23] |
| Cobalt tetra -phenyl- porphyrin with chemically reduced graphene oxide | Electrochemical method | 0.5 to 40 µM | 0.15 µM | - good stability - low detection limit | [24] |
| Pt@Ag nanoflowers | Spectro- phtometric detection | 0.5–150 μM | 0.3 μM | -simple and fast UA detection platform for point-of-care diagnostics | [19] |
| Picolinic-Acid- Functionalized Metal−Organic Frameworks | Fluorescence analysis | 0.01 to 400 μM | 0.0023 μM | -short reaction time, high selectivity, high sensitivity, and wide linear range for UA detection | [3] |
| Ru(III)-2,2′-bipyridine/tri-n-propyl-amine | Quenching of the electrochemiluminescence | 1 to 75 µM | 1 µM | -possible interfering biological species, such as cysteine, oxalate, purine, glucose, and urea. -ascorbic acid causes interference | [25] |
| Nanohybrid constructed of gold nanoclusters (Au NCs) and quantum dots | fluorescence quenching at 685 nm with the addition of hydrogen peroxide in the presence of Fe2+ ions | 0.67 to 60 μM | 0.21 μmol·L−1 | -successfully applied in the determination of uric acid in serum samples. -selectivity over other molecules and proteins -good detection limit and dynamic range | [26] |
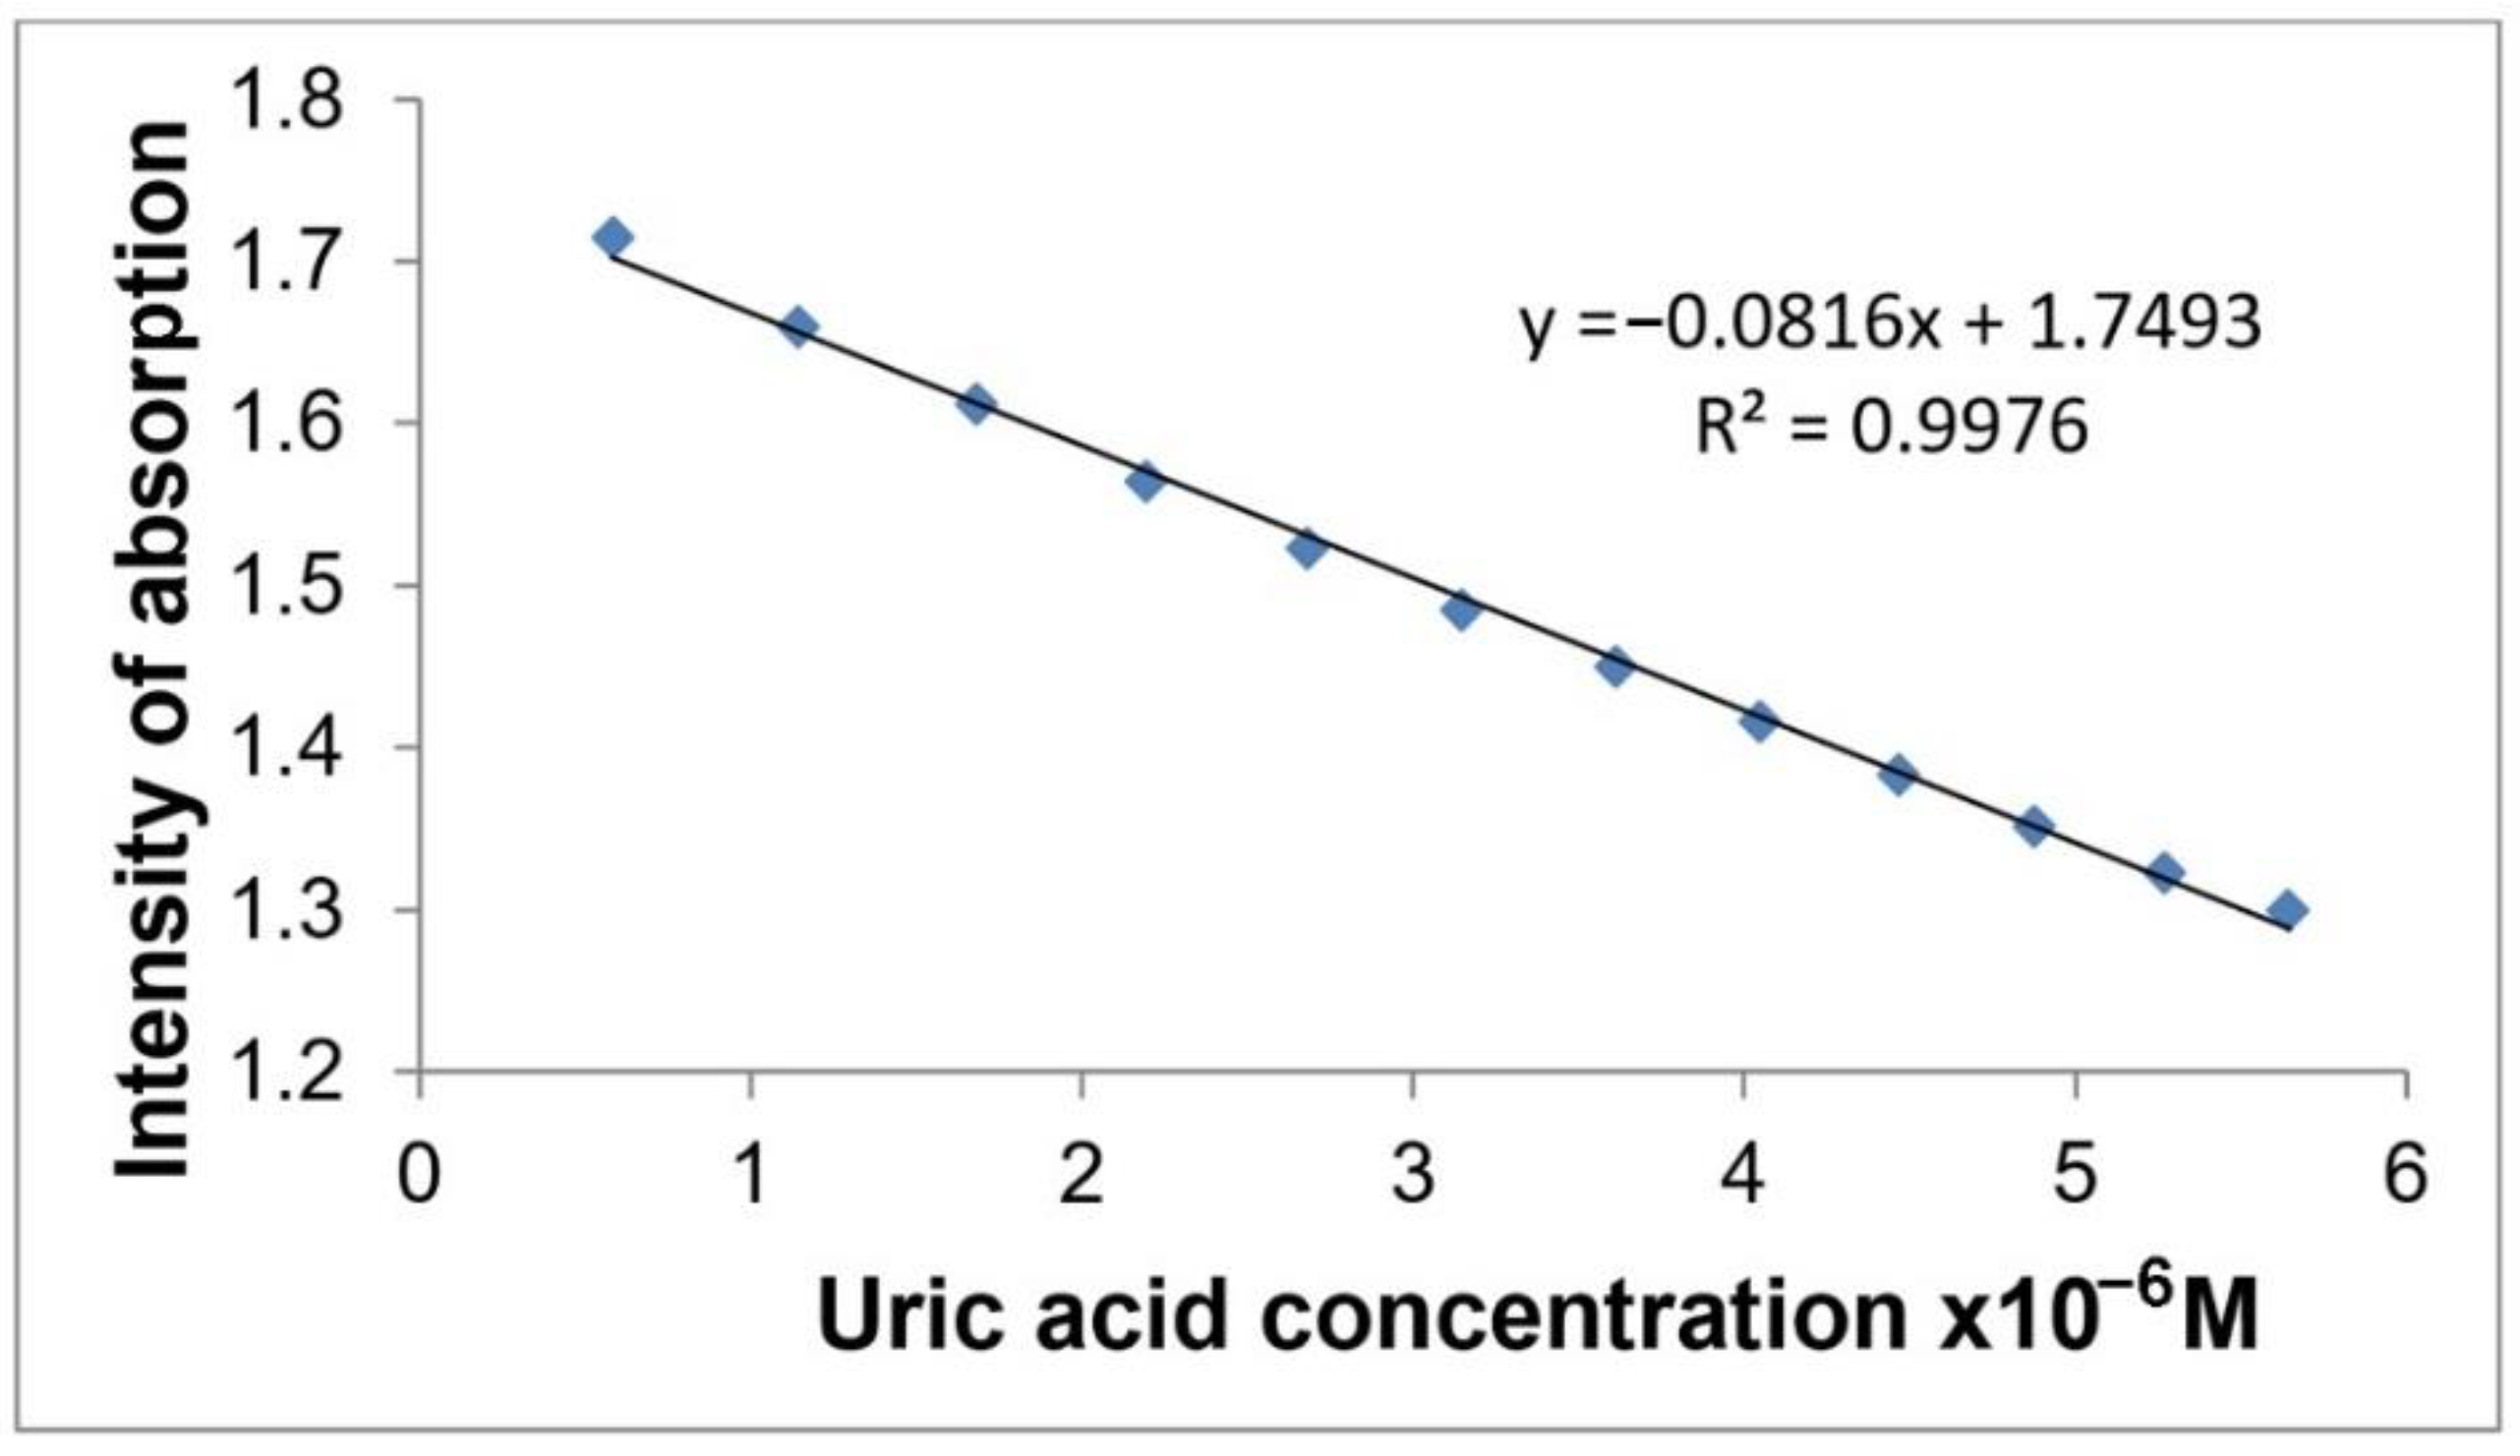
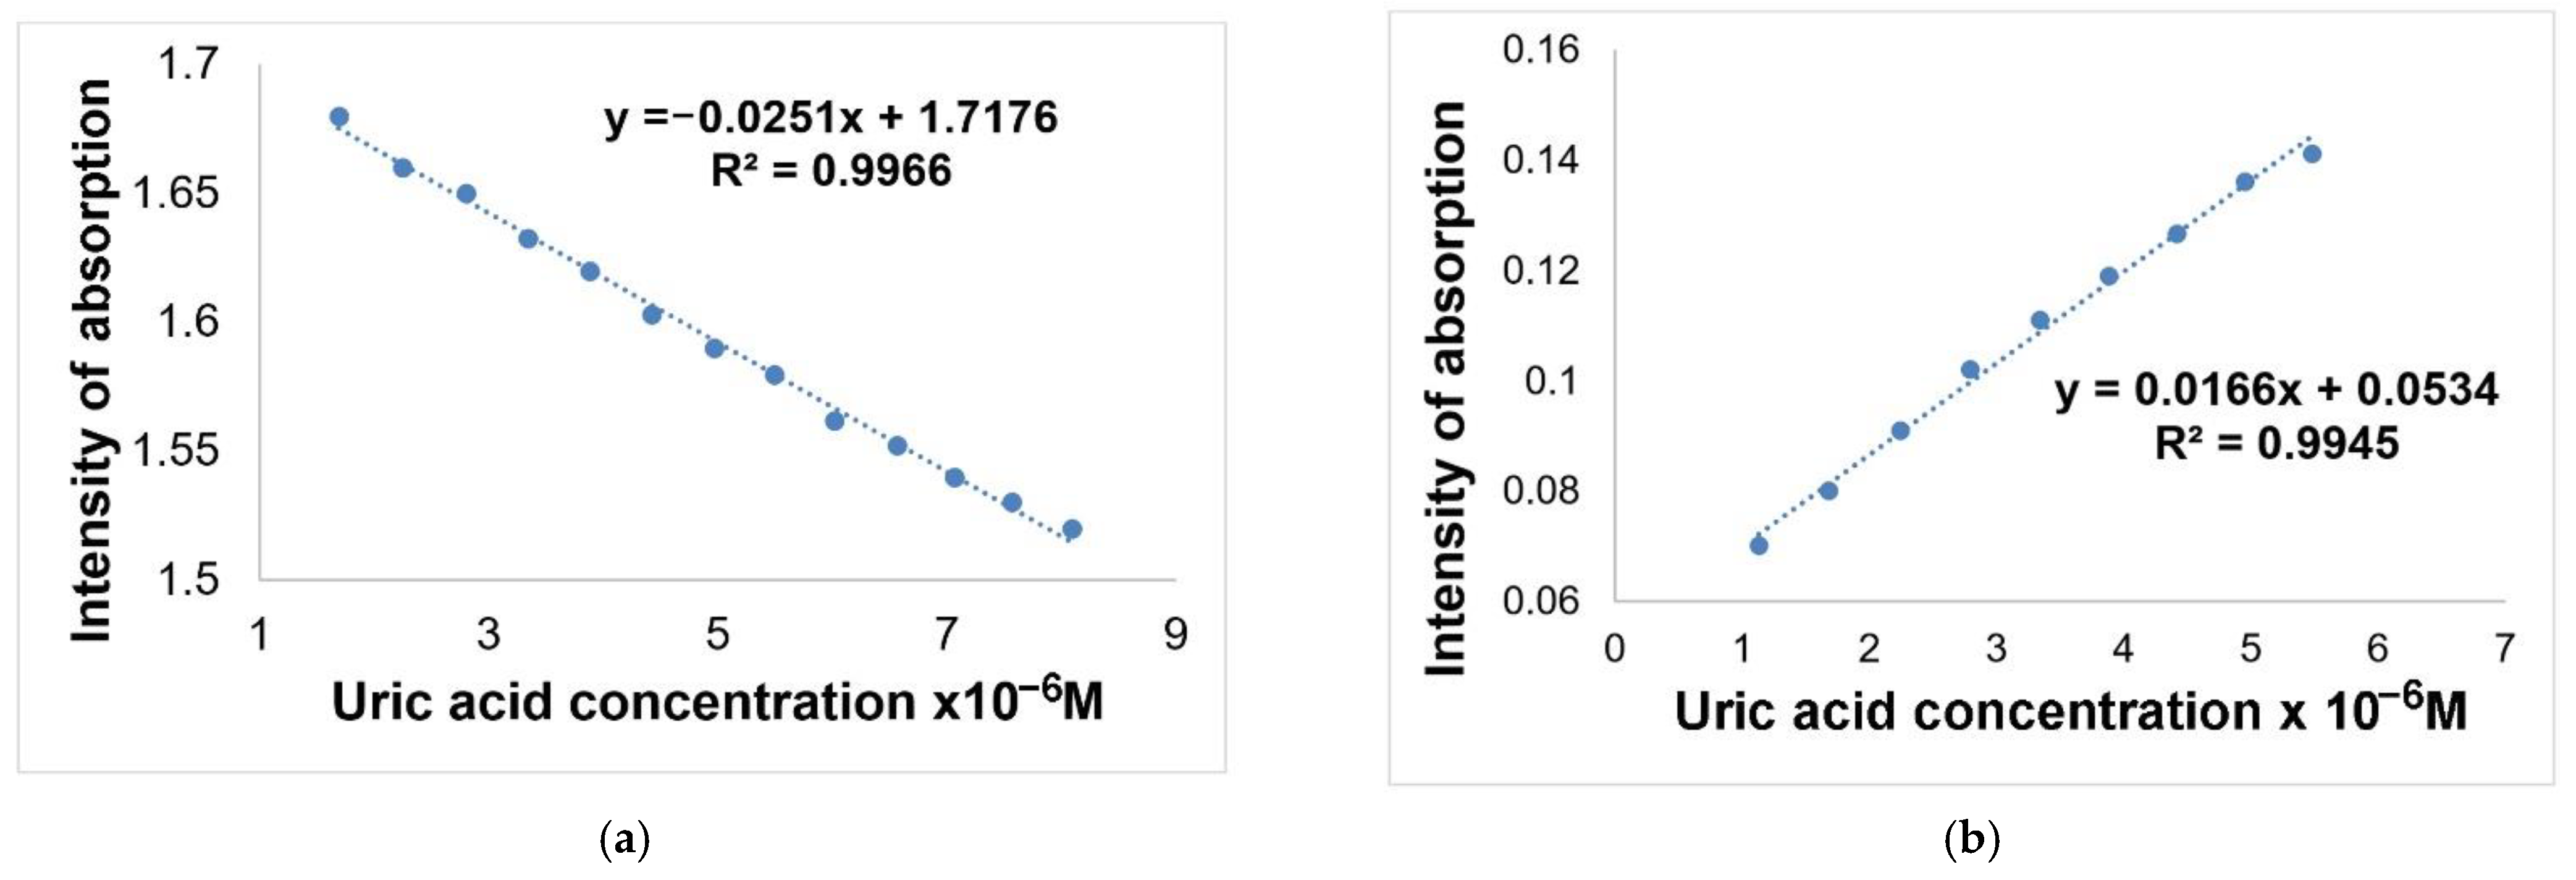
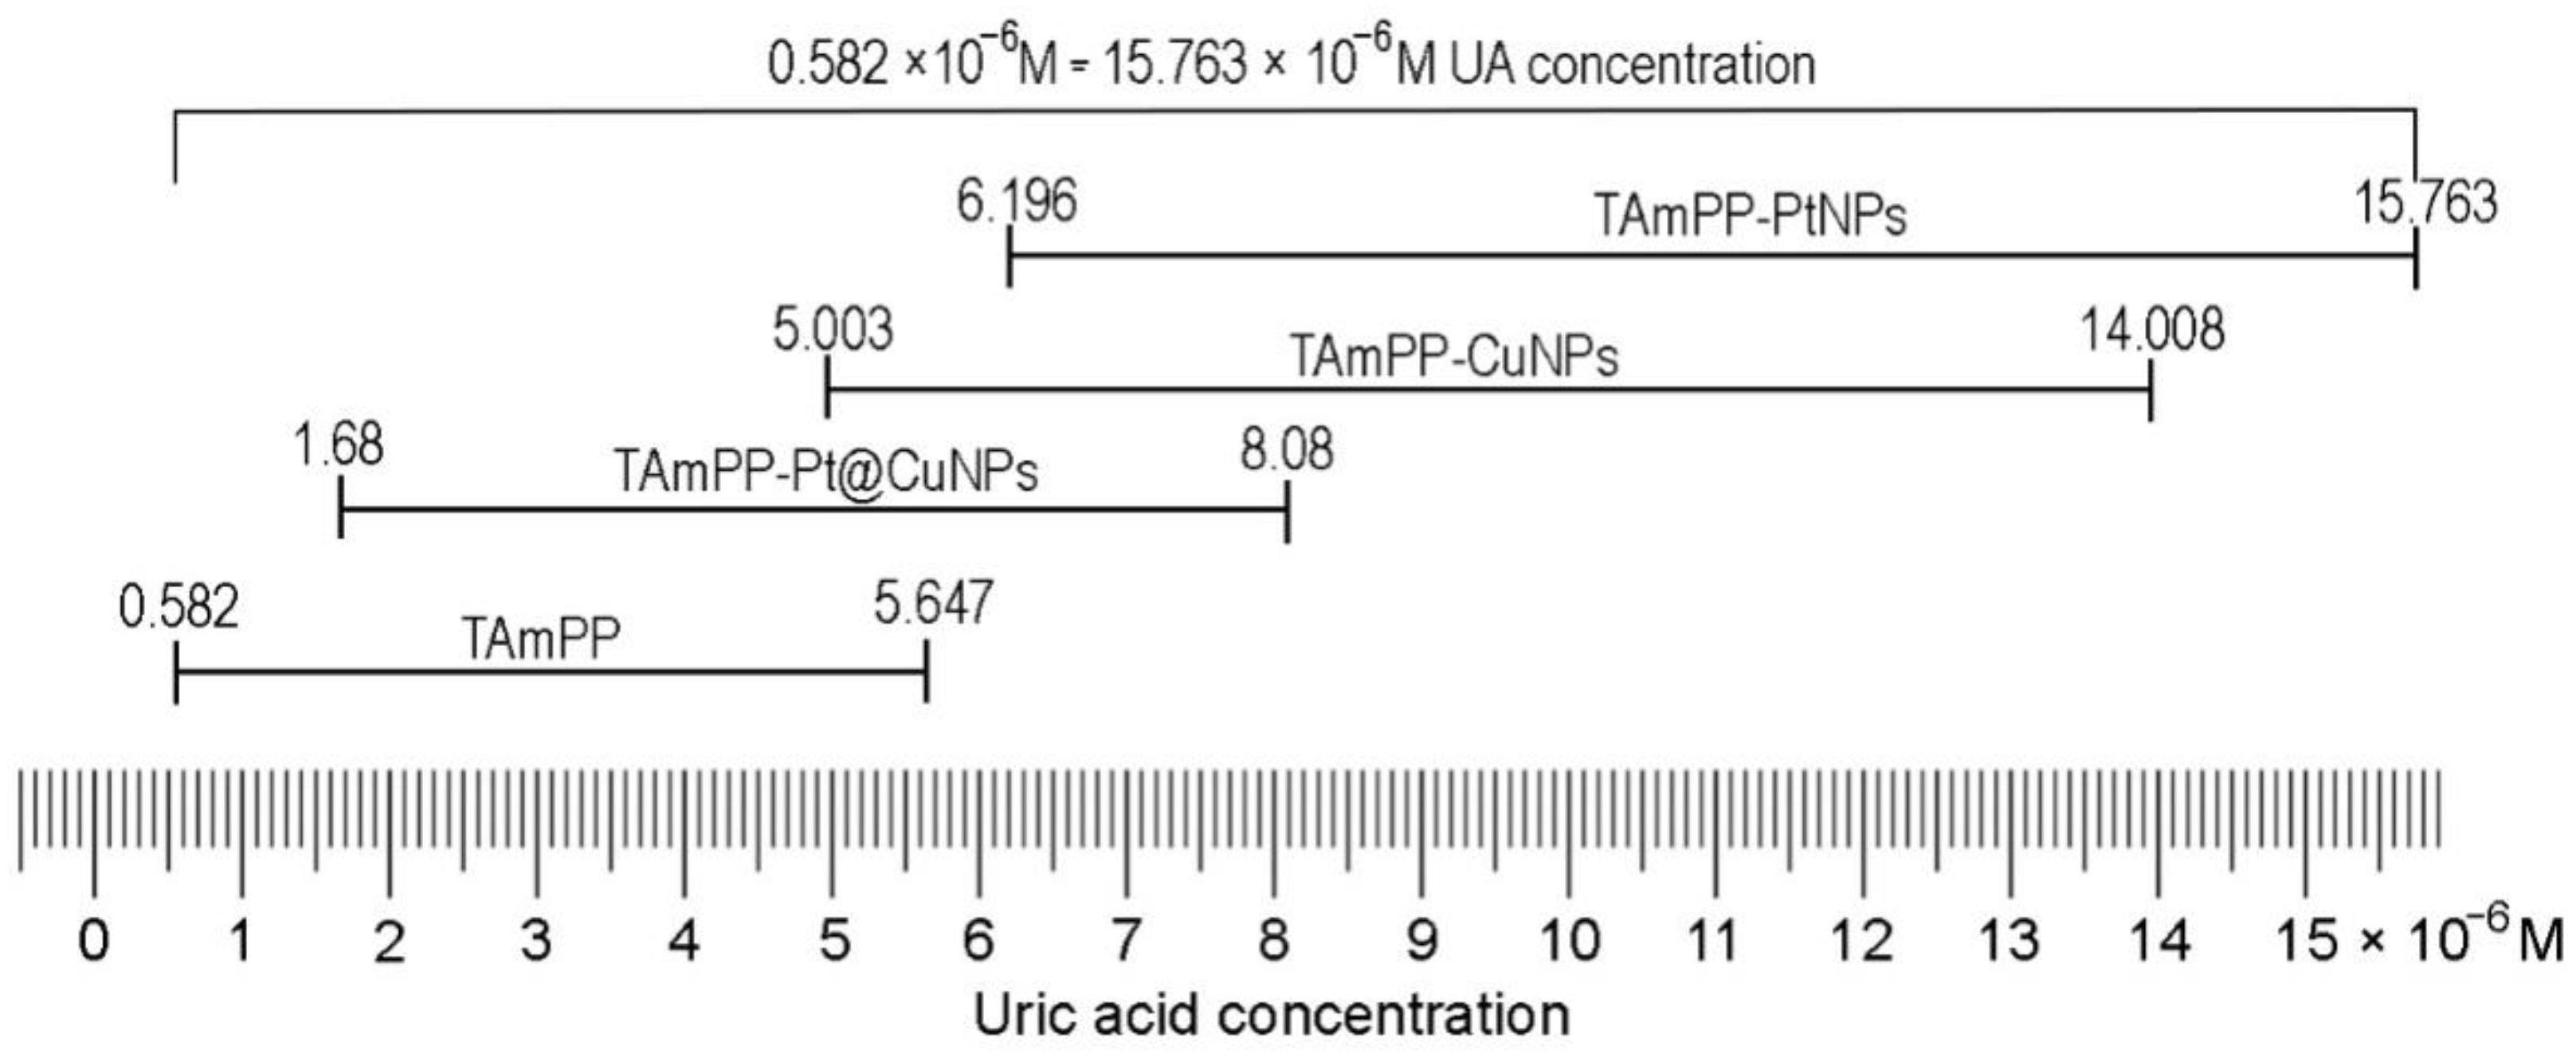
| 5,10,15,20-tetrakis(4-amino-phenyl)-porphyrin (TAmPP) | Spectro- photometric detection | 0.582 to 5.647 µM | 0.28 µM | -low detection limit | This work |
| (TAmPP) with copper nanoparticles (CuNPs) | Spectro- photometric detection | 5.003 to 14.01 µM | 0.61 µM | - CH3COONa and sodium salicylate in high concentrations can induce errors | This work |
| (TAmPP) with platinum nanoparticles (PtNPs) | Spectro- photometric detection | 6.196 to 15.763 µM | 0.57 µM | -good and stable response for UA in the presence of the most common interference species in biological fluids. -wide range of detection | This work |
| (TAmPP) with Pt@CuNPs | Spectro- photometric detection | 1.68 × to 8.08 µM | 0.41 µM | -CH3COONa and sodium salicylate introduces small errors | This work |
2. Materials and Methods
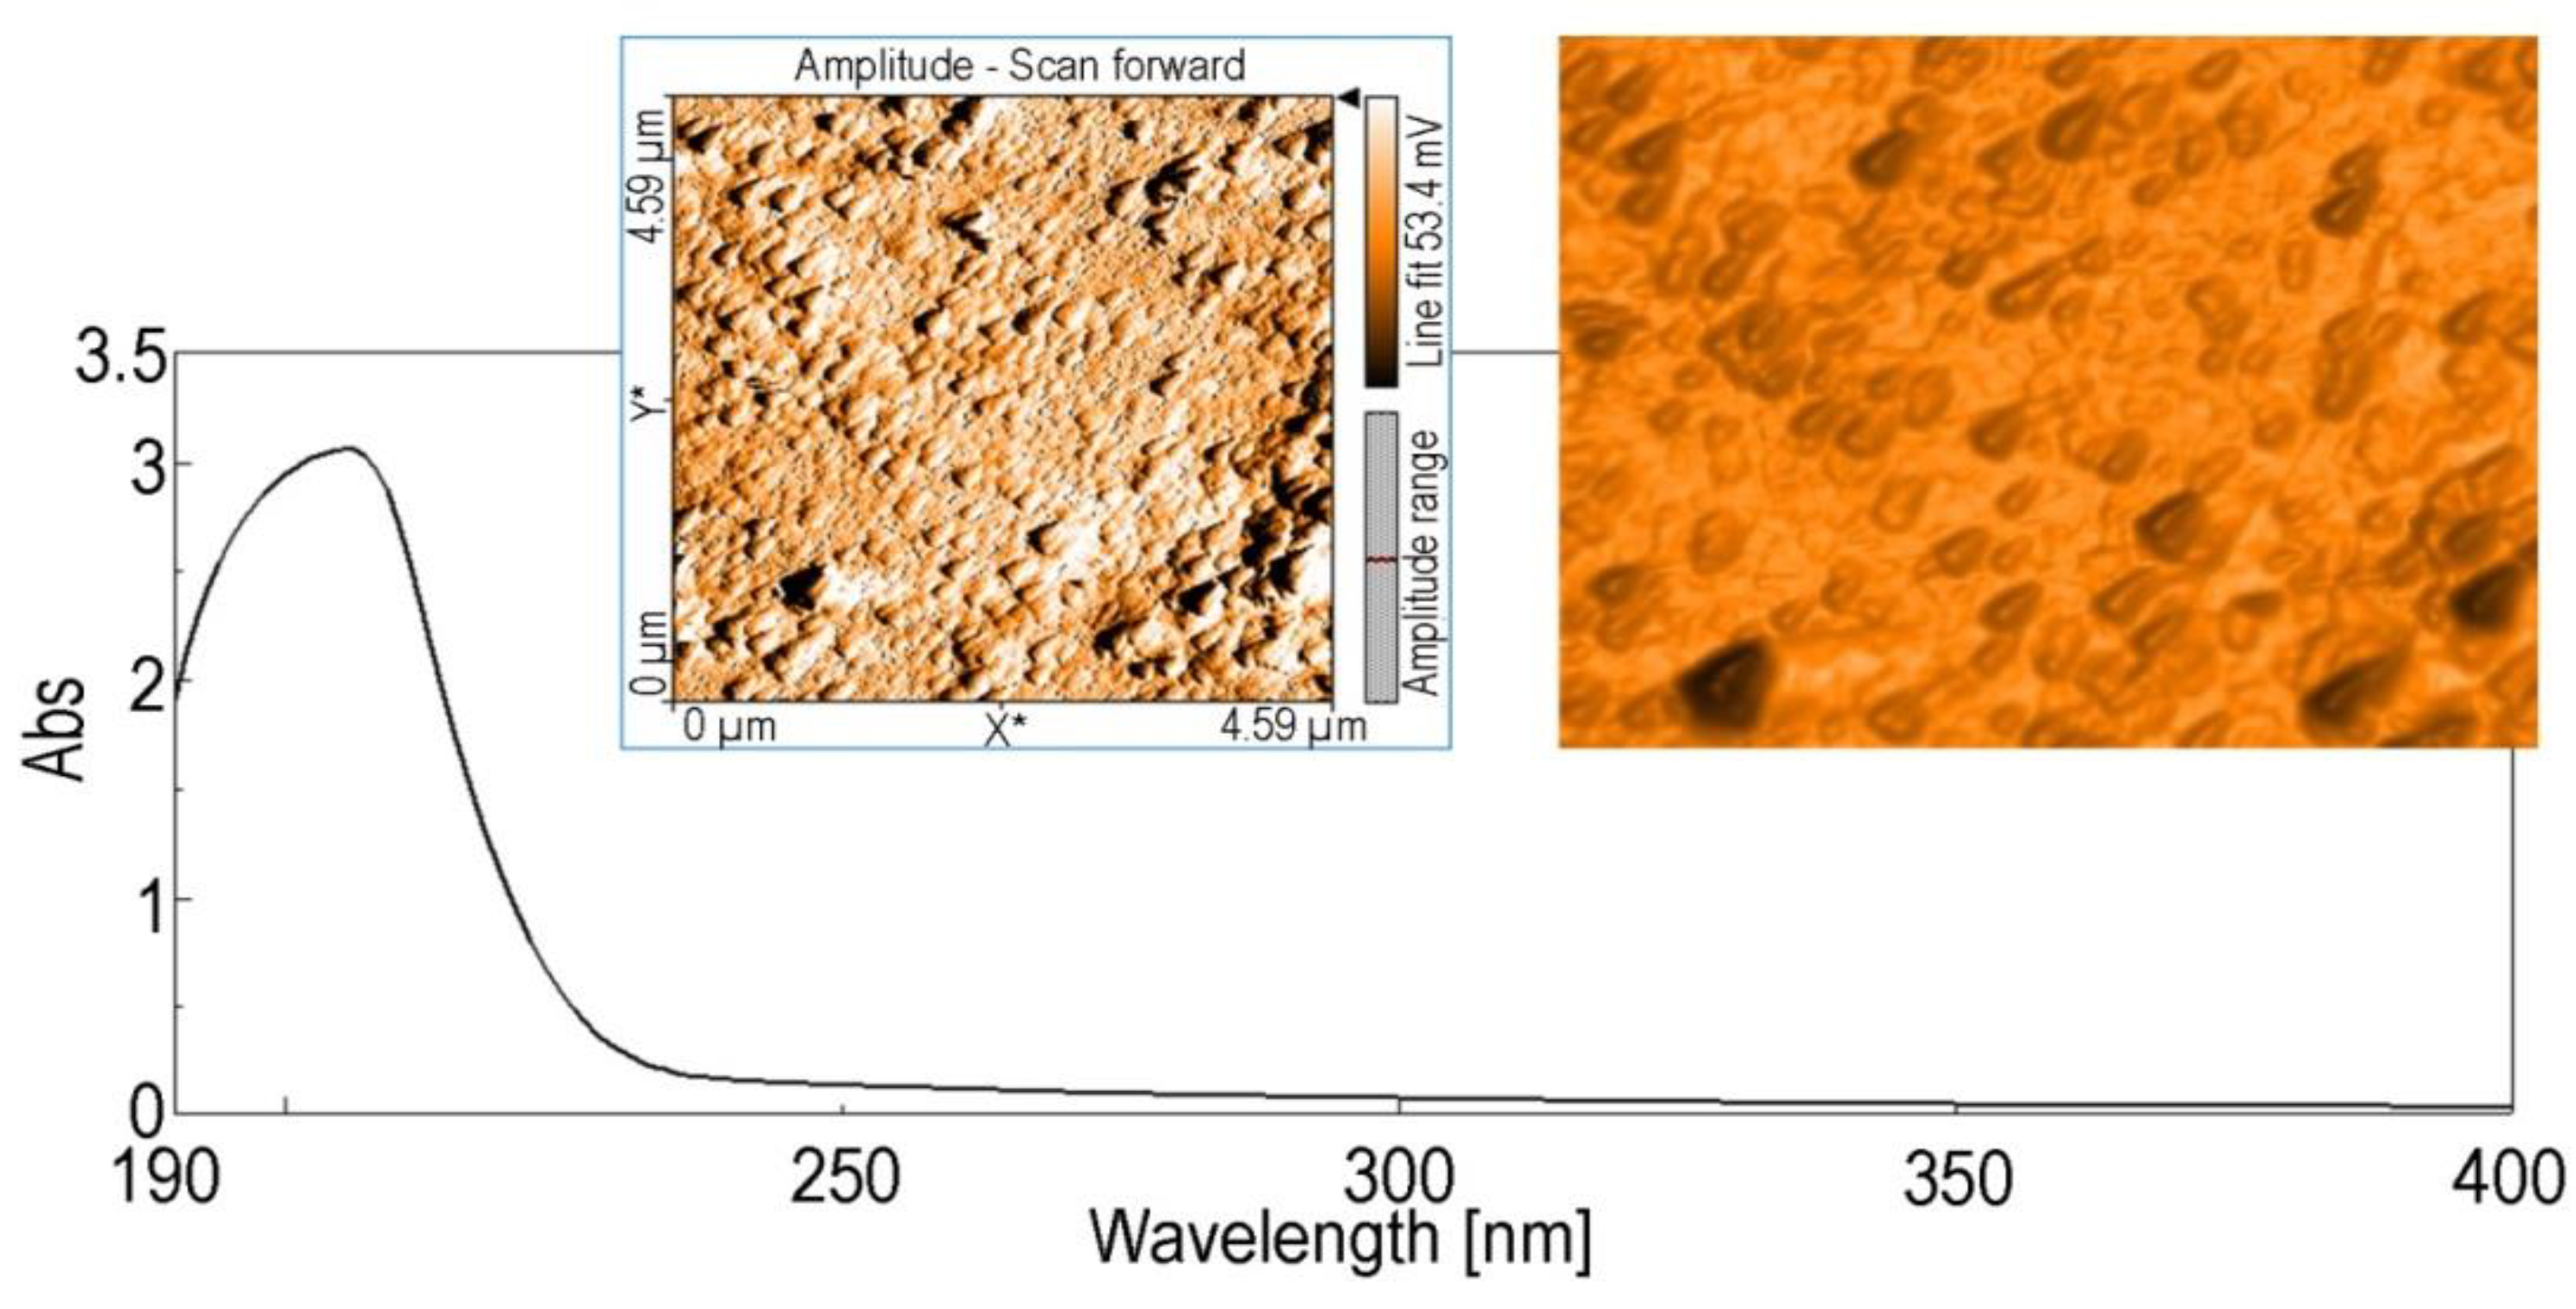
2.1. Atomic Force Microscopy (AFM)
2.2. UV-Vis Spectroscopy
2.3. X-ray Diffraction (XRD)
2.4. Emission-Scanning Electron Microscopy—(SEM)
2.5. Reagents
2.6. Calculation of the Detection Limit
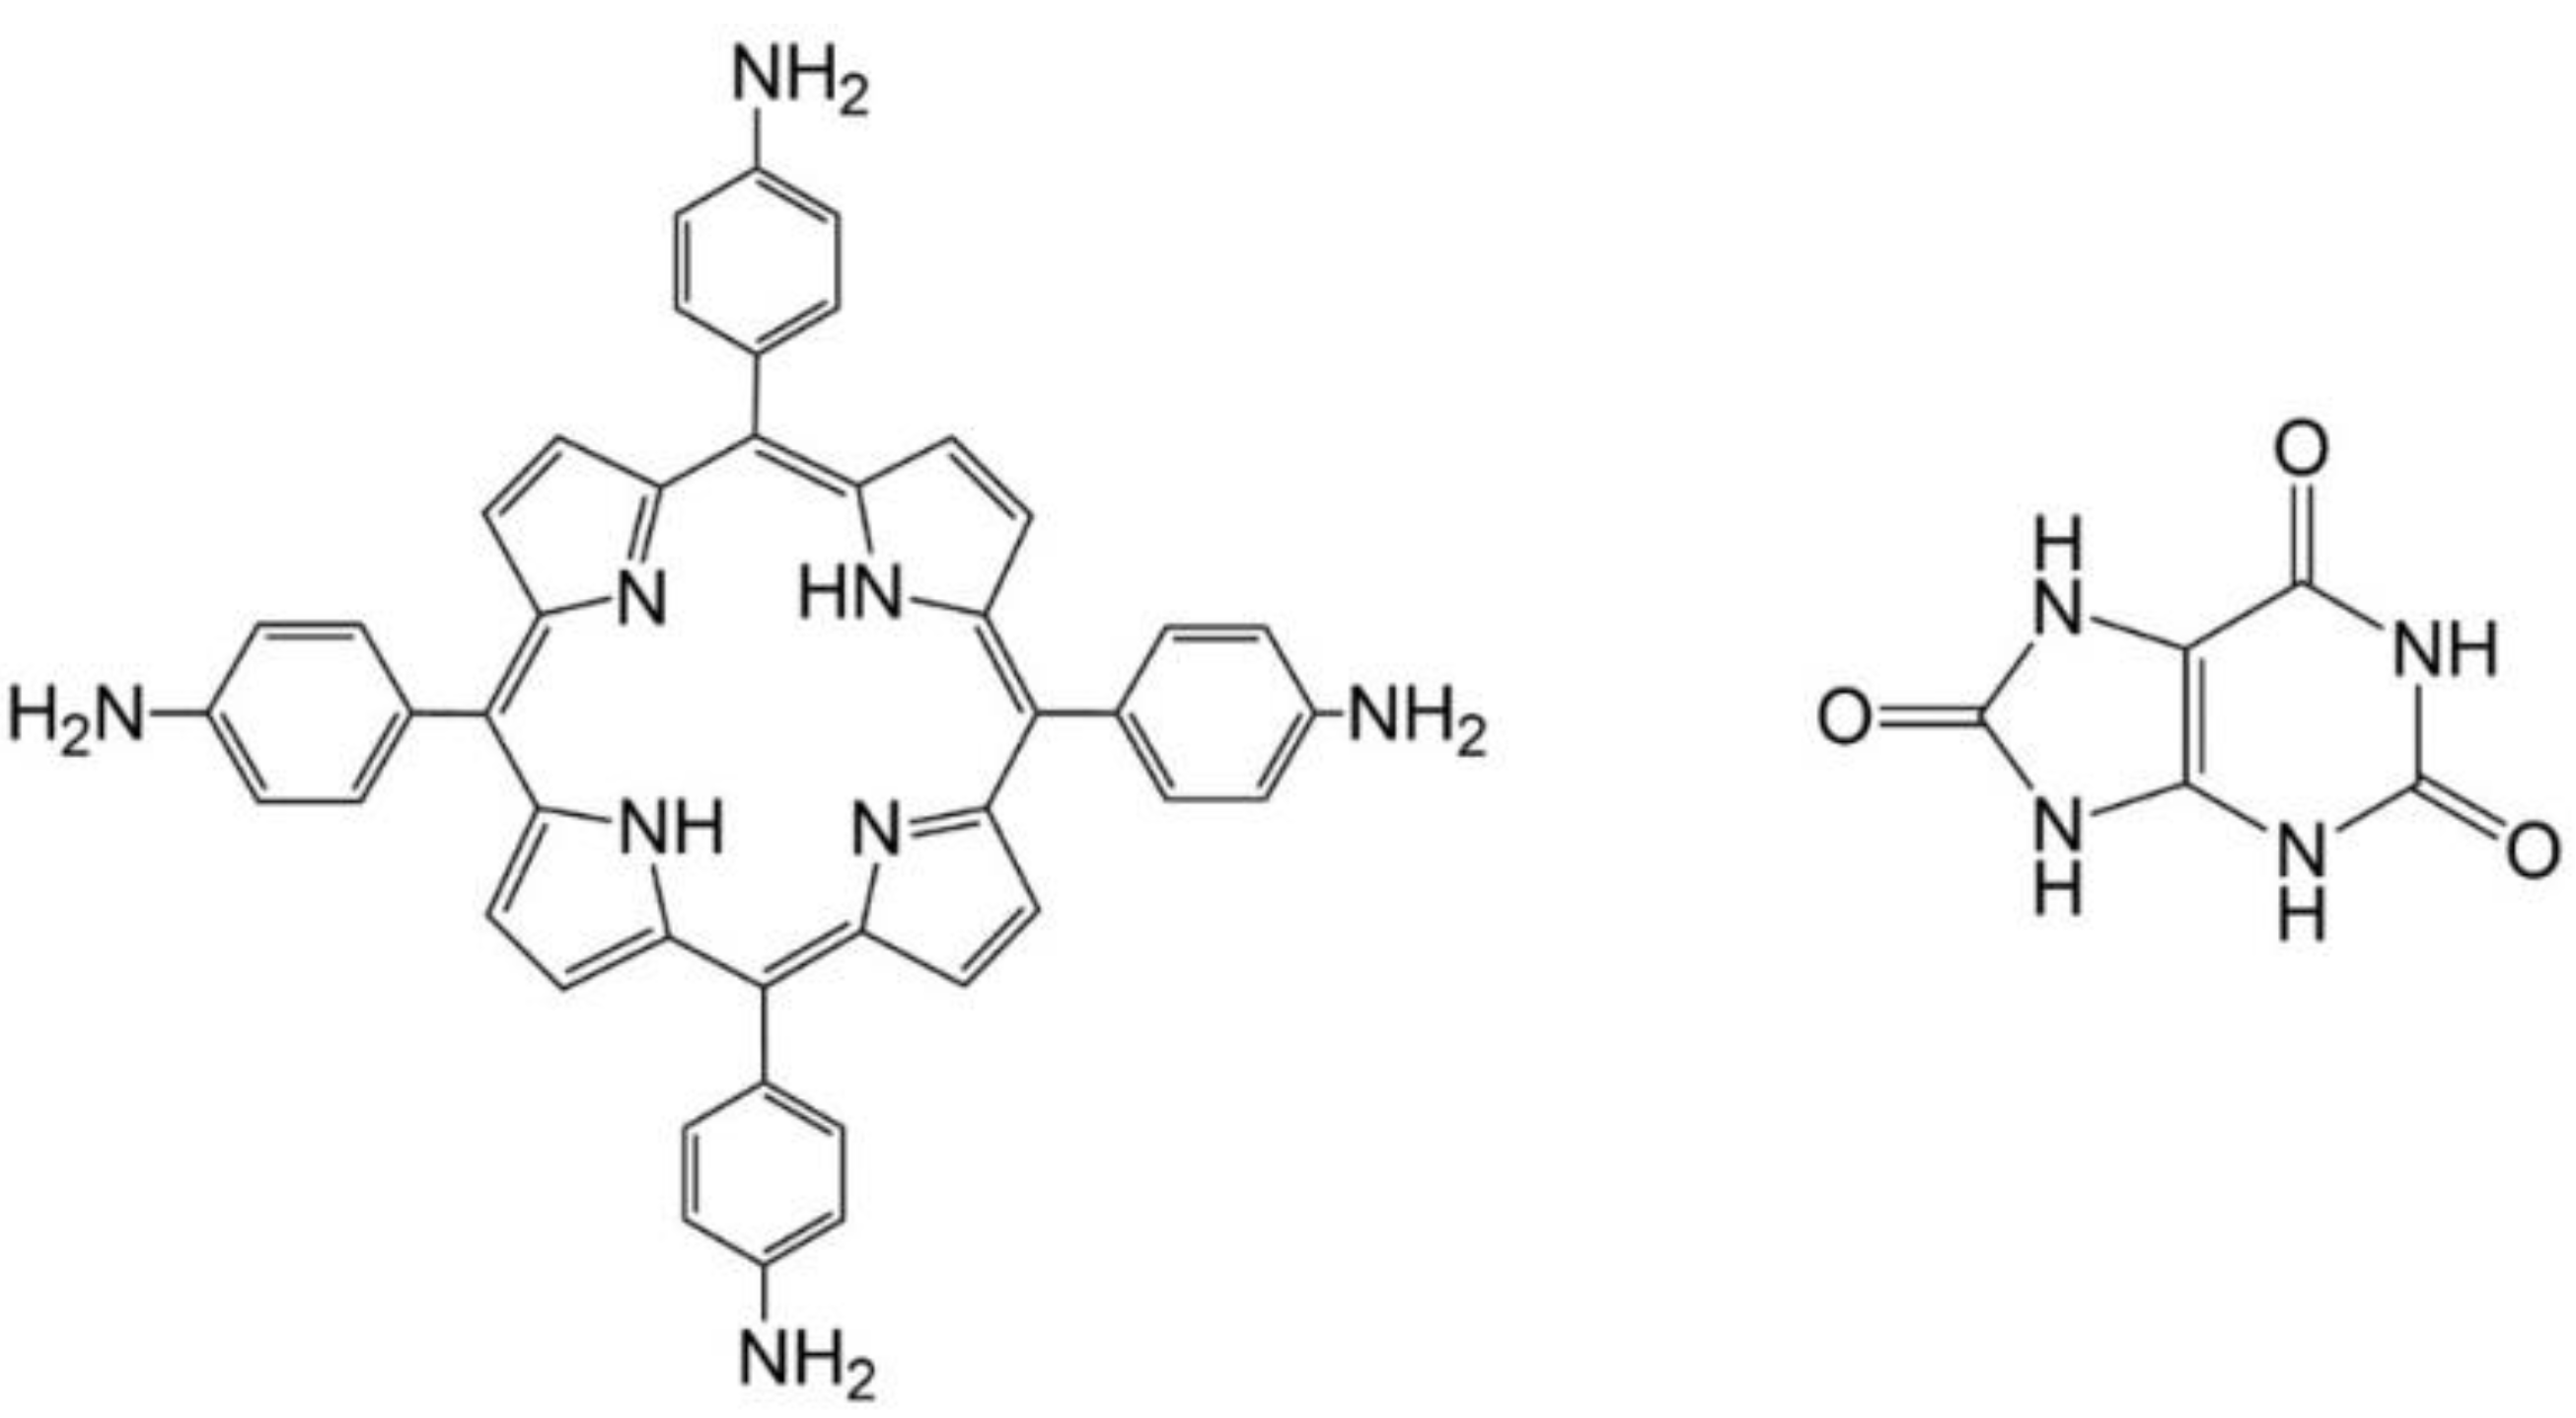
2.7. Obtaining of 5,10,15,20-Tetrakis(4-amino-phenyl)porphyrin (TAmPP)
2.8. Synthesis of the Copper Colloid (CuNPs)
2.9. Obtaining of Hybrid Complex between CuNPs and TAmPP Porphyrin
2.10. Obtaining of Mixed Nanoparticles with Cu Core and Pt Shell Pt@CuNPs
2.11. Obtaining of Hybrid Complex between Pt@CuNPs and TAmPP Porphyrin
2.12. Synthesis of the Platinum Colloid
2.13. Method for Obtaining of the Hybrid Material between TAmPP and PtNPs
2.14. X-ray Diffraction (XRD) Characterization of the CuNPs, PtNPs and Platinum Covered Copper Core Nanoparticles (Pt@CuNPs)
2.15. Emission-Scanning Electron Microscopy—(SEM) Characterization of the CuNPs, PtNPs and (Pt@CuNPs) Nanoparticles
3. Results and Discussions
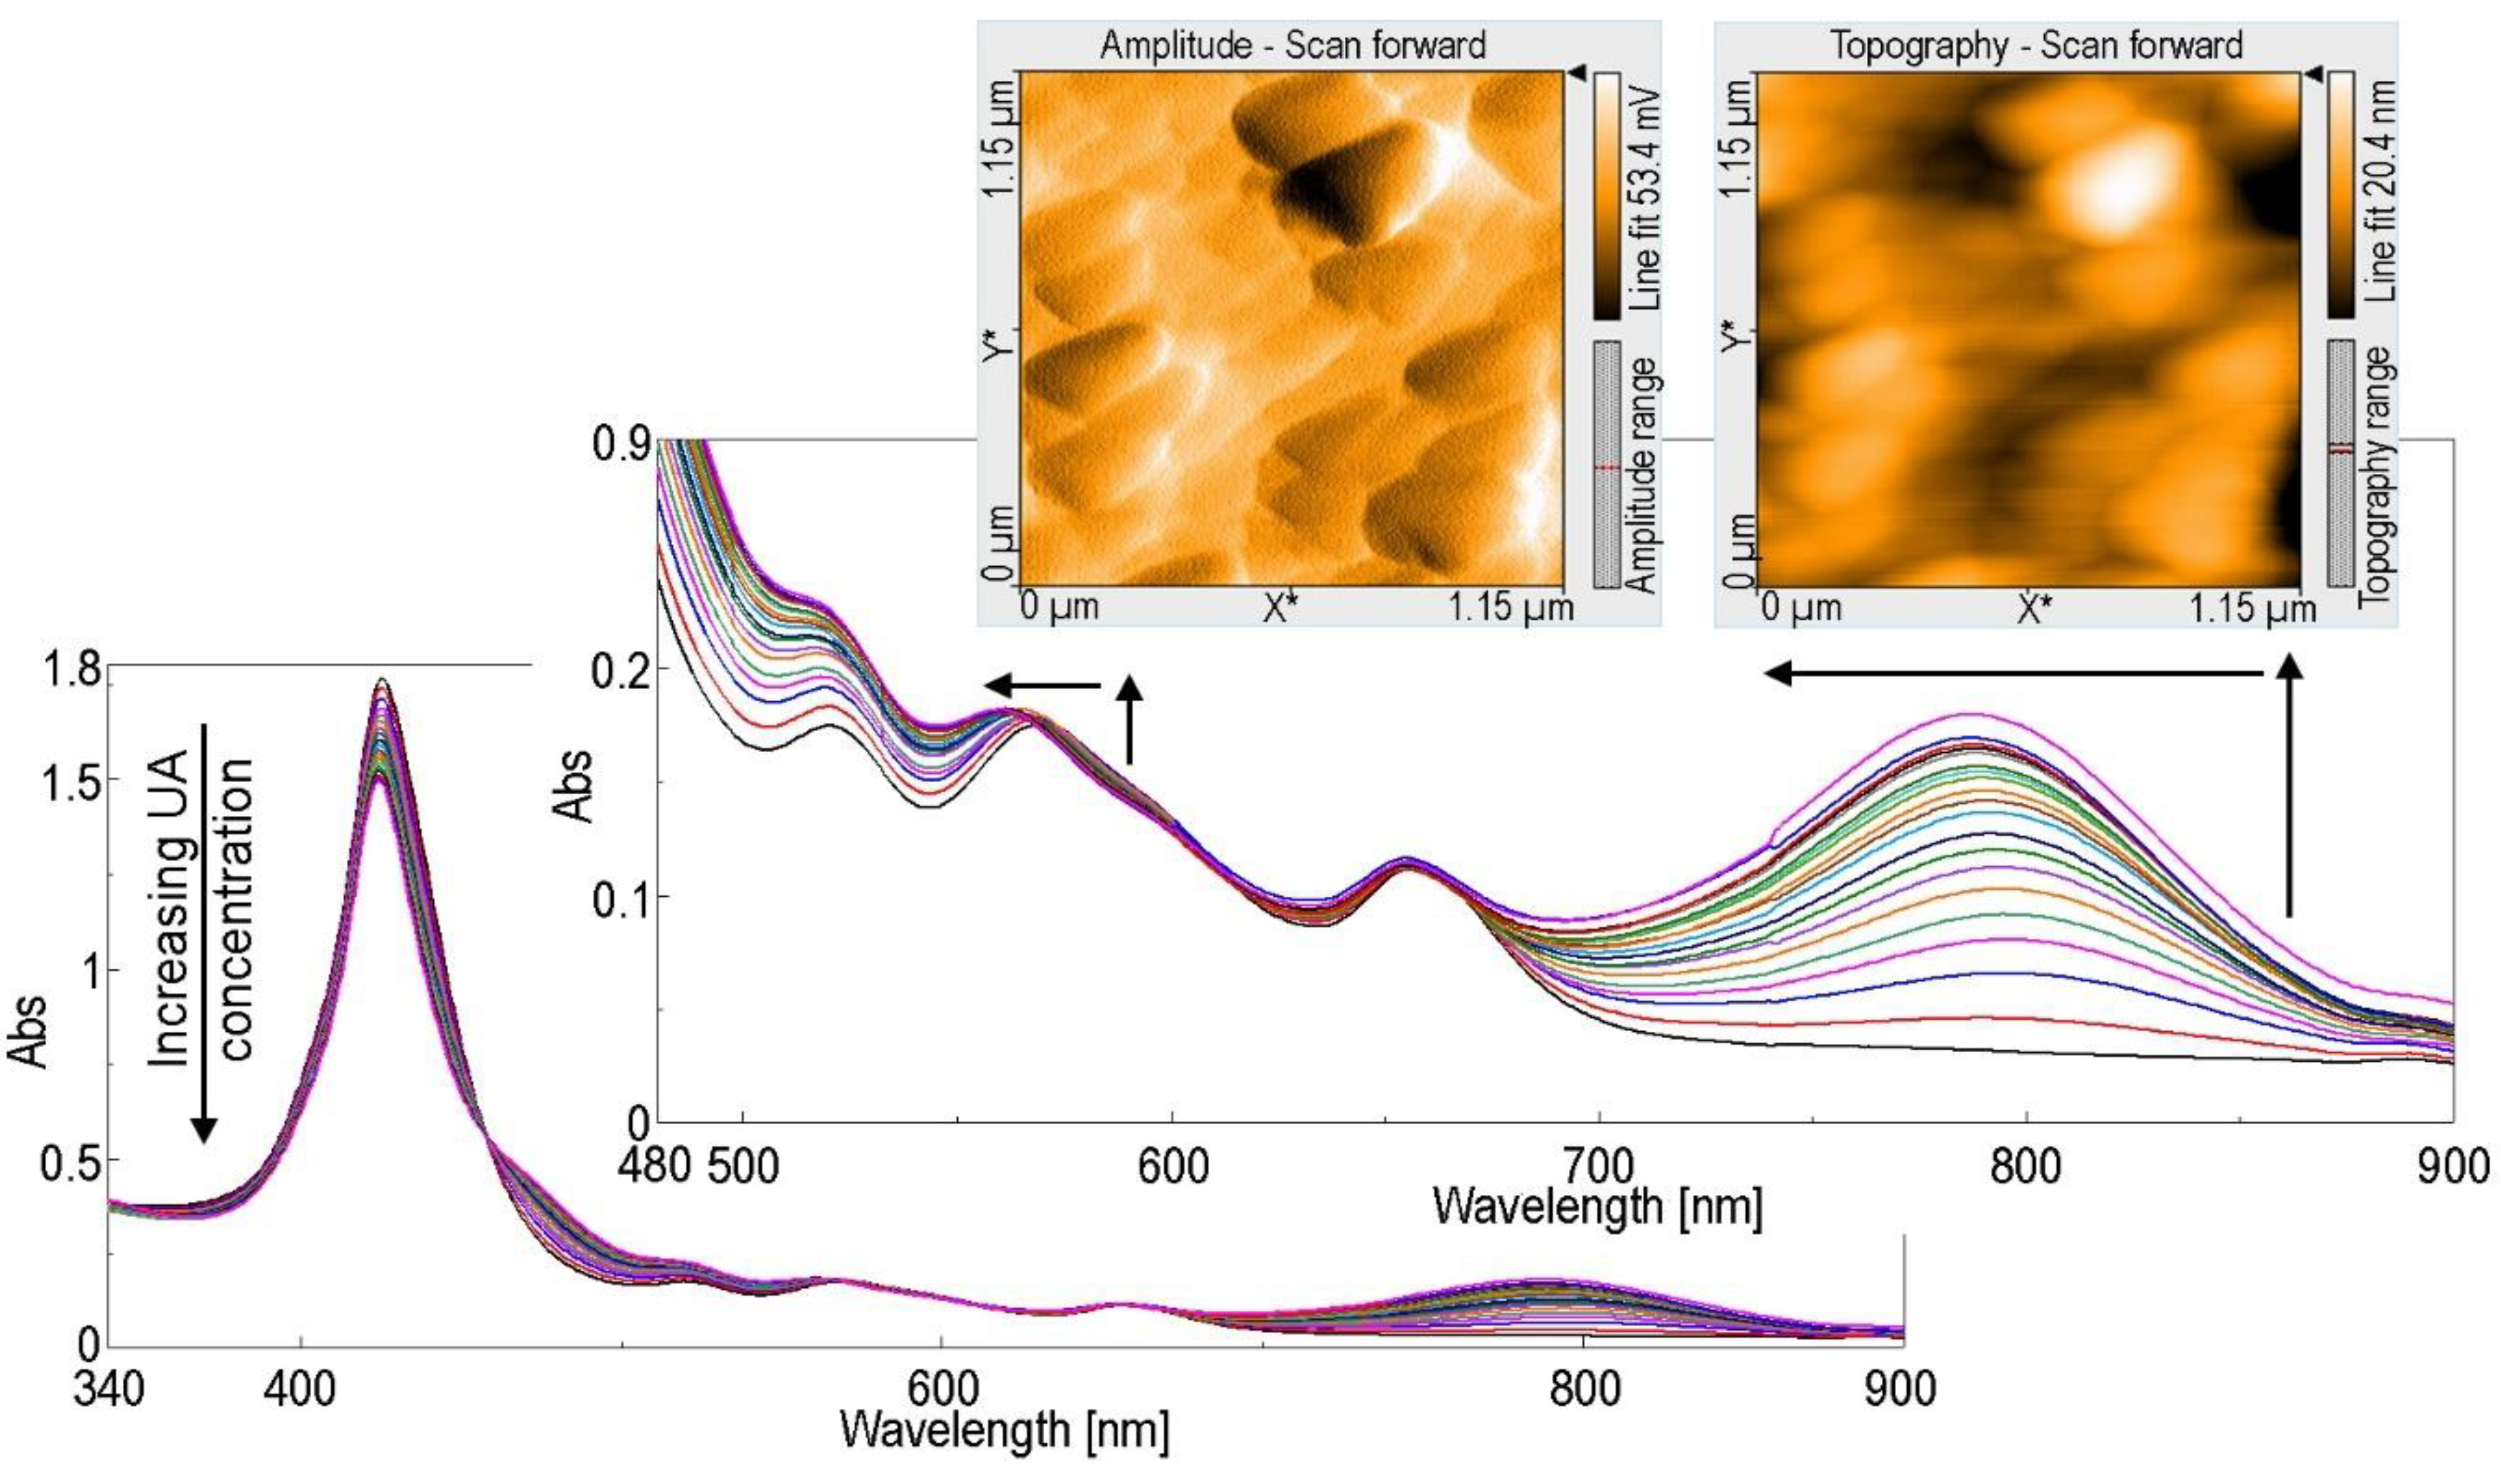
3.1. Detection of UA Using Acidified TAmPP Solution in DMSO
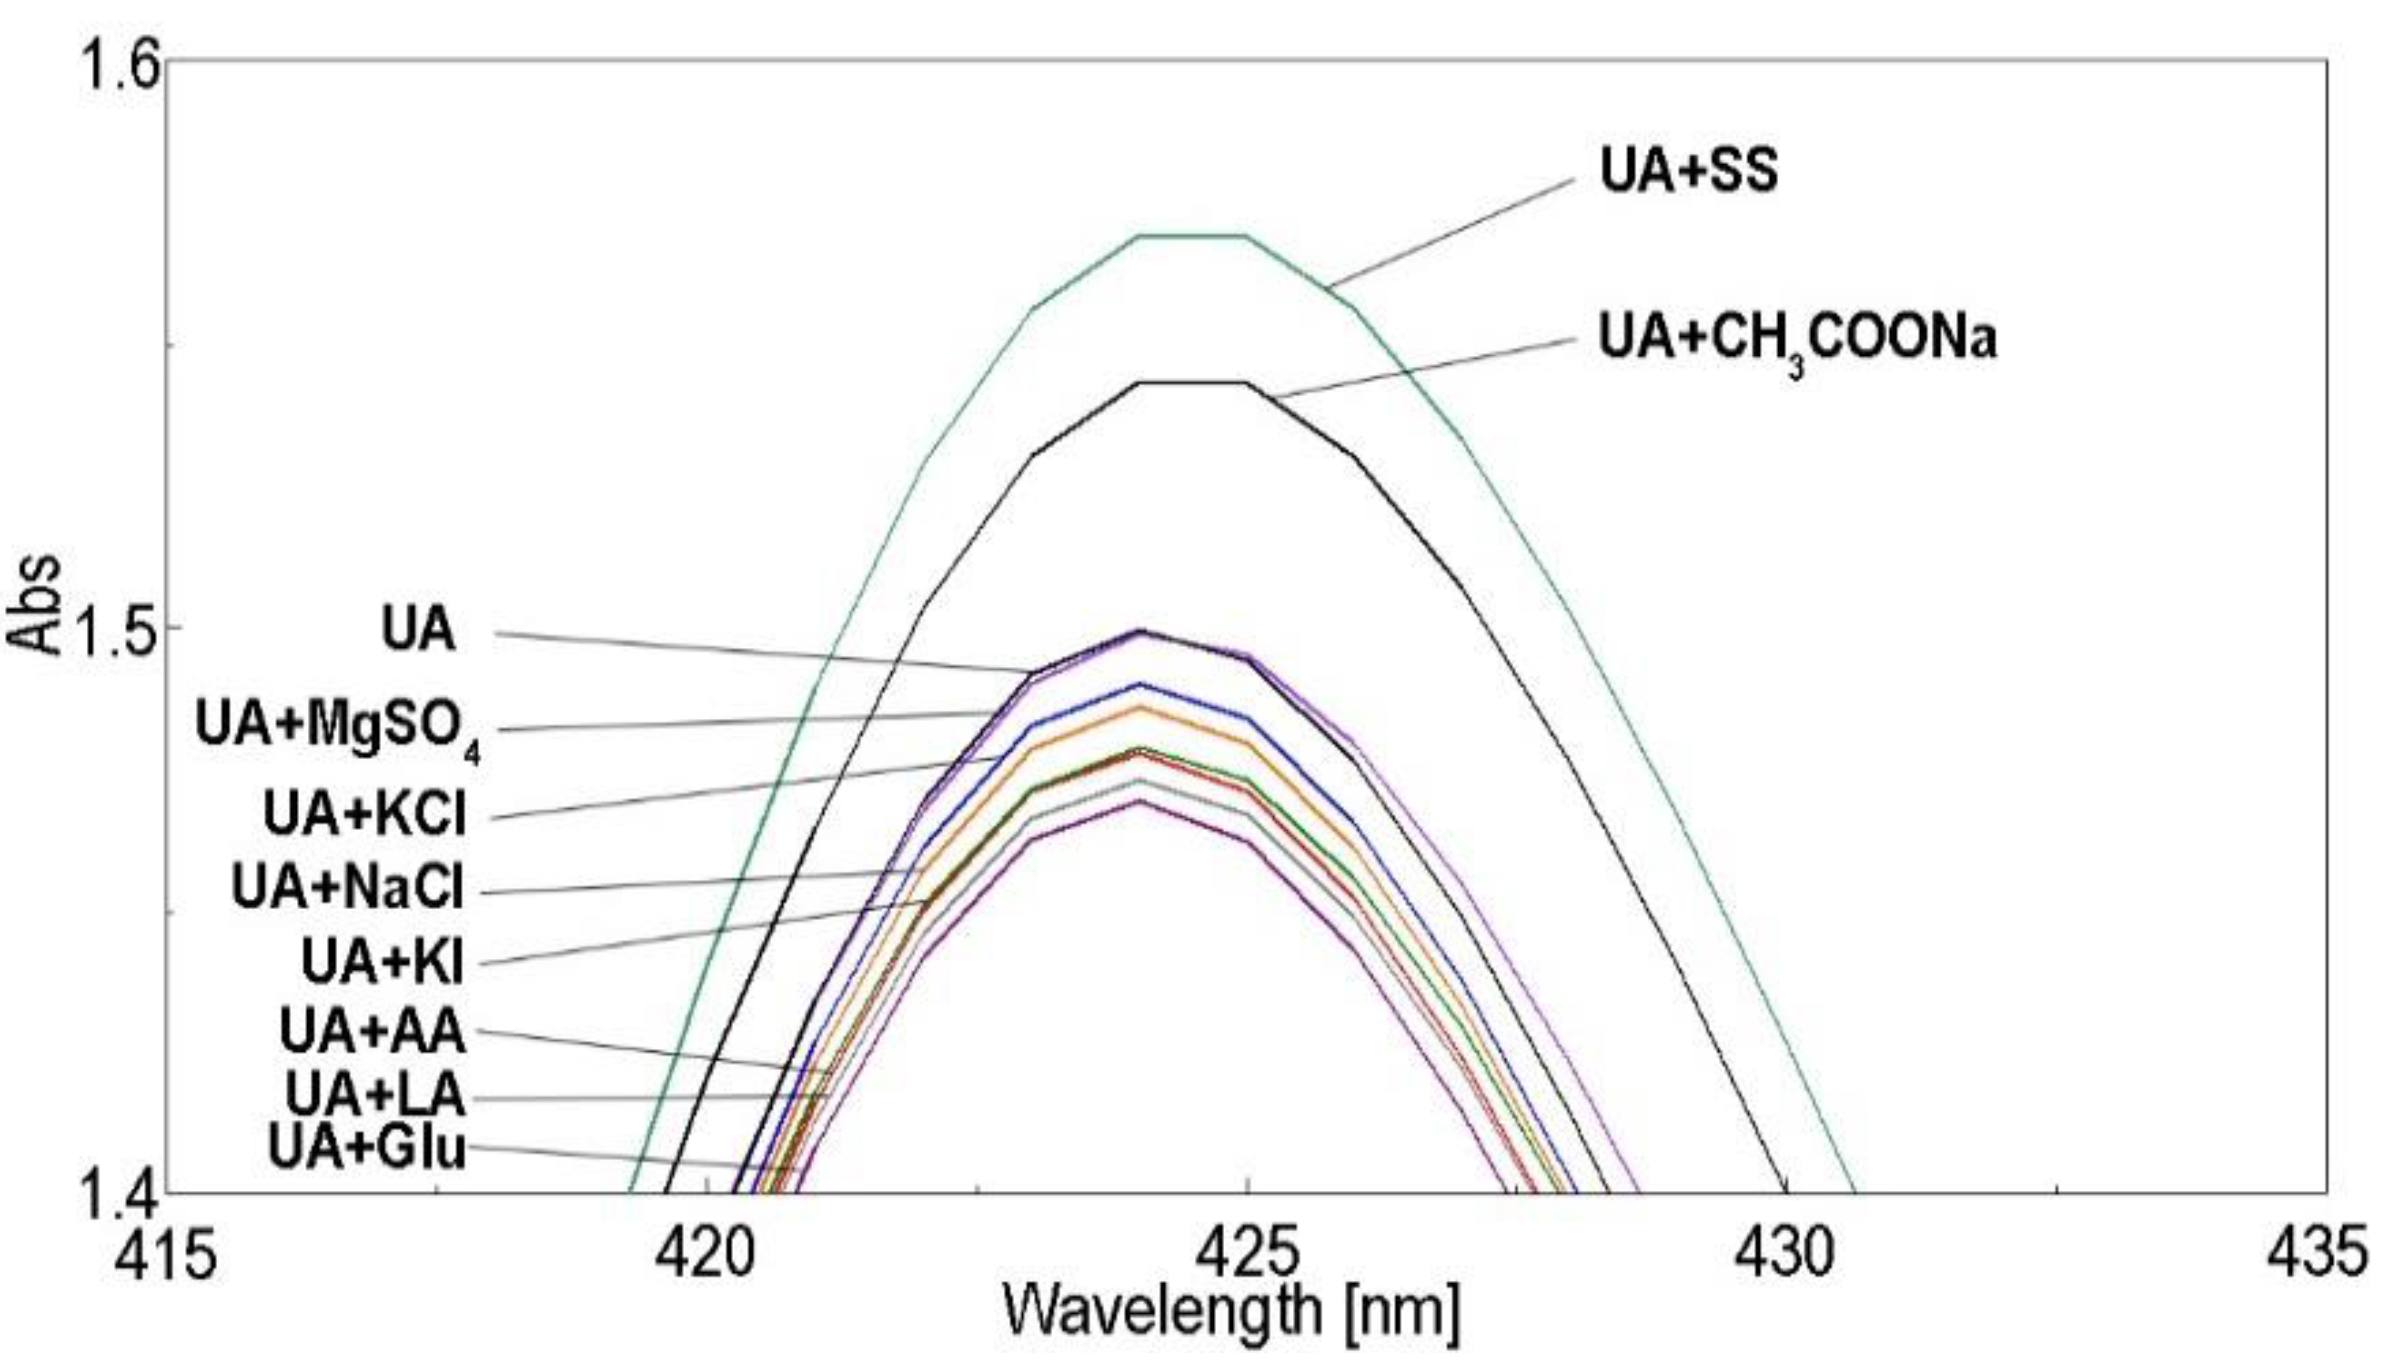
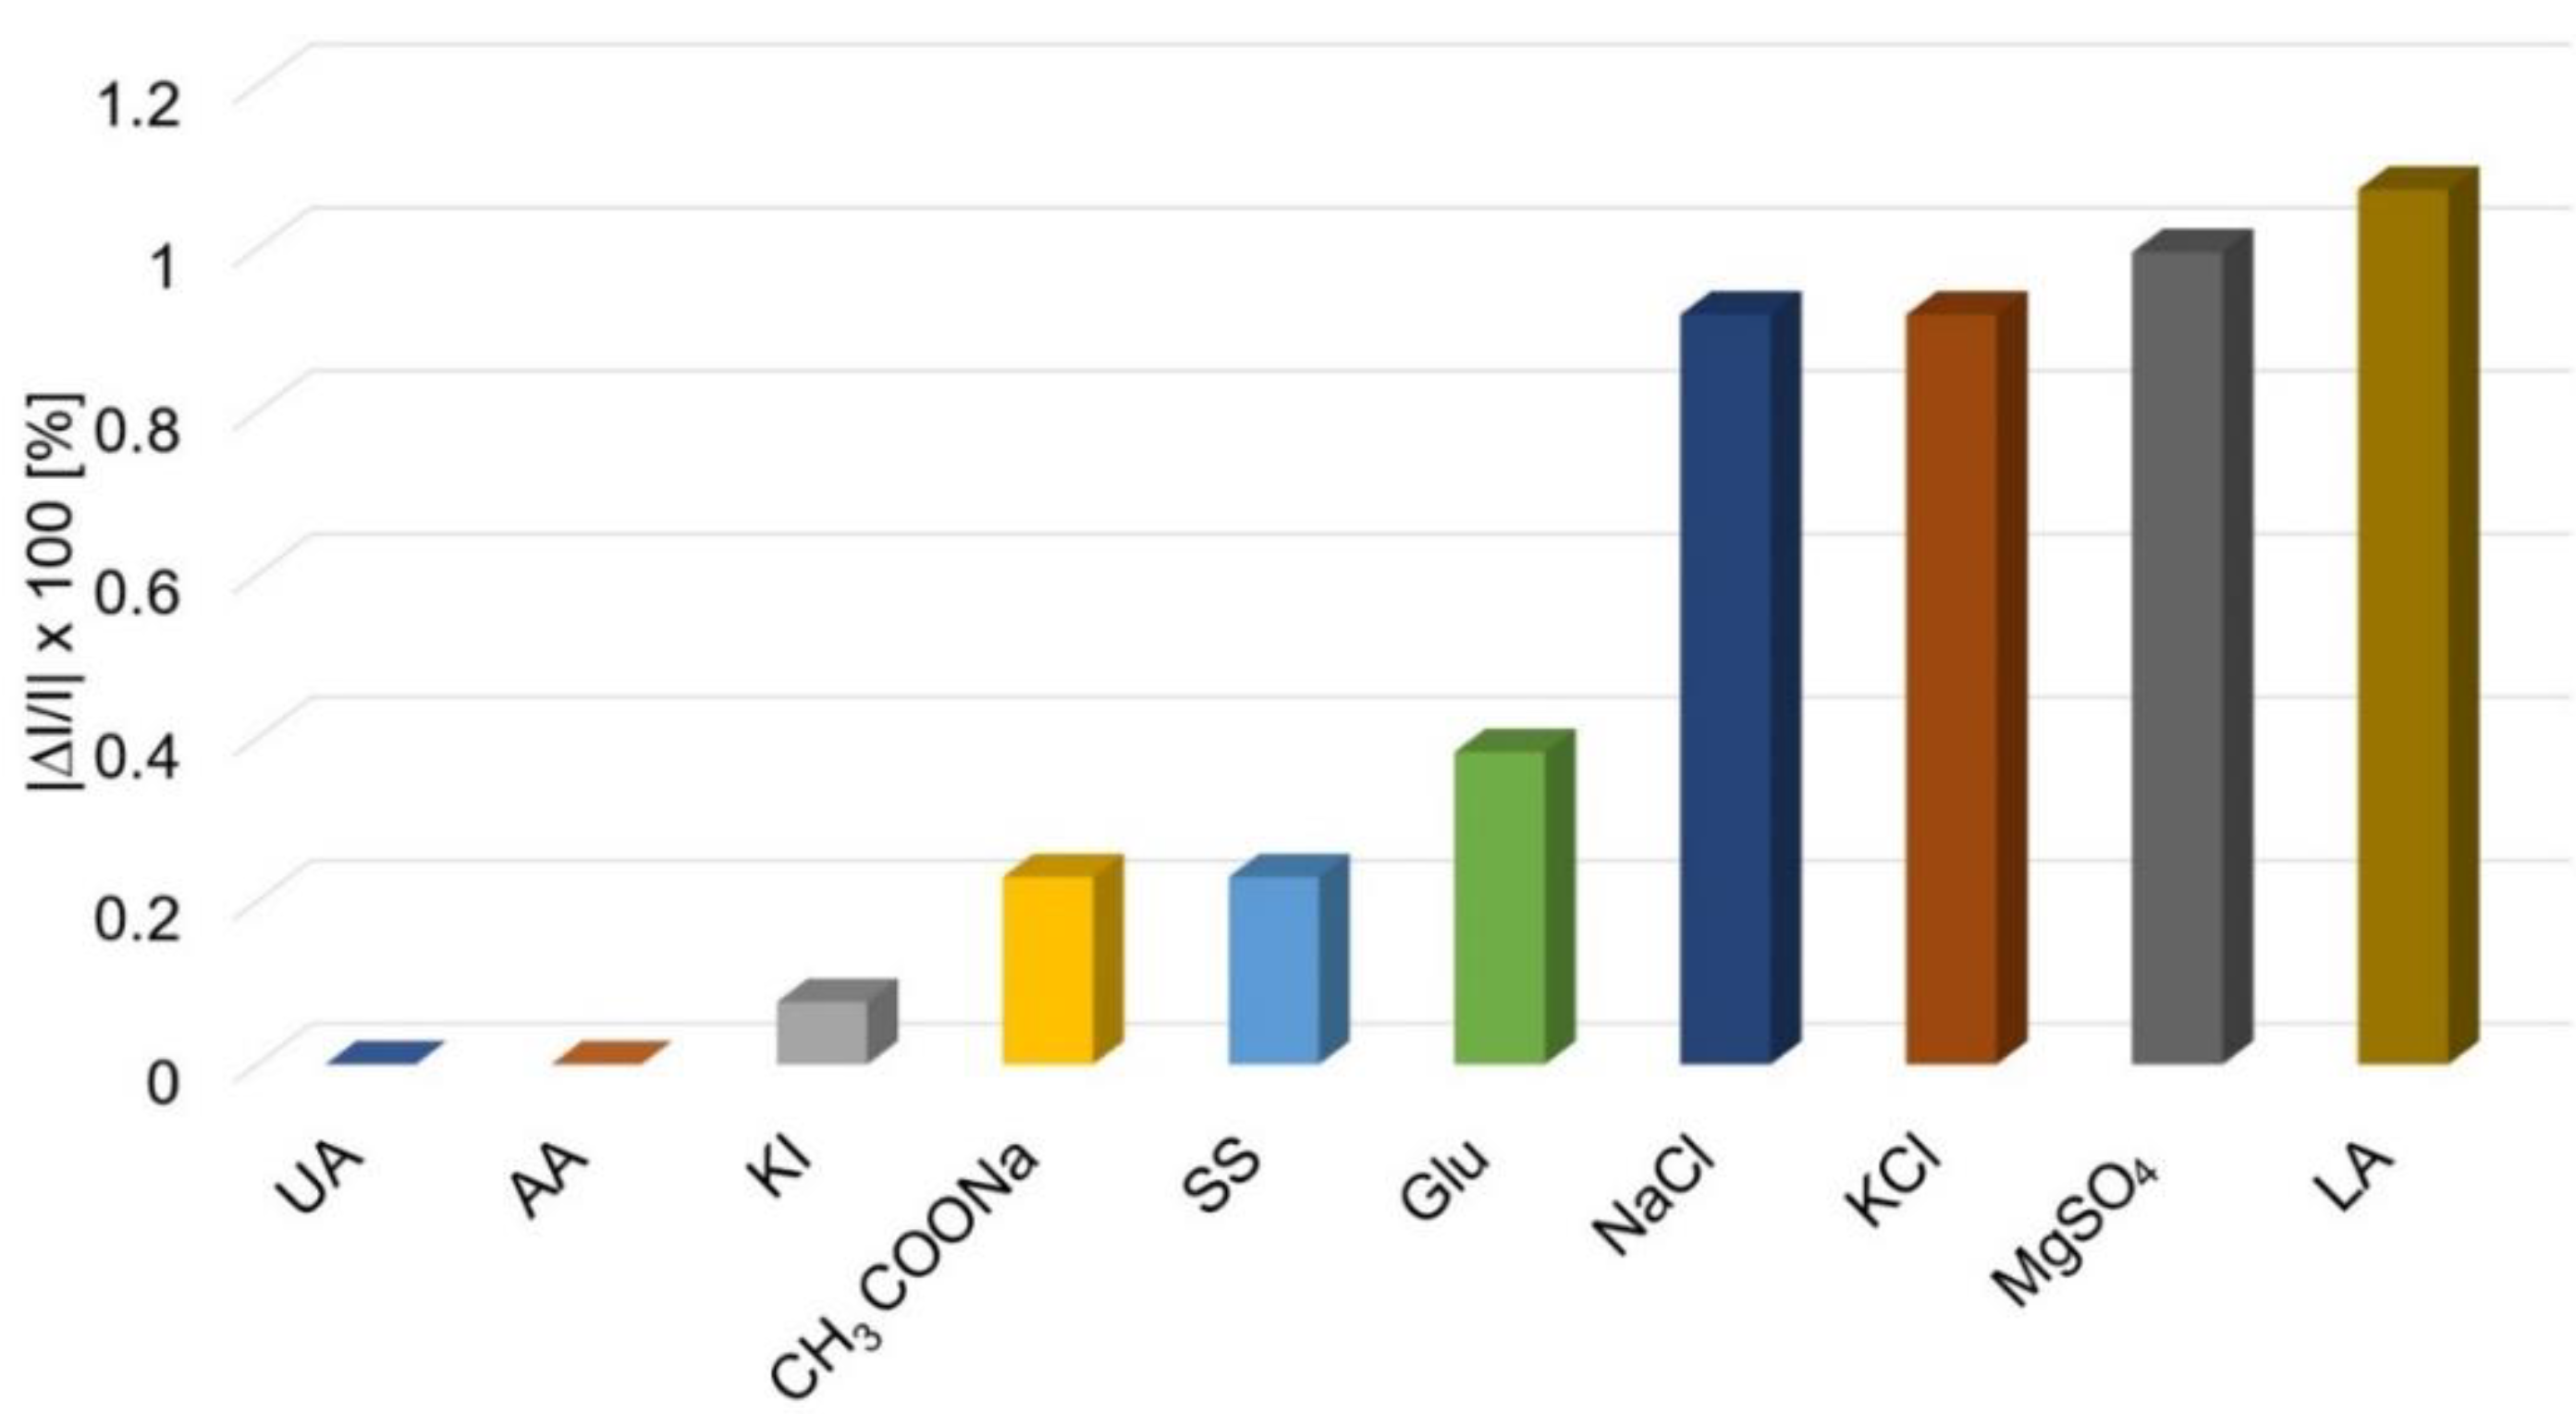
3.1.1. Interference Study
3.1.2. Mechanism of Detection of Uric Acid by Solely Porphyrin
3.2. Detection of Uric Acid with TAmPP- CuNPs Hybrid Material
3.3. Detection of UA Using TAmPP- Pt@CuNPs Hybrid Material
3.3.1. Interference Study
3.4. Detection of UA Using TAmPP-PtNPs Hybrid Complex
Interference Study
3.5. Real Test on Synthetic Solution Using TAmPP-PtNPs Complex
4. Conclusions
Supplementary Materials
Author Contributions
Funding
Institutional Review Board Statement
Informed Consent Statement
Data Availability Statement
Conflicts of Interest
References
- Ramesh, P.; Sampath, S. Selective Determination of Uric Acid in Presence of Ascorbic Acid and Dopamine at Neutral pH Using Exfoliated Graphite Electrodes. Electroanalysis 2004, 16, 866–869. [Google Scholar] [CrossRef] [Green Version]
- Zhang, F.; Ma, P.; Deng, X.; Sun, Y.; Wang, X.; Song, D. Enzymatic determination of uric acid using water-soluble CuInS/ZnS quantum dots as a fluorescent probe. Microchim. Acta 2018, 185, 499. [Google Scholar] [CrossRef] [PubMed]
- Qu, S.; Li, Z.; Jia, Q. Detection of Purine Metabolite Uric Acid with Picolinic-Acid-Functionalized Metal–Organic Frameworks. ACS Appl. Mater. Interfaces 2019, 11, 34196–34202. [Google Scholar] [CrossRef] [PubMed]
- Wang, C.; Yuan, R.; Chai, Y.; Zhang, Y.; Hu, F.; Zhang, M. Au-nanoclusters incorporated 3-amino-5-mercapto-1,2,4-triazole film modified electrode for the simultaneous determination of ascorbic acid, dopamine, uric acid and nitrite. Biosens. Bioelectron 2011, 30, 315–319. [Google Scholar] [CrossRef]
- Income, K.; Ratnarathorn, N.; Khamchaiyo, N.; Srisuvo, C.; Ruckthong, L.; Dungchai, W. Disposable Nonenzymatic Uric Acid and Creatinine Sensors Using μPAD Coupled with Screen-Printed Reduced Graphene Oxide-Gold Nanocomposites. Int. J. Anal. Chem. 2019, 2019, 3457247. [Google Scholar] [CrossRef] [Green Version]
- Abellán-Llobregat, A.; Vidal, L.; Rodríguez-Amaro, R.; Berenguer-Murcia, Á.; Canals, A.; Morallón, E. Au-IDA microelectrodes modified with Au-doped graphene oxide for the simultaneous determination of uric acid and ascorbic acid in urine samples. Electrochim. Acta 2017, 227, 275–284. [Google Scholar] [CrossRef] [Green Version]
- Leko, M.B.; Gunjača, I.; Pleić, N.; Zemunik, T. Environmental Factors Affecting Thyroid-Stimulating Hormone and Thyroid Hormone Levels. Int. J. Mol. Sci. 2021, 22, 6521. [Google Scholar] [CrossRef]
- Sundar, S.; Kwon, S.J.; Venkatachalam, G. Magneto-Biosensor for the Detection of Uric Acid Using Citric Acid-Capped Iron Oxide Nanoparticles. J. Nanosci. Nanotechnol. 2020, 20, 2144–2153. [Google Scholar] [CrossRef]
- Huang, L.; Jiao, S.; Li, M. Determination of uric acid in human urine by eliminating ascorbic acid interference on copper(II)-polydopamine immobilized electrode surface. Electrochim. Acta 2014, 121, 233–239. [Google Scholar] [CrossRef]
- Flowers, P.A.; Dong, X.; Bounds, J.G. Kinetic Spectroelectrochemical Assay for Uric Acid in Human Urine. Electroanalysis 2020, 33, 75–80. [Google Scholar] [CrossRef]
- Hernández, S.; Perales-Rondon, J.V.; Heras, A.; Colina, A. Determination of uric acid in synthetic urine by using electrochemical surface oxidation enhanced Raman scattering. Anal. Chim. Acta 2019, 1085, 61–67. [Google Scholar] [CrossRef]
- Amjadi, M.; Manzoori, J.L.; Hallaj, T. Chemiluminescence of graphene quantum dots and its application to the determination of uric acid. J. Lumin. 2014, 153, 73–78. [Google Scholar] [CrossRef]
- Zuo, Y.; Wang, C.; Zhou, J.; Sachdeva, A.; Ruelos, V.C. Simultaneous Determination of Creatinine and Uric Acid in Human Urine by High-Performance Liquid Chromatography. Anal. Sci. 2008, 24, 1589–1592. [Google Scholar] [CrossRef] [Green Version]
- Gupta, R.; Ganesan, V. Gold nanoparticles impregnated mesoporous silica spheres for simultaneous and selective determination of uric acid and ascorbic acid. Sens. Actuators B Chem. 2015, 219, 139–145. [Google Scholar] [CrossRef]
- Xu, P.; Li, R.; Tu, Y.; Yan, J. A gold nanocluster-based sensor for sensitive uric acid detection. Talanta 2015, 144, 704–709. [Google Scholar] [CrossRef] [PubMed]
- Liu, Y.; Li, H.; Guo, B.; Wei, L.; Chen, B.; Zhang, Y. Gold nanoclusters as switch-off fluorescent probe for detection of uric acid based on the inner filter effect of hydrogen peroxide-mediated enlargement of gold nanoparticles. Biosens. Bioelectron. 2017, 91, 734–740. [Google Scholar] [CrossRef]
- Norazmi, N.; Rasad, Z.R.A.; Mohamad, M.; Manap, H. Uric acid detection using uv-vis spectrometer. In Proceedings of the 4th International Conference on Mechanical Engineering Research, Kuantan, Malaysia, 1–2 August 2017; p. 012031. [Google Scholar]
- Gao, J.; Huang, W.; Chen, Z.; Yi, C.; Jiang, L. Simultaneous detection of glucose, uric acid and cholesterol using flexible microneedle electrode array-based biosensor and multi-channel portable electrochemical analyzer. Sens. Actuators B Chem. 2019, 287, 102–110. [Google Scholar] [CrossRef]
- Wang, X.; Chen, S.; Tang, X.; Lin, D.; Qiu, P. Ultrasensitive detection of uric acid in serum of patients with gout by a new assay based on Pt@Agnanoflowers. RSC Adv. 2019, 9, 36578–36585. [Google Scholar] [CrossRef] [Green Version]
- Norvaiša, K.; Kielmann, M.; Senge, M.O. Porphyrins as Colorimetric and Photometric Biosensors in Modern Bioanalytical Systems. ChemBioChem 2020, 21, 1793–1807. [Google Scholar] [CrossRef] [PubMed]
- Yang, Y.; Sun, R.; Li, M.; Geng, B.; Deng, J.; Tang, M. Porphyrin Functionalized Graphene for Sensitive Electrochemical Detection of Uric Acid. Int. J. Electrochem. Sci. 2016, 11, 7370–7379. [Google Scholar] [CrossRef]
- Guo, X.; Guo, B.; Li, C.; Wang, Y. Amperometric Highly Sensitive Uric Acid sensor Based on Manganese(III)porphyrin-Graphene Modified Glassy Carbon Electrode. J. Electroanal. Chem. 2016, 783, 8–14. [Google Scholar] [CrossRef]
- Wang, C.; Yuan, R.; Chai, Y.; Chen, S.; Zhang, Y.; Hu, F.; Zhang, M. Non-covalent iron(III)-porphyrin functionalized multi-walled carbon nanotubes for the simultaneous determination of ascorbic acid, dopamine, uric acid and nitrite. Electrochim. Acta 2012, 62, 109–115. [Google Scholar] [CrossRef]
- Deng, K.; Zhou, J.; Li, X. Noncovalent nanohybrid of cobalt tetraphenylporphyrin with graphene for simultaneous detection of ascorbic acid, dopamine, and uric acid. Electrochim. Acta 2013, 114, 341–346. [Google Scholar] [CrossRef]
- Chen, Z.; Zu, Y. Selective detection of uric acid in the presence of ascorbic acid based on electrochemiluminescence quenching. J. Electroanal. Chem. 2008, 612, 151–155. [Google Scholar] [CrossRef]
- Pang, S. A ratiometric fluorescent probe for detection of uric acid based on the gold nanoclusters-quantum dots nanohybrid. Spectrochim. Acta Part A Mol. Biomol. Spectrosc. 2019, 222, 117233. [Google Scholar] [CrossRef]
- Desmoni, E.; Brunetti, B. About Estimating the Limit of Detection by the Signal to Noise Approach. Pharm. Anal. Acta 2015, 6, 1000355. [Google Scholar] [CrossRef]
- Araghi, M.; Mirkhani, V.; Moghadam, M.; Tangestaninejad, S.; Mohammdpoor-Baltork, I. Synthesis and characterization of a new porphyrin–polyoxometalate hybrid material and investigation of its catalytic activity. Dalton Trans. 2012, 41, 3087–3094. [Google Scholar] [CrossRef] [Green Version]
- Pham, N.-D.; Duong, M.-M.; Le, M.-V.; Hoang, H.A.; Pham, L.-K.-O. Preparation and characterization of antifungal colloidal copper nanoparticles and their antifungal activity against Fusariumoxysporum and Phytophthoracapsici. ComptesRendusChim 2019, 22, 786–793. [Google Scholar] [CrossRef]
- Aguilar-Ortiz, E.; Jalilian, A.R.; Avila-Rodriguez, M.A. Synthesis, characterization and evaluation of a Cu-labeled macrocyclic-porphyrin as a potential chelator for 64Cu-based radiopharmaceuticals. J. Radioanal. Nucl. Chem. 2019, 320, 79–86. [Google Scholar] [CrossRef]
- He, T.; Wang, W.; Shi, F.; Yang, X.; Li, X.; Wu, J.; Yin, Y.; Jin, M. Mastering the surface strain of platinum catalysts for efficient electrocatalysis. Nature 2021, 598, 76–81. [Google Scholar] [CrossRef]
- Bu, L.; Zhang, N.; Guo, S.; Zhang, X.; Li, J.; Yao, J.; Wu, T.; Lu, G.; Ma, J.-Y.; Su, D.; et al. Biaxially strained PtPb/Pt core/shell nanoplate boosts oxygen reduction catalysis. Science 2016, 354, 1410–1414. [Google Scholar] [CrossRef] [PubMed]
- Schilling, M.; Brimaud, S.; Behm, R.J. Electronic effects on the water adsorption behaviour and structure formation on pseudomorphic Pt films on Ru(0001). Surf. Sci. 2018, 676, 30–38. [Google Scholar] [CrossRef]
- Woźniak-Budych, M.J.; Langer, K.; Peplińska, B.; Przysiecka, Ł.; Jarek, M.; Jarzębski, M.; Jurga, S. Copper-gold nanoparticles: Fabrication, characteristic and application as drug carriers. Mater. Chem. Phys. 2016, 179, 242–253. [Google Scholar] [CrossRef]
- Tangeysh, B.; Tibbetts, K.M.; Odhner, J.H.; Wayland, B.B.; Levis, R.J. Triangular Gold Nanoplate Growth by Oriented Attachment of Au Seeds Generated by Strong Field Laser Reduction. Nano Lett. 2015, 15, 3377–3382. [Google Scholar] [CrossRef]
- Wang, J.; Guo, X.; He, Y.; Jiang, M.; Sun, R. The synthesis and tribological characteristics of triangular copper nanoplates as a grease additive. RSC Adv. 2017, 7, 40249–40254. [Google Scholar] [CrossRef] [Green Version]
- Botasini, S.; Dalchiele, E.A.; Benech, J.C.; Méndez, E. Stabilization of triangular and heart-shaped plane silver nanoparticles using 2-thiobarbituric acid. J. Nanopart. Res. 2011, 13, 2819–2828. [Google Scholar] [CrossRef]
- Wu, G.-W.; He, S.-B.; Peng, H.-P.; Deng, H.-H.; Liu, A.-L.; Lin, X.-H.; Xia, X.-H.; Chen, W. Citrate-Capped Platinum Nanoparticle as a Smart Probe for Ultrasensitive Mercury Sensing. Anal. Chem. 2014, 86, 10955–10960. [Google Scholar] [CrossRef]
- Ghosh, T.; Gerbig, L.; Lambov, M.; Dechant, M.; Lehmann, M. Liquid crystals from shape-persistent porphyrin stars with intrinsic free space. J. Mater. Chem. C 2020, 8, 5562–5571. [Google Scholar] [CrossRef]


Publisher’s Note: MDPI stays neutral with regard to jurisdictional claims in published maps and institutional affiliations. |
© 2021 by the authors. Licensee MDPI, Basel, Switzerland. This article is an open access article distributed under the terms and conditions of the Creative Commons Attribution (CC BY) license (https://creativecommons.org/licenses/by/4.0/).
Share and Cite
Epuran, C.; Fratilescu, I.; Anghel, D.; Birdeanu, M.; Orha, C.; Fagadar-Cosma, E. A Comparison of Uric Acid Optical Detection Using as Sensitive Materials an Amino-Substituted Porphyrin and Its Nanomaterials with CuNPs, PtNPs and Pt@CuNPs. Processes 2021, 9, 2072. https://doi.org/10.3390/pr9112072
Epuran C, Fratilescu I, Anghel D, Birdeanu M, Orha C, Fagadar-Cosma E. A Comparison of Uric Acid Optical Detection Using as Sensitive Materials an Amino-Substituted Porphyrin and Its Nanomaterials with CuNPs, PtNPs and Pt@CuNPs. Processes. 2021; 9(11):2072. https://doi.org/10.3390/pr9112072
Chicago/Turabian StyleEpuran, Camelia, Ion Fratilescu, Diana Anghel, Mihaela Birdeanu, Corina Orha, and Eugenia Fagadar-Cosma. 2021. "A Comparison of Uric Acid Optical Detection Using as Sensitive Materials an Amino-Substituted Porphyrin and Its Nanomaterials with CuNPs, PtNPs and Pt@CuNPs" Processes 9, no. 11: 2072. https://doi.org/10.3390/pr9112072
APA StyleEpuran, C., Fratilescu, I., Anghel, D., Birdeanu, M., Orha, C., & Fagadar-Cosma, E. (2021). A Comparison of Uric Acid Optical Detection Using as Sensitive Materials an Amino-Substituted Porphyrin and Its Nanomaterials with CuNPs, PtNPs and Pt@CuNPs. Processes, 9(11), 2072. https://doi.org/10.3390/pr9112072