1. Introduction
A WWTP is a complex plant typically used for the removal of organic matter, nitrogen, and phosphorus from the polluted water cleared from domestic, industrial, and agricultural activities. The treatment processes in a WWTP are commonly organized into three stages: primary (or mechanical) treatment, secondary (or biological) treatment, and tertiary (chemical) treatment. This work will address issues related to the modelling and control of biotechnological processes (bioprocesses) within WWTPs, i.e., from the secondary treatment stage. These topics have been important research subjects in the last decades [
1,
2].
The control structure of a WWTP is usually organized as a distributed control system/supervisory control and data acquisition (DCS/SCADA). This architecture is a hierarchized and distributed control system, with the differences between several implementations residing in the number of hierarchical levels, the software and hardware equipment, and the control algorithms. However, a typical DCS has four to five hierarchical levels [
3,
4]. For example, the DCS–SCADA system from WWTP Făcăi, Romania (which is a big station of the Water Company Oltenia WCO, designed for the Craiova city, 300,000 inhabitants) has four levels—
Figure 1 [
5].
This work is focused on the development of an emulator dedicated to a specific process within the biological treatment stage of a WWTP—the activated sludge process. The bioprocess emulators are useful to understand the operation of real plants [
6,
7]. In bioengineering, specifically in WWTPs, further reasons for the use of simulators are the large data sets and the biological experimental risks. Among the first software tools developed for bioprocess modelling, we can mention CAMBIO [
7,
8] and DESASS [
9], designed for WWTPs (more specifically, for the Biological nutrient removal model no. 1). Another known simulator is SIMBA (ifak e.V., Magdeburg, Germany). The activated sludge process description in SIMBA is based on the so-called ASMs (activated sludge models), with software tools that use the models ASM1, ASM2d [
10], and ASM3. As Matlab/Simulink is a software environment very useful for modelling, but also for control design, there are several bioprocess simulators developed in this environment [
11,
12]. However, as the efficient operation of a WWTP needs useful online information from the processes and, at the same time, useful real-time control decisions, it is quite important to design and to implement a simulator able to deal with these specificities, allowing a good connectivity with the process and with the SCADA software and devices. Thus, the LabWindows/CVI environment from National Instruments (Austin, TX, USA) [
13] is an appropriate choice.
The mathematical models of bioprocesses have a certain degree of generalization, especially those models derived from the mass balance equations of the biochemical reactions. Thus, these models can describe a wide range of biotechnological processes [
14], such as fermentation process in the food industry (wine, beer, baker’s yeast, and so on), biological processes in the pharmaceutical industry, bioprocesses in wastewater treatment plants, and so on. Moreover, even the control techniques and strategies may differ for various bioprocesses, and there is a common framework specific for control solutions [
14]. Regarding the design and implementation of simulators for food bioprocesses, one of the first was CAMBIO, a software package devoted to the process of kinetic modelling [
8], with application to yeast fermentation. Further approaches used specific software environments (especially Matlab/Simulink, The MathWorks, Inc., Natick, MA, USA) in order to design bioprocess simulators. For example, in [
7], an interactive user-friendly software system for the identification of bioprocesses models is proposed. It is based on optimization programmes built in the graphical user interface development environment (GUIDE) of Matlab, and the kinetics identification of an ethanol production process is addressed. In [
15], the design of integrated biopharmaceutical processes using process simulators, discrete event simulators, or finite capacity scheduling tools is approached. More precisely, the modelling of a single batch bioprocess for the production of therapeutic monoclonal antibody (MAb) is addressed. Another simulator dedicated to the parameter estimation of MAbs, based on the Matlab environment, is presented in [
16].
As in the case of WWTP simulators, most of these simulators dedicated to several bioprocesses from food and pharmaceutical industry lack connectivity with the real processes, with respect to data acquisition and control implementation.
In most WWTPs, the activated sludge process is a key component of the biological treatment stage. Several works indicated that there are numerous hurdles in the ASP control design and implementation, such as kinetics nonlinearity and uncertainty, unavailability of online data, and noisy measurements [
17,
18,
19,
20]. To handle these problems, various control techniques were designed: adaptive and robust-adaptive approaches [
19,
21], sliding mode and neural networks-based control [
22], event-based control [
23], optimal and predictive control [
24], and so on. The present work will use a novel control strategy for the ASP, proposed in [
25]. More precisely, an adaptive multivariable decoupled control scheme tailored for the ASP from the WWTP Făcăi is considered. The design of this control strategy was based on several practical and realistic considerations, such as the unavailability of state variables, the kinetics uncertainty, and the lack of knowledge regarding the influent concentration.
To design control algorithms in WWTPs, it is necessary to obtain useful information about the processes, using the available sensors as well as software tools. These tools are related to several levels of the DCS, involving data acquisition solutions (level 0), primary control loops (level 1), as well as estimation (software sensors) and advanced control algorithms (level 2)—
Figure 1. The need for such software tools and emulators is obvious as the implementation of advanced control techniques in WWTPs is quite poor [
26,
27]. In many cases, only empirical rules and primary controllers (PID, on/off) are used. The use of advanced control would lead to an improvement in efficiency and performance.
In this paper, which is an extended work based on [
5,
25], the design and implementation of a simulator, as a real-time application, for the ASP residing in the WWTP Făcăi, Romania is approached. The proposed emulator is a software tool that can be later integrated into a more complex SCADA. Firstly, a reduced-order model of the ASP (initially simulated in the Matlab/Simulink environment) is implemented. This is related to level 0 of the DCS and contains the nonlinear dynamical model of the ASP adapted to the WWTP Făcăi. Secondly, the adaptive multivariable control algorithms developed in [
25] are integrated into the simulator. These are related especially to level 2 of the DCS. The emulator is developed in the LabWindows/CVI programming environment (National Instruments) and can work in parallel with the evolution of the process, having as inputs the signals measured directly at the process level. This environment provides versatile drivers and software packages that can facilitate the interaction with software tools developed within some earlier SCADA systems. The structure and the graphical interface of the emulator, some functionalities, experiments, and evolution of main variables are presented. The main advantages of the proposed emulator are as follows:
It is a real-time software application, as the processing is implemented using the interrupts generated by a timer, under a strict time interval—the sampling period.
It can be integrated into existing SCADA systems and can ensure the operation in parallel with the process, having the same input signals. This allows the calibration of the parameters of the mathematical model and the validation of the observers.
Useful comparisons of the advanced control structure performance can be achieved, in relation to the existing classic control system at a WWTP.
The structure of the paper is as follows.
Section 2 presents the typical organization of a WWTP and the description of the WWTP Făcăi. Moreover, the activated sludge process and its dynamical model are described.
Section 3 approaches the adaptive multivariable decoupled control of the ASP. In
Section 4, the graphical interface of the emulator, its functionalities, and some experiments are widely presented. Finally,
Section 5 concludes the paper.
2. Structure of the WWTP Făcăi and Activated Sludge Process Model
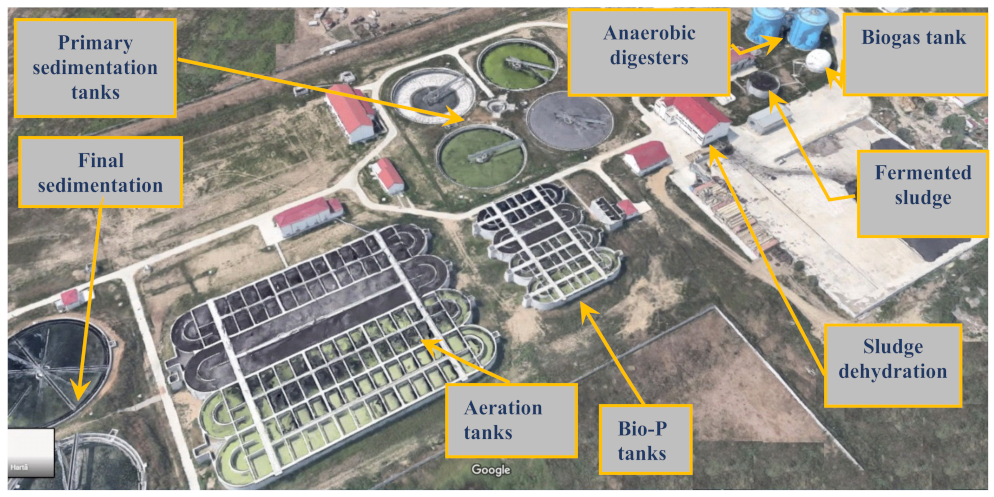
The treatment plant Făcăi (WCO) was designed for the treatment of polluted water coming from the city of Craiova (about 300,000 inhabitants), Romania. An aerial view is presented in
Figure 2. This station consists of three stages: the primary or mechanical stage, secondary/biological stage, and tertiary/chemical stage. The WWTP has four independent operating lines for the primary and secondary stages. The total treatment capacity is 5 m
3/s in the primary stage, and 2.5 m
3/s can be processed in the secondary stage. The general block scheme of the WWTP Făcăi is provided in [
5]. The DCS/SCADA structure of the WWTP is presented in
Figure 1. The plant is equipped with various data acquisition and control devices specific for WWTPs, produced by Siemens, National Instruments, Rockwell, Schneider, and Endress + Hauser, among others. The main process from the biological stage is the ASP, an aerobic process that typically is operated in two sequenced units: a bioreactor (aeration tank) and a sedimentation tank (settler). The biological degradation of the pollutants is achieved in the aeration tank, while in the settler, the liquid is clarified, and the sludge is separated. A part of the settled biomass is recycled into the reactor, while the excess is removed [
19]. In industrial practice, the ASP uses aeration reactors with anoxic and aerobic tanks. The number of tanks is determined by the plant size.
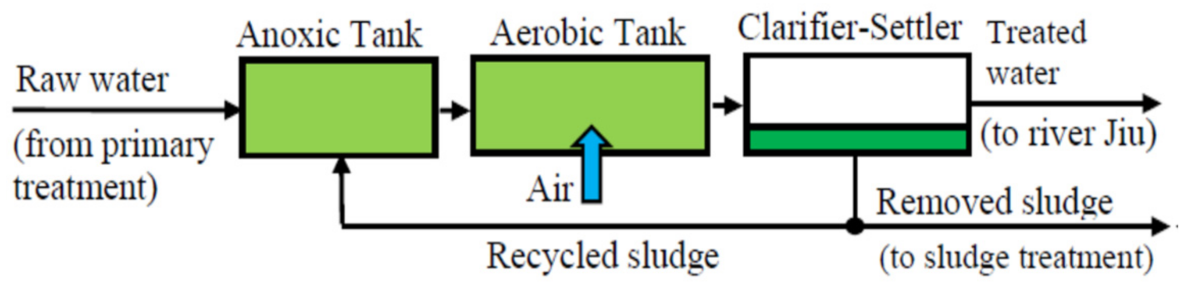
In this work, the ASP model and parameters correspond to WWTP Făcăi, and the ASP block scheme is presented in
Figure 3 [
25]. The volume of every anaerobic/anoxic tank (four tanks for four operating lines) is 3375 m
3. These tanks are connected with aerobic tanks with a volume of 15,000 m
3 each.
The dissolved oxygen (DO) concentration in the aeration tanks, which is a key parameter, should be over 1.5 mg/L; if not, the bacteria growth decreases or, even worse, is stopped. When the polluted water is characterized by a less organic load, the DO concentration may increase to 6–8 mg/L. The flow of recycled sludge from the clarifier-settler is the major parameter that allows the adjustment of the activated sludge concentration. This succinct description is quite generic; in fact, the ASP is a complex, nonlinear, and uncertain process [
20,
23].
To be able to design and implement the control algorithm, it is necessary to obtain useful ASP mathematical models [
17,
28,
29]. The most known ASP models are the ASMs (activated sludge models): ASM1, ASM2, ASM2d, and ASM3 [
10]. Unfortunately, these are complicated, being unusable for control purposes. Therefore, reduced-order models were developed and used for control design. In this work, we will use a simplified model, as in [
25], initially proposed by Nejjari et al. in [
19], but adapted for the ASP from the WWTP Făcăi:
where
CX,
CS,
CDO, and
CXr are the concentrations of the activated sludge (the biomass), the substrate (the pollutant),
DO, and the recycled biomass, respectively.
In Equation (1) d is the dilution rate (, with Fin being the input pollutant flow rate and V the bioreactor volume), KO is a constant, Y is a yield factor, is the oxygen transfer rate, FO is the aeration rate, is the saturation DO concentration, and is the ratio of removed sludge. COin and CSin are the influent oxygen and substrate concentrations, respectively. The kinetics is expressed by , the specific growth rate, and r is the rate of recycled sludge.
One of the most important kinetic variables is the growth rate
, expressed in the case of our particular ASP by a dual Monod model, as follows:
where
is the maximum specific growth rate, while
KS and
KDO are constants that express the saturation phenomenon.
The reduced-order dynamical model, Equations (1) and (2), was simulated in the Matlab environment in some previous works [
5,
25]. In the present paper, the dynamical model is integrated inside a simulator developed in LabWindows/CVI, whose structure will be presented in
Section 4.
Owing to the complexity of the WWTP, the proposed simulator addresses only a part of the process, more precisely the ASP structure presented in
Figure 3. It should be mentioned that the processes that take place in the WWTP contain several other technological components, in all the stages of the station: mechanical, biological, and chemical, as can be seen, for example, in
Figure 2. Moreover, the existing SCADA of the plant, succinctly described in
Figure 1, covers in the present moment only some of these processes.
4. Emulator Design and Functionalities
4.1. Main Graphical Interface of the Emulator
The proposed simulator will be useful as a software tool that can be later integrated into a more complex SCADA system, and thus will allow the implementation of advanced control algorithms and the improvement in the WWTP operation. Moreover, the graphical interfaces of the simulator are useful as virtual instrumentation and synoptic schemes of the process. In the first stage, the simulator can generate control actions using the real input data from the process, the plant model, and the proposed advanced control scheme. These commands are not applied to the WWTP, but are used in several comparisons with the actual classical control solution. Further research will be focused on the hard real-time implementation of the advanced control solutions.
The software emulator is developed in the LabWindows/CVI programming environment (National Instruments, Austin, TX, USA), as this environment offers low-level access to hardware or software systems that have minimal open-architecture facilities. Moreover, it provides versatile drivers and software libraries that can facilitate the interaction with software tools developed within the existing SCADA from the WWTP Făcăi. This is a development environment for real-time applications based on the ANSI C standard, providing complex libraries for control applications, and a Run-Time Engine software module with interrupt handler facilities. Moreover, through the “Open architecture” feature, it allows the integration in the same project of various software modules, achieved in other development environments, which will be link-edited together with the LabWindows/CVI source code files. Thus, the pre-compiled object code files can be included in the project (these have been developed in the assembly language). Moreover, various * .lib or * .dll library files can be added to the LabWindows project. Further, new *.lib and * .dll files that contain various software functions can be developed and can be used in other development environments.
It should be mentioned that the LabWindows/CVI—NI programming environment is based on the ANSI C standard but contains libraries of functions oriented on complex processing as well as real time through the Run-Time Engine (RTE) module that interfaces the application developed with the Windows operating system, more precisely with the kernel of the operating system. At the same time, because a real-time system is a dedicated hardware-software unit, the NI hardware systems can work using, in addition to RTE, a dedicated operating system kernel that uses real-time principles.
The LabWindows/CVI development environment can be considered of the open architecture type, in the sense that the developed application can integrate modules written in other languages (including .obj modules, written in assembly language) or can be integrated into other development environments.
Figure 5 shows the main graphical interface of the real-time simulator, which has two instances related to the control system proposed for the biological stage: open-loop and closed-loop. As can be seen, this emulator is based on the multivariable adaptive control system succinctly described in the previous section. The mathematical model used for the ASP is the reduced-order one, presented in
Section 2.
The main operating modes of the emulator are as follows:
Simulator of the open-loop system, which includes the model of the ASP and the estimator of the influent substrate concentration. This is useful in the analysis, testing, and validation of the mathematical model of the process and of the estimator.
Real-time emulator of the closed-loop system, based on the proposed multivariable adaptive control structure of the ASP.
Thus, from the main graphical interface, two options can be selected: open loop or closed loop, by means of a selection switch. Switching between the two operating modes can be done interactively during operation, and thus can handle the possible shocks from the evolution of the process, as they are equivalent to the known problems of automatic/manual switching.
By pressing the Start Application button, the timer of the real-time software tool is actually started, which will generate the interrupts related to the sampling period used in the processing of the mathematical model. Through this mechanism, the simulator is implemented in real time, because it can have a “continuous” running in time, with the very strict implementation of the sampling period. This running eliminates the problems of standard simulations over a finite period of time, where the problem of initial conditions is very important. Thus, after starting the application, it is expected to reach a stationary operating mode, after which various input signals (references, disturbances) can be modified online to view their effects.
The software function (Program Block), which is a C function, is attached to the timer interrupt and encapsulates all the tasks necessary to be performed with a certain sampling period:
- -
Tasks dedicated to the processing of the mathematical process model;
- -
Tasks dedicated to the implementation of the estimators (three estimators 1, 2, and 3);
- -
Tasks for the implementation of open-loop/closed-loop control architectures;
- -
Tasks for displaying the evolution of various signals at the level of the approached architecture.
The proposed simulator acts as a soft real-time system, and in the next stage, it will be implemented on an NI hardware system in order to be a hard real-time system [
30,
31]. The bioprocess taken into consideration is a slow process; therefore, the real-time constraints should not be critical; however, slow processes are often difficult to handle from the control engineering point of view. In this context, the time instants in which a modification of a certain stationary regime or the appearance of a disturbance are detected are very important. The process response will be influenced by such disturbances. Thus, it is important to detect in real time the evolution of causes and effects.
4.2. Simulator of the Open-Loop System
After starting the real time application and selecting the open-loop operating mode, it is possible to navigate in the next two related screens—
Figure 6 and
Figure 7, where real-time signals are presented as graphs resulting from the simulator. The selection switch Simulation/Measured can be used to select the simulation mode or the mode with real input signals, measured from the process:
- -
“Simulation” is a simulated working mode, where all the necessary parameters are taken from the virtual knobs of the graphical interface, placed at the top and side of the screen.
- -
“Measured” is a working regime with real (measured) data/parameters taken from the process, as far as this is technically possible, or there are sensors available for measurements.
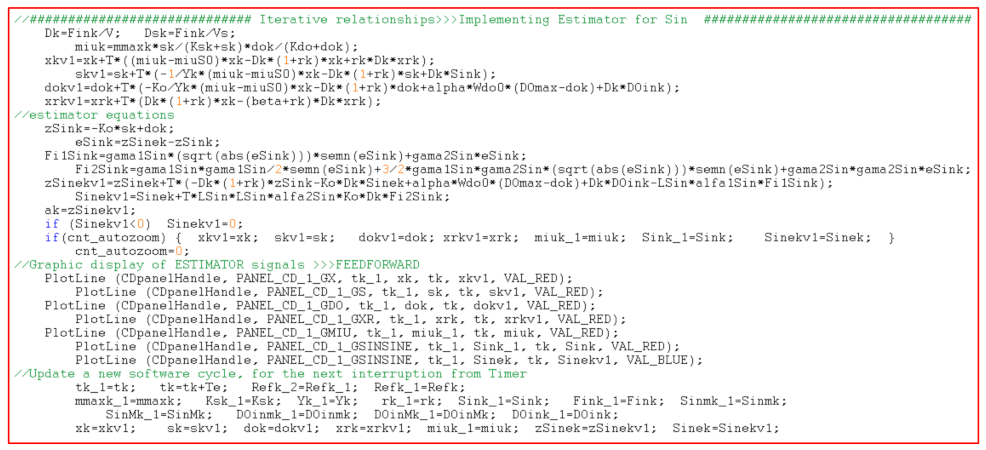
Figure 6 presents the first screen with the graphical interface for the implementation of the software tool for the real-time simulation of the evolution of the ASP mathematical model. The architecture is of the feedforward type, and estimates some kinetic parameters of the unknown process. More precisely, the concentration of the influent substrate is estimated using a sliding mode observer, because of the fact that this input variable can be considered as a part of the ASP model.
The simulator provides, via the specifical graphical window, the evolution of several biological variables of the activated sludge process, such as the concentrations of influent DO and of the influent substrate, as well as the maximum specific growth rate, the input flow of polluted water, the recycled flow, and other kinetic parameters of the process (
Figure 6). It should be mentioned that the influent DO and substrate concentrations evolve into some pre-specified bounds. Several aspects about the time evolution and the profiles of biological variables are widely discussed in [
25].
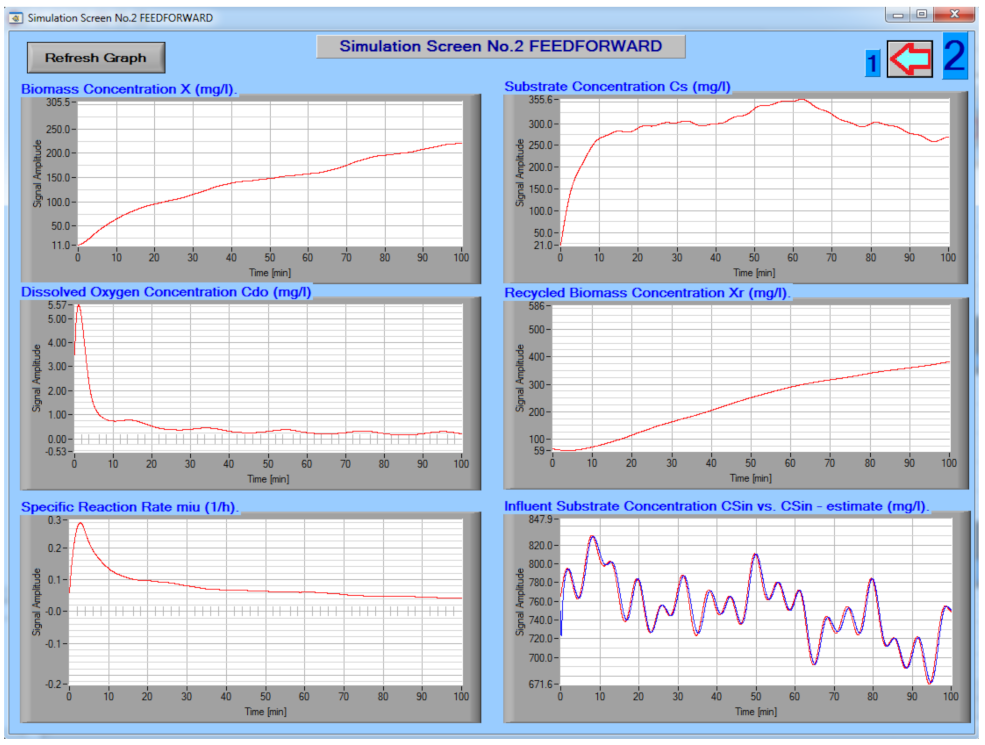
Figure 7 depicts the second screen of the graphical interface corresponding to the open-loop operating mode of the simulator.
Here, the evolution of other key variables of the ASP can be plotted, such as DO, substrate, biomass and recycled biomass concentrations, specific growth rate, and the concentration of the influent substrate versus its estimation.
The developed application allows the calibration/testing/validation of the mathematical model with the real process parameters and, at the same time, the operation in parallel with the process, making it possible to assign the same input data for the mathematical model as for the real process. Therefore, the graphical interface related to the open-loop option allows the selection of the simulator working mode in SIMULATED or REAL mode, by generating input signals/step, ramp, sinusoidal reference from the graphical interface, and input signals obtained by measuring real signals at the WWTP, respectively. The graph objects in these two screens are populated with the signal samples in parallel and simultaneously in both related windows, even if the window in which it is located is not visible at a given time.
As a general rule of implementing a real-time application, this should work by using interrupts, so that the event is treated when it occurs and not later. For example, for the timer object, an important field is available in the corresponding properties box. In this field, the “callback” software function is attached. Here will be inserted the name of the developed function “Sampling_Action ()”, which will contain the software block that will be called at each sampling period, when the interrupt from the timer appears. The CVICALBACK functions, which deal with interrupts, can be attached to any graphic object, as well as to other tasks, even virtual ones, such as communication on interrupts, alarms, priorities, and so on. Three CVICALLBACK type functions constitute the core of the developed real-time application. These three functions are as follows:
Sampling_Action (), attached to the timer object, which implements the sampling period and will contain all the processing performed by our application.
[Timer] # [EVENT_TIMER_TICK—event];
Start_Application (), attached to a button type graphic object, more precisely to the button labelled “Start Application” in the graphical interface. After the run of the software application, the first window will appear on the screen. This will wait for the arrival of events of all types on the screen, by continuously running the Run-Time Engine module. The presented function detects the starting event of the application and will make the necessary settings for the operation of the program, after which the application timer will actually start.
[APPLICATION START button] # [EVENT_COMMIT-event];
QuitCallback (), attached to a button graphic object, i.e., the QUIT button. This will stop the application, free up memory, and give control of the operating system.
[Quit button] # [EVENT_COMMIT-event].
The WinMain () function includes the five instructions as a kind of standard, because any LabWindows/CVI application must minimally load a window into memory, display it, launch Run-Time Engine, and then will wait for events in an endless mode. Other code modules can be added to this function (in C Language), such as installing multiple windows, installing priority for interrups, and other various tasks.
To illustrate how the various estimation and control algorithms are implemented,
Figure 8 presents the source code related to the implementation of the SMO used for the estimation of influent substrate concentrations. The software tool based on LabWindows/CVI implements the sampling period by means of an interrupt generated by the timer available at the level of the computer system, which gives it the real-time feature and not just a simulation over a predefined time interval.
4.3. Closed-Loop System Emulator
The implementation of the closed-loop simulator application is based on the same environment and ideas. Here, the multivariable adaptive control structure described in
Section 3 is implemented. Some of the main components are as follows:
The first screen of the graphical interface for the closed-loop operating mode is depicted in
Figure 9;
The second screen of the graphical interface is given in
Figure 10;
Figure 11 presents a sample of the source code (LabWindows/CVI) in which the closed-loop nonlinear adaptive control inputs are implemented.
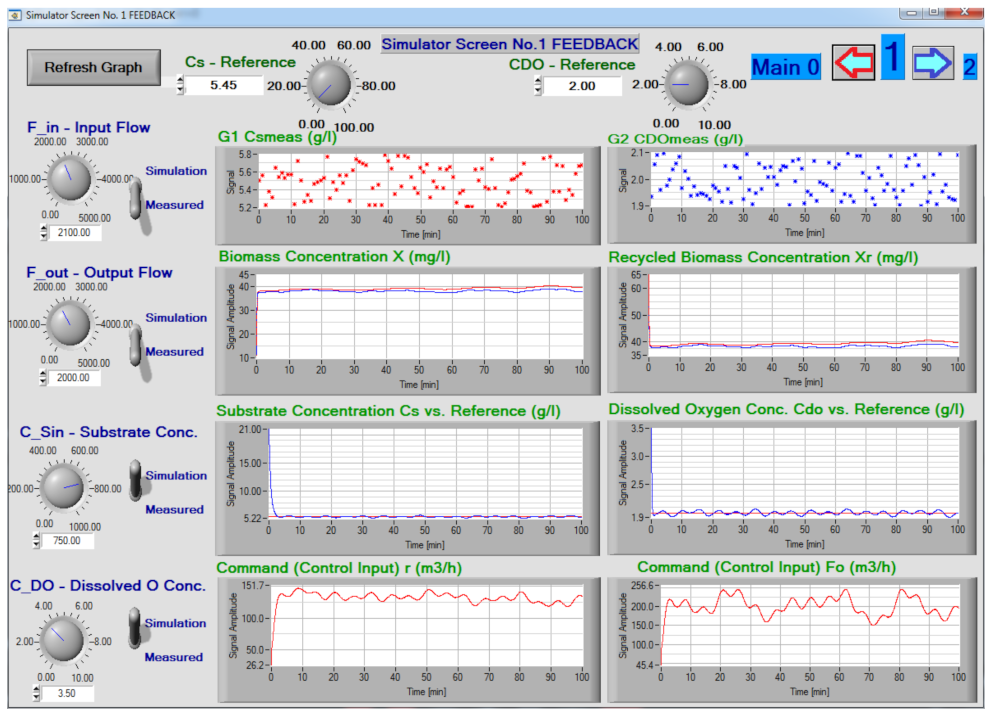
The graphical interface from
Figure 9 presents at the top virtual potentiometers through which various types of reference (setpoint) signals will be generated (
CS—substrate concentration,
CDO—dissolved oxygen concentration) for the implemented control structure. The potentiometers on the left side of the graphical interface generate various signal variations for the process parameters, when working in simulation mode, even if the simulator is running in real time. In this way, it is possible to test various scenarios for the validation of the proposed architecture. To the extent that signals measured directly from the process are available, these signals will be replaced with actual samples from the process, leading to parallel operation of the emulator with the actual process. The selection between the two working modes is made by the switch Simulation/Measured. The whole operation of mode selection, modification of simulated or measured parameters, and adjustment of references is performed on interrupts attached to the corresponding graphic objects, so that the processing is minimally influenced by additional processing. Objects such as buttons with arrow icons indicate how to navigate in the application windows. It can be specified that the graphics display is built continuously, even if the window with the related graphics is not displayed at a certain time. Pressing the refresh graph button will delete the graphics and start a new representation starting from that sampling moment. At the same time, the graphics limits for the time axis can be set according to the use of the emulator, ranging from an interval in seconds, minutes, hours, and even days.
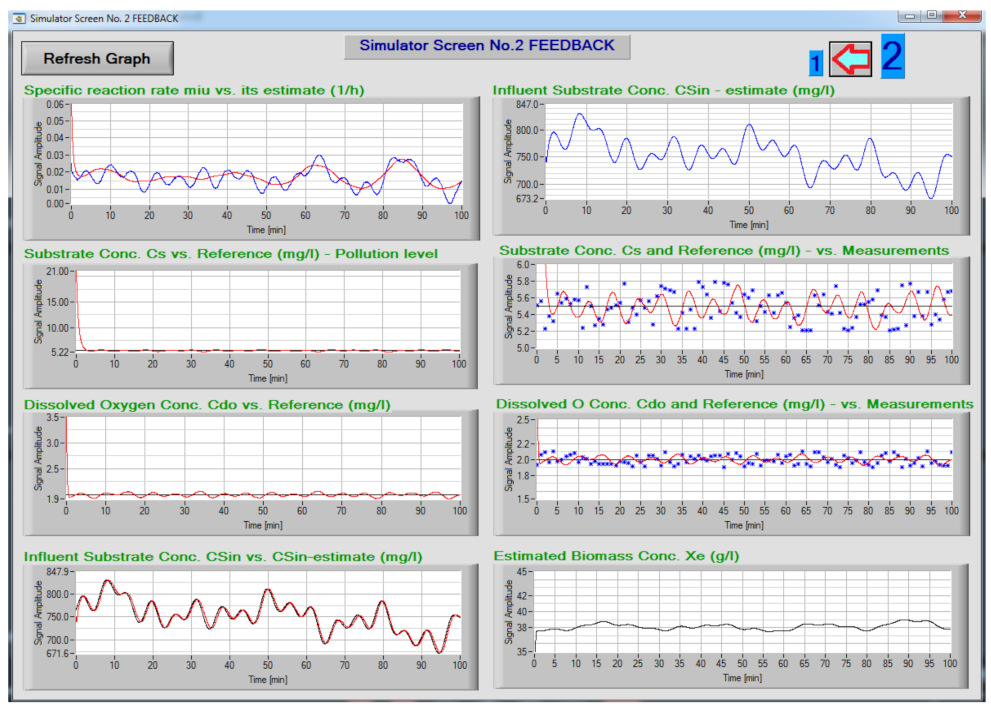
The second screen related to the feedback mode is presented in
Figure 10. Here, the time profiles of several biological variables can be visualised (and stored), such as the specific reaction rate (versus its estimate), the substrate, and DO concentrations in comparisons with their references and with some measurements, estimated biomass and influent substrate concentrations, respectively, among others.
To design a proper and practical control system, it is important to have an accurate model of the real ASP. This model is fully defined when its parameters are obtained via analytical modelling, measurements, or identification procedures. Moreover, some online estimation algorithm can be used to reconstruct the kinetics and the state variables [
14,
21].
In the case of the ASP from the WWTP Făcăi, the available measurements are the influent flow rate and two state variables of the model (1): the pollutant concentration CS and the DO concentration CDO, both measured inside the aerobic tank. The polluted water is injected into the reactor with the flow rate Fin (m3/h), with the influent pollutant concentration being CSin (mg/L). The air is blown in the reactor with the flow rate FO (m3/h), with the concentration of the contained oxygen being CDOin (mg/L).
In
Figure 10, some of the obtained results, which allow a partial validation of the simplified model, are presented. Thus, the simulated evolution of the most important variables of the bioprocess, i.e., the outputs
CS and
CDO, is shown against the measurements obtained from the process. The estimates of the biomass concentration are obtained using the state observer. Several other profiles of the process variables can also be obtained using the simulator, as can be seen in
Figure 10. The parameters of the bioprocess (yield and kinetics) used in the simulator and calibrated from the available measurements are as follows:
0.56 h
−1,
= 100 mg/L,
2 mg/L,
Y = 0.65,
,
= 0.018,
= 0.2,
2040 m
3/h,
760 mg/L,
COin = 9 mg/L,
= 8 mg/L, and
15,000 m
3.
However, it is necessary to perform additional tests and to improve the instrumentation (sensors) in order to obtain more satisfactory results regarding the full calibration of the model.
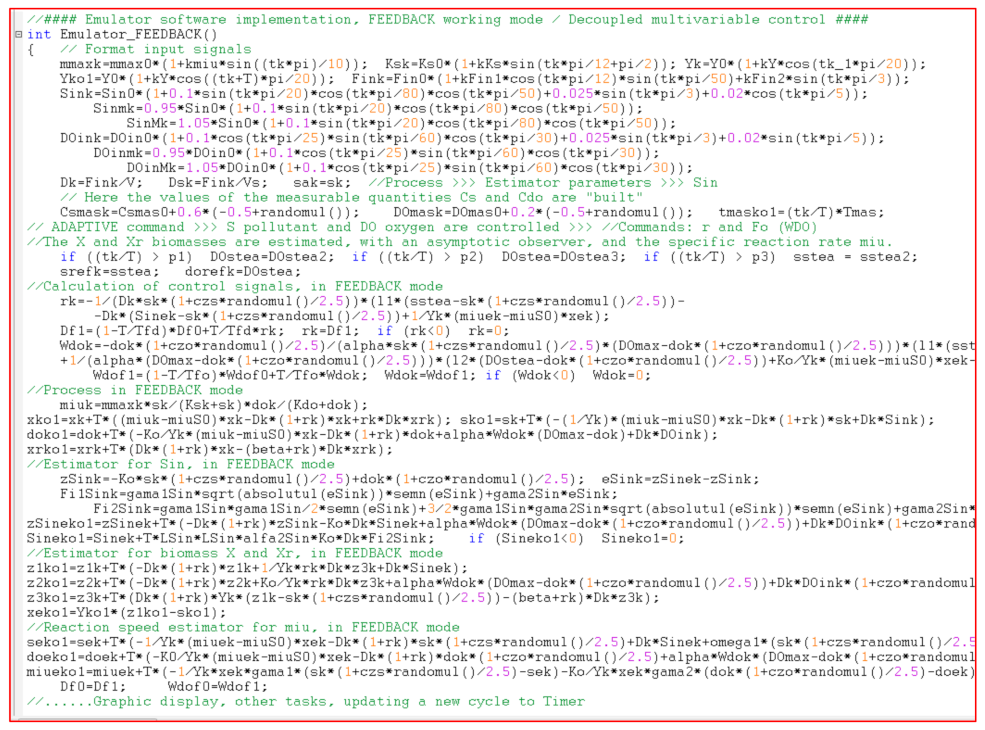
Figure 11 presents the source code used for the implementation of discretized equations, in the form of iterative relations, which were designed for the multivariable adaptive control structure of the ASP within the WWTP. These iterative relationships were included in the type C function
Emulator_2_Closed_Loop () and will be processed at each interrupt generated by the timer, according to the set sampling period.
The advantage of this real-time implementation is that it can be connected so as to work in parallel with the process, allowing important parametric corrections. At the same time, real-time signal samples, such as input flow, output flow, dissolved oxygen concentration, or other measured parameters, can become inputs in the application, which allows not only testing the correctness of the model considered for the process, but also the validation of the estimation and control solutions designed for the WWTP Făcăi.
The implementation of the emulator as a real-time application, using the development environment LabWindows/CVI, based on the ANSI C standard, allows the integration on the most diverse hardware equipment available at SCADA level, but also as embedded systems. The migration of the application to an embedded system can be done by directly taking over the source code of the algorithms and creating new software projects or by creating files in compiled form that can be integrated into new software projects and compiled together.
5. Conclusions
This work addressed the design and implementation of an emulator for a controlled bioprocess from a complex WWTP. This simulator was achieved as a software tool that can be integrated into a more complex DCS-SCADA system of the WWTP Făcăi, Romania. This software tool was tailored on the WWTP Făcăi but can be used with some adjustments to other WWTPs.
The activated sludge process dynamical model and a multivariable adaptive control system were integrated in this simulator. The software tool can work in parallel with the evolution of the process and can have as input signals measured directly at the process level. The software emulator was developed in the Labwindows/CVI programming environment. Two main operating modes of the emulator were implemented: (1) simulator of the open-loop system, which includes the model of the ASP and the estimator of the influent substrate concentration; (2) real-time emulator of the closed-loop system, based on the proposed multivariable adaptive control structure of the ASP.
The emulator provides, via specifical graphical windows, the evolution of several biological variables of the ASP, such as concentrations of various components, specific rates, input and output flows, and other kinetic parameters of the process. Some of these evolutions can be compared with real data from the process, and several data provided by the sensors can be used for monitoring or control purposes. The reference profiles can be modified depending on the technological requirements. Moreover, the values of process and control parameters could be adjusted within the operation modes of the simulator.
This work can be useful for researchers and practicing engineers, as well as for postgraduate and PhD students interested in bioprocess modelling and control related to wastewater treatment plants.
The obtained results are promising and will be used in future research for the implementation of advanced control systems in the DCS-SCADA of the WWTP.


 ,
, 