1. Introduction and Related Works
Combustion is currently the most common way to obtain energy from biomass. For this purpose, wood pulp is used, in particular as piece wood or in the form of wood chips [
1]. Especially wood chips prepared from waste wood generated during its extraction and processing represent an economically very interesting type of fuel.
As optimal biomass combustion, we mean perfect combustion with a minimum excess of the combustion air. If more combustion air is supplied into the combustion chamber than optimal, energy losses occur. In case less air is supplied than optimal, imperfect combustion occurs with some flammable substances escaping through the flue gases. These are mainly carbon monoxide (CO) and volatile hydrocarbons. Flammable substances in the flue gas cause losses in terms of energy use of the fuel and also pollute the air. However, the problem of achieving near-optimal biomass combustion is more complex, because it is necessary to divide the supplied air into primary and secondary air by optimum excess air ratio. Due to the non-constant properties of the fuel (especially changing moisture), there is also a necessity to control the amount of combustion air during wood chips supply into a furnace and during the combustion process [
2,
3]. Approaches to this control can be based on sensing, for example, the carbon monoxide emissions, the oxygen concentration in flue gases, and fuel characterization as a part of process control [
4,
5,
6].
A lot of authors have been dealing with quality improvement of biomass combustion in recent years. Some of them focused on the problem from the ecological point of view, especially reducing pollutant emissions, because as it is stated in [
7], uncontrolled or badly controlled biomass combustion can have a more serious impact on the environment than coal or oil combustion. A problem of decreasing NOx emission is solved, for example, in papers [
8,
9,
10,
11,
12]. In these studies, there is reviewed information regarding the nitrogen oxides emissions, and the main formation mechanisms and the state-of-the-art control techniques are discussed as well as the influence of fuel composition (especially fuel-bound nitrogen), heating appliance type, and operating conditions with the help of the gathered experimental emission factors data. Other topics on the monitoring, sensing, and decreasing CO are discussed, for example in [
13], where different methods to obtain models for the prediction of carbon monoxide emissions in a small-scale biomass combustion furnace for wooden pellets are presented. Ecological questions of the operation of small-scale biomass-fired boilers are also discussed in [
7]. A technical and economical technology comparison for small and medium-scale electricity production from biomass is presented in [
14], where is stated that for small-scale applications, biomass combustion is still the most attractive solution under the economical point of view. Similarly, it is stated also in [
15] that using locally produced biomass can lead to significant cost savings and support the local economy. Due to recent advances in combustion control and improved efficiency of the heating networks, current small biomass heating systems have lower emission profiles than in past that make them an attractive option to consider, as it was analyzed in [
15]. For example, a burnout control strategy for small-scale biomass furnaces based on the continuous estimation of the CO-O
2-characteristic was presented in [
16], where the Kalman filter is used to continuously estimate the correlation between the oxygen concentration and the resulting carbon monoxide emissions. The usability of the Learning Entropy approach for the adaptive novelty detection in the solid-fuel combustion process was described in [
17]. Modern control strategies for biomass combustion systems in residential heating are also presented in [
18]. This strategy simultaneously guarantees good combustion conditions and ensures that the water temperature is kept at the desired value using the controlled variables such as the feed temperature and residual oxygen content of the flue gas. The manipulated variables are suction fan frequency, primary air control valve, secondary air control valve, and boiler pump frequency.
An interesting experiment concerning the sensing characteristics and long-term stability of different kinds of CO/HC gas sensors during in situ operation in the flue gas from different types of low-power combustion systems (wood-log- and wood-chip-fueled) was described in [
19]. It was experimentally shown that the signals of CO/HC sensing elements yield important additional information about the wood combustion process. This was demonstrated by the adaptation of an advanced combustion airstream control algorithm on a wood log-fed fireplace and by the development of a combustion quality monitoring system for wood-chip-fed central heaters.
An important task to reach minimum carbon monoxide emissions in the flue gases by the control of biomass combustion is to find such an optimal interval from the measured dependence CO = f(
λ) so that carbon monoxide emissions would be minimal [
20]. Since the correlation between CO emissions and lambda value is not simple, two approximation tools using neural networks have been used and tested in our research to solve this task [
21]. Then, the problem of burning stabilization based on low-cost sensing of carbon monoxide emissions and oxygen concentration in the flue gas has been solved [
22]. To monitor the operational parameters of heat production in biomass combustion boilers, an application for the creation of analyses, reports, and statistical evaluations of monitored parameters was designed and implemented [
23]. However, the data obtained from the combustion process in some boilers were extremely noisy (influenced by various transfer errors, disturbances, and external interferences), so they had to be properly filtered. A special filter with a membership function for signal filtering of the oxygen concentration and carbon monoxide emissions sensing has been used to reduce signal interferences arising in biomass combustion [
24].
The aim of our research described in this article has been to design a cost-effective monitoring and control system based on information on the values of CO emissions and O
2 concentration in the flue gas usable not only in medium-scale but also in small-scale biomass-fired boilers. The sections of this article are structured in the following manner: following the introduction and related works in this section, the principles of complete and incomplete biomass combustion and its control are introduced in
Section 2.
Section 3 describes a cost-effective system for optimal biomass combustion control, and
Section 4 contains results and discussion. Finally,
Section 5 presents a summary of the article along with some ideas for future work.
2. Materials and Methods
2.1. Combustion Process and Its Products
The biomass combustion process, as well as the combustion of other fuels, is a chemical process by which substances contained in biomass react rapidly with oxygen. During this process, heat is released. Biomass combustion produces the same basic substances as the combustion of other organic fuels, especially CO
2 and H
2O. Combustion reactions, in which combustible elements merge with oxygen, are referred to as exothermic reactions according to chemical Equations (1) and (2):
However, these basic relationships do not accurately reflect the combustion conditions that exist in a real combustion chamber, in which combustion does not takes place only with pure oxygen but also under the presence of air, which contains oxygen and nitrogen, too. Depending on the conditions of the combustion process and the compounds contained in the biomass, other substances are produced, which are considered to be pollutants [
25,
26]. This process can be expressed by the chemical Equations (3)–(5). It is mainly carbon monoxide CO, which is a product of incomplete combustion:
If a sufficient combustion temperature and sufficient amount of combustion air exist, then CO is oxidized to CO
2:
Another product of biomass combustion is nitrogen oxides NOx, which is also considered to be a pollutant:
In the case of high combustion temperatures, mainly thermal NOx occurs, but such high temperatures usually do not appear in the biomass combustion process. At temperatures common for the combustion of biomass fuel, NOx is generated primarily from the nitrogen contained in the fuel. Sulfur is contained in a minimal amount in biomass, and therefore, SO2 emissions from biomass combustion are very low, which is one of the great advantages of biomass over fossil fuels.
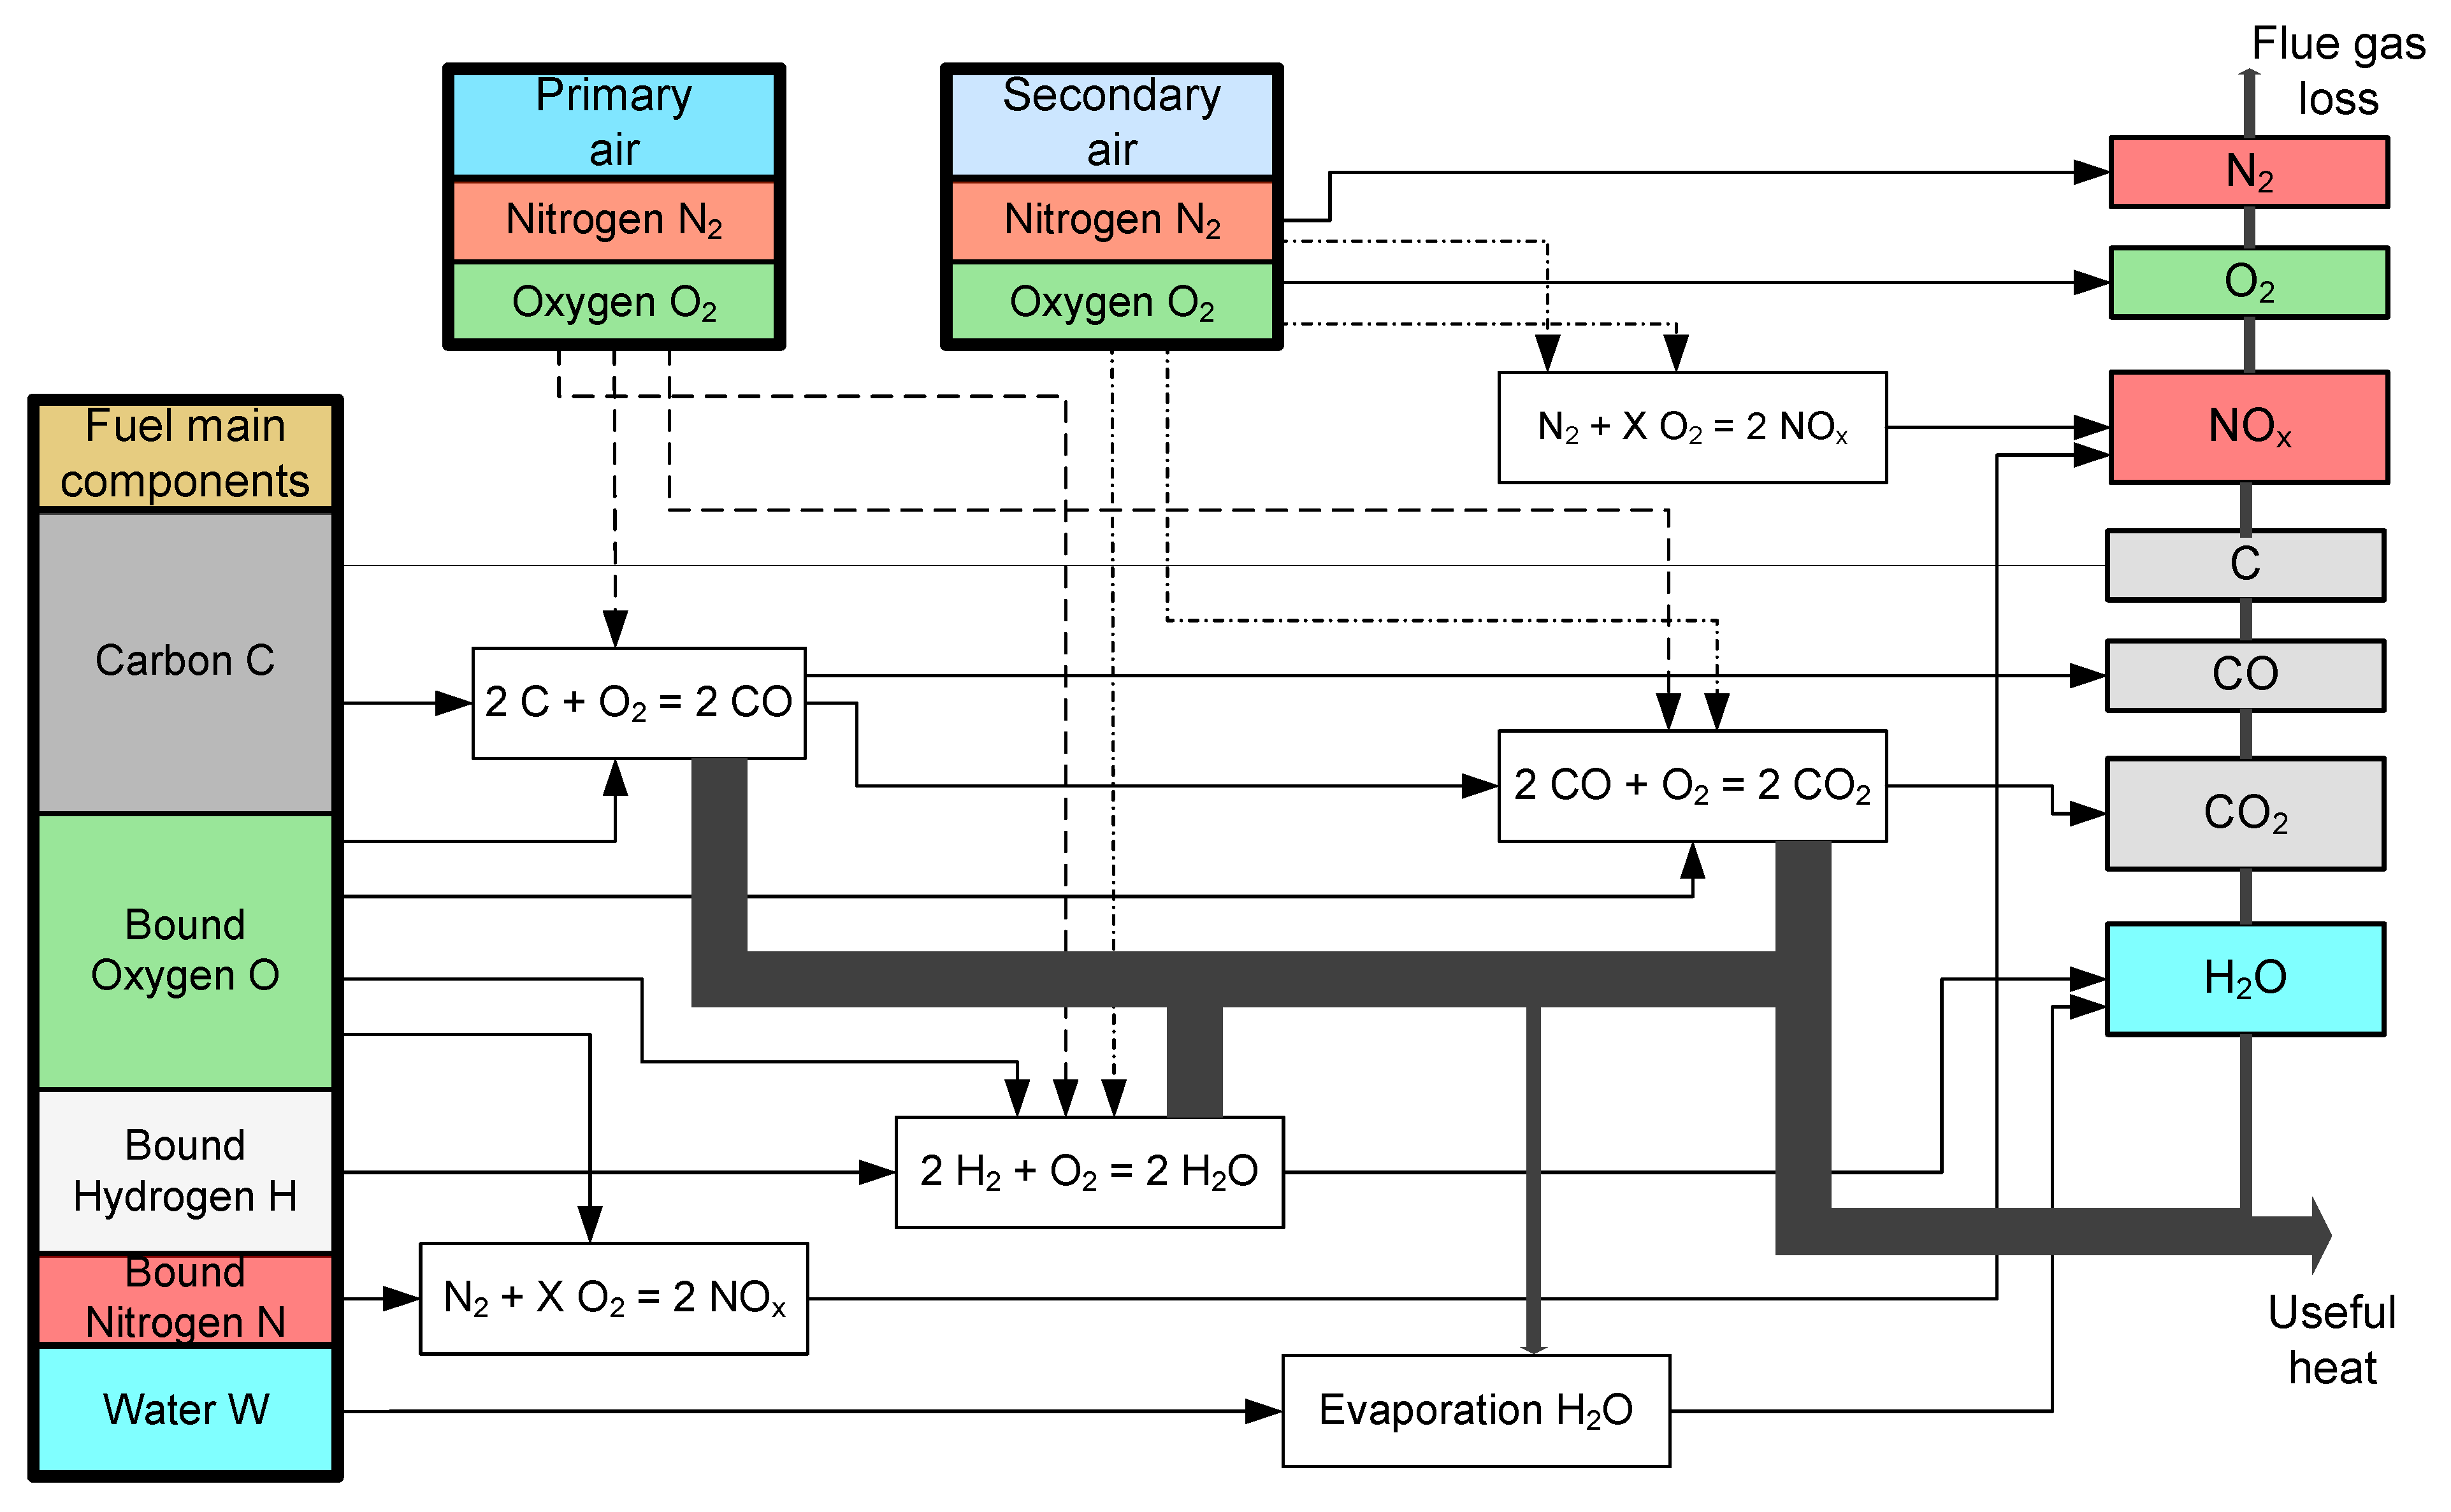
The composition of the fuel, the basic chemical reactions, the composition of the flue gases, and the influence of the primary and secondary air on the biomass combustion process are shown in
Figure 1 [
27,
28].
The useful heat, generated as a result of the above-described basic chemical Equations and schematically shown in
Figure 1, is transferred to the working medium. During this process, part of the energy is lost in the flue gas. The efficiency of heat production depends not only on the fuel quality (ash and water content, calorific value) but also on the power and operation of the heat exchanger, on the fuel–air mixture, on the flue gas temperature, and on the operating mode [
29,
30].
During the combustion process, heat losses occur from the combustion chamber, which can be divided as follows:
Flue gas losses, which depend on the flue gas temperature, the amount of air, the fuel composition, and the degree of fouling of the heat exchange surfaces of the boiler.
Losses due to chemical non-combustion with flammable (volatile component) in the flue gas, whereas imperfect combustion causes the production of carbon monoxide and hydrocarbons in the flue gas.
Losses by mechanical non-combustion with combustibles in solid residues such as carbon in ash and fly ash.
Heat losses through the ash layer and fly ash, which are related to the removal of solid residues with heat content from the boiler.
Losses by heat conduction and convention to the environment, which depend mainly on the quality of insulation, the thickness of the walls of the combustion chamber, and their surface treatment.
These heat losses, appearing at incomplete combustion, lead to a decreasing of economic efficiency, increasing of the environmental negative impact, and decreasing of the safety of heat production. For this reason, it has been necessary to monitor the parameters, which have a negative effect on the operation and efficiency of such equipment, as well as the environment. In particular, the monitoring includes fuel composition, flue gases composition (CO
2, CO, O
2), the amount of air supplied into the combustion chamber, the boiler incrustations, combustion air, and flue gas temperatures [
30].
2.2. Mathematical Description of Complete and Incomplete Combustion
From the mentioned above, it follows that it is necessary to monitor the combustion process and thus distinguish whether the combustion is complete or incomplete in order to achieve maximum economic efficiency.
In order to increase the efficiency of combustion and to achieve the minimum production of pollutants, it is desirable that the combustion process be close to complete combustion. The mathematical description is based on the stoichiometric calculation of the fuel volume composition and flue gases based on chemical Equations (1) to (4).
Let us consider the following basic components of the fuel:
where C is carbon, H is hydrogen, S is combustible sulfur, O is oxygen, and W is water. For a perfect combustion of the 1 kg of fuel, a theoretical amount of dry air is required
where C, H, and S are the fuel combustible components
, and
Vda min is the theoretical minimum of dry air required for complete combustion.
In the same way, we determine a minimum volume of dry flue gases
Vdf min arising by the complete combustion of the 1 kg of fuel without excess air based on the stoichiometric calculation:
where
is the volume of CO
2 in the flue gas resulting from the combustion of C from fuel and
VO is the volume of CO
2 in the flue gas resulting from the combustion of air components,
is the volume of incurred SO
2,
is the volume of combusted nitrogen from fuel, and
is the volume of combusted nitrogen from the combustion of air components.
The volume of CO
2 in the flue gas resulting from the combustion of C from fuel is determined by the formula:
The volume of CO
2 in the flue gas resulting from the air combustion is determined by the formula [
25]:
The amount of oxygen needed to burn all the carbon is given by the form:
To distinguish between complete and incomplete combustion, we define excess air as the ratio of the amount of air actually supplied and needed theoretically.
It is expected that the excess air is equal to 1 for complete combustion. However, such an ideal state occurs only under ideal combustion conditions and with complete fuel mixing; only then, the volume fraction of CO in the flue gas is equal to zero. It is not possible to achieve such a state under real operating conditions, so we try to keep the excess air close to 1. Then, the amount of dry flue gas with excess air is given by the formula:
Then, the measured volumes
x in the dry flue gas must correspond to these values:
In the case of burning all C under complete combustion, we put
in Equation (14), and we can denote volume as a maximum one:
Then, the excess air coefficient
λ can be expressed from Equation (14) using (16) as
or from Equation (15)
and Equations (17) and (18) can be simplified as follows:
or
If relations (19) and (20) do not give the same results, the combustion is not complete.
2.3. Consequences for Monitoring and Control of Biomass Combustion in Small and Medium-Scale Boilers
Based on the results of the above mathematical analysis, it is possible to retrospectively monitor and evaluate the parameters of the combustion process. On the basis of the measured values of O2 or CO2 and calculated values of the excess air coefficient , we are able to distinguish whether the combustion is complete or incomplete. Next, it is possible to control the combustion process based on the monitored values in order to achieve maximum efficiency (maximum heat gained) at a minimum concentration of pollutants. The problem with such monitoring or control is that we do not have always information from the flue gas analyzer. The flue gas analyzer is a standard part of equipment only in large-scale boilers, so there, the volumes of CO2 and O2 are known. However, in small-scale boilers, flue gas analyzers are not a standard part of equipment due to their relative high price compared to the boiler price. Another problem is that it is impossible to achieve complete combustion in terms of operational practice, which causes heat loss and reduces efficiency. Therefore, we should use the formulas for incomplete combustion, in which CO values in the flue gas are considered, to carry out the control of such process.
In order to avoid losses related to the appropriate amount of the supplied air, it is necessary to monitor the amount of oxygen. The specific value of % O
2 concentration depends on the moisture and the type of wood from which the fuel is made (e.g., wood chips), burner settings, boiler type, and other parameters mentioned in the previous sections [
20,
21,
31]. Previous measurements at medium-scale wood chips fired boilers have shown that the optimal operating range for biomass combustion is usually in the range of 5% to 10% O
2 concentration in the flue gas, which means that the air ratio (20) would be in the interval
, where near-optimal combustion can be reached (but of course is never complete). In case, that the value is at the upper limit of this interval or even
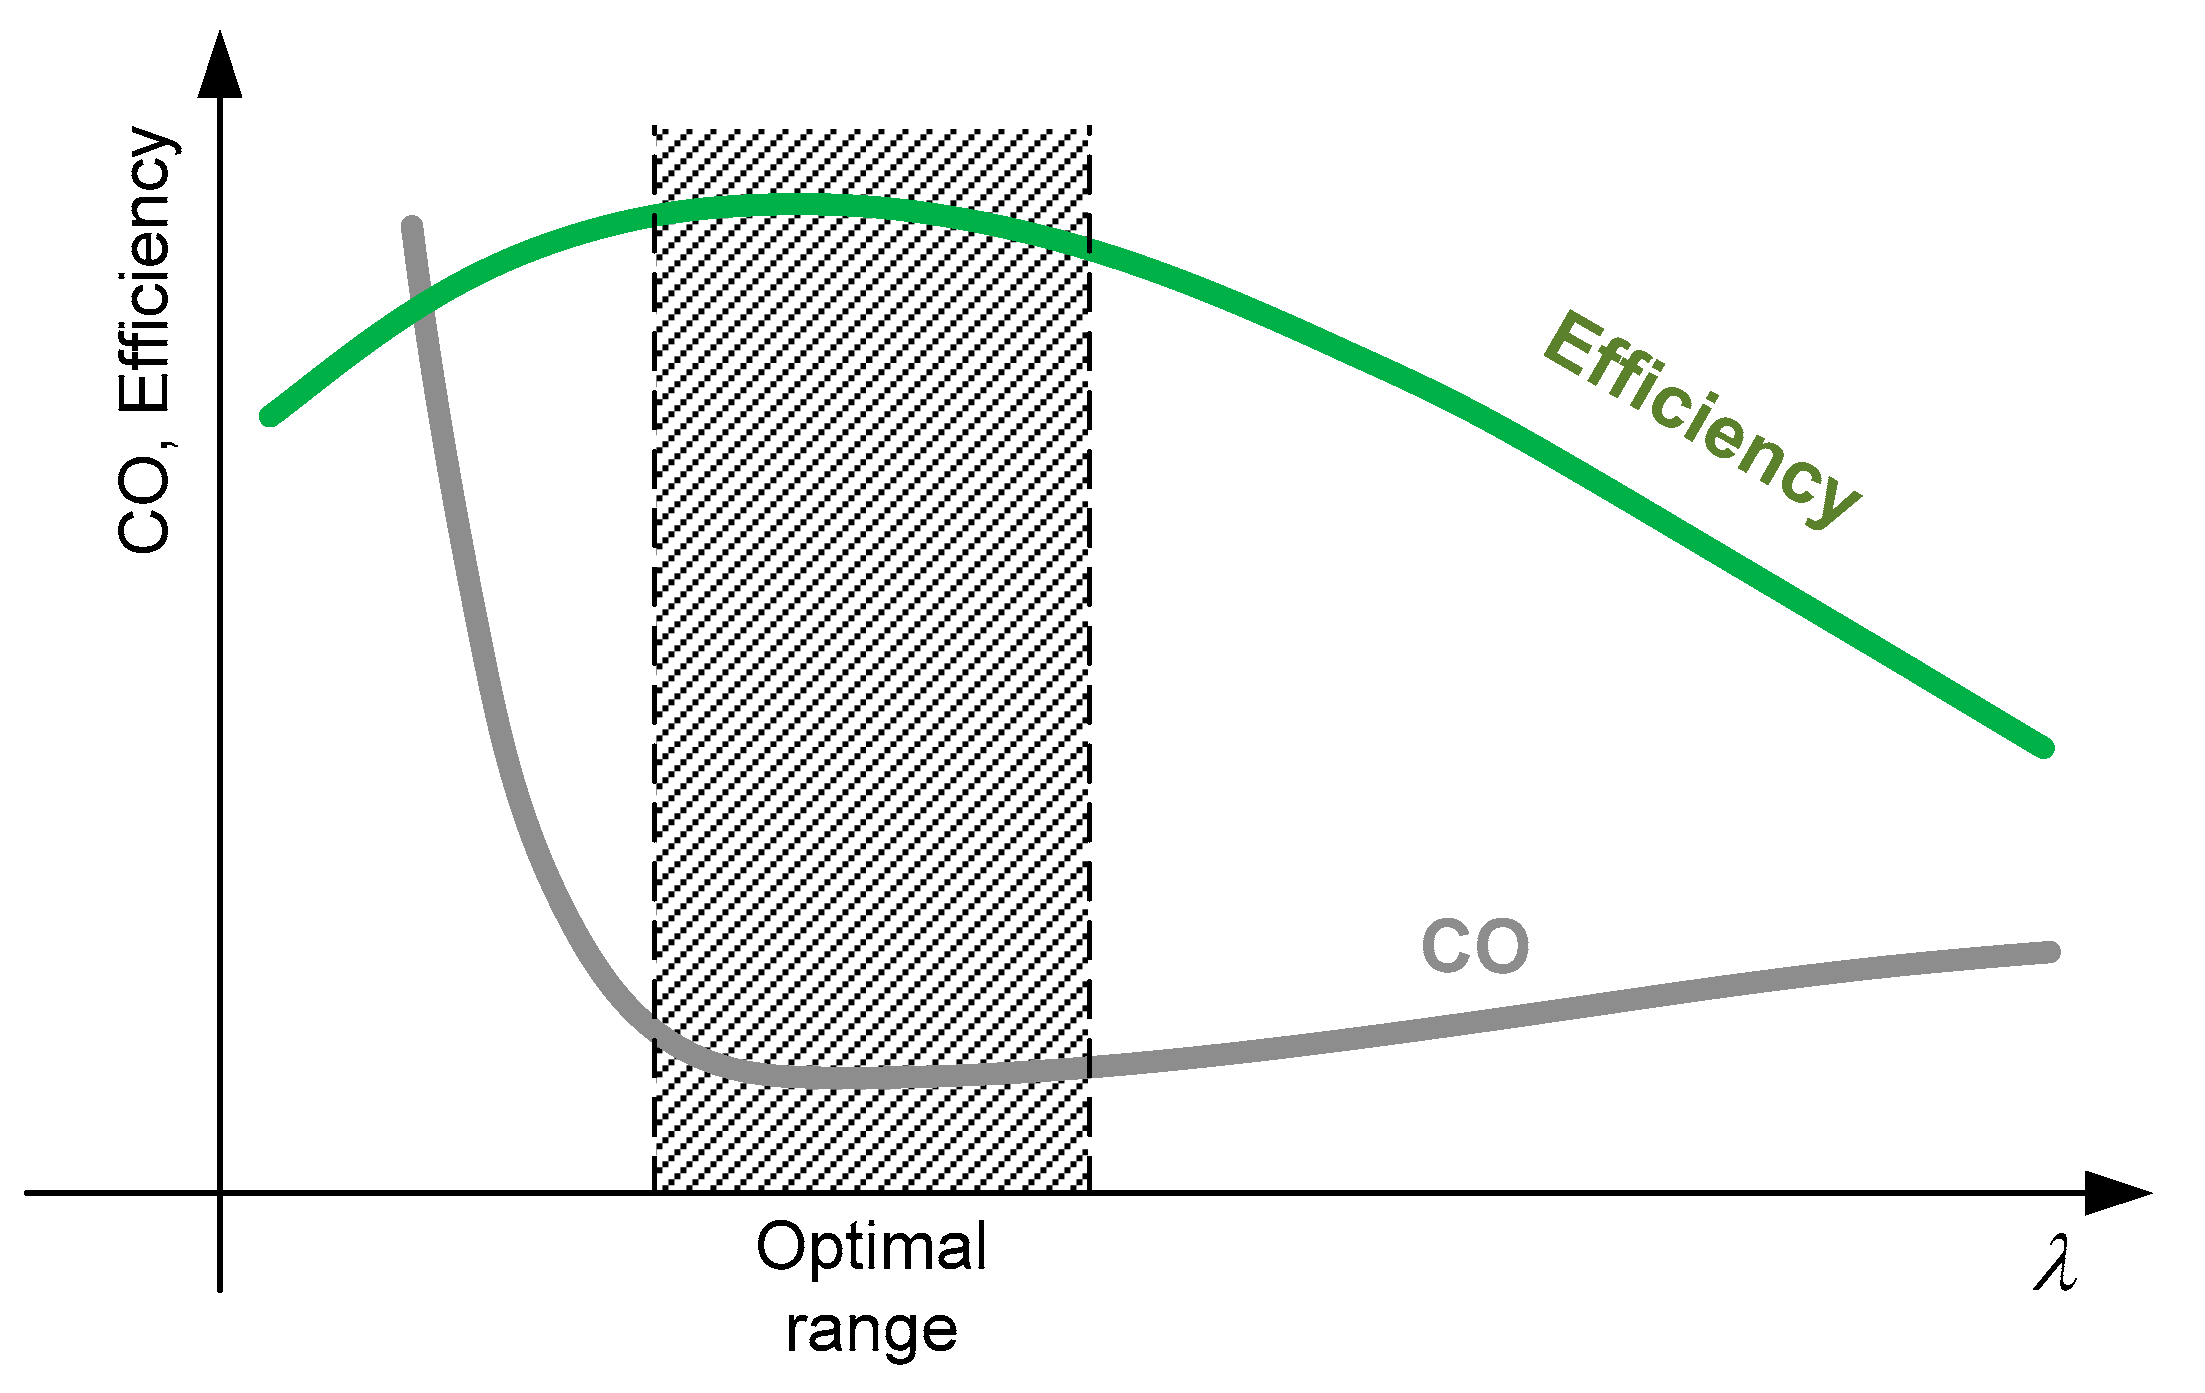
; then, the combustion will more and more approach a state of incompleteness, heat losses by increased flue gas streams will be enhanced, and the produced heat will decrease. A typical course of the dependence of combustion efficiency and carbon monoxide emissions in the flue gas on the amount of combustion air characterized by the air ratio
is shown in
Figure 2.
One of the biomass combustion control system tasks is to find such an amount of supplied oxygen (control set point) described by parameter , so that CO emissions would be minimal, although the fuel parameters have been changed. Then, the near maximal efficiency of combustion can be reached. For fulfillment of this task, it is necessary to continuously monitor a trend between CO emissions and excess air ratio and consequently to change the desired value of O2 concentration in the flue gas. In this way, a faster control response to changes in fuel quality and the deterioration of combustion can be reached.
3. Experiments
3.1. Cost-Effective System
Based on the theoretical analysis of a complete and incomplete biomass combustion presented in
Section 2, it follows that it is important to evaluate the so-called excess air coefficient
λ during the combustion control to ensure almost complete combustion and to achieve the highest efficiency at the lowest level of pollutants, especially for CO emissions. For that reason, it is necessary to have the continuous information about the oxygen concentration in the flue gas. So, the excess air ratio coefficient is usually detected indirectly by measuring the O
2 concentration in the flue gas by operation of a so-called lambda probe.
To achieve complete biomass combustion and high efficiency where the oxygen value is nearly zero () is practically unachievable. Therefore, the aim is to operate the biomass boiler in the lowest possible excess air (at the lower limit of the optimal interval). On the other hand, the boiler needs to be operated at such value so that the CO concentration in the exhaust gas does not increase due to low excess air. In the real operation, it commonly happens that the quality of combustion deteriorates (for example, due to wood chips moisture higher than 35%), and CO sharply increases if the excess ratio decreases to the lower limit of the optimal interval. Such a dynamic state has an adverse effect on the combustion stability; high values of CO emissions appear and leakages of pollutants into air occur, while the temperature in the combustion chamber decreases. Therefore, maintaining the optimal air ratio value at the lower limit of the optimal interval is difficult, respectively often even unachievable.
This problem was solved in our experiment in such a way that in addition to the lambda probe for sensing the excess air, the low-cost gas sensor for sensing the trend of carbon monoxide emissions was incorporated into a control system of the wood chips fired boiler. When the amount of CO increases sharply, the control system decreases the amount of wood chips supplied into the combustion chamber or even breaks fuel filling in case of extreme CO emissions increasing. Blocking the fuel supply quickly stabilizes the combustion process, especially in transient states, i.e., when starting the boiler, when changing the quality of the supplied wood chips, or when changing the required boiler power.
3.2. Biomass Combustion Process Control
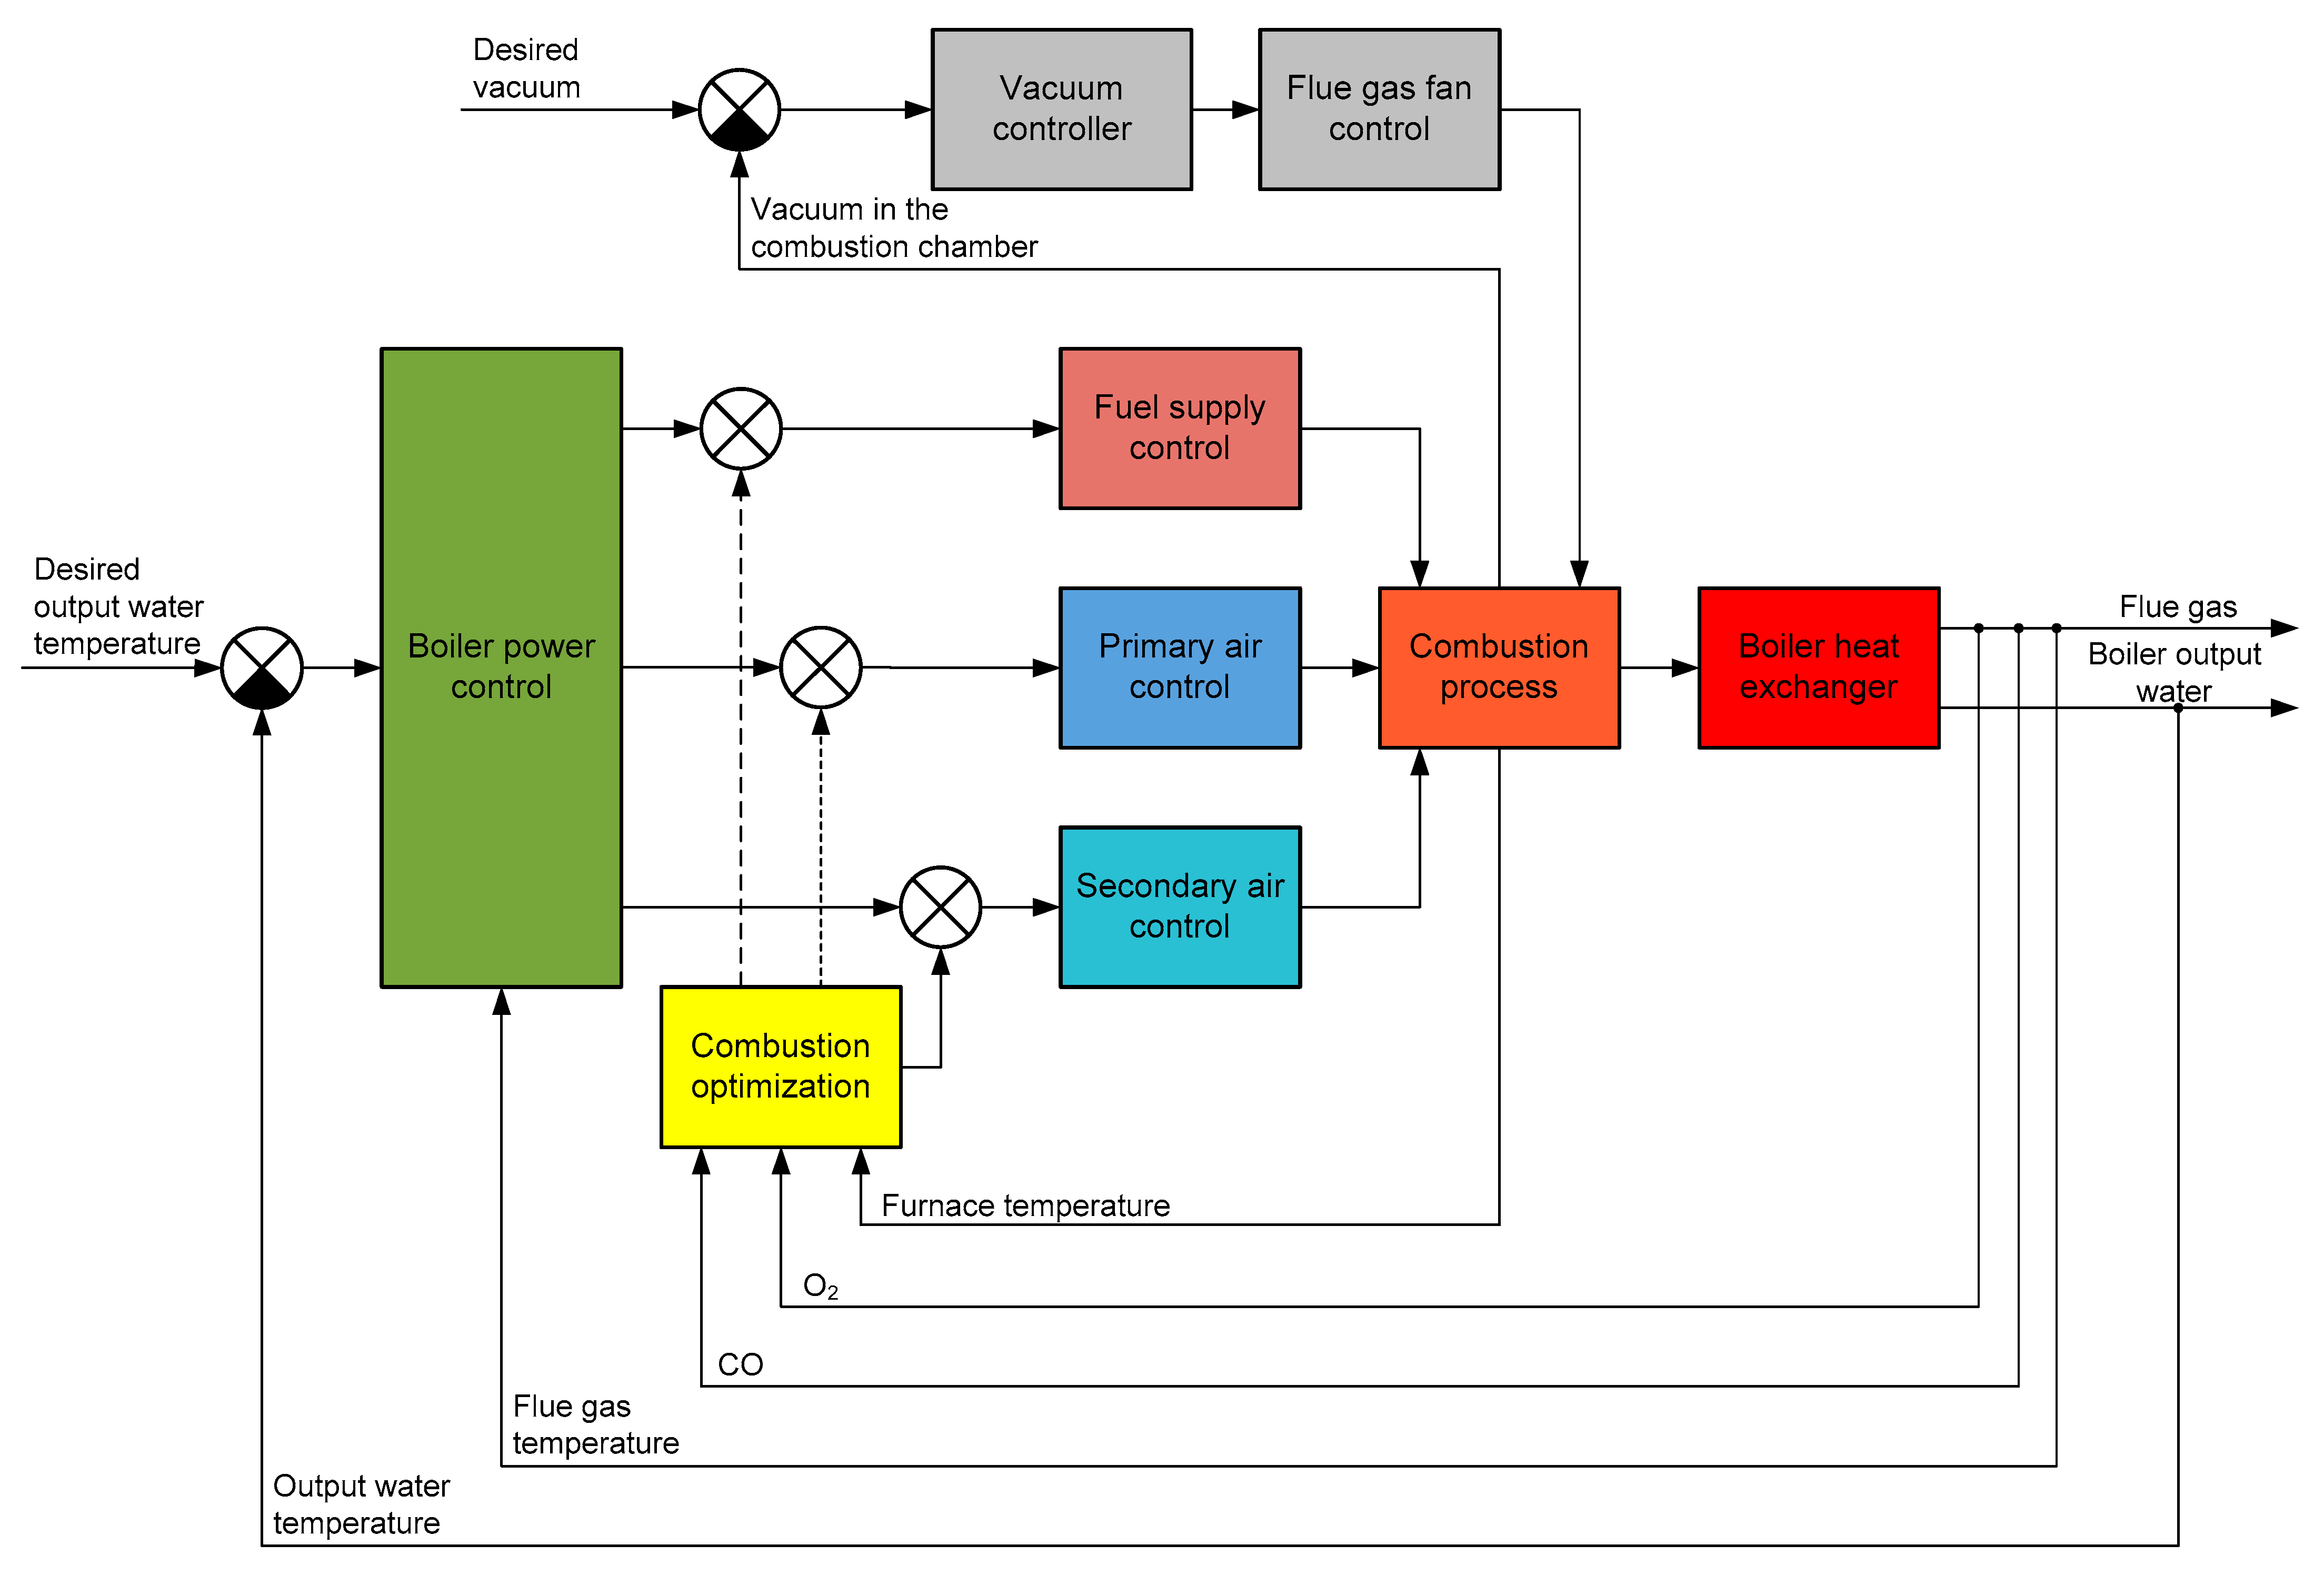
Based on the theoretical analysis, a principle block diagram of the process control system was designed (
Figure 3) for the possibility of providing near optimal control of the biomass combustion regardless of its quality parameters (changing moisture, type of wood). There are these control loops in the block diagram:
The boiler power control loop as a main control loop for the boiler output water temperature.
The fuel supply control loop to adjust the amount of supplied fuel according to the desired power of the boiler and current state of the combustion process.
The primary air control loop to adjust the amount of supplied primary air according to the amount of supplied fuel and the actual output boiler temperature.
The secondary air control loop to adjust the amount of supplied secondary air according to the amount of supplied fuel and the oxygen concentration in flue gas.
The flue gas fan control loop to regulate the desired vacuum in the combustion chamber.
An important part of the block diagram in
Figure 3 is the combustion optimization block, which continuously provides correction of the fuel supply and amounts of the primary and secondary air supplied into the combustion chamber according to actual values of O
2 concentration and CO emissions in the flue gas to reach the complete combustion with a minimum excess of the combustion air.
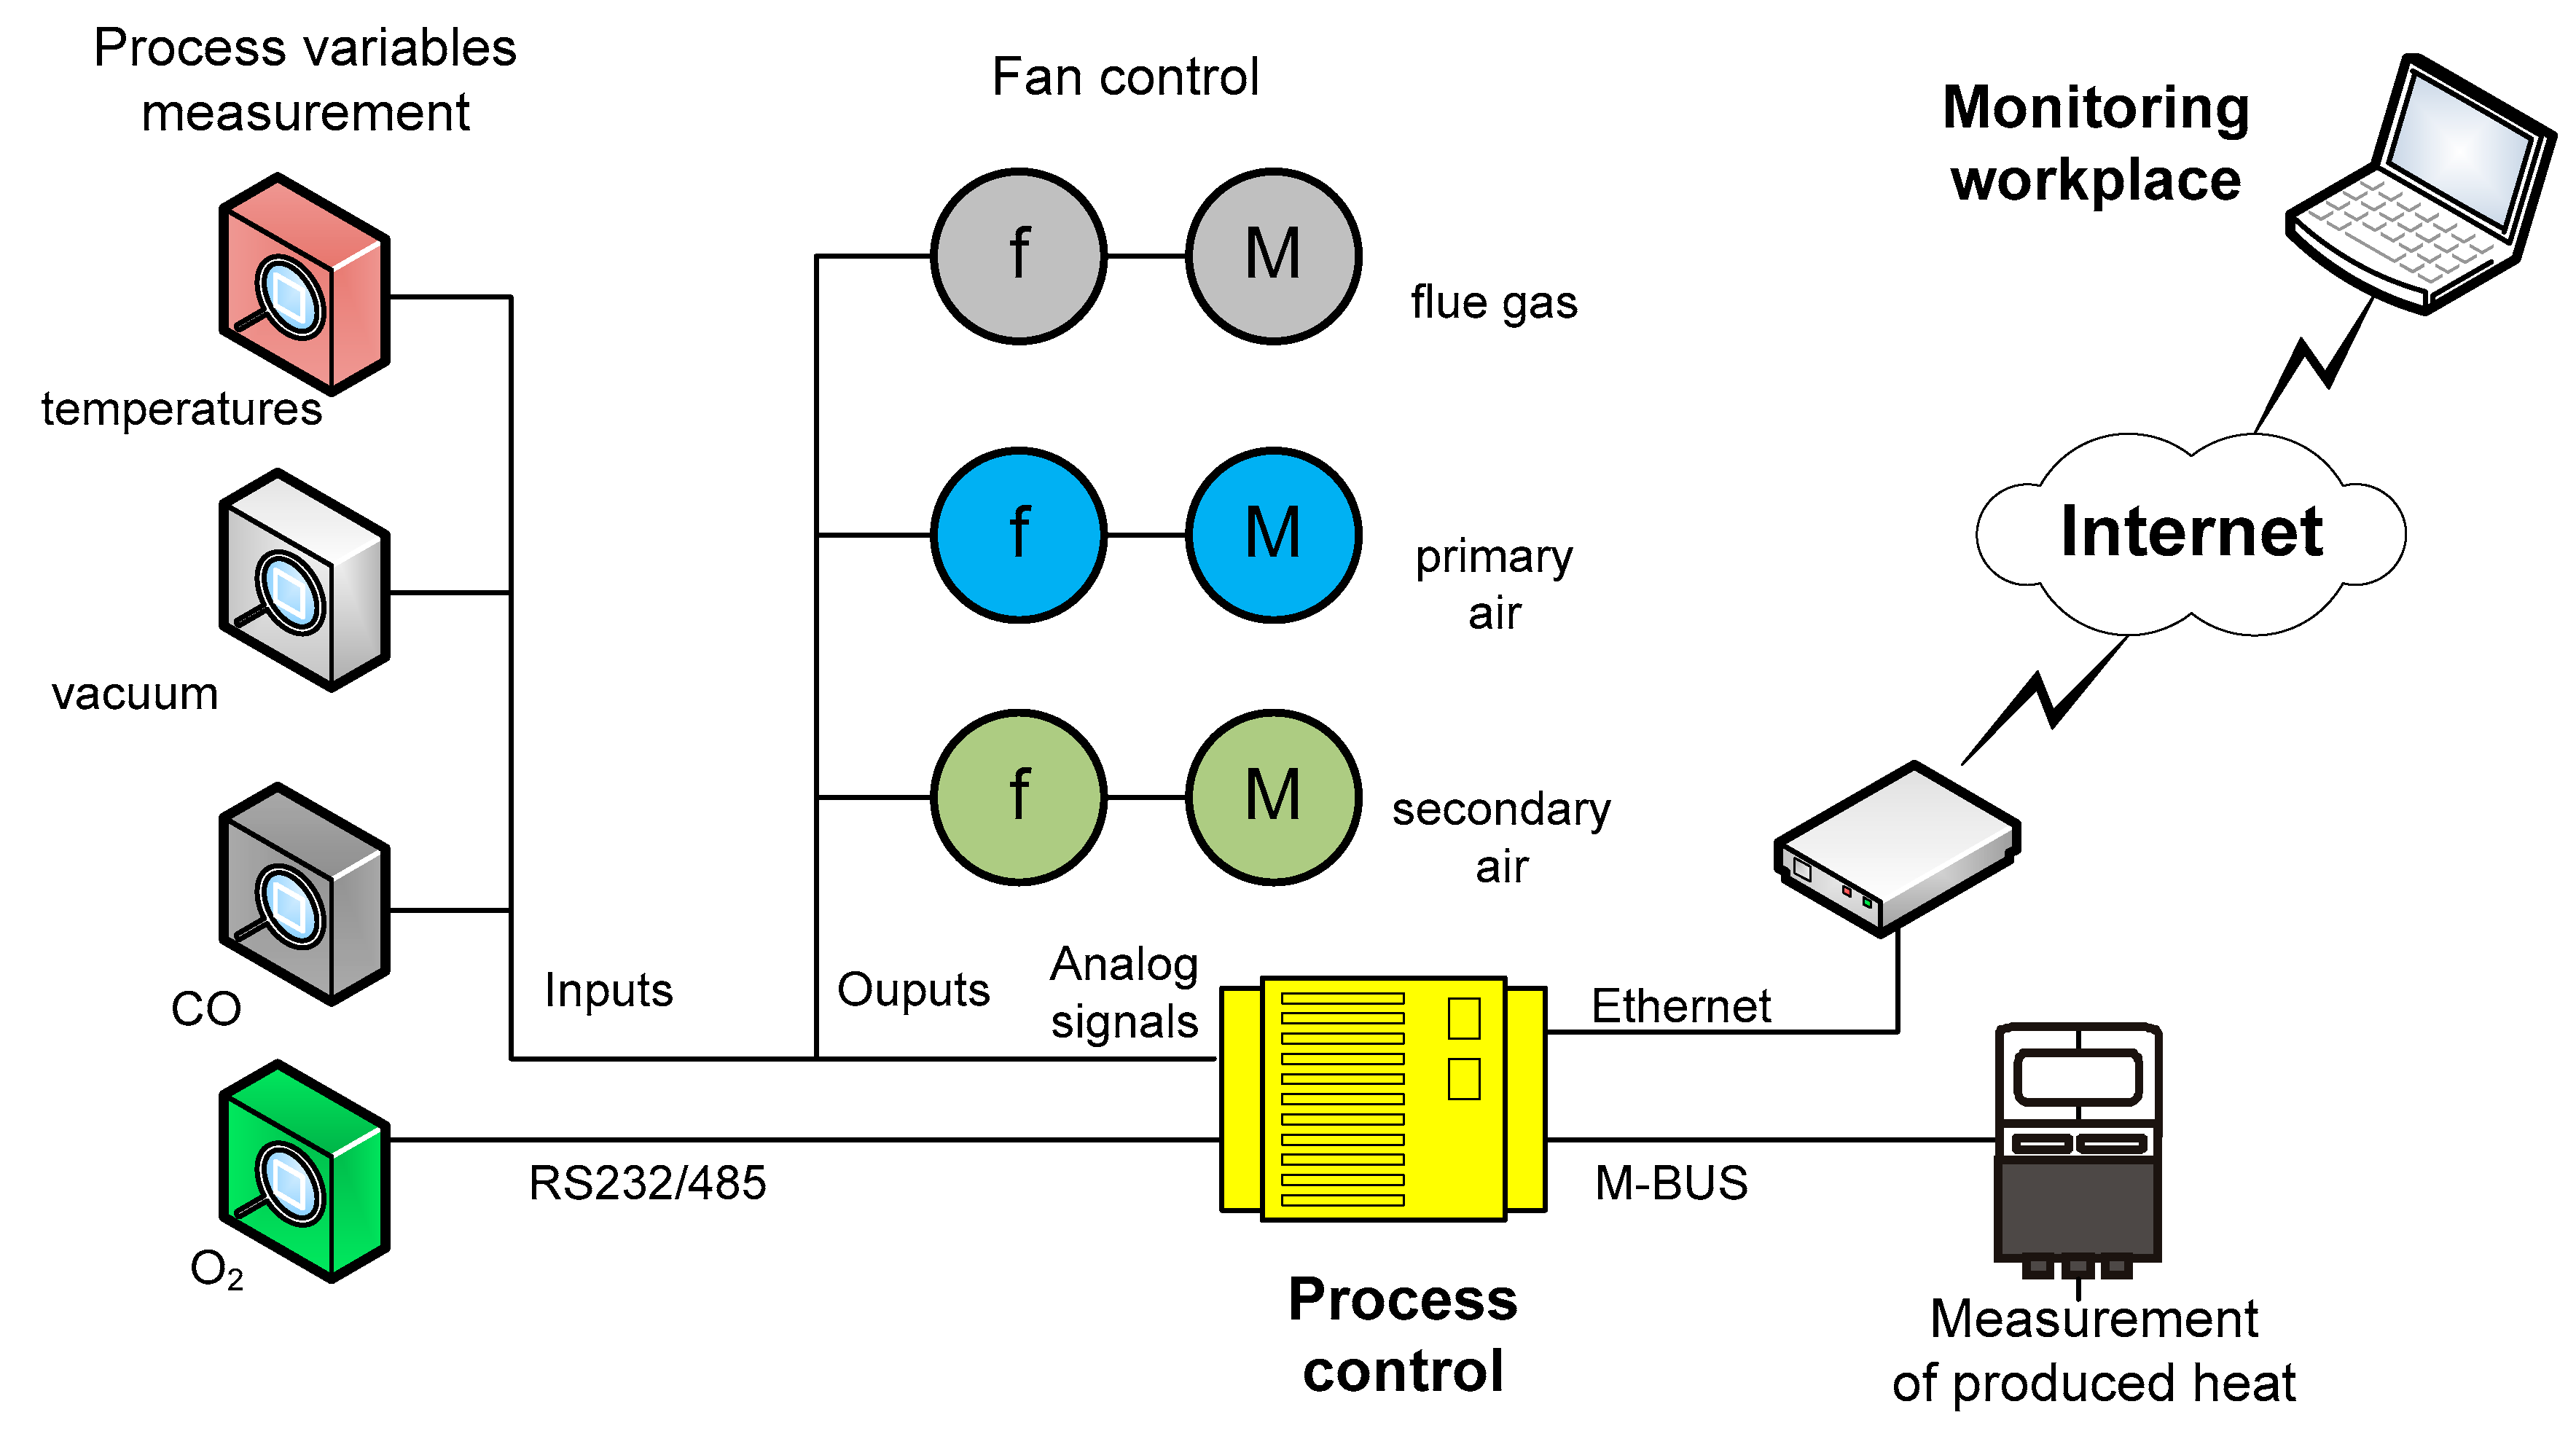
Based on the block diagram of the process control system, the automatic control and remote monitoring system (
Figure 4) of biomass combustion was designed and realized. The basis of this system is an industrial modular process control system ADiS, which is monitored by the SCADA (Supervisory Control and Data Acquisition) system Promotic. Process variable sensors (e.g., pressures, temperatures, CO emissions) are connected via an analog input module with 10 bits A/D converter. In the process control system, we implemented a procedure for communication with the Lambda probe via the RS232/485 interface and a procedure for communication with the heat meter via an M-BUS interface for measurement of the boiler output power.
The wideband Lambda probe LSU 4.2 was used for O2 concentration measurement in the flue gas. Generally, it is an oxygen analyzer working on the principle of electrochemical cell. Although the main purpose of this dual cell limiting current sensor use is in car engines, thanks to its monotonic output signal in the range of λ = 0.7 to theoretically λ = ∞ (air containing 21% O2) and good price, it is capable of being used as a very useful sensor for combustion monitoring in small and medium-scale boilers, too. The low-cost gas sensor TGS 816 was used for CO emissions measurement in the flue gas. This is a tin dioxide semiconductor with low conductivity in clean air. A simple electrical circuit converts the change in conductivity to an analog output signal that corresponds to increased CO emissions. The sensor together with the convertor were assembled into the special holder, which protects the sensor against damage caused by high temperature in the flue and allows the positioning of such a CO probe for good input of flue gases to the sensor. Due to the fact that only information about the trend of carbon monoxide emissions (i.e., whether the amount of CO increases or decreases) is important for the biomass combustion control algorithm, such a CO probe serves only for an indicative measurement and not exactly in ppm or mg/m3. In this way, we have achieved a cost-effective solution to obtain the dependence of CO emissions on O2 concentration during biomass combustion usable in the control of small and medium-scale biomass-fired boilers.
4. Results and Discussion
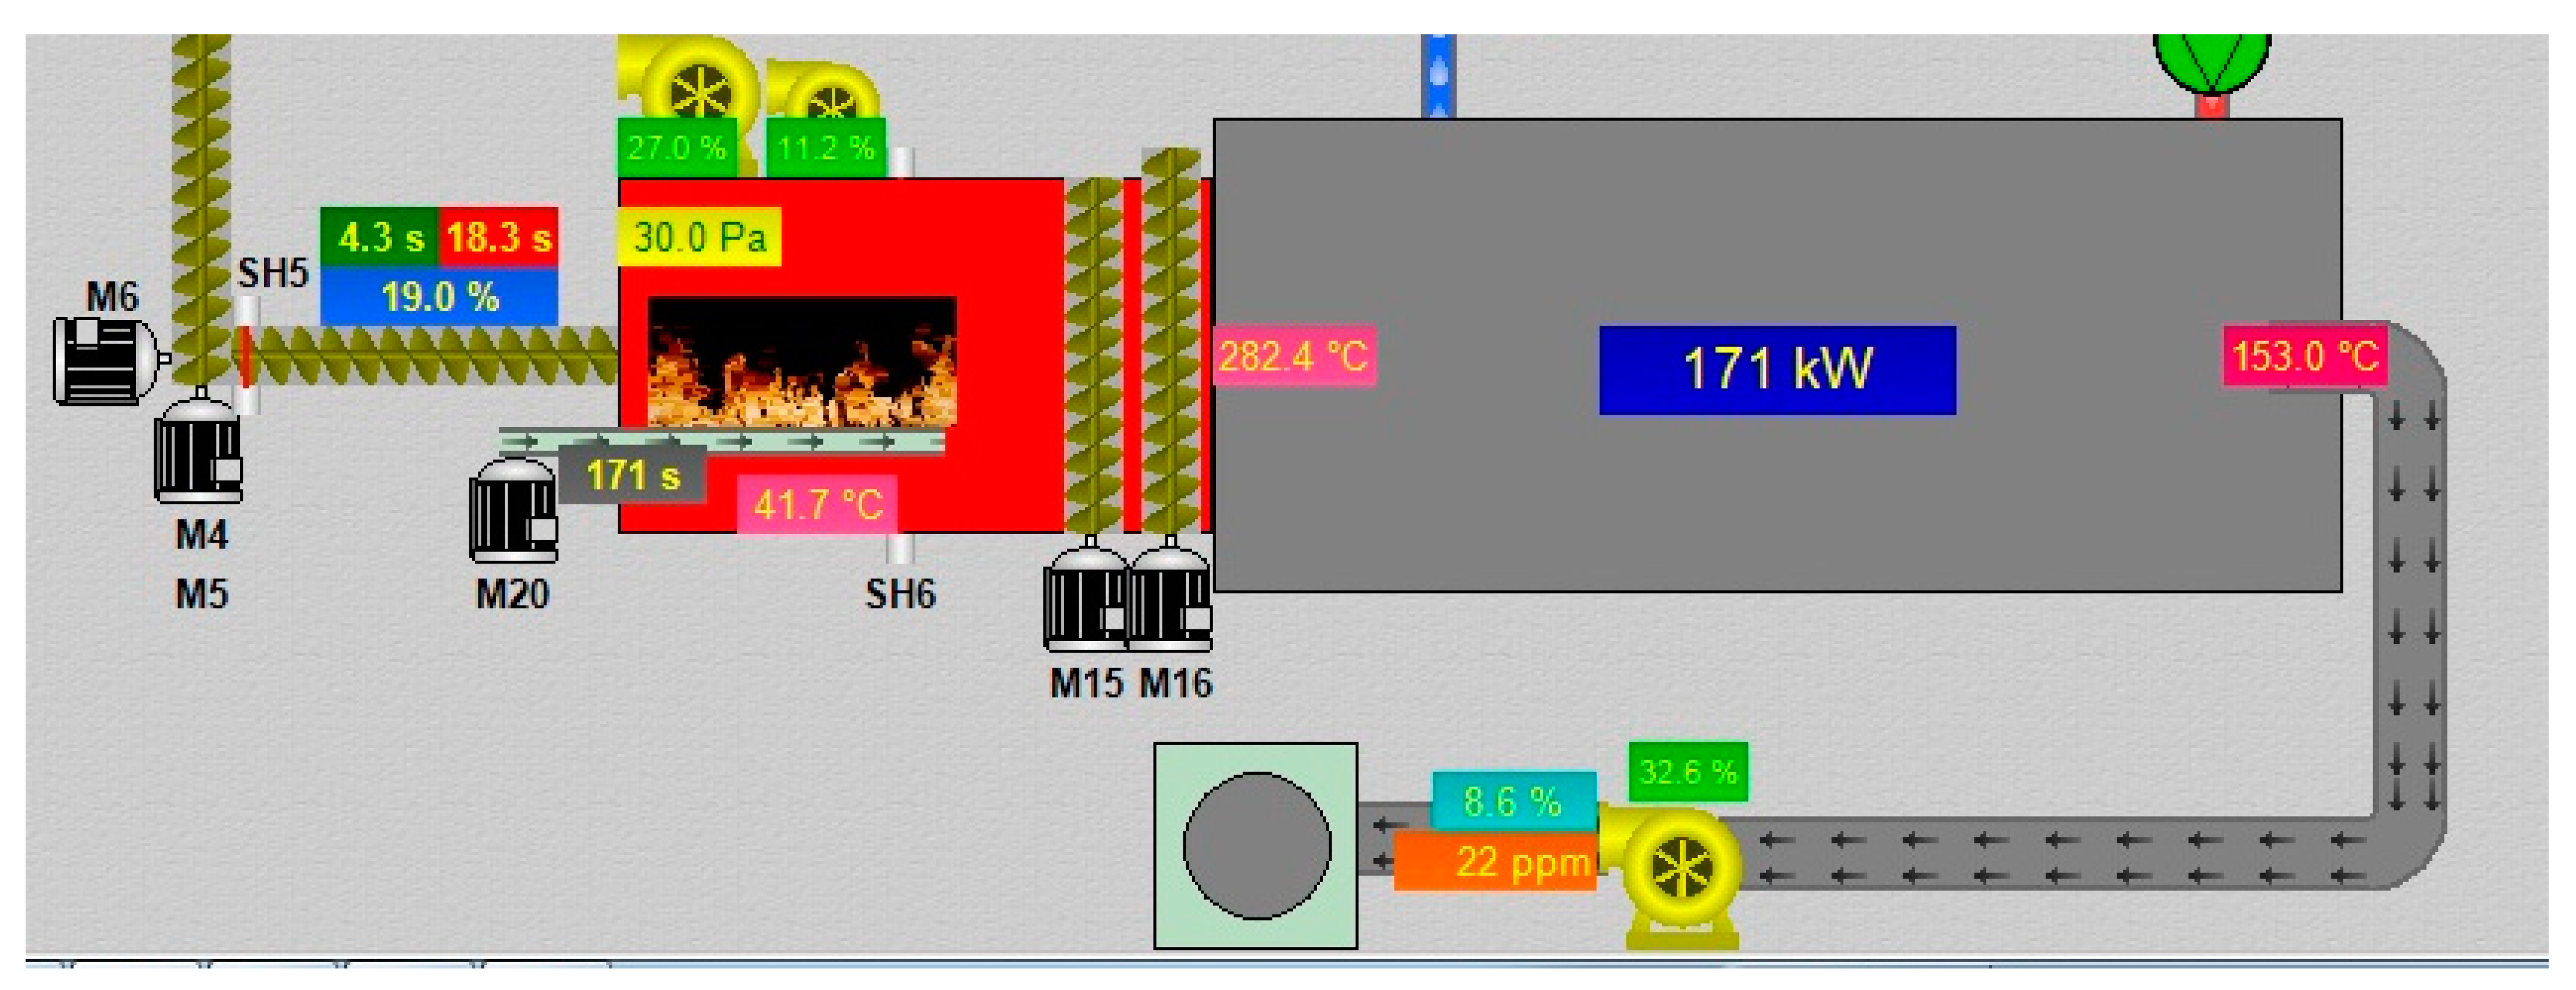
The designed automatic process control and remote monitoring system was experimentally tested in five biomass-fired boiler plants placed in Slovakia where wood chips boilers of different powers, different types, and different producers are installed. The online monitoring system allows visualizing the technological process in boilers (graphical schemes, diagrams, trends, and reports), to evaluate the quality of the combustion process and to change the control parameters online. An example of the graphical visualization of one monitored wood chips boiler is presented in
Figure 5. Online monitored process variables can be seen, such as for example:
The boiler power output 171 kW;
The O2 concentration 8.6% and CO emissions 22 ppm in the flue gas;
The vacuum pressure 30.0 Pa;
The temperatures before and after the heat exchanger: 282.4 °C and 153.0 °C, the ash temperature 41.7 °C;
Fans revolutions (in percentage of nominal): the primary air 27.0%, the secondary air 11.2%, the flue gas 32.6%.
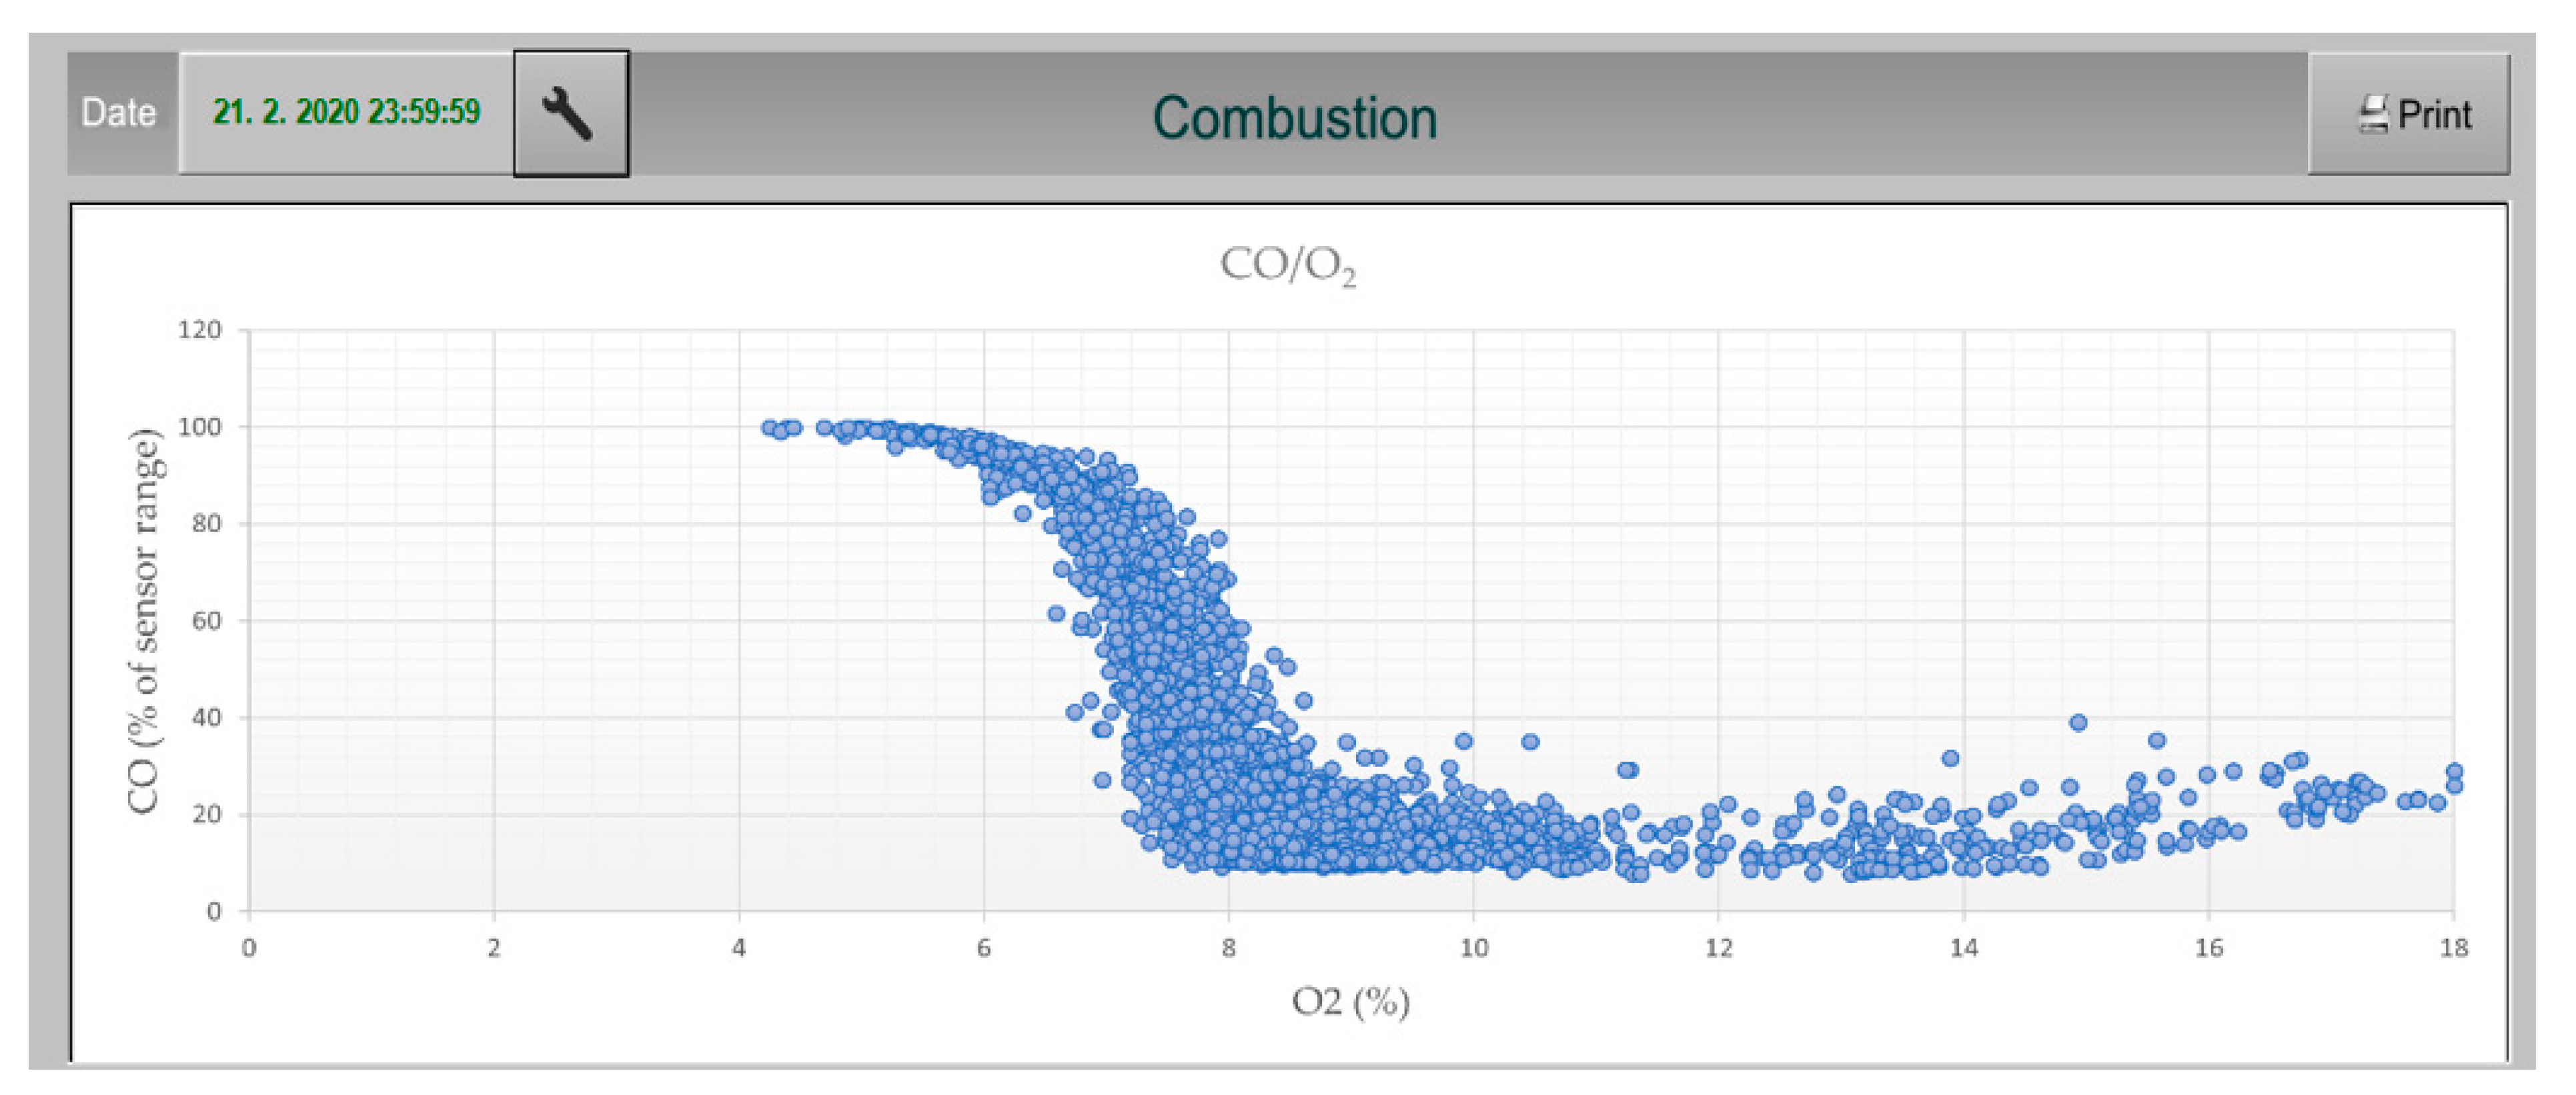
Next, we analyzed the monitored data in more detail. The implemented control system makes it possible to evaluate the dependence of the CO emissions stated as a percentage of the CO sensor operating range (approximately 1000 ppm) on the O
2 concentration in the flue gas also given in percentage at various user-set time intervals. It can be seen in
Figure 6 that on 21 February, combustion ran mostly in a 7–9% O
2 concentration interval in the flue gas, which is in the required optimal range of 5–10%.
In
Figure 7, time courses of some monitored process variables can be seen. The
x-axis shows the real time (from 5:00 to 6:00). On the y-axis, we can monitor selected process variables: the boiler output water temperature in °C, the flue gas temperature in °C, the primary air fan in % of nominal revolutions, the O
2 concentration in %, the CO emissions in % of the sensor range, the fuel supply expressed as the ratio of the filling time to the sum of the filling time, and the standing time of the supply conveyor.
The scale on the y-axis depends on the currently marked variable. The user can select the monitored variable in the upper part of the window by checking the selection. In the lower part, the user sets the time interval with the possibility of saving the data history.
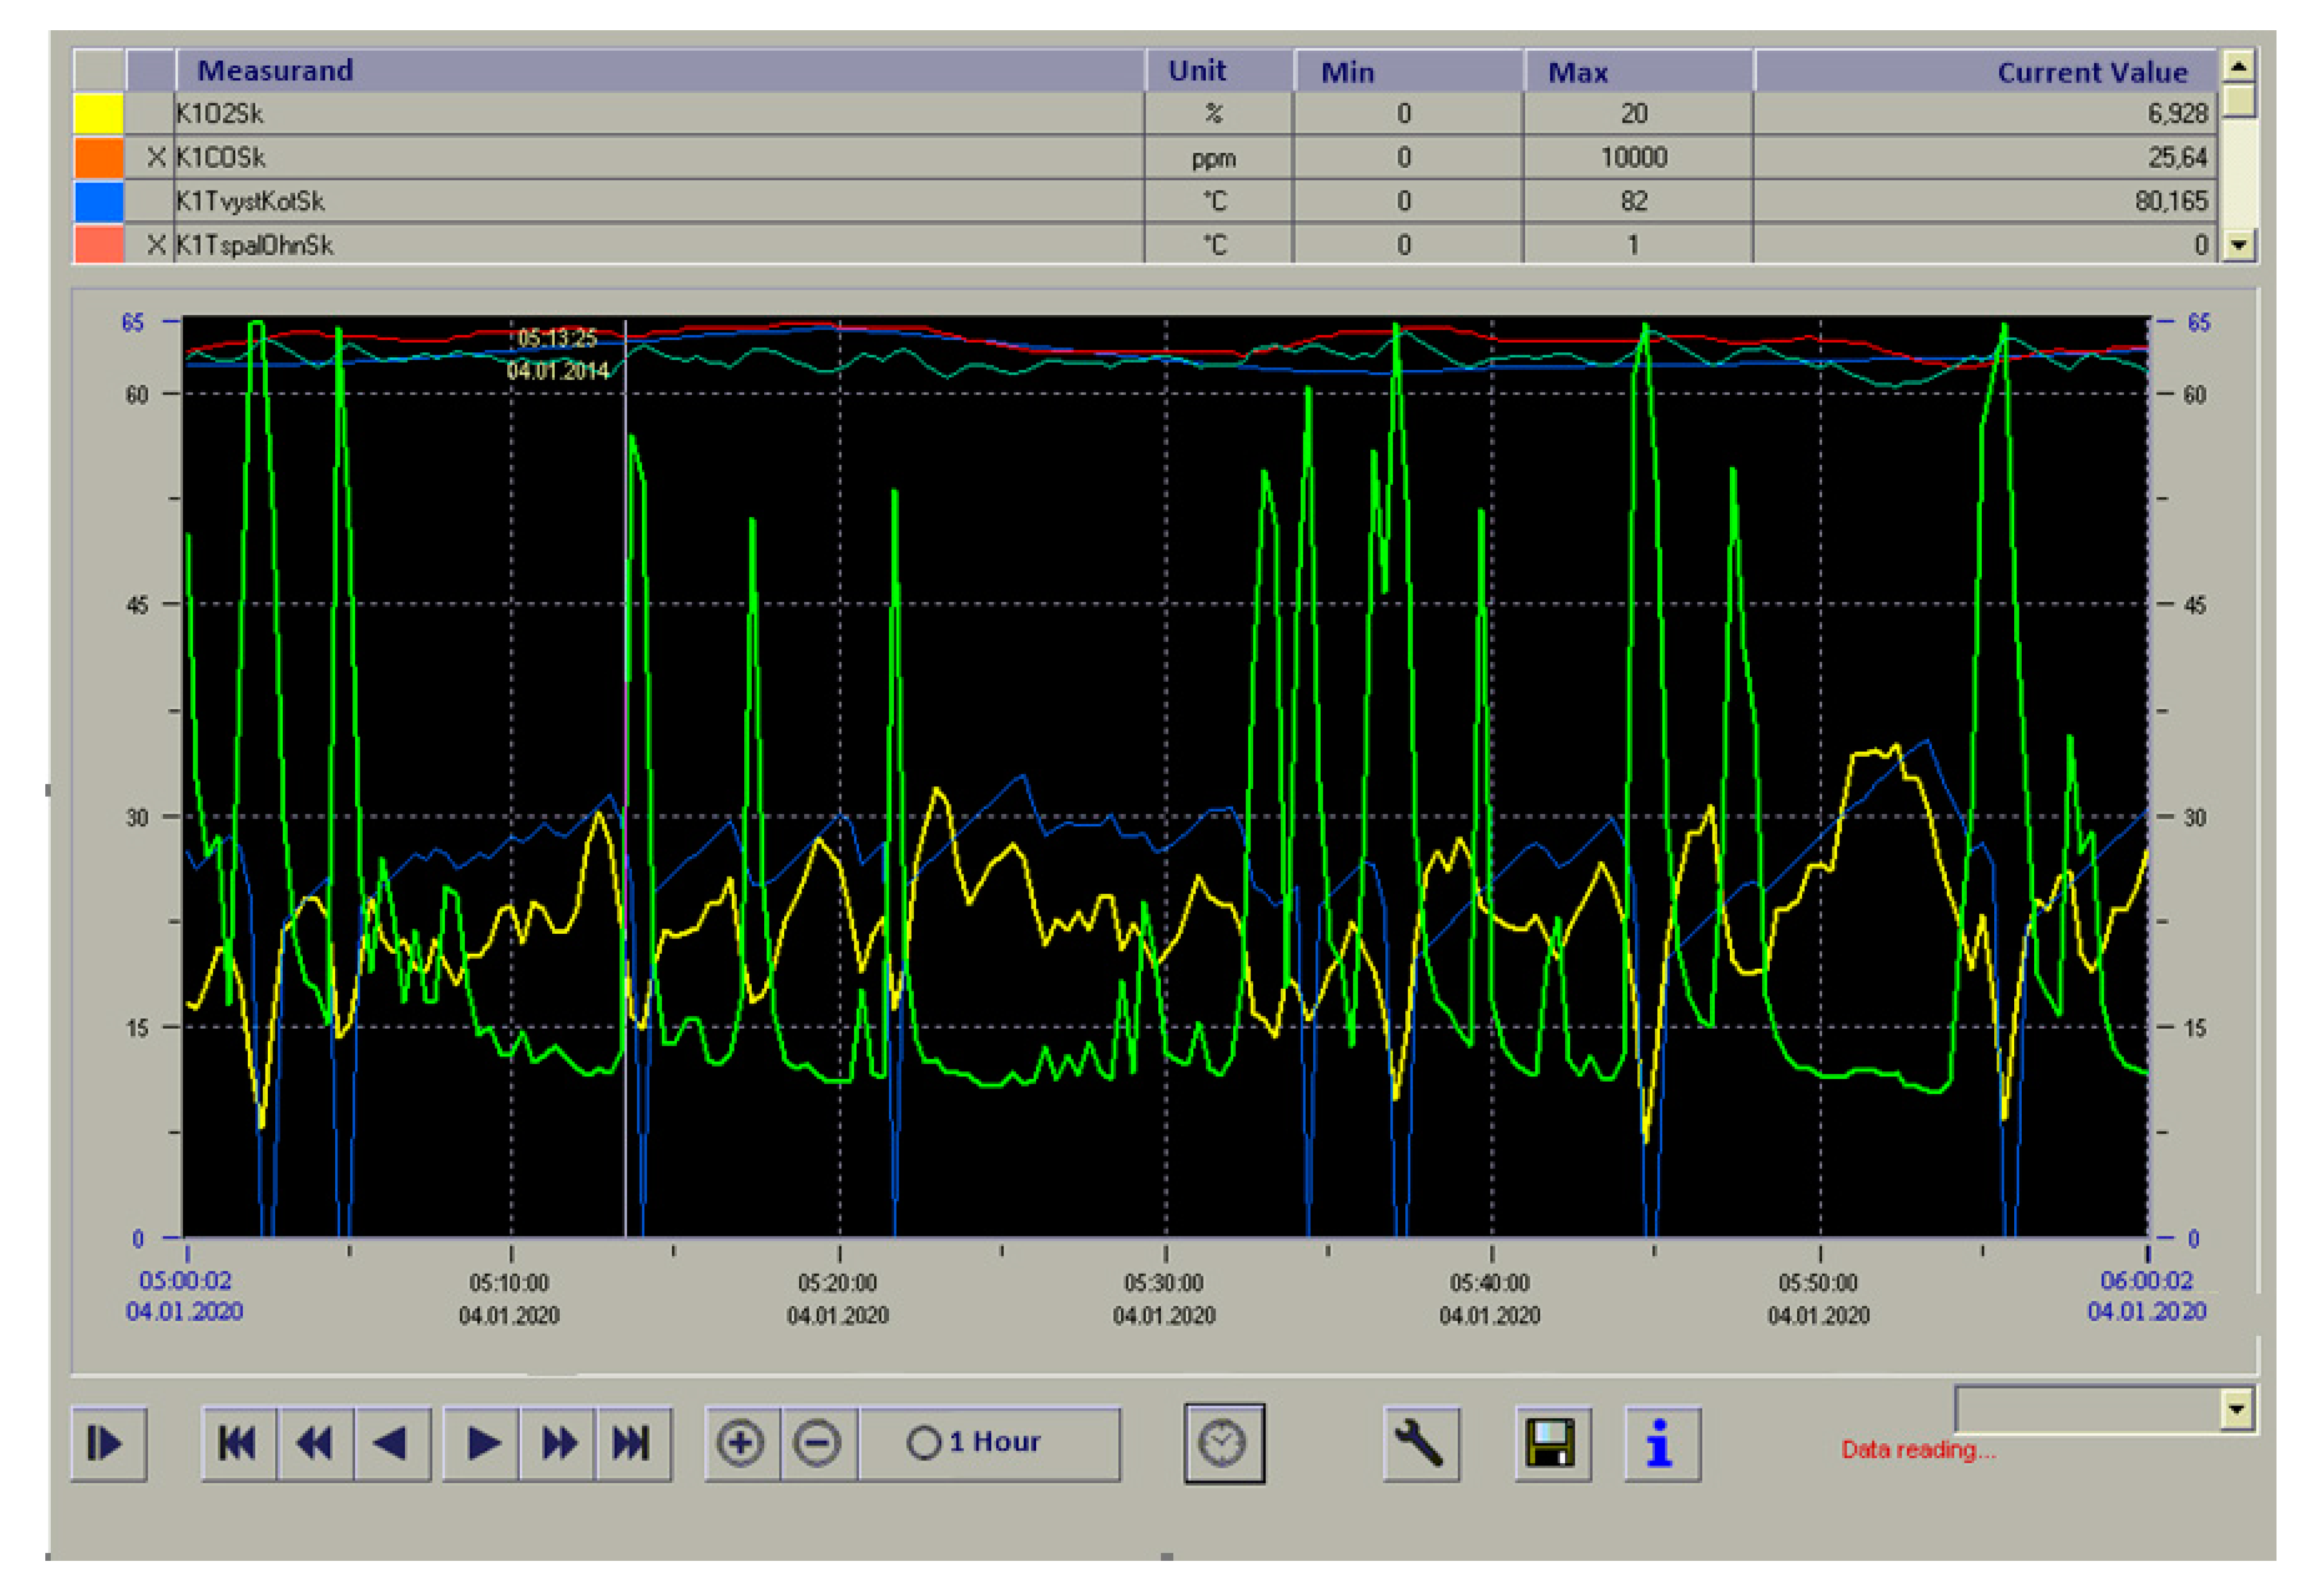
In the following, we focus only on the analysis of the measured values of O
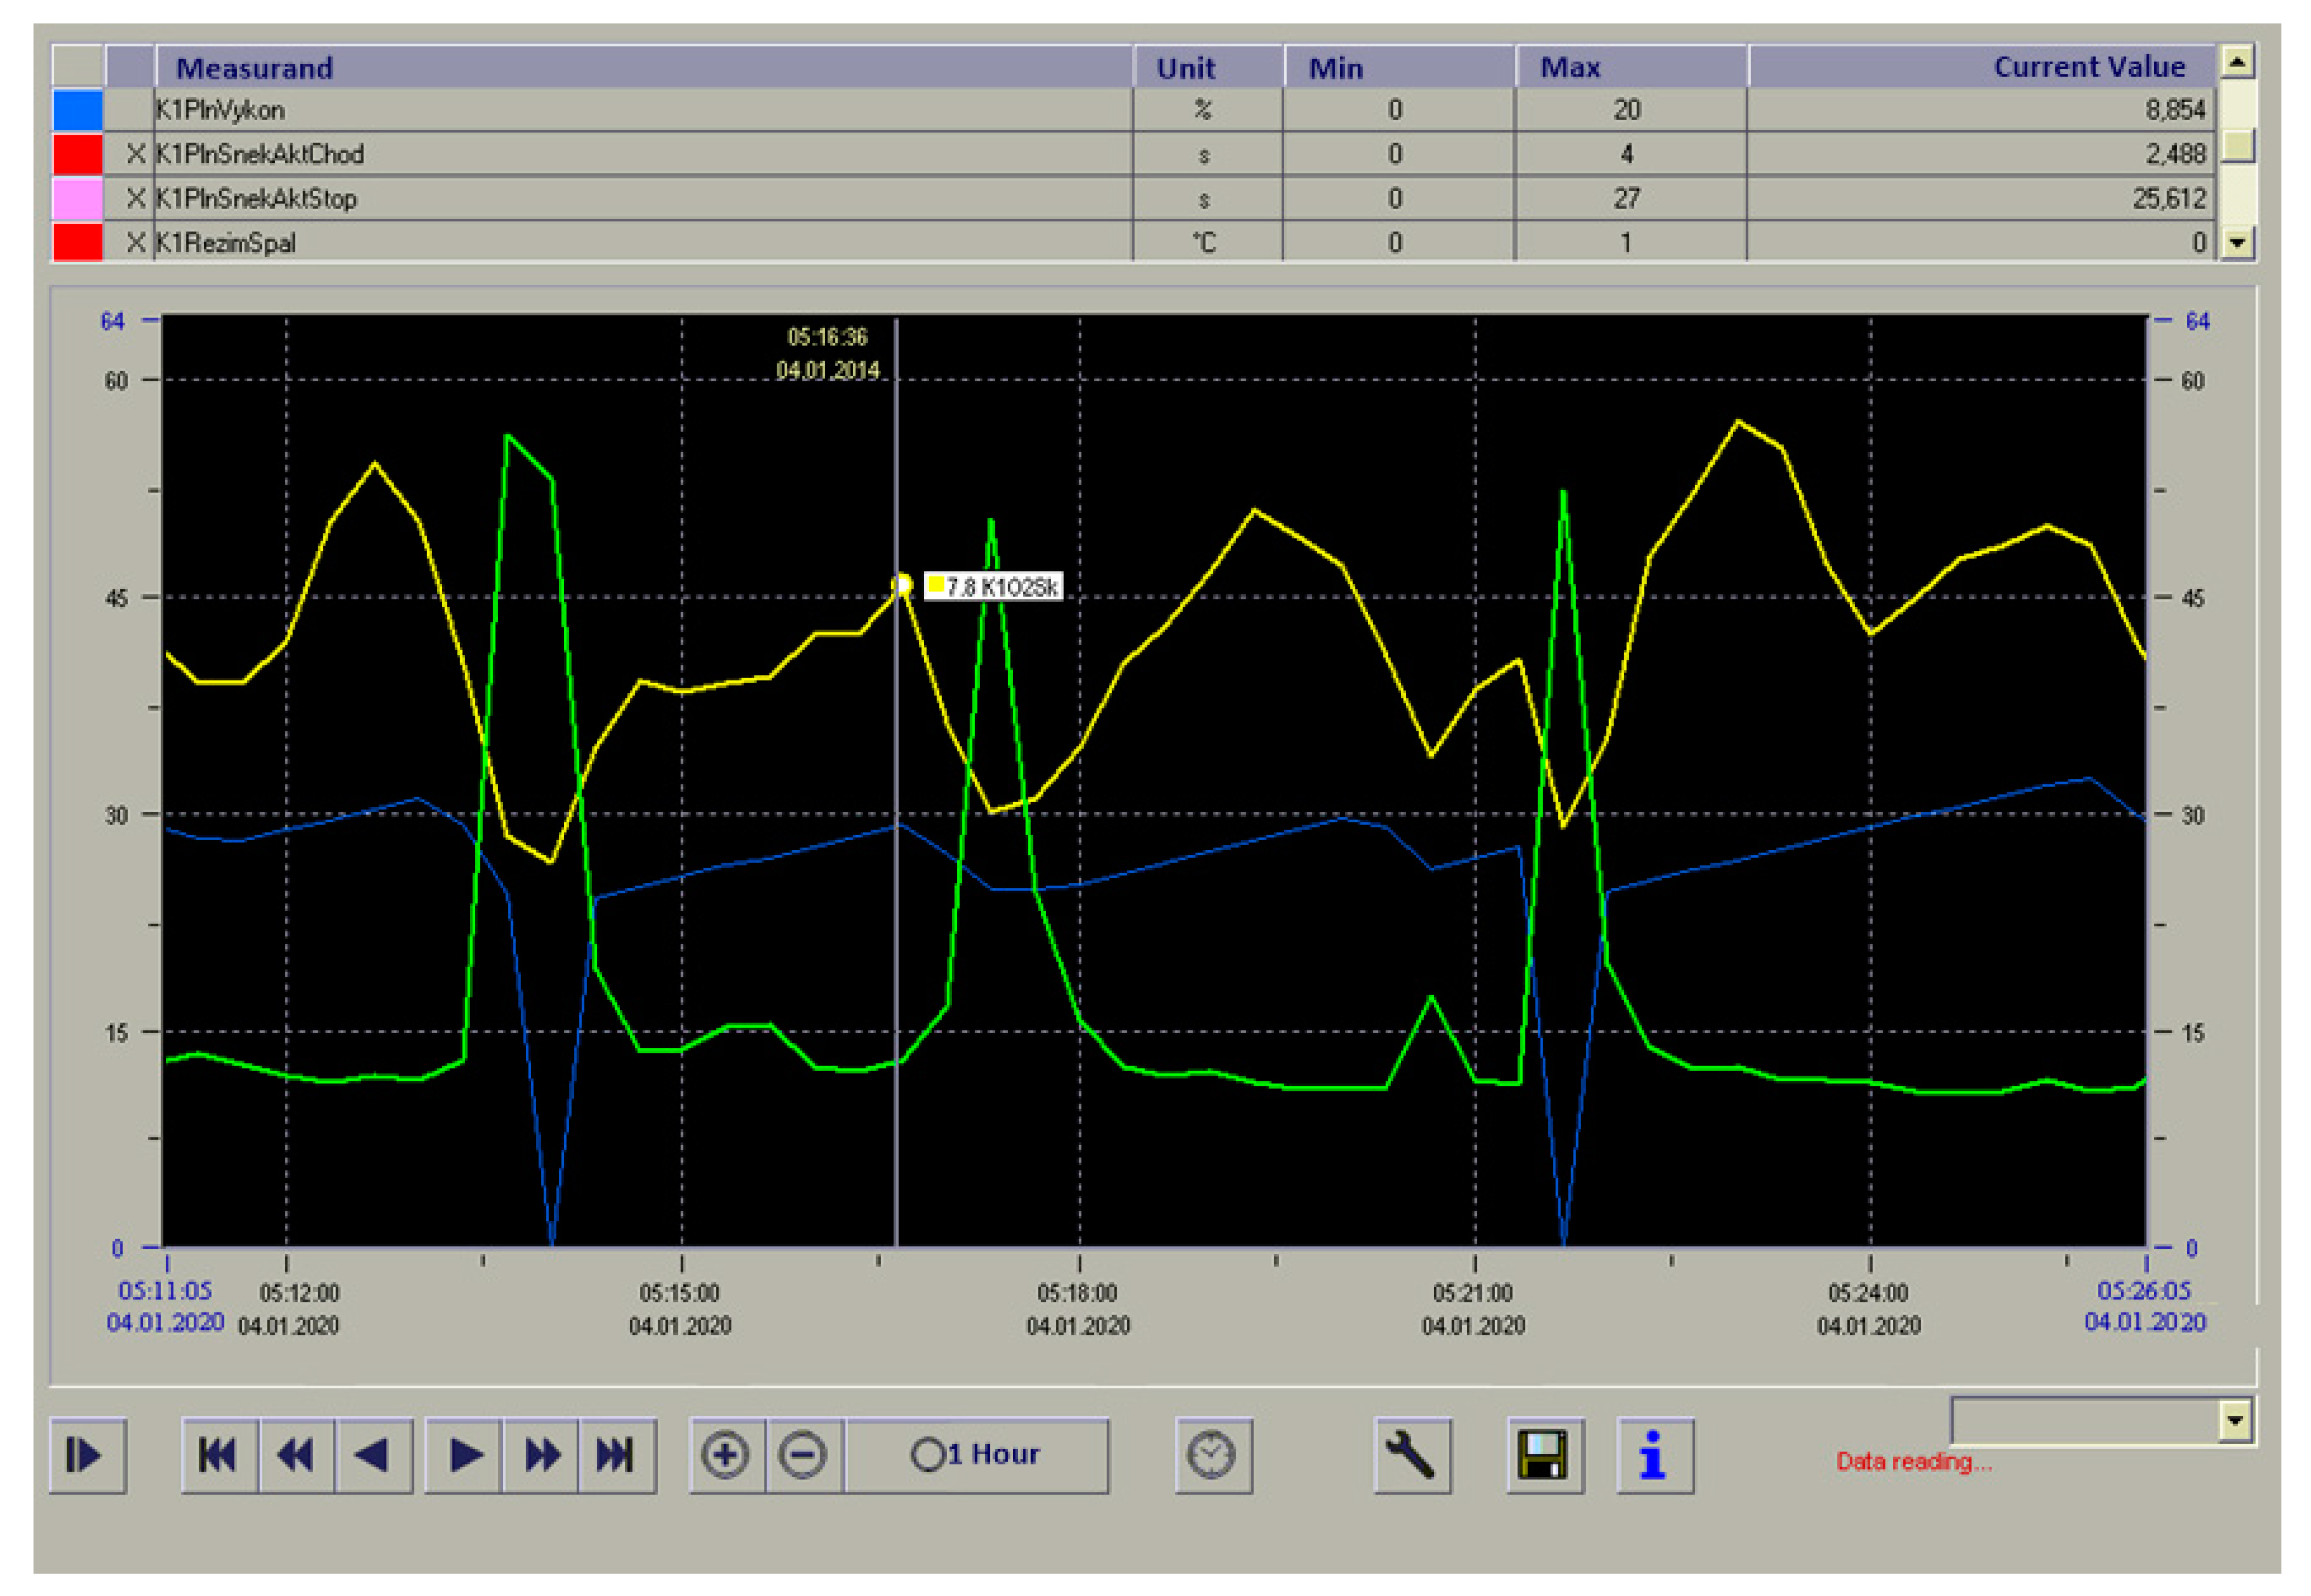
2 concentration, CO emissions, and the related control of the fuel supply in order to achieve high efficiency with low fuel consumption and low CO emissions. As an example, the measured values recorded from 5:11 to 5:26 have been selected (
Figure 8). The point of interest is the time 5:16:36, where we can see the response of the control algorithm to a change (deterioration) in the fuel quality or an increase (above the optimum value) of the fuel amount in the combustion chamber. As a result, the quality of combustion deteriorated, the carbon monoxide emissions (green color) started to increase, and the oxygen concentration (yellow color) in the flue gas started to decrease. The control system responded to this situation by reducing the fuel supply (blue color), which was reflected in the fact that around 5:18, the CO and O
2 values were stabilized again. The fuel supply was not completely interrupted because the combustion process stabilized in a short time.
On the other hand, at about 5:13, there was a sudden deterioration in the quality of the combustion process (a sharp decrease in O2 concentration and a subsequent sharp increase in CO emissions) and even for a longer time period. In this case, the control system responded by completely stopping the fuel supply and restoring it only after the combustion stabilized. A similar case but with a lower intensity of deterioration in the quality of combustion occurred at a time just after 5:21.
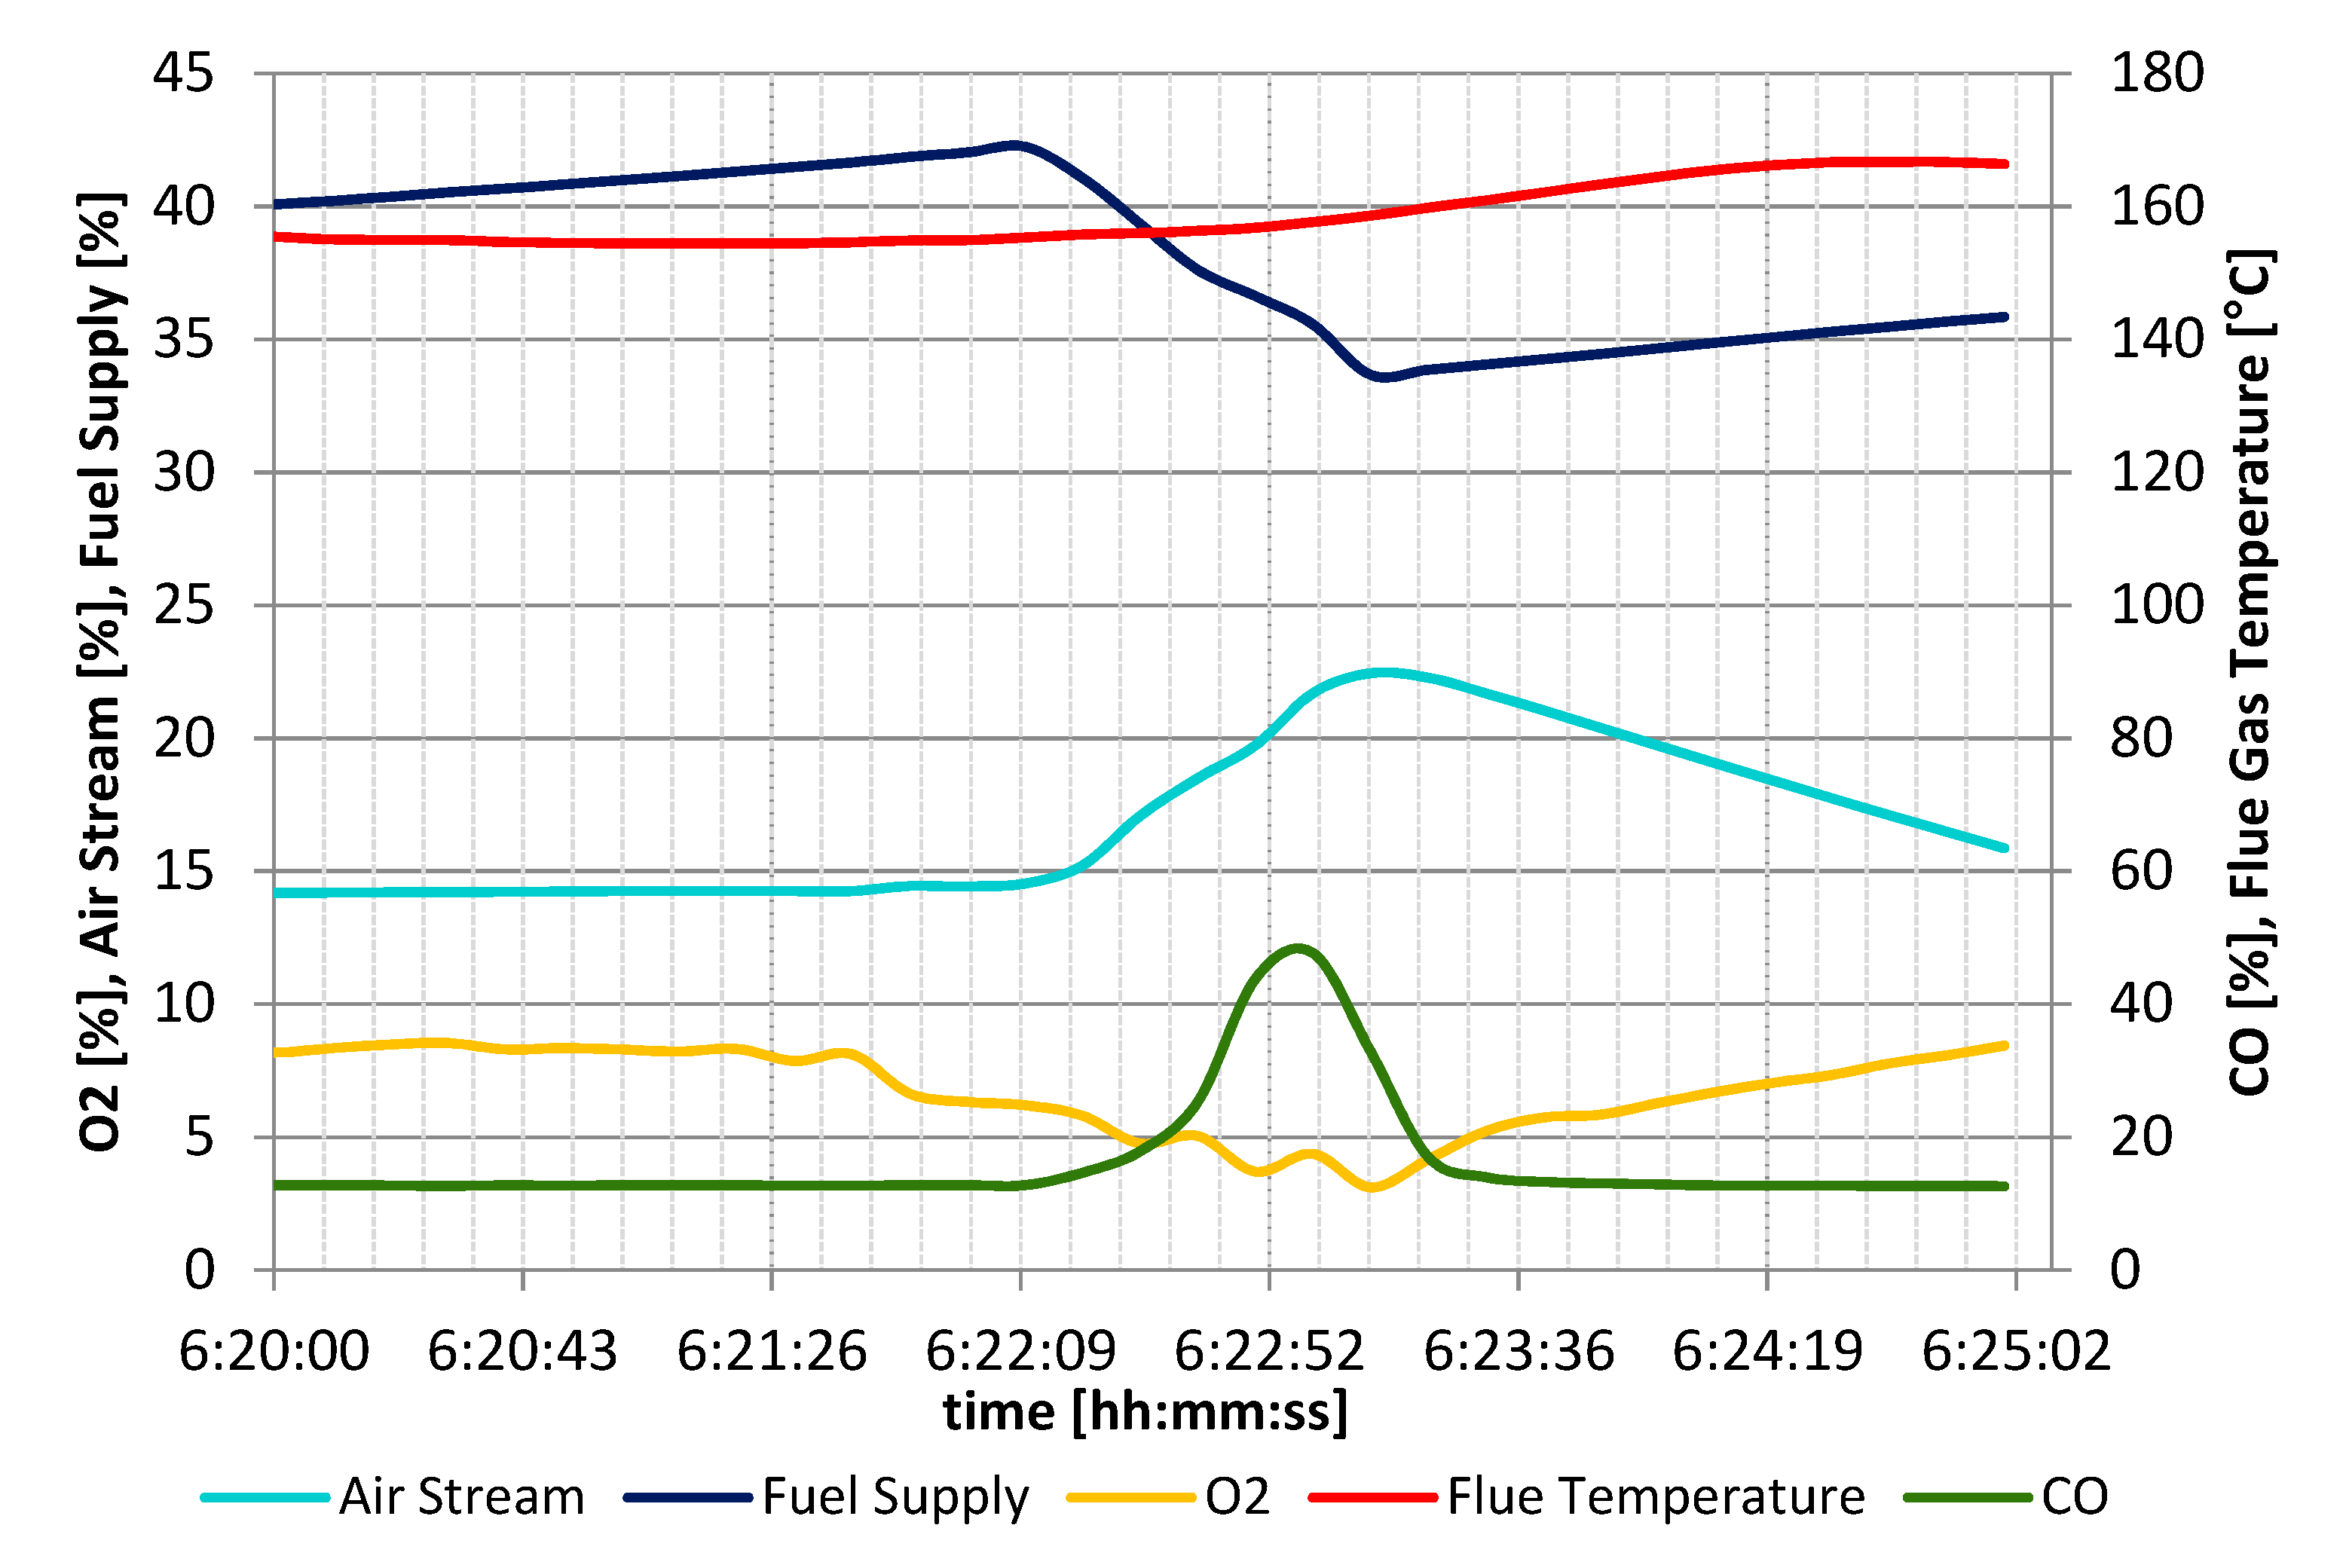
Finally, we analyze in more detail a problem in which the new fuel introduced into the furnace does not fully enter a burning phase at the low oxygen level that is prescribed at the end of a burning phase. This state can be seen in
Figure 9, where the control system due to decreasing the flue gas temperature (red line) continuously has been increasing the fuel supply (blue line). However, due to large amounts of the new fuel in the furnace, the O
2 concentration (yellow line) began to decrease at about 6:21:30, and after that, the control algorithm started to decrease the fuel supply. At about 6:22:00, the CO emissions (green line) began to increase (a smoldering partial combustion produced more CO), and the control algorithm increased the airflow (turquoise line) to get the new material to start burning, and subsequently, the flue gas temperature started to increase. At about 6:23:00, the CO emissions began to decrease, and the control algorithm started to decrease airflow. The trigger level to adding more air was a positive derivative of the CO emissions trend function and to decrease in the air stream its negative derivative. In this way, the burning process was stabilized until about 6:25:00.
5. Conclusions
The article dealt with the possibilities of monitoring and controlling the biomass combustion process in small and medium-scale boilers not only based on the oxygen concentration sensing in the flue gas (as it is currently solved as standard especially in medium-scale wood chips-fired boilers) but also on the trend of carbon monoxide emissions. Their presence in the flue gas results directly from the chemical reactions of combustion, but the level of concentration depends on several factors, such as the wood quality, the combustion chamber construction, the type of boiler, and so on.
The designed and tested control algorithms use information about the trend of CO emissions in the flue gas to continuously evaluate the dependence of these emissions on the O2 concentration. In this way, the proposed and verified control of the biomass combustion process with the aim of keeping the O2 concentration as low as possible (to reach low flue gas energy losses) has successfully ensured an important condition for the quality of the combustion process that CO emissions do not exceed the permitted values for small and medium biomass-fired boilers. This was achieved for these standard parameters of wood chips: moisture content 35–45%, size 35–40 mm. The implemented control system and algorithms have been even able to ensure a required combustion quality of wood chips with a moisture content of up to 50% and for different types of wood: fir, beech, and oak.
Further research works will focus on the implementation of the newest CO sensors [
32] and combination probe [
33] into the biomass combustion process control system and modification of the implemented algorithms, including their testing in the real operation of the wood chips-fired boilers.


 ,
, 

