Abstract
The carbothermic reduction of slag in silicomanganese production is accompanied by the release of carbon monoxide. This gas can accumulate as bubbles within the slag, leading to foaming and, potentially, disturbances to furnace operation. This study investigated the reduction in the slag together with its foaming using a sessile drop furnace. Five silicomanganese slags produced from industrial raw materials (Assmang ore, Comilog ore, high-carbon FeMn slag with quartz, and FeS additions) were reduced by a graphite substrate at isothermal conditions (i.e., 1540–1660 °C) under CO atmosphere. The reduction reaction was tracked by photographing the slag droplet, and the cyclic expansion and burst of the droplet were used to estimate the gas evolution. The reacted samples were analyzed by wavelength-dispersive X-ray spectroscopy (WDS) to determine MnO and SiO2 reduction. While no foaming was observed using Comilog ore, extensive retention of CO in the slag phase was observed when using Assmang ore or Assmang with high-carbon FeMn slag. The beginning of foaming was attributed to an increase in the reaction rate; the absence of foaming when using Comilog can be attributed to the acidity of the charge. Addition of sulfur to the Comilog-based charge did not influence the reduction.
1. Introduction
Silicomanganese (SiMn) is commonly used in steelmaking for its desulphurizing and deoxidizing properties as well as for the contributions of its alloying elements to the properties of steel []. Typical tapped SiMn alloys contain approximately 20 wt.% Si, 70 wt.% Mn, and the remaining mostly iron. The production of silicomanganese is accomplished through the carbothermic reduction of MnO- and SiO2-rich oxides. The raw material charges commonly involve a mixture of Mn ore, ferromanganese slag (as another source of manganese), quartz, and coke. The variability, impoverishment, and shortages of high-quality ores are challenges that the industry will have to face in the future.
Consequently, a great deal of research work has been done in the field of pyrometallurgy to fulfill the dual ambition of clarifying the reaction mechanisms and understanding the role of the raw materials’ composition. Concerning the SiMn production kinetics, non-isothermal experiments have shown that the reduction mechanism is two-staged [,], a slow stage at low temperature being followed by a rapid stage at approximately 1600 °C. A following work with the same setup and materials but isothermal conditions confirmed the existence of a two-staged mechanism. This was observed using various ores and contrasting basicity. There, the slag composition appeared to cause a change in the rate during reduction: upon reaching a specific extent of reduction independent of the temperature, the reaction rate increased []. In some experiments, the slag came out of the crucible, suggesting foaming. This foaming phenomenon could be a cause or a consequence of the reduction rate increase, and this calls for further reduction studies with in situ observations.
It is common to examine slag/carbon interactions using a sessile drop wettability technique since such a setup offers both a good control over the reaction interface as well as in situ pictures of the sample. The technique was also used successfully for ferromanganese slags. The reaction kinetics and mechanism were explained on the basis of the slag droplet’s behavior together with chemical analysis and electron microscopy []. In another study, the droplet volume was used to estimate the reduction extent at different time steps, that is, the concentration of MnO in the slag []. A study on SiO2 reduction from CaO–SiO2–Al2O3–MgO molten slag reduction by a coke substrate imputed the rate increase due to the better wetting of the slag [].
The carbothermic reduction of slags can cause foaming. This presents multiple advantages in steelmaking processes, especially by providing shielding from the atmosphere or for the refractories [] and has been studied to that end in the past. While classical foaming investigations involve gas blowing in a liquid slag contained in a crucible and at steady state [], dynamic studies involve reaction driven foaming, a phenomenon which may be closer to the reality of industrial operation [,]. Hong et al. noticed that increasing S content in the slag inhibited the foaming significantly []. Kapilashrami et al. found that fluctuations in the foam height can be explained by a mismatch between the gas generation rate and the gas exiting rate or by variations in the gas fraction within the slag []. It seems fundamental to have a detailed knowledge of the interfaces at stake, both for the gas generation and the gas exhaust. Thus, the sessile drop technique appears to be a promising route for foaming studies, as the system is observed directly. It was used by Khanna et al. who developed a semi-automated program to compute the droplet volume and thereby record the foaming during reduction experiments [].
The aim of the present study was to observe, characterize, and explain the foaming phenomenon arising during the carbothermic reduction of SiMn slags. Different slag compositions, based on various Mn sources, were investigated in a sessile drop furnace. The intent was to investigate the reduction behaviors of primary SiMn slag from different sources and understand the relationship between foaming, reaction kinetics, and slag composition.
2. Materials and Methods
2.1. Sample Preparation
The present study focused on the chemical and foaming behavior of the slag during reduction in the continuation of a series of works on the kinetics in silicomanganese production [,]. The impact of sulfur was also investigated, as its role is uncertain. Five slag compositions were prepared by pre-reduction and melting of industrial raw materials. These charges, produced from mixtures of Mn-containing materials (Assmang ore, Comilog ore, and HC FeMn slag) and quartz were designed to obtain the same compositions as in an earlier work []. The charge using both Assmang ore and HC FeMn slag, A/HCS, was prepared using a 1:1 ratio of those materials. Note that fluxes, such as CaO, were not added to the charges. This is of importance especially for the Com charge, as Comilog ore and quartz will form very acidic slags in the absence of additional fluxes. Thus, the current work does not speak for the performance of the ore in industrial practice where fluxes are commonplace.
The compositions of the various ores, including trace elements, are detailed in Table 1. The slag composition was obtained by X-ray fluorescence, and the MnO2 content was obtained by titration. Two Comilog-based charges were enriched in sulfur using a single or double dose of FeS powder aiming for 0.27 and 0.56 wt.% sulfur content in the slag.

Table 1.
Chemical composition (wt.%) of the raw materials.
Each charge was heated up to 500 °C under Ar gas. Subsequently, a stream of CO replaced Ar, while the temperature was increased up to 1200 °C. The samples were held at this temperature for 30 min to ensure full pre-reduction of the higher manganese oxides and then brought to 1400 °C to ensure complete melting. The charges were next cooled down to room temperature and shattered into smaller pieces. The compositions of the pre-reduced slag samples were analyzed by wavelength-dispersive X-ray spectroscopy (WDS) and are reported in Table 2.
Table 2.
Normalized composition (wt.%) of the slag samples after pre-reduction.
Part of the slag samples were crushed using a vibratory disc mill (Retsch RS 200; 700 rpm, 15 s) and further analyzed for sulfur content using infrared detection after combustion of the samples (LECO CS844). The results are given in Table 3. It was seen that the Com slag had the lowest sulfur content among the non-enriched slags, followed by the Asm and A/HCS. Com + S and Com + 2S slags had a sulfur content comparable to that of Asm.
Table 3.
Sulfur content in the slag samples after pre-reduction and melting.
The addition of sulfur was successful: the quantities evidenced in the sulfur-enriched slags were much higher than for the “Com” sample, but doubling the FeS dosage led to diminishing returns. This could be due to the volatilization of the sulfur to SO2 gas.
2.2. Isothermal Reduction
The already pre-reduced slag samples were further reduced in a sessile drop furnace. A schematic of the furnace setup is provided in Figure 1. A piece of slag (⌀ ≈ 4 mm) was first placed on a graphite substrate disc (⌀ = 10 mm), itself resting on a graphite arm. The furnace was then evacuated and filled with CO gas. Next, it was heated up quickly to the targeted temperature plateau while maintaining a flow of CO of 0.1 Nl/min. The heating was completed in 3 min up to 900 °C, then 5 min to 1200 °C. The temperature increase to the isothermal stage was conducted at 1 °C/s. These high heating rates were possible since the pre-reduction of the slag was completed previously; extensive gas release from this stage was therefore avoided. The temperature was acquired by a C-type thermocouple. To ensure a proper temperature measurement and control, the thermocouple was calibrated before the reduction experiments by melting an iron flake in CO atmosphere.
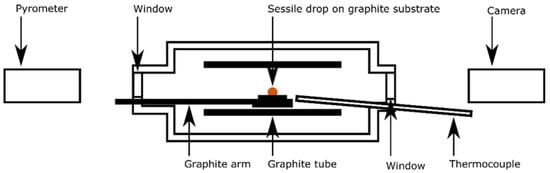
Figure 1.
Schematics of the sessile drop furnace.
In total, 25 isothermal reduction experiments were carried out with various slag compositions, holding temperatures, and durations. The experimental parameters are summarized in Table 4. The temperature and duration were chosen to investigate the specific moment of the reaction and to compare the results with previous work [].
Table 4.
Parameters for the experiments of the study.
2.3. Picture Analysis
A Basler acA1280-60gc camera was used to record pictures at 1024 × 1280 pixels of the slag during heating, melting, and reduction. The pictures were taken at 5 fps during the isothermal stage and 1 fps otherwise and evidenced the entrapment of CO gas from the reduction reactions given in Equations (1) and (2):
MnO + C = Mn + CO(g)
SiO2 + 2C = Si + 2CO(g)
The pictures were next processed with a program using contrast-based edge detection. This program identified the graphite/atmosphere interface based on brightness and enclosed the droplet in a rectangle as shown schematically in Figure 2. A safety gap between the graphite/atmosphere interface and the detection box was set manually before analysis by the software. This ensured proper detection of the droplet and avoided errors due to the fact of smaller droplets misleading the contrast detection.
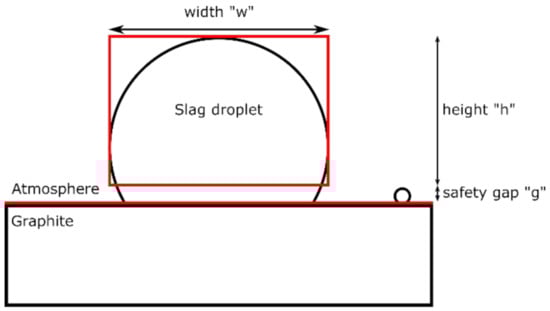
Figure 2.
Schematics of the edge and droplet detection. The features in red correspond to the software’s output.
The recorded values of height, width, and gap provided by the software were used to calculate the dimensions of the droplet for each picture, assuming a perfectly spherical shape by using equations for spherical caps. First, the radius “r” of the sphere was obtained from the width and height using Equation (3) when the slag was wetting or Equation (4) for a non-wetting slag. This radius can be determined independently of the gap used.
Next, the volume “Vsg” (for slag+gas) can be calculated considering a spherical cap of radius “r” and, using “hr”, the real height of the cap which includes the safety gap, following Equations (5) and (6). The initial volume “V0” was defined for each experiment as the volume of the slag droplet directly after melting.
When the slag retracts after a gas bubble escapes, the volume of gas in the slag decreases. This can be used to estimate the volume of gas-free slag “Vs”. Thus, it was considered that this volume is at time “t” necessarily equal or smaller than the minimum volume recorded from the start to time “t”. However, this estimation cannot distinguish between volume loss due to the escaping gas and slag being expelled out of the droplet.
2.4. Sample Analysis
The reacted samples were cast in epoxy, cut, and mounted in epoxy once more to obtain cross-sectional images of the slag/graphite interface. After polishing and carbon coating, the samples were examined by an electron microprobe (EPMA; JEOL; JXA-8500F) equipped with a wavelength-dispersive X-ray spectroscope using 15 kV acceleration voltage and a 20 nA beam current.
3. Results and Discussion
This section aggregates and discusses the results from the chemical analysis, from the microscopic study, and from the picture analysis during the reduction reaction.
3.1. Slag Reduction (Chemical Analysis)
The reduction was calculated based on the chemical composition of the slag measured by WDS. The composition of the slag was considered as being the best approach to evaluating the reduction as opposed to the metal analysis. The analysis of the metal is quite unreliable due to the presence of various amounts of metallic iron, disparities in the metal droplet composition in a single sample, and evaporation of produced metal.
Pre-reduced slag samples were used as a reference to evaluate the advancement of the reduction process. In these multiphase samples, both phases were analyzed separately and used further together with pixel counting to determine the total composition following a strategy explained elsewhere []. The reduced slag samples analyzed in three points across the droplet appeared to be homogeneous macroscopically. Table 5 summarizes the averaged results from WDS for all the samples in the study. The fractions of reduced MnO and SiO2, calculated based on the reference sample’s chemistry for each charge, are also given in the table. For these calculations, it was assumed that Al2O3, CaO, and MgO remain unaffected. In practice, it was considered that the mass of Al2O3 + CaO + MgO was constant over the course of the experiments. Note that the results are highly sensitive to the composition of the reference samples. As a result, due to the variations in the composition and inaccuracies in the measurements, negative values were obtained for the reduction of SiO2 in some samples. These values, physically impossible, denote however a low to inexistent reduction in SiO2 and were further treated as being zero. In addition, positive values should also be interpreted with care for the same reasons. The last column of the table provides the Mn/Si ratio in the metal, assuming all metallic atoms end in a single metal phase as well as no evaporation.
Table 5.
Slag composition obtained by WDS, calculated the fraction of MnO and SiO2 reduced and calculated the composition of the metal phase. The sum of all oxides was normalized to 100 wt.%.
Overall, these results show that MnO and SiO2 were significantly reduced from the Asm and A/HCS charges and reached comparable degrees of reduction than in industrial practice for both oxides. This is consistent with a previous study from the authors using the same charge in another setup together with polish coke []. It was apparent that the reduction in MnO began earlier than that of SiO2. This was particularly true for the Asm and the A/HCS charges, containing high-carbon FeMn slag, the latter also being reduced much faster than the former.
For the various Com charges (Com, Com + S, and Com + 2S), a significant reduction in MnO was achieved, but a modest reduction in SiO2 was observed. In addition, from the data presented in Table 5, the reduction in SiO2 from the Com charge seemed to exhibit a somewhat erratic behavior which was left unexplained.
In addition, sulfur seemed to have a slightly positive effect on the manganese extraction rate. This was observed in the Comilog containing samples with and without sulfur, reduced at 1610 °C for 60 min. Sulfur, however, failed to significantly affect the SiO2 reduction.
The fractions of reduced MnO and SiO2 are provided in Figure 3 for (in red, orange, and yellow) all samples of the study and for (in blue tones) the converted results from a previous work of the authors []. When the fraction of reduced SiO2 was found negative, it was set to zero on the graphs. These results show once more that MnO reduced at early stages, the reduction of SiO2 being intimately linked to MnO having been reduced. This also appears to be consistent with earlier results; the colored markers seemed to follow the same trend, despite being associated with different setups and carbon sources. No changes were observed with temperature either.
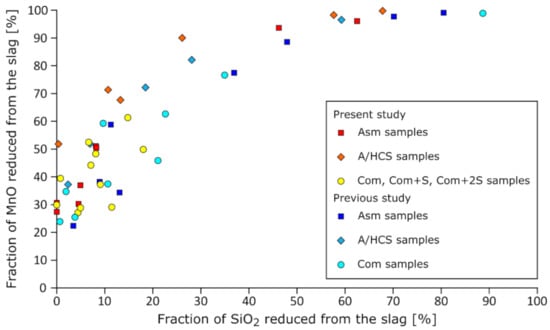
Figure 3.
Fraction of MnO and SiO2 reduced from SiMn slags. The original data from the present study were colored in cold tones, while the warm colored markers show data from previous work []. The data ranged from 1510 to 1660 °C.
Figure 4, Figure 5 and Figure 6 give the wt.% MnO and wt.% SiO2 measured in the slag as a function of the duration of the isothermal stage and the temperature. These results were obtained after normalization of the measurements of Al2O3, CaO, MgO, MnO, and SiO2. The dashed lines indicate the expected composition of reacted slags when 18 wt.% Si was found in the produced metal and 10 wt.% MnO was left in the slag. Despite the reduction in some SiO2 from the slag, the weight fraction of SiO2 increased due to the fact of an even larger reduction in MnO. Thus, the fractions of SiO2 of the slags in this study oftentimes overreached the dashed line threshold; they are expected to decline with further reaction. It appeared that increases in temperatures increased the reduction rate for the Asm charge and, to a large extent, for A/HCS charge. This phenomenon was not observed for the Com charge, where no significant rate increase was observed going from 1610 to 1660 °C.
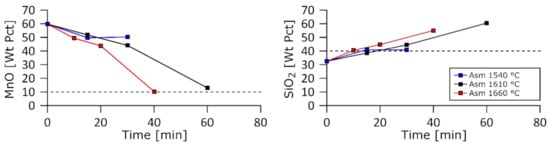
Figure 4.
MnO and SiO2 weight fractions in the slag as a function of time for the Asm charge at 1540, 1610, and 1660 °C.
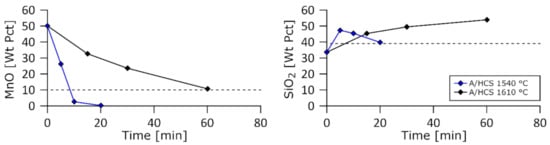
Figure 5.
MnO and SiO2 weight fractions in the slag as a function of time for the A/HCS charge at 1540 and 1610 °C.
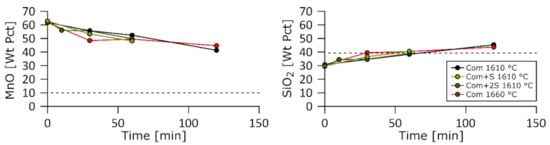
Figure 6.
MnO and SiO2 weight fractions in the slag as a function of time for the Com, Com + S, and Com + 2S charges at 1610 and 1660 °C.
3.2. Slag Reduction Pictures
The microscopic study was based on cross-sections of the reacted samples including the graphite substrate. A metal phase was not systematically unveiled, as the slag frequently covers or englobes the metal and hides it before the cut. Cut views of reacted samples are provided, sometimes together with close-up views of the interface. It should be noted that the samples from the same charge materials mostly shared a similar aspect. They followed the same trends in terms of reduction behavior, wetting, and reaction interface. In addition, while there was a clear contrast after reduction between the samples from different charges, it seemed that temperature had a lesser role in the mechanism. In the following pictures and for clarity the main elements were delimited using the following colored lines: green for the slag, red for the graphite, and blue for the metal.
3.2.1. Asm and A/HCS Charges
Figure 7a,b respectively show the cut view of an Asm slag droplet and a close-up view of the slag/graphite interface after reaction at 1540 °C for 15 min. A large gas bubble is seen at the center of the slag droplet on Figure 7a, with a second one visibly forming from the center of the slag/graphite interface. Along the whole slag/graphite interface many micron-sized metal particles were found. These particles penetrate into the graphite but only in a thin porous layer as shown on Figure 7b. The picture in Figure 7b also shows that two phases were visible: the slag has, under cooling, precipitated in a eutectic fashion. These two phases were only observed after cooling, as the droplet was expected to be fully molten from the start to the end of the reduction. The graphite substrate was also significantly affected by the reaction. Although it did not seem to be altered deep from the interface, the slag/graphite contact area itself moved during the reaction due to the consumption of carbon. The initial flat surface was thus replaced by a bumpy front.
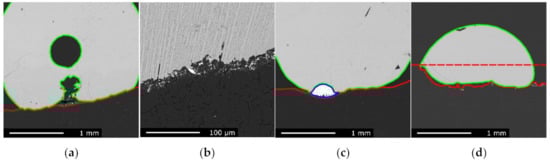
Figure 7.
EPMA images of the reacted Asm slag sample, graphite substrate, and metal phase, respectively, contoured by green, red, and blue lines: (a) sample reacted at 1540 °C for 15 min; (b) slag/graphite interface of the sample reacted at 1610 °C for 15 min; (c) sample reacted at 1610 °C for 15 min; (d) sample reacted at 1660 °C for 40 min. The red, dashed line is an estimate of the initial substrate’s surface.
Samples reacted longer and at higher temperatures showed similarities but also some additional features. Figure 7c shows the slag droplet of the Asm charge after reaction at 1610 °C for 15 min. The main difference observed was the presence of sizeable metal droplet found between the slag and the graphite substrate. This metal droplet was not necessarily a mark of a substantially stronger reduction: the metal phase was sometimes hidden or mostly containing iron obtained during pre-reduction. However, this metal droplet sits in a distinctly deeper hollow of the graphite substrate which could be explained by graphite being consumed through dissolution in the metal phase and consumption by carbothermic reduction at the slag/metal contact area. In other words, carbon could be reacting faster by going through the metal than directly acting on the slag.
Figure 7d shows the slag droplet of the Asm charge after reaction at 1660 °C for 40 min. This sample witnessed stronger reducing conditions for a longer time, and although it did not appear on the micrograph, two large metal phases were observed aside this sample and can be seen in Figure 8. The graphite substrate was also considerably consumed. The red, dashed line in Figure 7d shows the approximate position of the initial substrate’s surface, approximately 500 µm away from its final position. The slag also exhibited an increased wetting, compared to the previous samples; this was attributed to changes in the slag chemical composition during its reduction. Gas pockets could be found between the slag and the substrate.
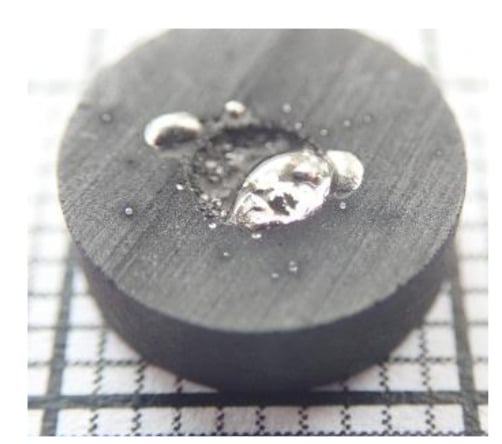
Figure 8.
Picture of the Asm sample reacted at 1660 °C for 40 min.
Figure 9a,b show the slag droplet of the A/HCS charge after reaction at 1540 °C for 30 min and 1610 °C for 10 min, respectively. These pictures tell a similar story to what was observed for the Asm sample: good wetting of the sample, significant consumption of the graphite, and mild penetration in the substrate.
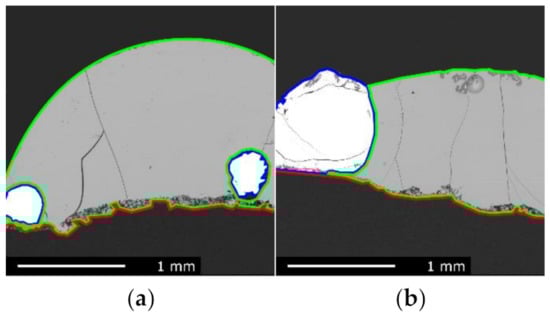
Figure 9.
EPMA images of the reacted A/HCS slag sample, graphite substrate, and metal phase, respectively, contoured by green, red, and blue lines: (a) sample reacted at 1540 °C for 30 min; (b) sample reacted at 1610 °C for 10 min.
3.2.2. Com, Com + S, and Com + 2S Charges
Figure 10a shows the slag droplet of the Com charge after reaction at 1610 °C for 30 min. The Com charge was characterized by a poor wetting over the graphite substrate at all stages of the reduction experiment, and the slag droplet was therefore nearly spherical. In addition, the substrate was left mostly unaffected, and although some metal particles were observed within a thin layer, the graphite was not consumed and remained even. From Figure 10a, one can consider that the droplet was initially placed towards the right-hand side, where some metallic prills were found but later moved to the left. The other micrographs gave a similar impression: little reaction happened between slag and graphite, and no substantial metal phase was found. Note that the droplet presented in Figure 10a seems to consist of two distinct domains, noticeable by their shade of grey. In fact, a higher magnification picture in Figure 10b reveals that this change of grey shade corresponded to the transition between dendrite growing from the bottom of the sample and glassy slag on the top. The WDS analyses did not evidence a composition difference between those two domains.
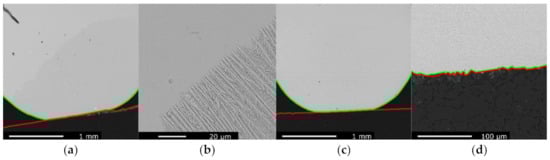
Figure 10.
EPMA images of the reacted slag sample and graphite substrate, respectively, contoured by green and red lines: (a) Com sample reacted at 1610 °C for 30 min; (b) close-up of the interface on the Com sample reacted at 1610 °C for 30 min; (c) Com + S sample reacted at 1610 °C for 10 min; (d) slag/graphite interface of the Com + S sample reacted at 1610 °C for 10 min.
When sulfur was added to the Com charge, in Com + S and Com + 2S, no significant differences could be observed. The slag droplet of the Com + S charge after reaction at 1610 °C for 10 min and a closer view of its slag/graphite interface are given in Figure 10c,d, respectively. Two phases can be noticed in Figure 10d, those were formed during solidification alike what was observed in Figure 7b. The addition of sulfur did not affect the wetting as both the Com + S and Com + 2S charges were non-wetting. It also did not enhance reduction processes at the slag/graphite interface; the graphite was not consumed, and only limited amounts of micron-sized metallic particles were found. Note that neither the Com + S nor Com + 2S samples reacted at 1610 °C for 30 min were used to compare with Figure 10a, as both sample droplets rolled from the substrate due to the fact of their non-wetting behavior.
The chemical analysis previously indicated a reduction in MnO and SiO2. However, the absence of a metallic phase as well as the intact graphite substrate surface indicate the manganese was likely reduced by CO(g) and vaporized. This conclusion was motivated by the high vapor pressure of manganese. Silicon evaporation, however, is thermodynamically less likely but silicon might have been extracted as SiO(g). Again, since the graphite remained unaffected, this would rely on SiO2 being reduced by the reaction in Equation (7) happening on the free surface of the slag at temperatures around 1600 °C. This was ruled as being thermodynamically unlikely by Berg and Olsen who considered this mechanism in a similar context [].
SiO2 + CO(g) = SiO(g) + 2CO2(g)
3.2.3. Entrapped Gas and Foaming
The amount of gas entrapped within the slag was calculated using Equations (3)–(6). Figure 11 show Vsg/V0, the calculated volume of slag and gas divided by the initial volume as well as Vs/V0, the estimated volume of gas-free slag divided by the initial volume. On a second axis, the volume increases in the droplet were summed to render the progress of the chemical reactions generating CO gas within the slag. This last curve cannot be used for quantitative evaluation of the reaction but can indicate a change in mechanism, for example, when displaying a break in its slope. The graphs corresponding to the remaining samples of this study are found in Supplementary Materials Figures S1–S22 (refer to the electronic supplementary material). From all these curves, foaming can also be evidenced. Extensive and stable accumulation of gas was detected when the droplet volume Vsg was continuously higher than the estimated slag volume, even when some gas was liberated. This indicates that the gas bubbles were generated faster than they were liberated, creating a build-up. In this section, a few experiments were chosen to show the general trends of the various charges, while the other curves obtained are made available in the Supplementary Materials.
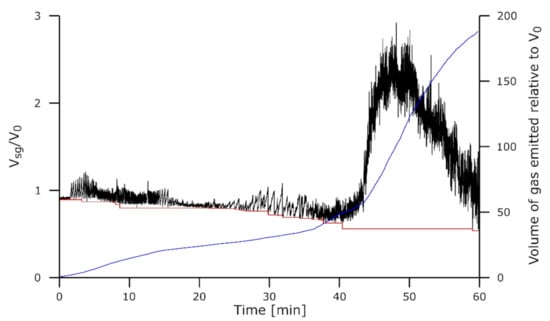
Figure 11.
Droplet dimensions for the experiment Asm-1610-60. Volume of the slag + gas Vsg/V0 is in black, the volume of slag Vs/V0 is in red, and the volume of the gas emitted relative to V0 is in blue.
Figure 11 shows the results for the Assmang charge reduced for 60 min at 1610 °C, while the aspect of the droplets is shown in Figure 12. At the start of the reduction with this sample, single gas bubbles were formed as illustrated on Figure 12a. Upon their escape, all the gas was released into the atmosphere in one step. This can be seen from the shape of the curve of Vsg/V0, where decreasing, Vsg/V0 tended to reach a new minimum and there was thus less material and likely little to no gas in the droplet. After extensive reduction, some experiments entered in a new regime where foaming was observed; despite a continuous flickering in the droplet volume due to the regular escape of some gas, the moving average volume greatly increased, reached a peak, and then slowly decreased. In Figure 12b, the inflated slag can be observed at this stage. Note that the gas-free slag volume was calculated from the emerged part of the droplet. However, as seen on the micrographs in Figure 7, the underlying graphite layer was vastly consumed by the reaction.

Figure 12.
Behavior of the Asm-1610-60 slag droplet upon reduction (a) in the slow stage before 40 min and (b) in the rapid stage after 40 min.
The foaming seems to be accompanied by a change in the reduction rate as observed on the blue curve. This resembles what was observed in a similar experiment in a previous work []. It seems that the rate change preceded the foaming and could be one of its causes.
The A/HCS charge reduced 20 min at 1610 °C and shown on Figure 13 also exhibited foaming but right after the start of the isothermal stage. Under these conditions, the reactions generating CO within the slag did not need additional time or reduction to start. A rapid increase in the droplet volume can be observed before the foaming dissipates after only a couple of minutes. This is once again consistent with observations in tube furnace experiments [].
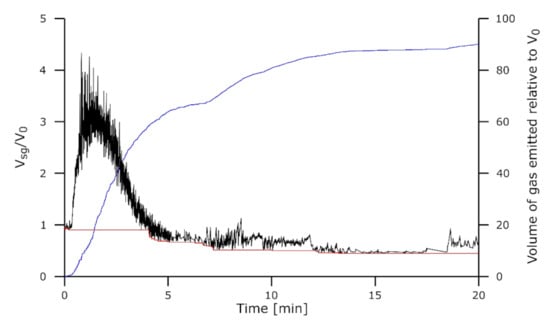
Figure 13.
Droplet dimensions for the experiment A/HCS-1610-20. Volume of the slag + gas Vsg/V0 is in black, volume of the slag Vs/V0 is in red, and the volume of the gas emitted relative to V0 is in blue.
The Comilog charge, however, did not exhibit the same behavior. No gas was released from the slag as observed in Figure 14 for the Com charge reduced 120 min at 1610 °C. The volume measured did not change enough to be related to gas accumulation; the fast variations in the measured droplet size could be caused by the software itself. The volume change being very limited, its summation was also irrelevant.
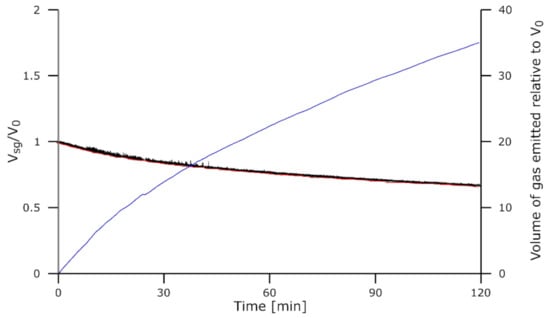
Figure 14.
Droplet dimensions for the experiment Com-1610-120. Volume of the slag + gas Vsg/V0 is in black, the volume of the slag Vs/V0 is in red, and the volume of the gas emitted relative to V0 is in blue.
In essence, all Com, Com + S, and Com + 2S samples showed no gas accumulation/release from the slag at all temperatures and for all durations. However, the slag droplets did appear to shrink over time, which could be related to the loss of manganese through evaporation previously reported by WDS.
3.2.4. Wetting
The wetting angle θ was calculated based on the droplet dimensions, assuming a perfectly spherical shape, using Equation (8). The errors due to the consumption of graphite were neglected in these calculations. Some values were not registered due to the failed analysis of the picture from the software.
Figure 15 shows the wetting angle calculated for the 5 charges reacted at 1610 °C. For Com, Com + S, and Com + 2S, the wetting angle was nearly constant at 134, 136, and 137°, respectively, (on average from 5 to 60 min) showing that the addition of sulfur or the manganese evaporation did not affect the wetting. The Asm and A/HCS samples, which reacted significantly with the substrate, also showed changes in their wetting angle throughout the reaction. For the rapidly reacting A/HCS-1610-20 sample, the wetting angle changed correspondingly and dropped significantly early in the reaction. The Asm sample showed various phases over the course of the experiment. The wetting angle first increased to a stable value of 133° (on average from 10 to 20 min); the slag was not wetting the substrate. The angle strongly decreased after 20 min, upon further progress of the reaction.
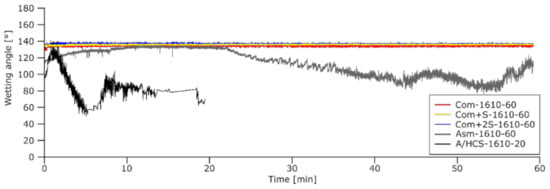
Figure 15.
Wetting angle for each charge type of the study upon reaction at 1610 °C.
These results show that the poor wetting of the Com, Com + S, and Com + 2S samples do not explain the lower extent of the reduction observed compared to the results of the tube furnace experiments. The Asm and Com samples had similar wetting angles between 10 and 20 min and, thus, similar slag/graphite interface areas. If the reaction was happening at this slag/graphite interface, consumption of the substrate would have been observed for the Com samples.
3.2.5. Further Discussion
The results obtained in this work were two-fold: they evidence a contrast between the various slags but also show the disagreements between the techniques. The sessile drop technique tended to agree to what was obtained in a tube furnace for some samples (mostly the Asm and A/HCS charges) but disagreed for the Com charge.
Figure 16 shows the fractions of reduced MnO and SiO2 for similar experiments run in a tube furnace and sessile drop furnace. For the Asm and A/HCS charges, the results were very close, excepted for the SiO2 reduction in Asm-1610-60. In comparison, the results for the Com charge were consistently discordant. This affected both MnO and SiO2 reduction estimates.
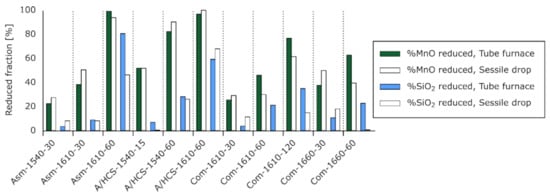
Figure 16.
Fractions of MnO and SiO2 reduced for similar experiments using a tube furnace (data adapted from Canaguier et al. []) and a sessile drop (present work).
This indicates that there was a fundamental difference between the experiments in graphite crucible and on graphite substrate. Firstly, in the graphite crucible, additional polish coke was used therefore modifying the nature of the reductant. Secondly, the experiments differed due to the presence of iron-rich metallic phases formed during the pre-reduction of the charge in the graphite crucibles. Those are believed to have a significant role in the reduction through the thermodynamic conditions and the reaction mechanism. The first point is discussed by Coetsee [], who studied the reduction in MnO by CO(g) at temperatures as low as 1200 °C. The presence of metallic iron reduces the activity of manganese, thereby promoting MnO reduction dramatically. Concerning the effect of metallic droplets on the reaction mechanism, Safarian et al. considered that the reduction in MnO by a metallothermic reaction involving Fe is a possible process in FeMn production []. Iron-rich droplets, placed in contact with both the slag and the carbon source, are thought to act as a rapid pathway to dissolve carbon while iron is believed to reduce MnO. In the present study, those iron-rich metallic particles were mostly absent. The slag charges were melted and pre-reduced beforehand to avoid that the gases emitted during pre-reduction inhibit our capacity to track the reduction processes. After formation of the slag charges, small pieces of the slag were selected; at this stage, the visible metal droplets were avoided. This was necessary to observe slag/graphite reactions without large amounts of metal present but might have inhibited the initiation of the reaction by removing the usually present metallic droplets. This could further explain the larger variability in the present study; unseen metallic droplets remaining in small samples might have a large effect. In their study on the reduction of siliceous manganese ores by graphite, Ostrovski and Webb showed that diffusion of MnO is a rate limiting process, even in molten phases []. But in the present case, at high temperatures, it did not seem that diffusion can explain the contrast between the techniques; the samples reacted in the sessile drop setup were very limited in size, a few mm3, compared to the cm3 size of the slag in the tube furnace. Diffusion, albeit a potentially important factor, is expected to favor a quicker reduction in the samples in the sessile drop furnace contra those in the tube furnace. This is not what was generally observed.
The previous and present works both showed that for all charges, a similar reduction route was observed. MnO tended to reduce first, while most of the SiO2 reduced afterwards. This can be partly explained by looking at the evolution of the activities in the slag at equilibrium for increasing amounts of carbon in the system. Figure 17 shows such activities for a starting arbitrary slag of 50MnO–34SiO2–10CaO–5Al2O3–1MgO and increasing carbon additions at 1650 °C. The calculations were performed using FactSage 8.0 [] with the FactPS, FToxid (for the slag), and FSstel (for the metal) databases.
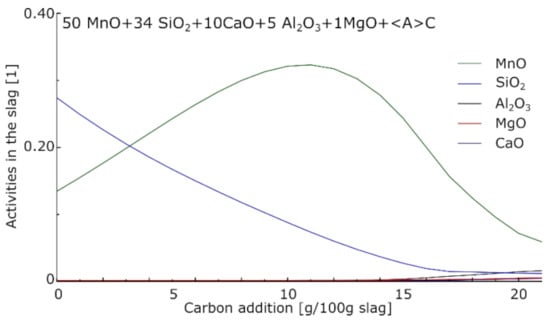
Figure 17.
Evolution of the activities in a silicomanganese slag at 1650 °C with the addition of carbon. Calculated using FactSage 8.0 [].
During the reduction processes, the activity of MnO started at its maximum value, decreasing during the production of metallic Mn. The activity of SiO2 first increased due to the decreasing amounts of MnO in the slag; SiO2 reduction became dominating at a later stage, resulting in the decrease of SiO2 activity later on. The kinetics of the reaction themselves also had a role, and deviation from the equilibrium was observed by Canaguier et al. [].
A two-stage reduction, observed in the first study, could be found in some of the charges reduced in the sessile drop setup. The Asm charge was one of those; its reduction was slow and steady at first but accelerated the second time. The increased CO generation caused the foaming of the slag. The A/HCS charge had peculiar behavior. At low temperatures, no foaming was observed despite an active reaction. But at high temperatures, the reduction behavior resembled that of the Asm charge at its second stage; a high reaction rate and foaming were found. For the Com charge, the results of the previous and present work were contrasting; the two-stage reaction observed in the tube furnace was not obtained in the sessile drop. This could be attributed to a better reaction with coke than with graphite but not to the sulfur present in the coke; slags with additional sulfur failed to enhance the reaction.
The fact that the most reduced sample from both studies was obtained using the Com charge, despite it being very acidic, shows the potential of the Comilog ore. However, it also reinforced the contrast between the behavior in the two setups used.
Overall, these results call for further experiments using Comilog ore and various carbon types to better understand why graphite and coke gave so different results. Additional work using Comilog ore together with HC FeMn slag or doped with CaO, with a similar basicity to the Asm and A/HCS charges, could also be beneficial to compare the ores in an industrial configuration.
4. Conclusions
Five charges prepared from various Mn sources together with quartz and sulfur additions were investigated in this work. Reduction, slag/graphite interactions, and wetting were observed and discussed. The following main conclusions can be drawn:
- Extensive carbothermic reduction was observed when using the Asm and A/HCS charges on graphite, but none could be observed in the Com-based charges. The Com charges, with and without sulfur additions, exhibited losses of manganese evaporated to the atmosphere;
- The addition of sulfur to the Com charge did not affect its behavior significantly under the conditions of the study. Sulfur seems not to be the missing link to explain a favorable reduction in the Asm compared to the Com charges in the setup of the study. Similar conclusions can be drawn for wettability;
- The kinetics of the reduction reaction were favored by temperature increases. Overall, the A/HCS reduced faster than the Asm charge. In addition, MnO was reduced earlier than SiO2;
- With the Asm and A/HCS charges, foaming was frequently observed. It appeared to be the result of too large quantities of gas generated relative to the amount the slag can cope with, as the increased gas generation seemed to precede the foaming and not the opposite.
Supplementary Materials
The following are available online at https://www.mdpi.com/article/10.3390/pr9112020/s1, Figure S1: Result curves for experiment Asm-1540-15; Figure S2: Result curves for experiment Asm-1540-30; Figure S3: Result curves for experiment Asm-1610-15; Figure S4: Result curves for experiment Asm-1610-30; Figure S5: Result curves for experiment Asm-1660-10; Figure S6: Result curves for experiment Asm-1660-20; Figure S7: Result curves for experiment Asm-1660-40; Figure S8: Result curves for experiment A/HCS-1540-15; Figure S9: Result curves for experiment A/HCS-1540-30; Figure S10: Result curves for experiment A/HCS-1540-60; Figure S11: Result curves for experiment A/HCS-1610-5; Figure S12: Result curves for experiment A/HCS-1610-10; Figure S13: Result curves for experiment Com-1610-30; Figure S14: Result curves for experiment Com-1610-60; Figure S15: Result curves for experiment Com-1660-30; Figure S16: Result curves for experiment Com-1660-60; Figure S17: Result curves for experiment Com-1660-120; Figure S18: Result curves for experiment Com + S-1610-10; Figure S19: Result curves for experiment Com + S-1610-30; Figure S20: Result curves for experiment Com + S-1610-60; Figure S21: Result curves for experiment Com + 2S-1610-30; Figure S22: Result curves for experiment Com + 2S-1610-60.
Author Contributions
Conceptualization, V.C. and M.T.; methodology, V.C.; validation, V.C.; formal analysis, V.C.; investigation, V.C.; resources, M.T.; data curation, V.C.; writing—original draft preparation, V.C.; writing—review and editing, M.T.; visualization, V.C.; supervision, M.T.; project administration, M.T. All authors have read and agreed to the published version of the manuscript.
Funding
This research was funded by SFI Metal Production, grant number 237738. The APC was funded by the Norwegian University of Science and Technology.
Institutional Review Board Statement
Not applicable.
Informed Consent Statement
Not applicable.
Data Availability Statement
The data presented in this study are available on request from the corresponding author.
Acknowledgments
This publication was funded by the SFI Metal Production (Centre for Research-based Innovation, 237738). The authors gratefully acknowledge the financial support from the Research Council of Norway and the partners of the SFI Metal Production. SINTEF Industry is acknowledged for granting access to their equipment and software.
Conflicts of Interest
The authors declare no conflict of interest.
References
- Olsen, S.E.; Tangstad, M.; Lindstad, T. Production of Manganese Ferroalloys; Tapir Akademisk Forlag: Trondheim, Norway, 2007; pp. 13–18. [Google Scholar]
- Kim, P.P. Reduction Rates of SiMn Slags from Various Raw Materials. Ph.D. Thesis, Norwegian University of Science and Technology, Trondheim, Norway, 2018. [Google Scholar]
- Kim, P.P.; Tangstad, M. Kinetic Investigations of SiMn Slags from Different Mn Sources. Metall. Mater. Trans. B 2018, 49, 1185–1196. [Google Scholar] [CrossRef] [Green Version]
- Canaguier, V.; Tangstad, M. Kinetics of Slag Reduction in Silicomanganese Production. Metall. Mater. Trans. B 2020, 51, 953–962. [Google Scholar] [CrossRef] [Green Version]
- Safarian, J.; Kolbeinsen, L.; Tangstad, M.; Tranell, G. Kinetics and Mechanism of the Simultaneous Carbothermic Reduction of FeO and MnO from High-Carbon Ferromanganese Slag. Metall. Mater. Trans. B 2009, 40, 929–939. [Google Scholar] [CrossRef] [Green Version]
- Safarian, J.; Kolbeinsen, L. Microscopic Study of Carbon Surfaces Interacting with High Carbon Ferromanganese Slag. Metall. Mater. Trans. B 2015, 46, 125–134. [Google Scholar] [CrossRef] [Green Version]
- Oh, J.S.; Lee, J. Composition-dependent reactive wetting of molten slag on coke substrates. J. Mater. Sci. 2016, 51, 1813–1819. [Google Scholar] [CrossRef]
- Ito, K.; Fruehan, R.J. Study on the foaming of CaO-SiO2-FeO slags: Part I. Foaming parameters and experimental results. Metall. Trans. B 1989, 20, 509–514. [Google Scholar] [CrossRef]
- Hong, L.; Hirasawa, M.; Sano, M. Behavior of Slag Foaming with Reduction of Iron Oxide in Molten Slags by Graphite. ISIJ Int. 1998, 38, 1339–1345. [Google Scholar] [CrossRef] [Green Version]
- Kapilashrami, A.; Lahiri, A.K.; Görnerup, M.; Seetharaman, S. The Fluctuations in Slag Foam Under Dynamic Conditions. Metall. Mater. Trans. B 2006, 37, 145–148. [Google Scholar] [CrossRef]
- Khanna, R.; Rahman, M.; Leow, R.; Sahajwalla, V. Novel Sessile Drop Software for Quantitative Estimation of Slag Foaming in Carbon/Slag Interactions. Metall. Mater. Trans. B 2007, 38, 719–723. [Google Scholar] [CrossRef]
- Berg, K.; Olsen, S.E. Report STF24 A04531; SINTEF: Trondheim, Norway, 2004. [Google Scholar]
- Coetsee, T. The Role of Metallic Iron in Low Temperature Carbothermic Reduction of MnO: Phase Chemistry and Thermodynamic Analysis. Minerals 2021, 11, 1205. [Google Scholar] [CrossRef]
- Ostovski, O.I.; Webb, T.J.M. Reduction of siliceous manganese ore by graphite. ISIJ Int. 1995, 35, 1331–1339. [Google Scholar] [CrossRef] [Green Version]
- Bale, C.W.; Bélisle, E.; Chartrand, P.; Decterov, S.A.; Eriksson, G.; Gheribi, A.E.; Hack, K.; Jung, I.H.; Kang, Y.B.; Melançon, J.; et al. FactSage Thermochemical Software and Databases, 2010–2016. Calphad 2016, 54, 35–53. Available online: www.factsage.com (accessed on 5 November 2021). [CrossRef] [Green Version]
Publisher’s Note: MDPI stays neutral with regard to jurisdictional claims in published maps and institutional affiliations. |
© 2021 by the authors. Licensee MDPI, Basel, Switzerland. This article is an open access article distributed under the terms and conditions of the Creative Commons Attribution (CC BY) license (https://creativecommons.org/licenses/by/4.0/).