Implementation of Heat Flux Measuring Methods for Heat Transfer Coefficient Determination of In Situ Construction
Abstract
1. Introduction
- to calculate building heat loss; these losses are necessary to determine the design of central heating,
- to evaluate a building to determine the energy criteria; this is known as the technical assessment. This assessment is used for the determination of the minimum requirements for energy economy in buildings. The design evaluation is based on calculations with the application of project documentation and project values, which are calculated for buildings at the design phase; it is the basis for a building permit. The standardized evaluation works with standardized input data about internal and external climate conditions along with input data about the manufacturing of building constructions [21],
- to create the energy certificate of a building and determine its energy classification category [22].
2. Materials and Methods
- stationary methods—the measurement of heat flux density passing through the construction (sample) and the measurement of surface temperature in the stabilized heat state,
- dynamic methods—the measurement of the variable thermal field and the reading of values is realized continuously (non-stationary conditions).
- protected heat plate method,
- heat flux measuring method,
- heat isolation on the circular pipeline method,
- contact dynamic methods for measuring thermal–physical parameters,
- calorific wire and calorific belt method,
- needle and planar probe method,
- heat case method, etc.
Problem Formulation
- from documentation such as the original project documentation, the records,
- the building diary, cards and markings of the construction (insulating glass) etc., which are possible to obtain by contacting the ex-realizer of the building,
- from visual inspection and measurement of the geometrical parameters such as the wall thickness, for example the wall material under the fallen plaster,
- from experiences such as the composition of construction according to building time and technologies,
- from the determination of composition by destructive methods such as by probe into the composition of the building and material sample collection,
- from the measurement of technical heat properties of the construction by devices, e.g., the non-destructive methods (stated in the following part of this article),
- a combination of the aforementioned previous methods.
- the hazards related to the realization of the method and the determination of the H value—these facts are stated in the following part of article,
- the hazards related to the value determination of the time coefficient—the change of H value by operational conditions; it is established that the H value can change due to environmental factors such as the humidity in the construction (condensational zones can impact the thermal conductivity coefficient ʎ) and the influence of environmental physical factors such as noise [25]. These could result in an error in categorizing the building.
3. Calculation
3.1. Measurement and Calculation of the H Value Using the Heat Flux Measuring Method for Non-Stationary Conditions
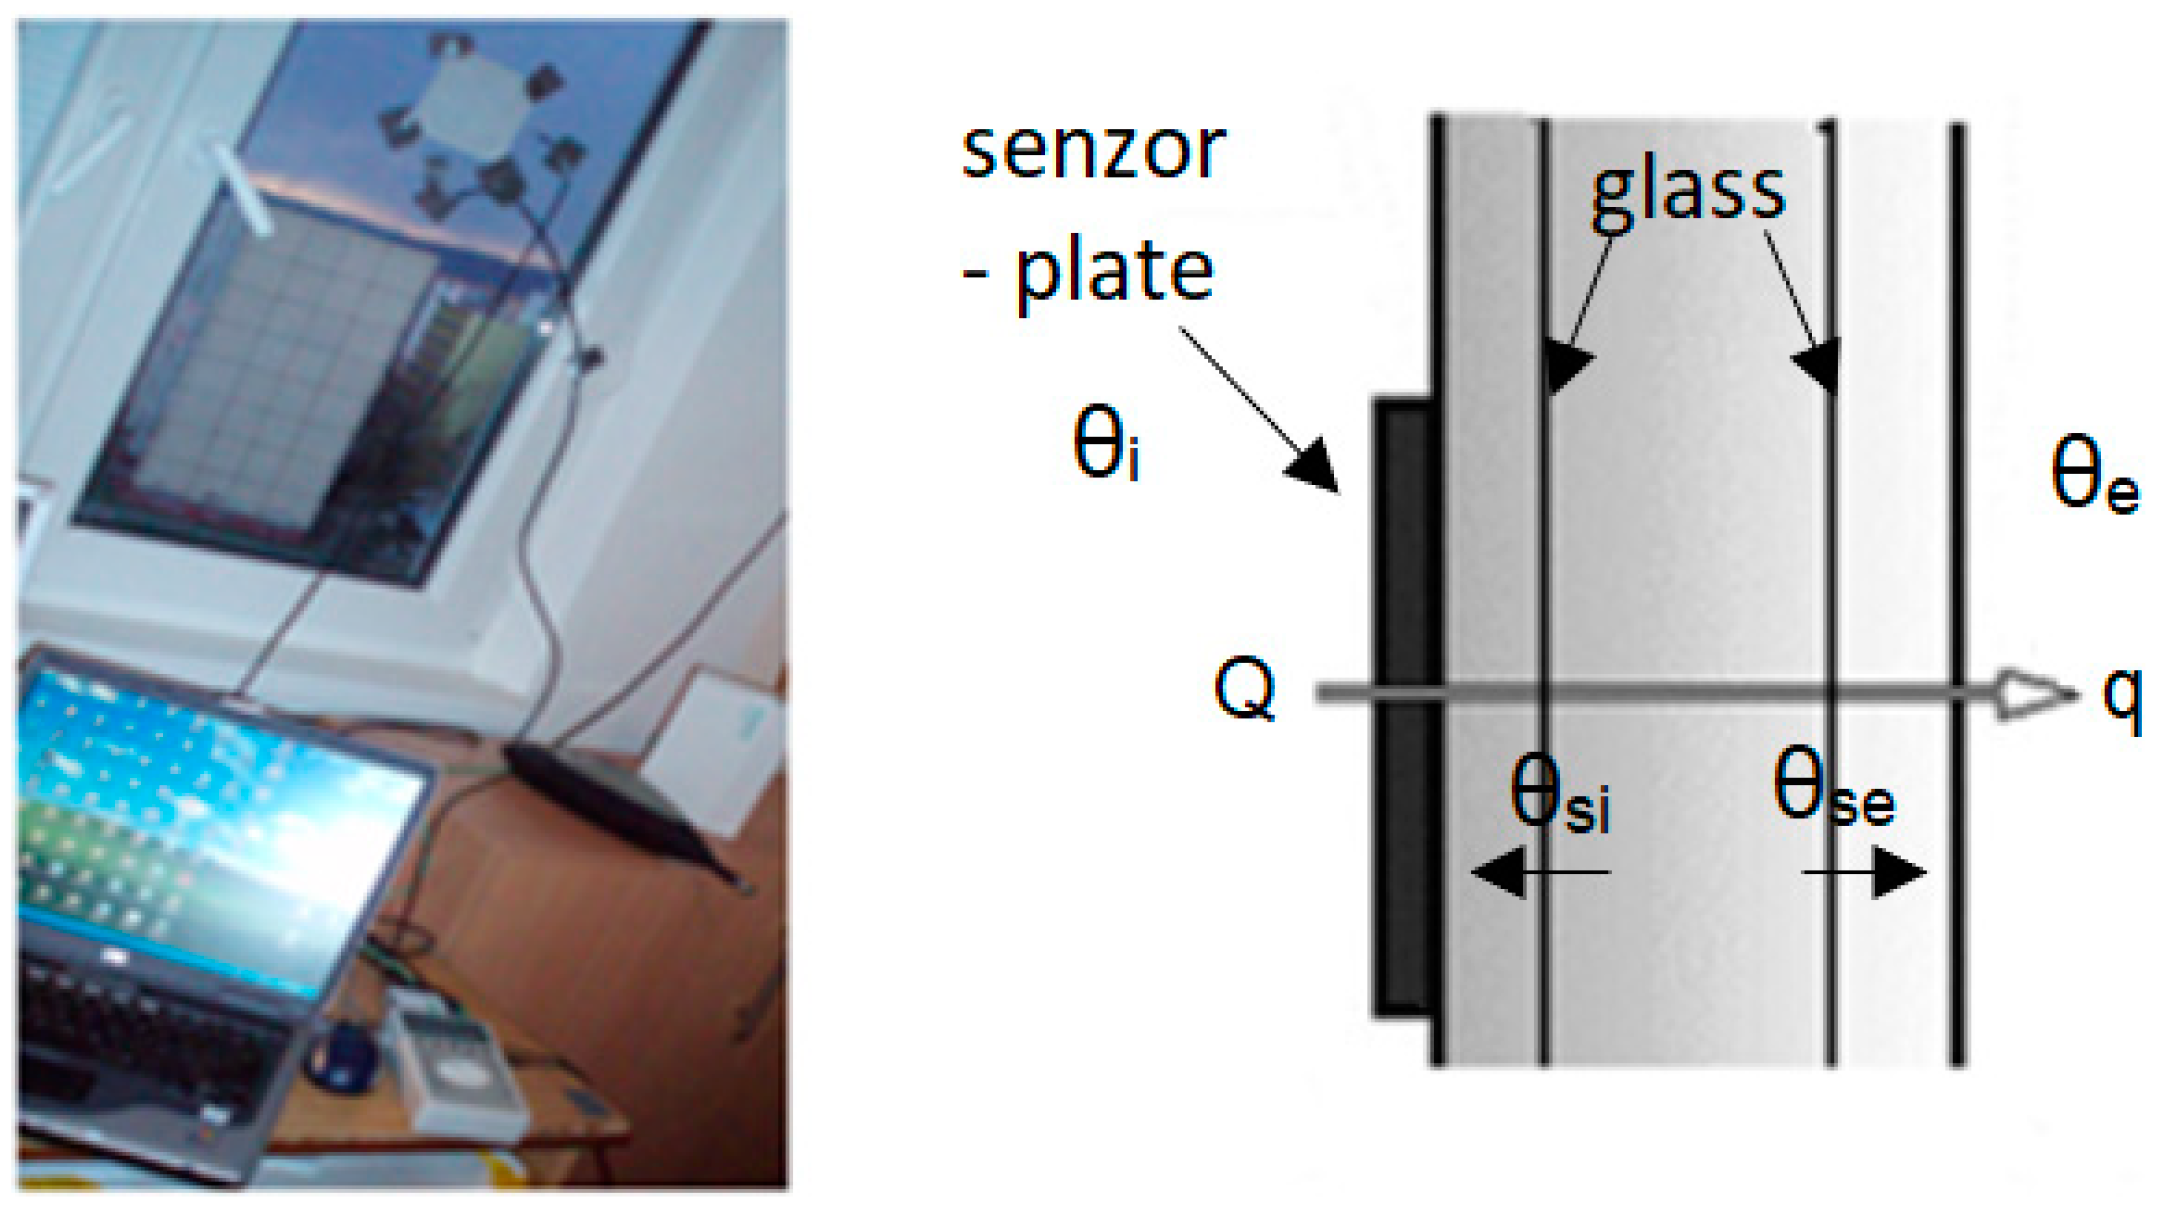
- The plate for measuring the heat flux density is situated on the inner side of the building construction in the line of heat flux and consists of two probes for temperature measuring—it is used for the calculation of Equation (5).
- The plate for measuring the heat flux density is situated on the inner side of the building construction in the line of heat flux and consists of two probes for surface temperature measuring on the internal and external side of the building construction—Equations (6) and (7).
- The plate for measuring the heat flux density consists of four probes for measuring temperature according to the above-mentioned points.
3.2. Example of Value Determination at the Transparent and Non-Transparent Construction (Measurement and Calculation According to the Alternative, No. 1)
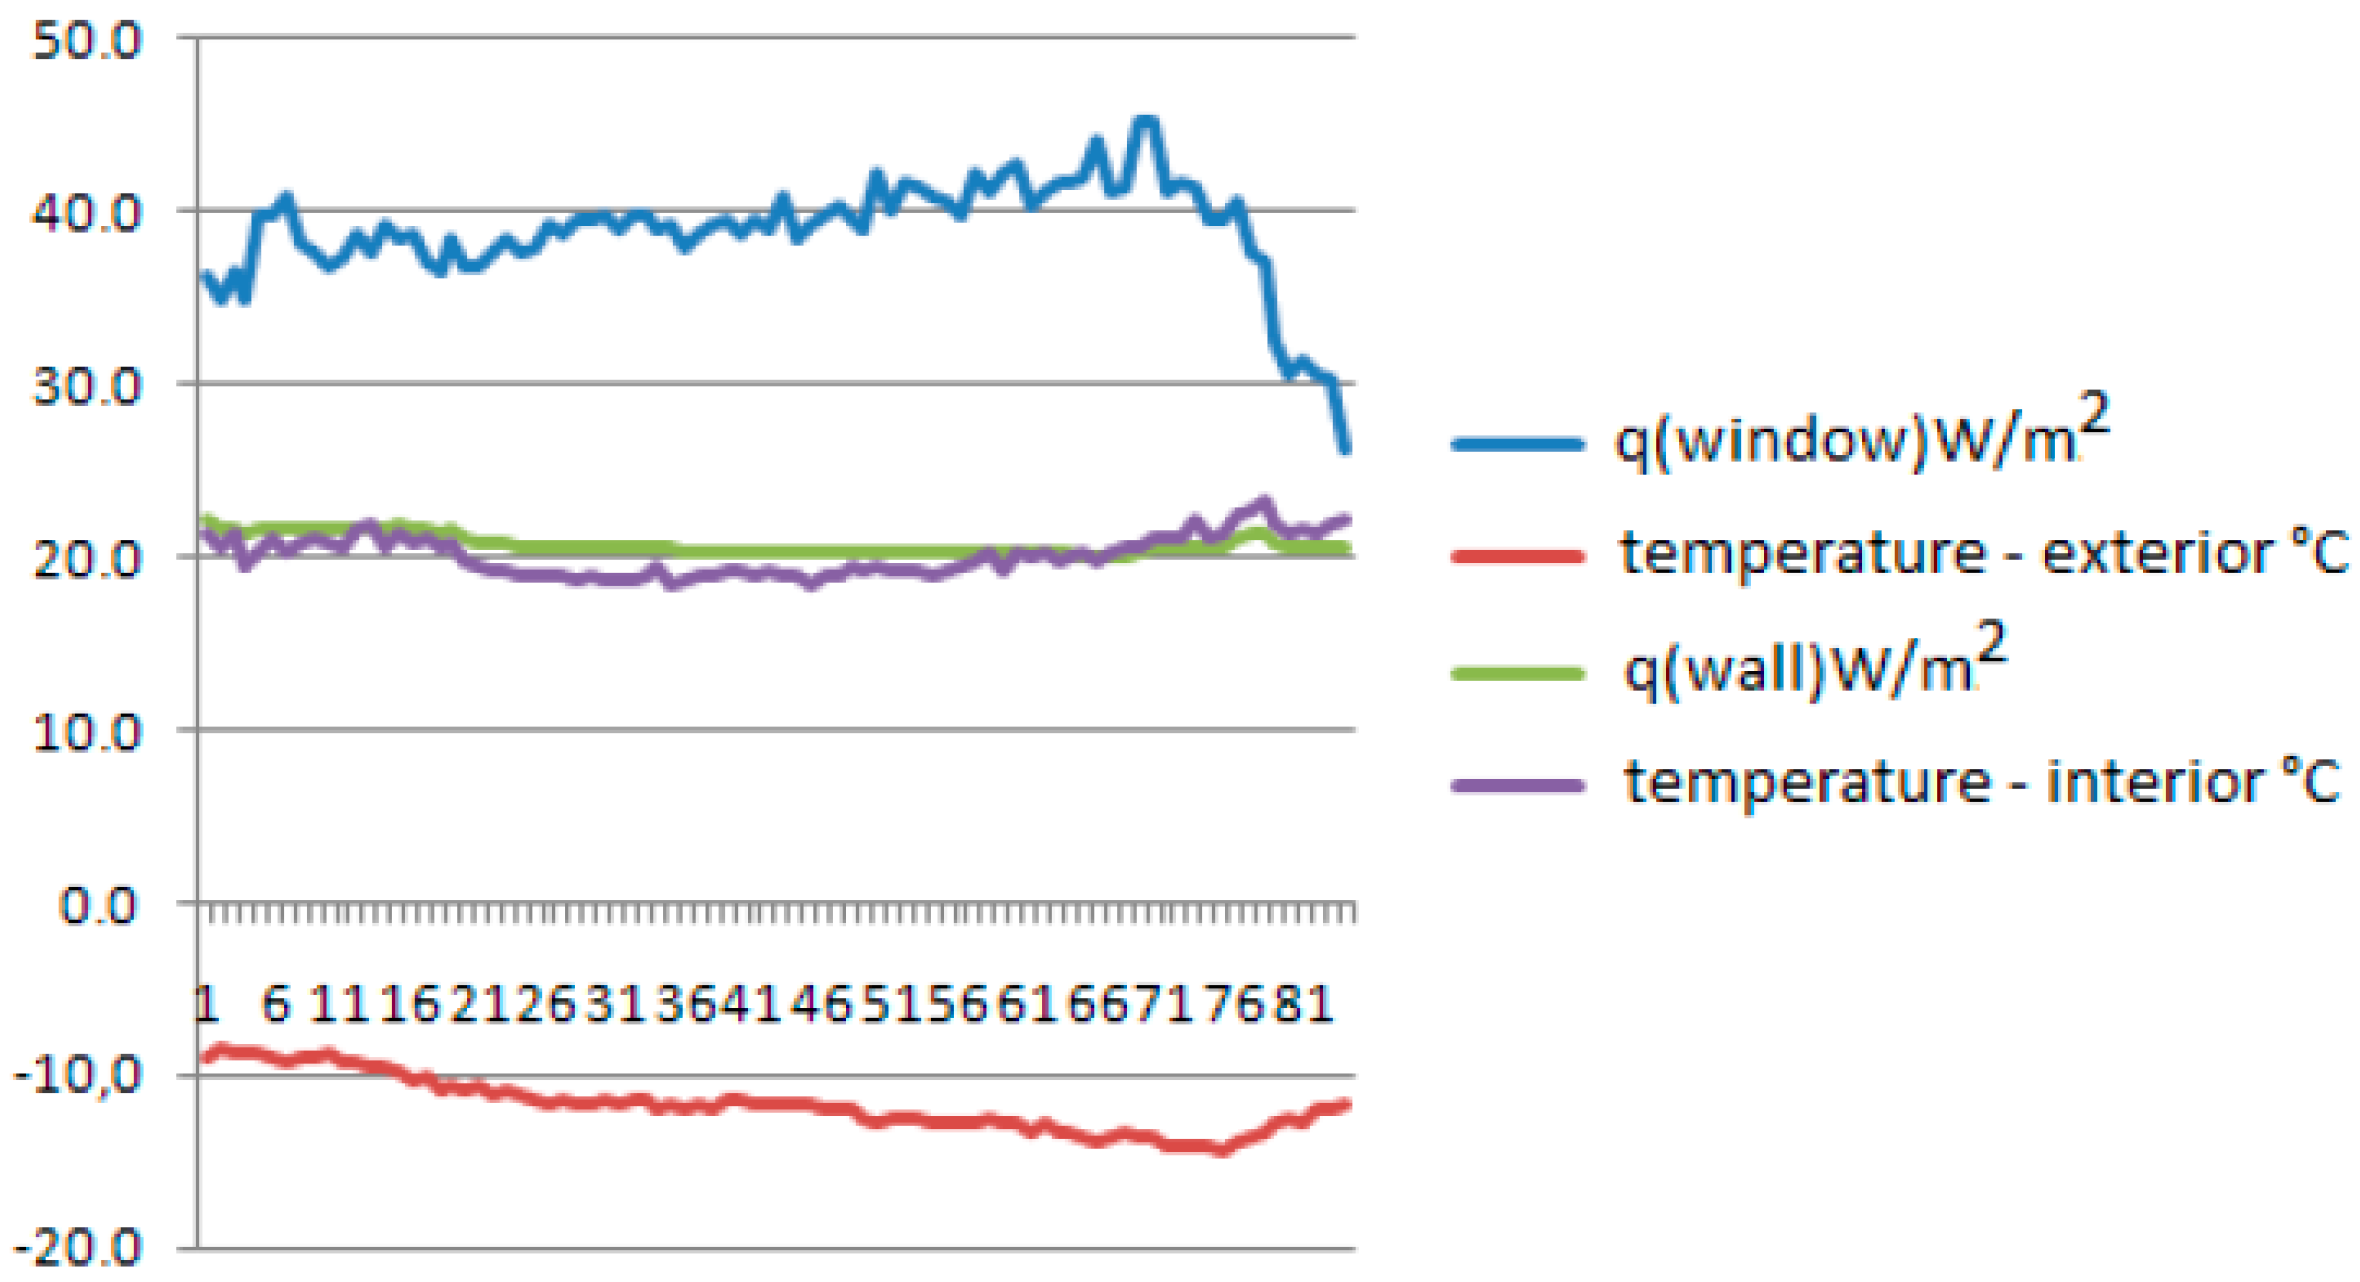
- Value changes of heat flux density are more dynamic at the sealed unit of the window as opposed to at the panel BA NKS. This state is related to higher accumulation capability of the wall in response to temperature fluctuations in the exterior (for a given measured time it was the temperature fluctuations from −8.67 °C to −14.29 °C).
- Measuring during the night was more reliable—the calculated values approximate to reality (projected values) much more as during the day there is an impact of several environment several that affected the accuracy of the measured values.
3.3. Example of Value Determination at the Transparent Construction by the Two Methods (Measurement and Calculation According to the Alternatives, No. 1, 2)
3.4. Experimental Determination of the Value Hg by the Method of Heat Flow Measurement In Situ
4. Recommended Measuring Method
- Measuring system—devices (accuracy, calibration).
- Subject—human (manipulation technique with devices, evaluation of measured values, measuring conditions).
- Environment—the right selection of measuring position (without the environment influences such as radiant heat, sound, artificial illumination).
- Measuring time, length of measurement and measuring cycles during the continuous measurement.
- Preparation of measurement—study of the assessed building, room and types of constructions when the measurements are taken. This is to ensure the stabilization of the temperature of the internal spaces, accessibility to the measuring surfaces and the possibility of the placing of sensors for taking measurements in the exterior of the building.
- Realization of measurement—the measurements were realized in accordance with required marginal conditions; the temperature differences between the exterior and interior were twenty Kelvins minimum. The determination of the H parameter was problematic in the construction where there was not a heated room (it was not the heat flux between the two environments).
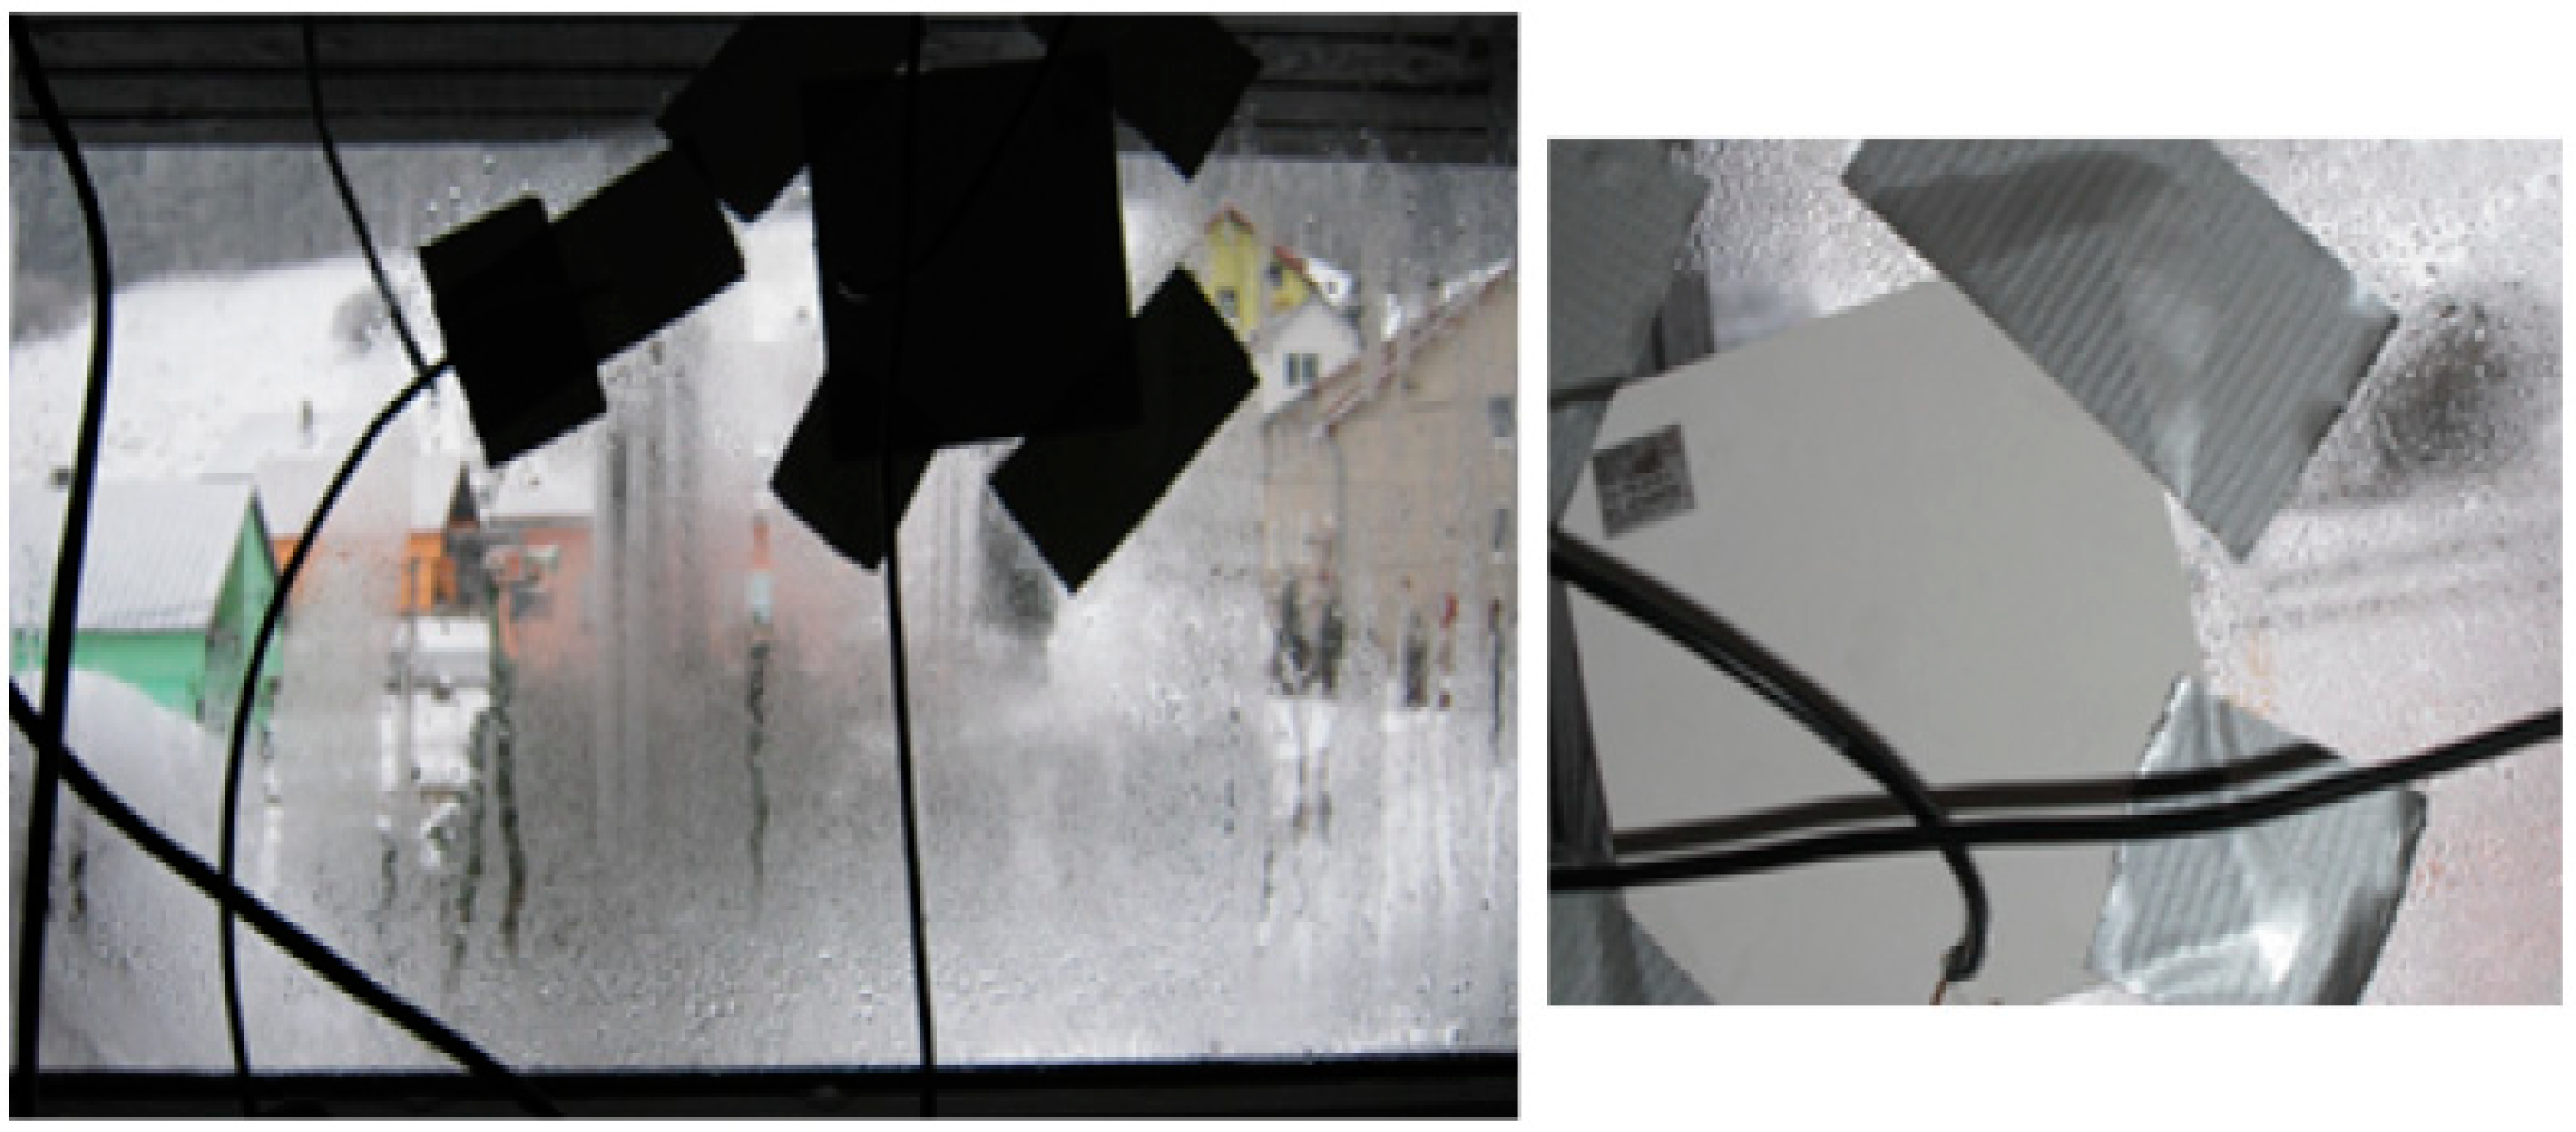
- After the analysis of the building construction types, suitable positions needed to be determined where the measurements would be taken. The suitability of positions was ascertained because the construction should be homogeneous without any thermal or form bridges (Figure 7). It was possible to determine this using a thermal imaging camera.
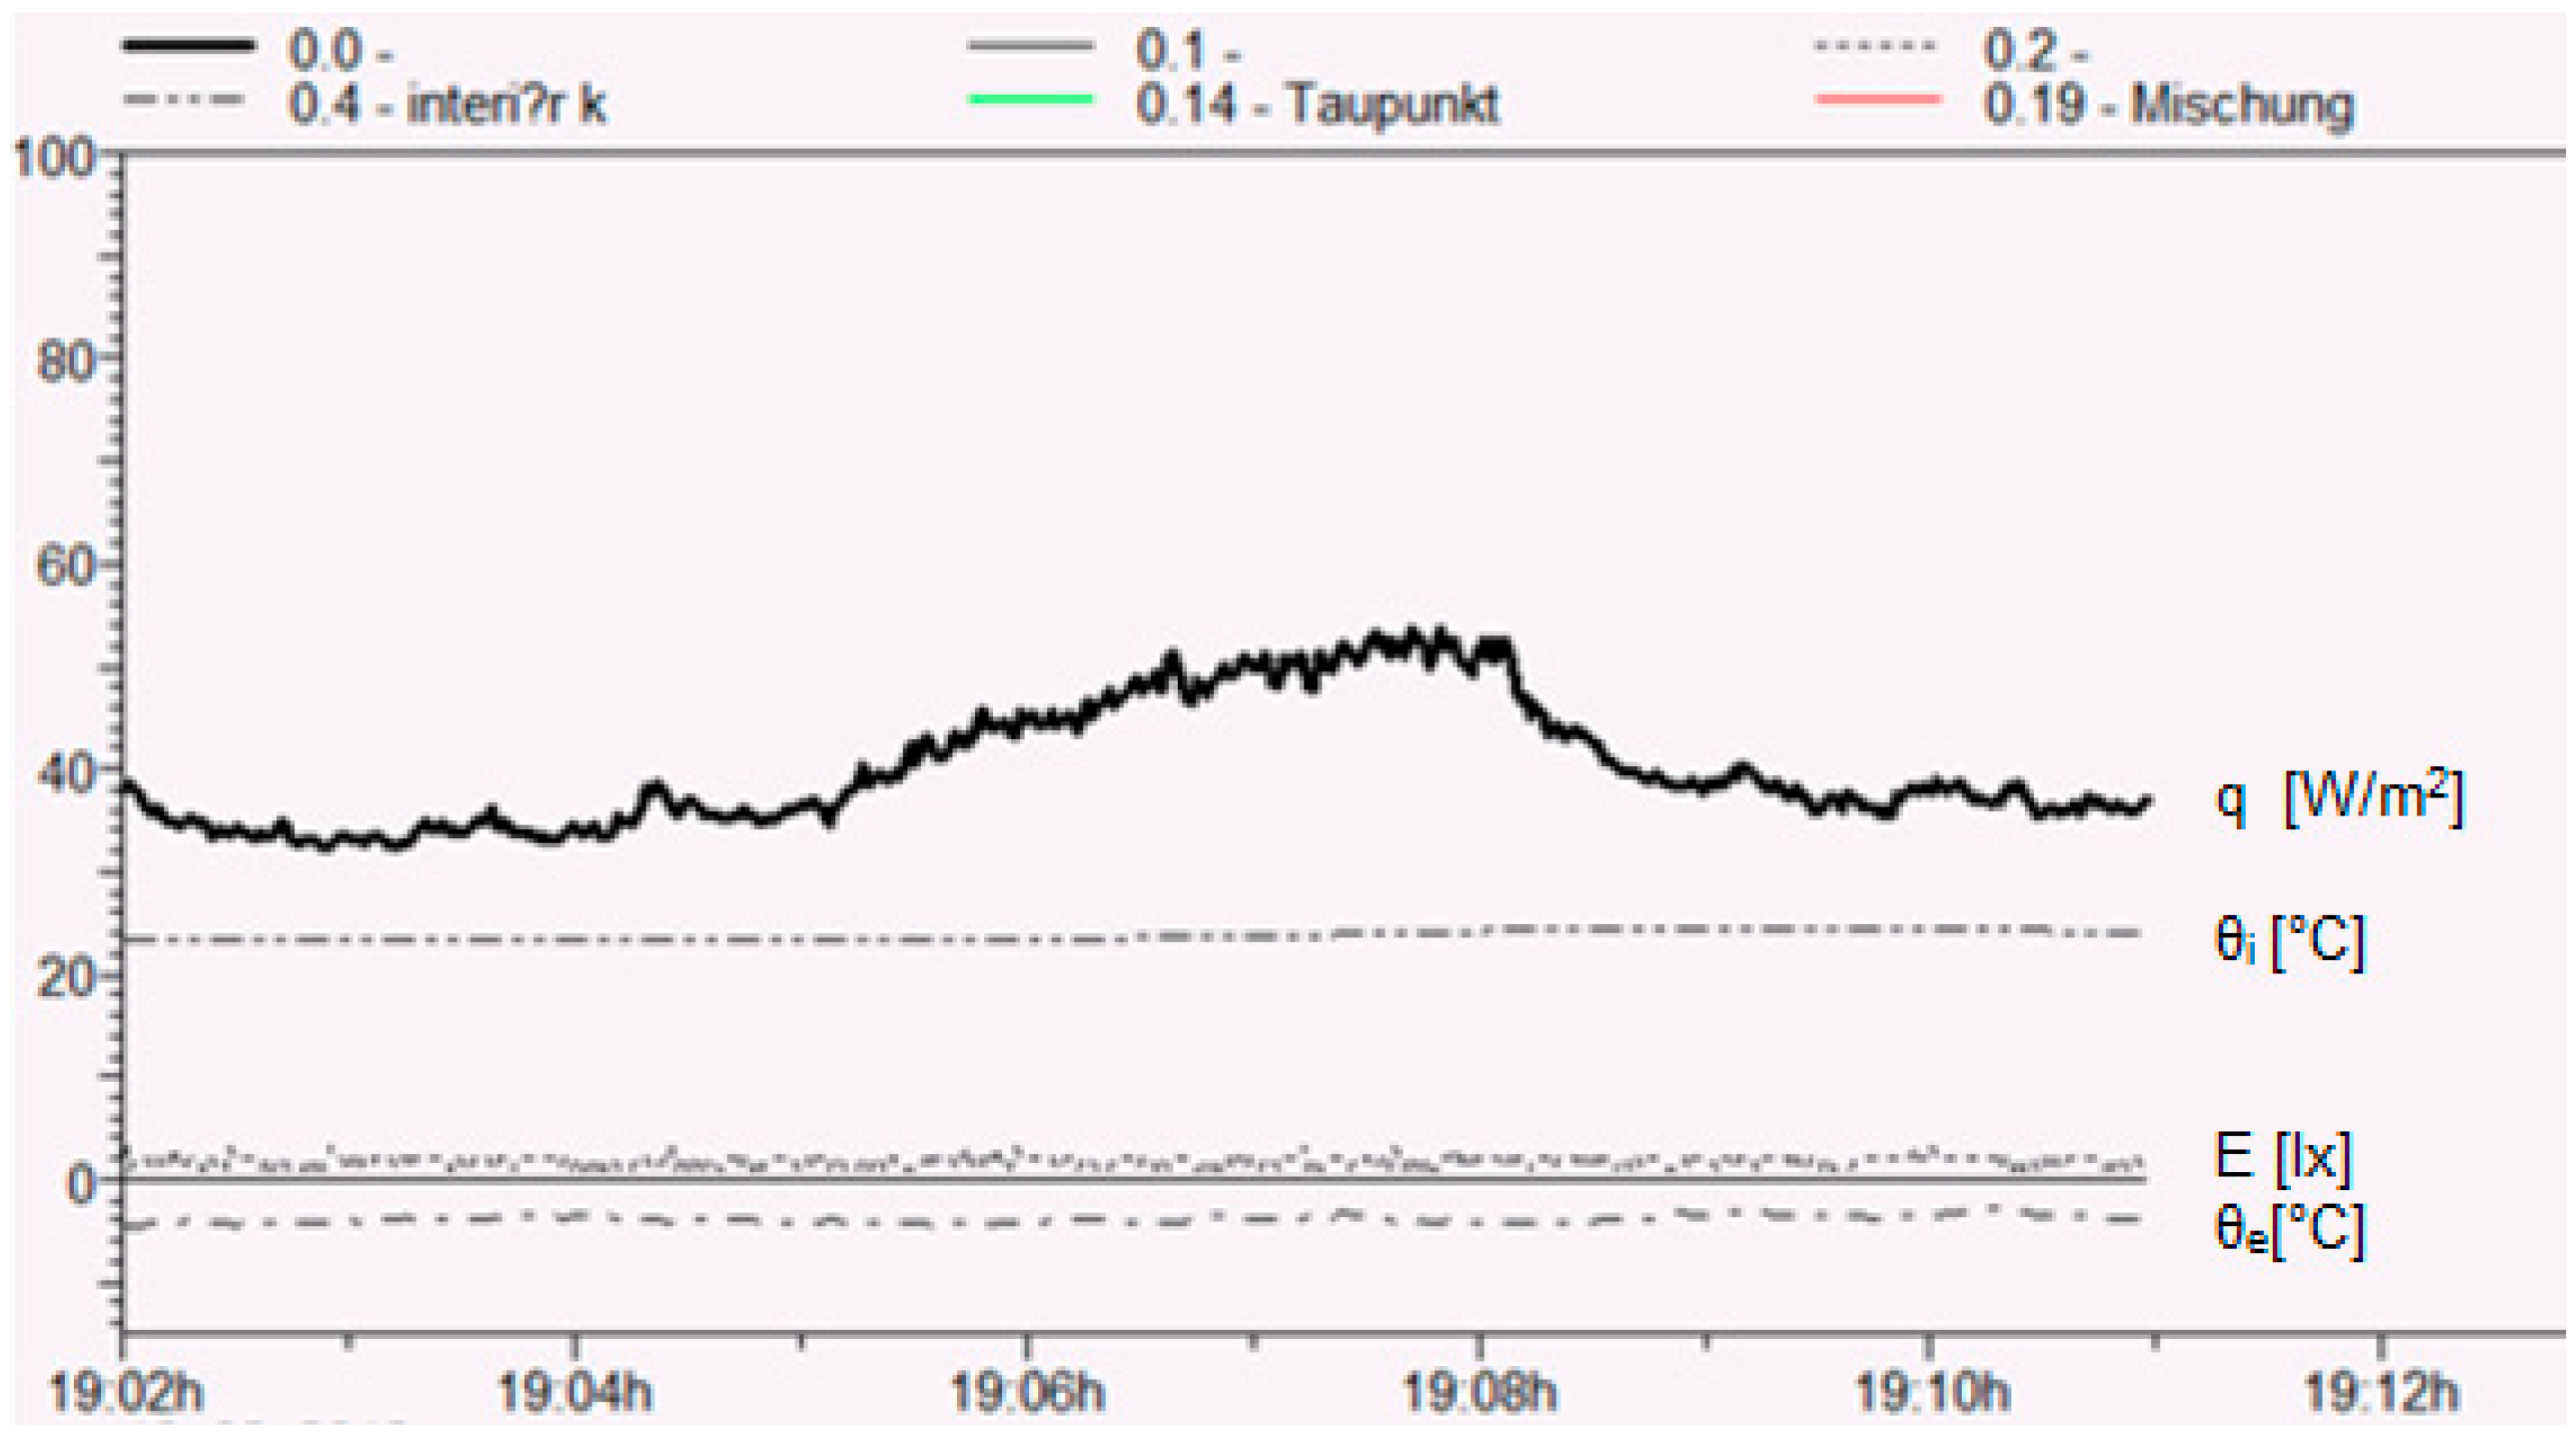
- It was advisable to carry out the measuring when the heat fluxes were stabilized without the external and internal effects in the constructions. It was suitable to measure during the night or early morning. It was necessary to eliminate the impacts of the environment which could influence the concrete measurement—Figure 8.
- Provision of suitable cooperation between the construction and the sensors.
- Drawing up of the data file of the measurements followed by statistical evaluation.
5. Results and Discussion
- The real values of the heat transfer coefficient Hg on the window glazing are higher (by around 8.8%) than the declared values under the optimal conditions (without the influence of the environment factors—e.g., noise, light sources). This fact is influenced by degradation processes such as commission time of the window (the measured sample was eight years old) and the other climatic factors. In addition, the design and the join stress quality of the glass, along with the distance of the frame, were important. These can cause argon leakage and a decrease in the insulation qualities of the glazing.
- The increase in Hg (from 9.54% to 19.08% against the calculated value on average) wats caused by the effect of the infrared element from the sources of artificial light. The increase in Hg was dependent on the type of artificial light source and the distance between the source and the glazing.
- The increase in Hg (from 25.45% on average) was caused by the effect of the sound pressure level on the front of the glazing (L = 75 dB).
- The increase in Hg (by 9.54% on average) was caused by the collective influence, which was lower during the insulation effects of the sources.
- changes of values occur during the time of the experiment, e.g., the H value was worse in the window glazing due to the wear of window (deformation, wind actions). The H value of the solid walls and roof may have been aggravated by the internal condensation of the structures,
- the H value has an influence on other environmental factors (radiations, noise) thus it was suitable to realize the measurements according to the recommended rules which are presented in this article.
6. Conclusions
- the influence on the building construction amortization and its operation and the possible changes of thermal insulation properties
- the influence of the environmental factors (noise, radiation—artificial light, etc.)
- the influence of measurement errors such as systematic error—during the violation of the measuring method, the measuring instrument was not calibrated; random error—instantaneous conditions of measurement and gross errors are caused by human mistakes.
Author Contributions
Funding
Institutional Review Board Statement
Informed Consent Statement
Conflicts of Interest
References
- Sevostianov, I.; Kachanov, M. On discontinuities of thermal, electric and diffusion fluxes at interfaces of different materials. Int. J. Eng. Sci. 2016, 102, 1–3. [Google Scholar] [CrossRef]
- Thakur, A.K.S. Periodic heat flux through extended structures and projections of buildings. Build. Environ. 1985, 20, 43–46. [Google Scholar] [CrossRef]
- Lee, K.O.; Medina, M.A.; Raith, E.; Sun, X. Assessing the integration of a thin phase change material (PCM) layer in a residential building wall for heat transfer reduction and management. Appl. Energy 2015, 137, 699–706. [Google Scholar] [CrossRef]
- Goia, F.; Perino, M.; Haase, M. A numerical model to evaluate the thermal behaviour of PCM glazing system configurations. Energy Build. 2012, 54, 141–153. [Google Scholar] [CrossRef]
- Ibrahim, M.; Biwole, P.H.; Achard, P.; Wurtz, E.; Ansart, G. Building envelope with a new aerogel-based insulating rendering: Experimental and numerical study, cost analysis, and thickness optimization. Appl. Energy 2015, 159, 490–501. [Google Scholar] [CrossRef]
- Pérez, G.; Coma, J.; Martorell, I.; Cabeza, L.F. Vertical Greenery Systems (VGS) for energy saving in buildings: A review. Renew. Sustain. Energy Rev. 2014, 39, 139–165. [Google Scholar] [CrossRef]
- Mazzeo, D.; Oliveti, G.; Arcuri, N. Influence of internal and external boundary conditions on the decrement factor and time lag heat flux of building walls in steady periodic regime. Appl. Energy 2016, 164, 509–531. [Google Scholar] [CrossRef]
- Arıcı, M.; Karabay, H.; Kan, M. Flow and heat transfer in double, triple and quadruple pane windows. Energy Build. 2015, 86, 394–402. [Google Scholar] [CrossRef]
- Arıcı, M.; Karabay, H. Determination of optimum thickness of double-glazed windows for the climatic regions of Turkey. Energy Build. 2010, 42, 1773–1778. [Google Scholar] [CrossRef]
- Reim, M.; Beck, A.; Körner, W.; Petricevic, R.; Glora, M.; Weth, M.; Pötter, F.J. Highly insulating aerogel glazing for solar energy usage. Sol. Energy 2002, 72, 21–29. [Google Scholar] [CrossRef]
- Collins, R.E.; Simko, T.M. Current status of the science and technology of vacuum glazing. Sol. Energy 1998, 62, 189–213. [Google Scholar] [CrossRef]
- Bahaj, A.S.; James, P.A.; Jentsch, M.F. Potential of emerging glazing technologies for highly glazed buildings in hot arid climates. Energy Build. 2008, 40, 720–731. [Google Scholar] [CrossRef]
- Oelhafen, P. Optimized spectral transmittance of sun protection glasses. Sol. Energy 2007, 81, 1191–1195. [Google Scholar] [CrossRef]
- Karabay, H.; Arıcı, M. Multiple pane window applications in various climatic regions of Turkey. Energy Build. 2012, 45, 67–71. [Google Scholar] [CrossRef]
- Gorla, R.S.R. Unsteady heat transfer characteristics of a two-dimensional laminar wall jet. Int. J. Eng. Sci. 1973, 11, 841–851. [Google Scholar] [CrossRef]
- Siegel, R. Transient effects of radiative transfer in semitransparent materials. Int. J. Eng. Sci. 1998, 36, 1701–1739. [Google Scholar] [CrossRef]
- Horikiri, K.; Yao, Y.; Yao, J. Modelling conjugate flow and heat transfer in a ventilated room for indoor thermal comfort assessment. Build. Environ. 2014, 77, 135–147. [Google Scholar] [CrossRef]
- Roos, A.; Karlsson, B. Optical and thermal characterization of multiple glazed windows with low U-values. Sol. Energy 1994, 52, 315–325. [Google Scholar] [CrossRef]
- Hammond, G.P. Thermal performance of advanced glazing systems. J. Inst. Energy 2001, 74, 2–10. [Google Scholar]
- Pal, S.; Roy, B.; Neogi, S. Heat transfer modelling on windows and glazing under the exposure of solar radiation. Energy Build. 2009, 41, 654–661. [Google Scholar] [CrossRef]
- Gałązka, K.; Populoh, S.; Xie, W.; Hulliger, J.; Weidenkaff, A. Radiative heat losses in thermal conductivity measurements: A correction for linear temperature gradients. Measurement 2016, 90, 187–191. [Google Scholar] [CrossRef]
- Khoukhi, M.; Fezzioui, N.; Draoui, B.; Salah, L. The impact of changes in thermal conductivity of polystyrene insulation material under different operating temperatures on the heat transfer through the building envelope. Appl. Therm. Eng. 2016, 105, 669–674. [Google Scholar] [CrossRef]
- Chmurny, I. Comments and Suggestions for Calculating the Energy Certification of Buildings; MVaRR SR, SKSI: Bratislava, Slovakia, 2007. [Google Scholar]
- Flimel, M.; Dupláková, D. Vibro-Acoustical Certification Management of Residential Houses; LAP Lambert Academic Publishing: Saarbrücken, Germany, 2016. [Google Scholar]
- Vaverka, J. Building Thermal Technology and Energy Buildings; VUTIUM: Brno, Czech Republic, 2006. [Google Scholar]
- Flimel, M. Riziká pri Určovaní Súčiniteľa Prechodu Tepla pri Projektovom Hodnotení Budov, Budova a Energia, Proceeding from Conference; Vysoké Tatry: Štrbské Pleso, Slovakia, 2009; pp. 135–138. [Google Scholar]
- Almemo Manual 2290-8; AHLBORN Mess- und Regelungs Technik GmbH: Holzkirchen, Germany, 1999.
- AMR WinControl. Available online: http://amrwincontrol.software.informer.com (accessed on 7 May 2020).
- Flimel, M. The effect of light on the value of heat transfer coefficient Ug-glazed windows. In Proceedings of the Lighting Conference of the Visegrad Countries (Lumen V4), Bratislava, Slovakia, 26–28 September 2012. [Google Scholar]
- Flimel, M. Interaction of environmental noise and building construction. In Proceedings of the CESB 10: Central Europe towards Sustainable Building, Prague, Czech Republic, 30 June–2 July 2010; pp. 1–4. [Google Scholar]
- Vilčeková, S.; Sedlakova, A.; Turcsanyi, P.; Mečiarová, L.; Burdová, E.K.; Varga, J.; Rošková, P. Ultra-low-energy house and indoor environmental quality: A case study. Int. J. Energy Environ. 2016, 10, 171–180. [Google Scholar]
- Rimar, M.; Fedak, M.; Hatala, M.; Smeringai, P. The synergistic effect of thermal collectors rotation in relation to their energy efficiency and stagnation compared with the static thermal system in the conditions of central Europe. Int. J. Photoenergy 2015, 2015, 1–19. [Google Scholar] [CrossRef] [PubMed]
- Matisková, D. The methodology of economics costs influential on automation of component production. Am. J. Econ. 2012, 7, 164–170. [Google Scholar] [CrossRef][Green Version]
- Variny, M.; Jediná, D.; Kizek, J.; Illés, P.; Lukáč, L.; Janošovský, J.; Lesný, M. An investigation of the techno-economic and environmental aspects of process heat source change in a refinery. Processes 2019, 7, 776. [Google Scholar] [CrossRef]
- Katunský, D.; Bagoňa, M.; Katunská, J.; Lopušniak, M.; Rudišin, R.; Tóth, S.; Vertaľ, M. Measurements of physical parameters of envelope structures in real conditions in situ. Visn. Nac. Univ. Ľvivska Politech. Teor. I Prakt. Budivn. 2012, 737, 259–264. [Google Scholar]


| Diagnostic Method | Advantages | Disadvantages |
|---|---|---|
| Determination from documentation. | Simple and fast. | Possibility of changes. |
| Visual inspection. | Additional methods. | It is not possible to establish the exact material structure. |
| Application of experiences. | Fast assumption for the determination of composition. | Possibility of incorrect conclusion. |
| Destructive methods. | Finding out the exact material structure, the possibility of sample collection for analysis. | Laboriousness, disruption ofconstruction homogeneity, possibility of roof leaking. |
| Non-destructive methods. | Accuracy of finding out the actual values by measuring or calculation. | Relation to devices, dependence on marginal conditions of measurement and object running. |
| Combined methods. | Possibility of combination according to real situation | Various degrees of accuracy. |
| Building Construction H Value | |||
|---|---|---|---|
| Calculated Values | Insulated Sealed Unit | BA NKS Panel | |
| Total measurement. | Maximal value of H. | 1.33 | 0.76 |
| Minimal value of H. | 0.93 | 0.56 | |
| Arithmetic mean. | 1.2 | 0.65 | |
| Median. | 1.21 | 0.66 | |
| Standard deviation. | 0.081 | 0.046 | |
| Variation coefficient %. | 6.78 | 7.61 | |
| Measuring during the night. | Arithmetic mean. | 1.12 | 0.67 |
| Measuring during the day. | Arithmetic mean. | 1.22 | 0.59 |
| Insulated Sealed Unit | |||
|---|---|---|---|
| No. | Calculated values. | H | Λ |
| Total measurement | Maximal value of H. | 1.73 | 2.26 |
| Minimal value of H. | 1.07 | 1.40 | |
| Arithmetic mean. | 1.18 | 1.54 | |
| Standard deviation. | 0.049 | 0.067 | |
| Variation coefficient %. | 4.2 | 4.35 | |
| H calculation according to Equations (6) and (7). | 1.22 | ||
| Number of Measurement | Description of Influence of Environmental Factors | Determined Value Hg | |
|---|---|---|---|
| Min Hg | Max Hg | ||
| 42 | Without the influences of environmental factors—middle of the window glazing 0.6 × 1.5 m, insulating double glass. | 1.135 | 1.26 |
| 34 | With the influence of noise (vacuum cleaner L = 76 dB). | 1.27 | 1.49 |
| 40 | With the influence of artificial lighting—reflector. | 1.15 | 1.26 |
| 37 | With the influence of noise and lighting (vacuum cleaner + reflector). | 1.17 | 1.45 |
| 41 | With the influence of artificial lighting (60W bulb). | 1.155 | 1.22 |
| 36 | With the influence of noise and lighting (vacuum cleaner + 60 W bulb). | 1.18 | 1.33 |
| Operating Conditions | Min. Value of ΔH | Max. Value of ΔH | Scatter of ΔH Residuum Growth [%] | Average of ΔH Residuum Values [%] |
|---|---|---|---|---|
| Regular without effect of outside influences (measurement No. 42). | 0.035 | 0.16 | 3.18–14.54 | 8.86 |
| Noise effect on glazing (L = 76 dB) (measurement No. 34). | 0.17 | 0.39 | 15.45–35.45 | 25.45 |
| Noise effect on glazing (L = 76 dB) (measurement No. 34). | 0.05 | 0.16 | 4.54–14.54 | 9.54 |
| With the influence of noise and lighting (vacuum cleaner + reflector) (measurement No. 37). | 0.07 | 0.35 | 6.36–31.81 | 19.08 |
| With the influence of artificial lighting (60W bulb) (measurement No. 41). | 0.05 | 0.12 | 4.54–10.9 | 7.72 |
| With the influence of noise and lighting (vacuum cleaner + 60 W bulb) (measurement No. 36). | 0.08 | 0.13 | 7.27–11.81 | 9.54 |
Publisher’s Note: MDPI stays neutral with regard to jurisdictional claims in published maps and institutional affiliations. |
© 2021 by the authors. Licensee MDPI, Basel, Switzerland. This article is an open access article distributed under the terms and conditions of the Creative Commons Attribution (CC BY) license (https://creativecommons.org/licenses/by/4.0/).
Share and Cite
Flimel, M.; Duplakova, D.; Sukic, E. Implementation of Heat Flux Measuring Methods for Heat Transfer Coefficient Determination of In Situ Construction. Processes 2021, 9, 1970. https://doi.org/10.3390/pr9111970
Flimel M, Duplakova D, Sukic E. Implementation of Heat Flux Measuring Methods for Heat Transfer Coefficient Determination of In Situ Construction. Processes. 2021; 9(11):1970. https://doi.org/10.3390/pr9111970
Chicago/Turabian StyleFlimel, Marian, Darina Duplakova, and Enes Sukic. 2021. "Implementation of Heat Flux Measuring Methods for Heat Transfer Coefficient Determination of In Situ Construction" Processes 9, no. 11: 1970. https://doi.org/10.3390/pr9111970
APA StyleFlimel, M., Duplakova, D., & Sukic, E. (2021). Implementation of Heat Flux Measuring Methods for Heat Transfer Coefficient Determination of In Situ Construction. Processes, 9(11), 1970. https://doi.org/10.3390/pr9111970


