
Design of an IOTA Tangle-Based Intelligent Food Safety Service Platform for Bubble Tea


Abstract
:1. Introduction
- (1)
- Convenience: Convenience is defined as records being quickly and automatically convertible into officially checkable documents for auditing, applications, or examinations. This can save a lot of labor time and manual input errors. To tackle this problem, a web-based service platform using Extensible Markup Language (XML) and an intelligent mapper can effectively interchange document formats. Extensible Markup Language (XML) is a tag-based language, which can easily migrate, integrate, and transfer data with other services [7];
- (2)
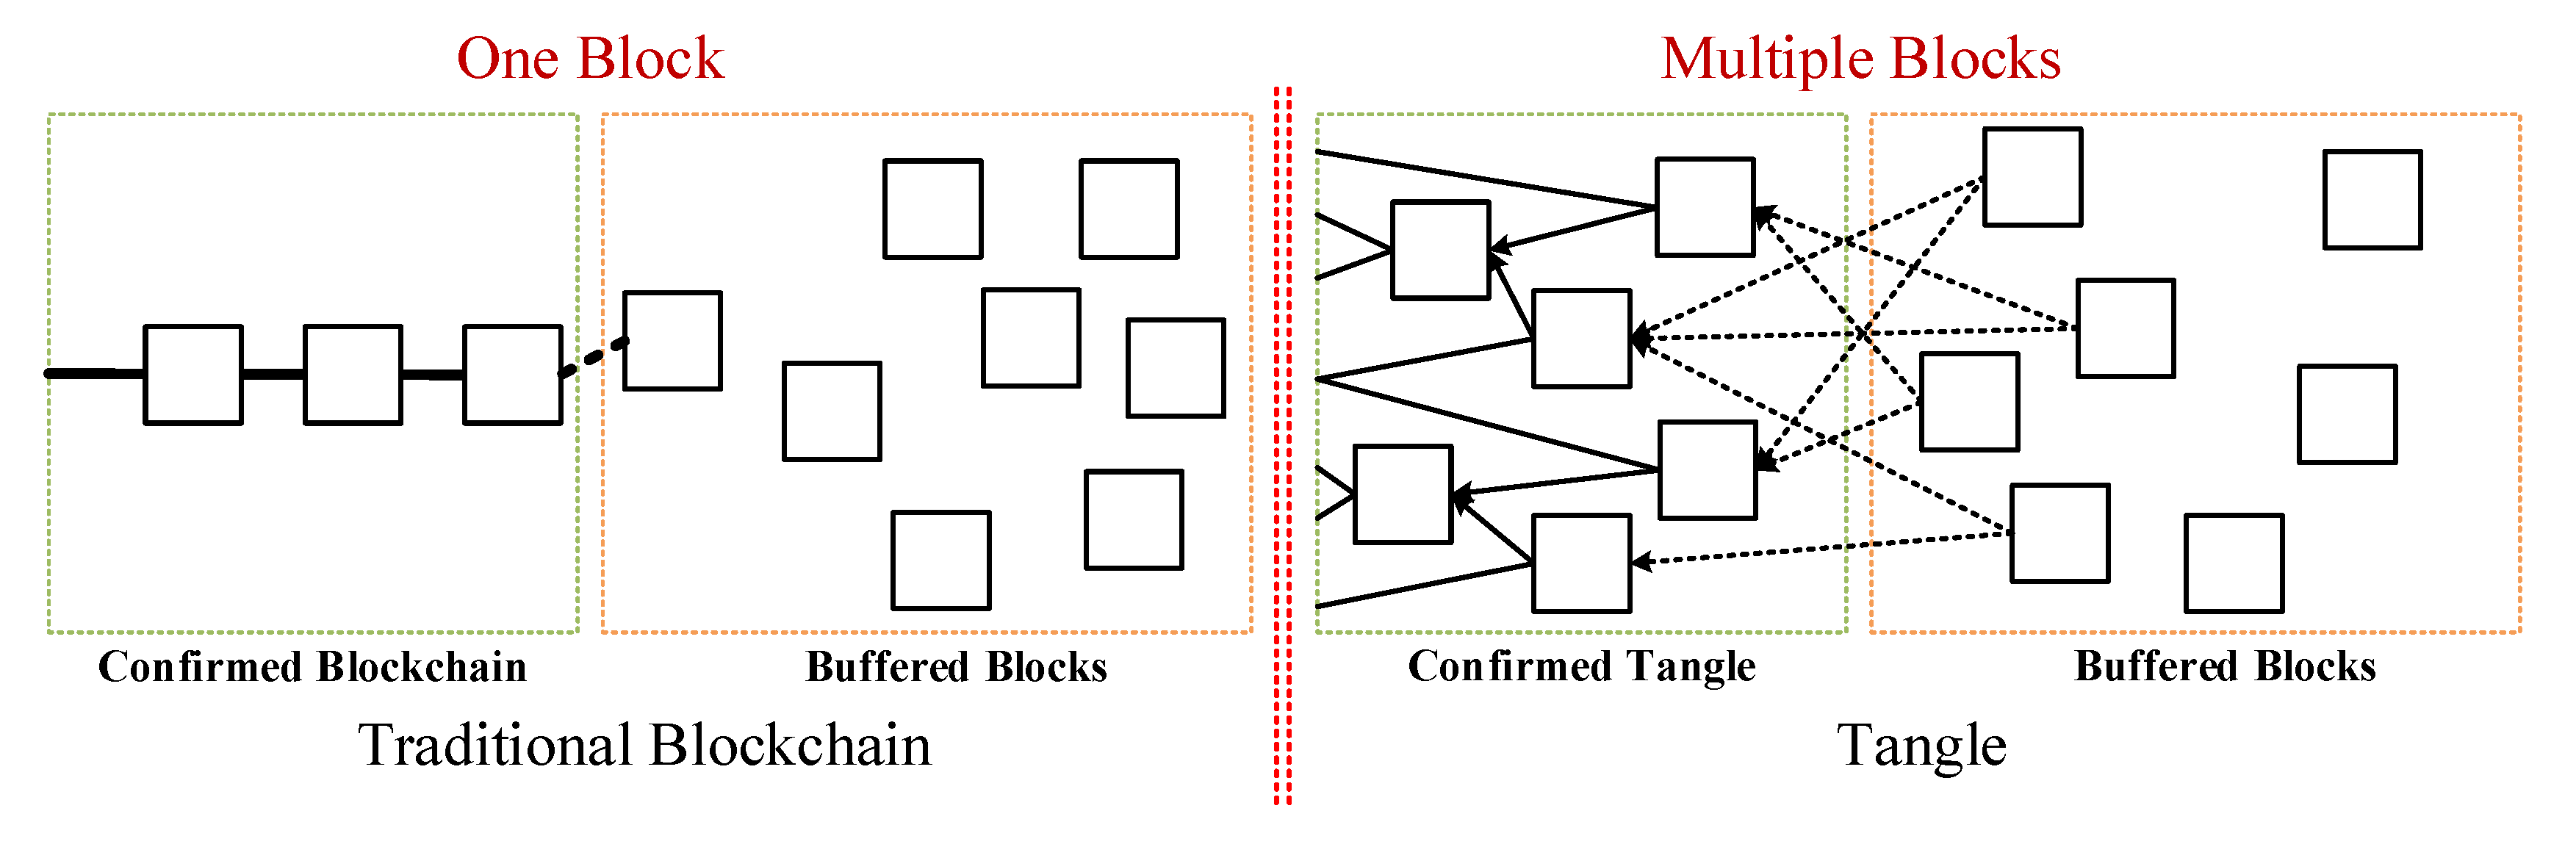
- Data consistency: Consistency is defined as each user seeing a consistent view of the data. Data cannot be deliberately modified. To tackle this problem, the blockchain-based framework is a decentralized architecture. When data are uploaded on the distributed ledger, it records all collected data, transactions, and documents via a tamper-resistant mechanism [8]. To tackle this problem, the distributed ledger ensures that the raw materials, production processes, processing, sales, and audit data in the food safety supply chain are consistent;
- (3)
- Effectiveness: Effectiveness is defined as the ability of participants to effectively track and trace goods in the food safety supply chain. Traditional tracking and tracing of goods require a lot of data to consult. However, the data are often broken, and the paper data and electronic data are interlaced and coexist, so they are not easy to acquire. To tackle this problem, transactions are electronically stored in blockchain or Tangle. Participants can effectively track and trace authorized data and transactions via authorities [9];
- (4)
- Scalability: Scalability is defined as a manufacturer being able to use low-cost computer equipment or a low-power IoT device to create a new node of the blockchain, reducing the manufacturer’s construction cost. To tackle this problem, devices can participate in the editing of the distributed ledger. IOTA Tangle is helpful for data transmission and connection by multiple IoT devices [9]. Allowing devices to directly participate in data and message transmission can reduce the chance of data tampering [10];
- (5)
- Lightweight computing. Lightweight computing is defined as a low-power device being able to quickly analyze and confirm exceptional data or conditions. To tackle this problem, a participant uses lightweight equipment—e.g., Raspberry Pi—to automatically set multiple triggers, thresholds, and rules by the server for detecting and computing exceptions of ingredients and foods [11].
2. Literature Review
- (1)
- The Internet of Things (IoT)-based Applications:
- (2)
- Informational assistance:
- (3)
- To build a blockchain:
- (4)
- To design a data analysis technology:
3. Methods
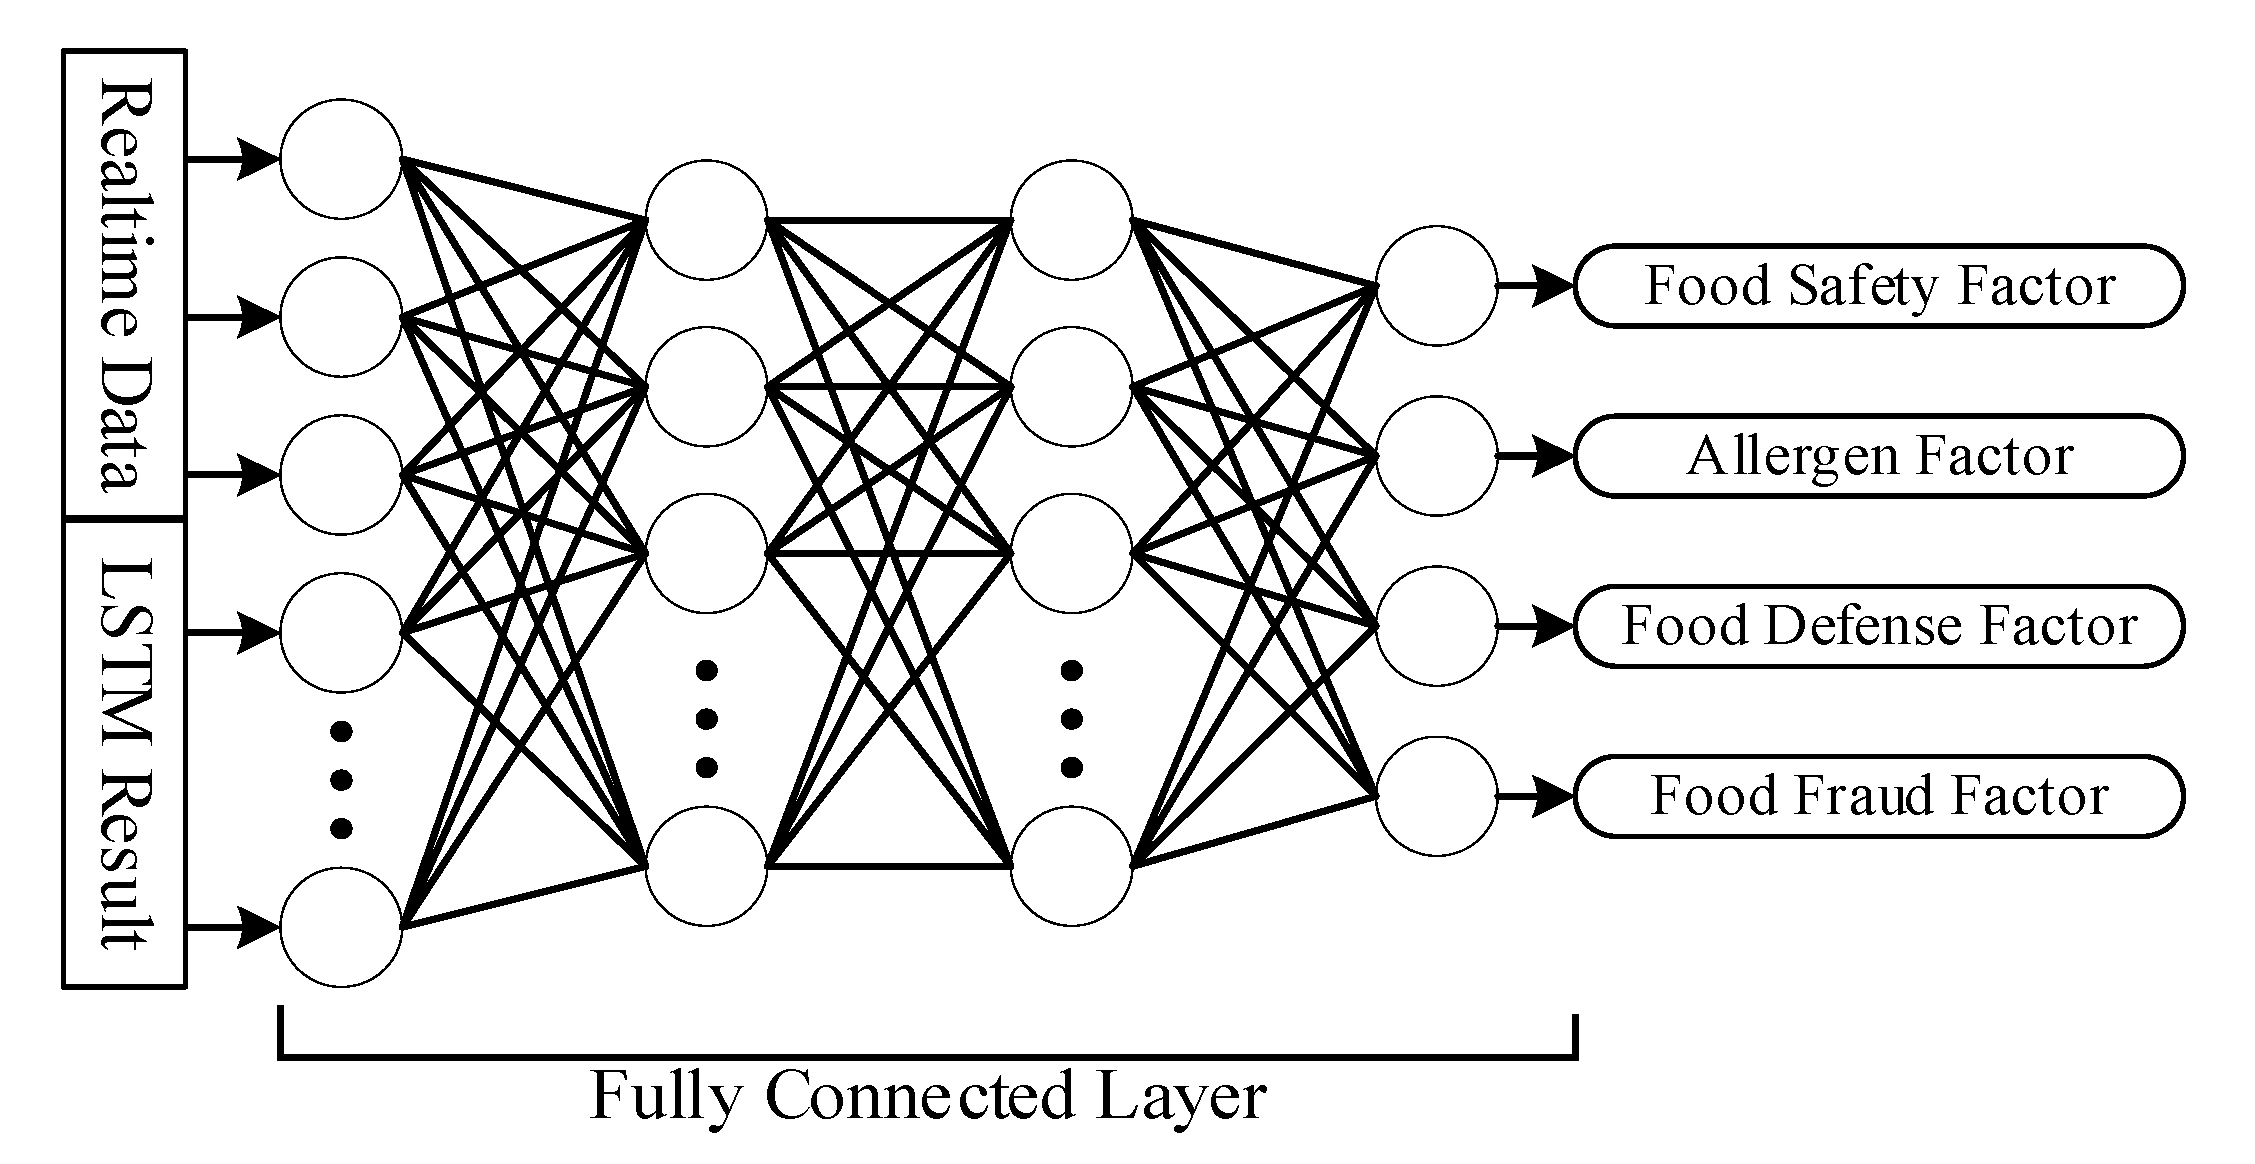
- (1)
- Food safety: To list all hazards in the processes, including acceptance testing of raw materials, processing, manufacturing, packaging, storage, and transportation. This ensures food hygiene and food safety, which can reduce the pathogenic bacteria and prevent food poisoning;
- (2)
- Allergens: In addition to the outer packaging being clearly marked, allergens must be controlled, and sources of allergens must be prevented from cross-contaminating the product;
- (3)
- Food defense: Prevent food from being physically, chemically, biologically, or radioactively contaminated in a deliberate manner;
- (4)
- Food fraud: Manufacturers are prohibited from making fakes, counterfeiting, diluting, false labeling, using raw materials from unknown sources, or making false or misleading claims about products.
3.1. Participants
3.1.1. Consumer
3.1.2. Manufacturer
3.1.3. Accreditation Body and Certification Body
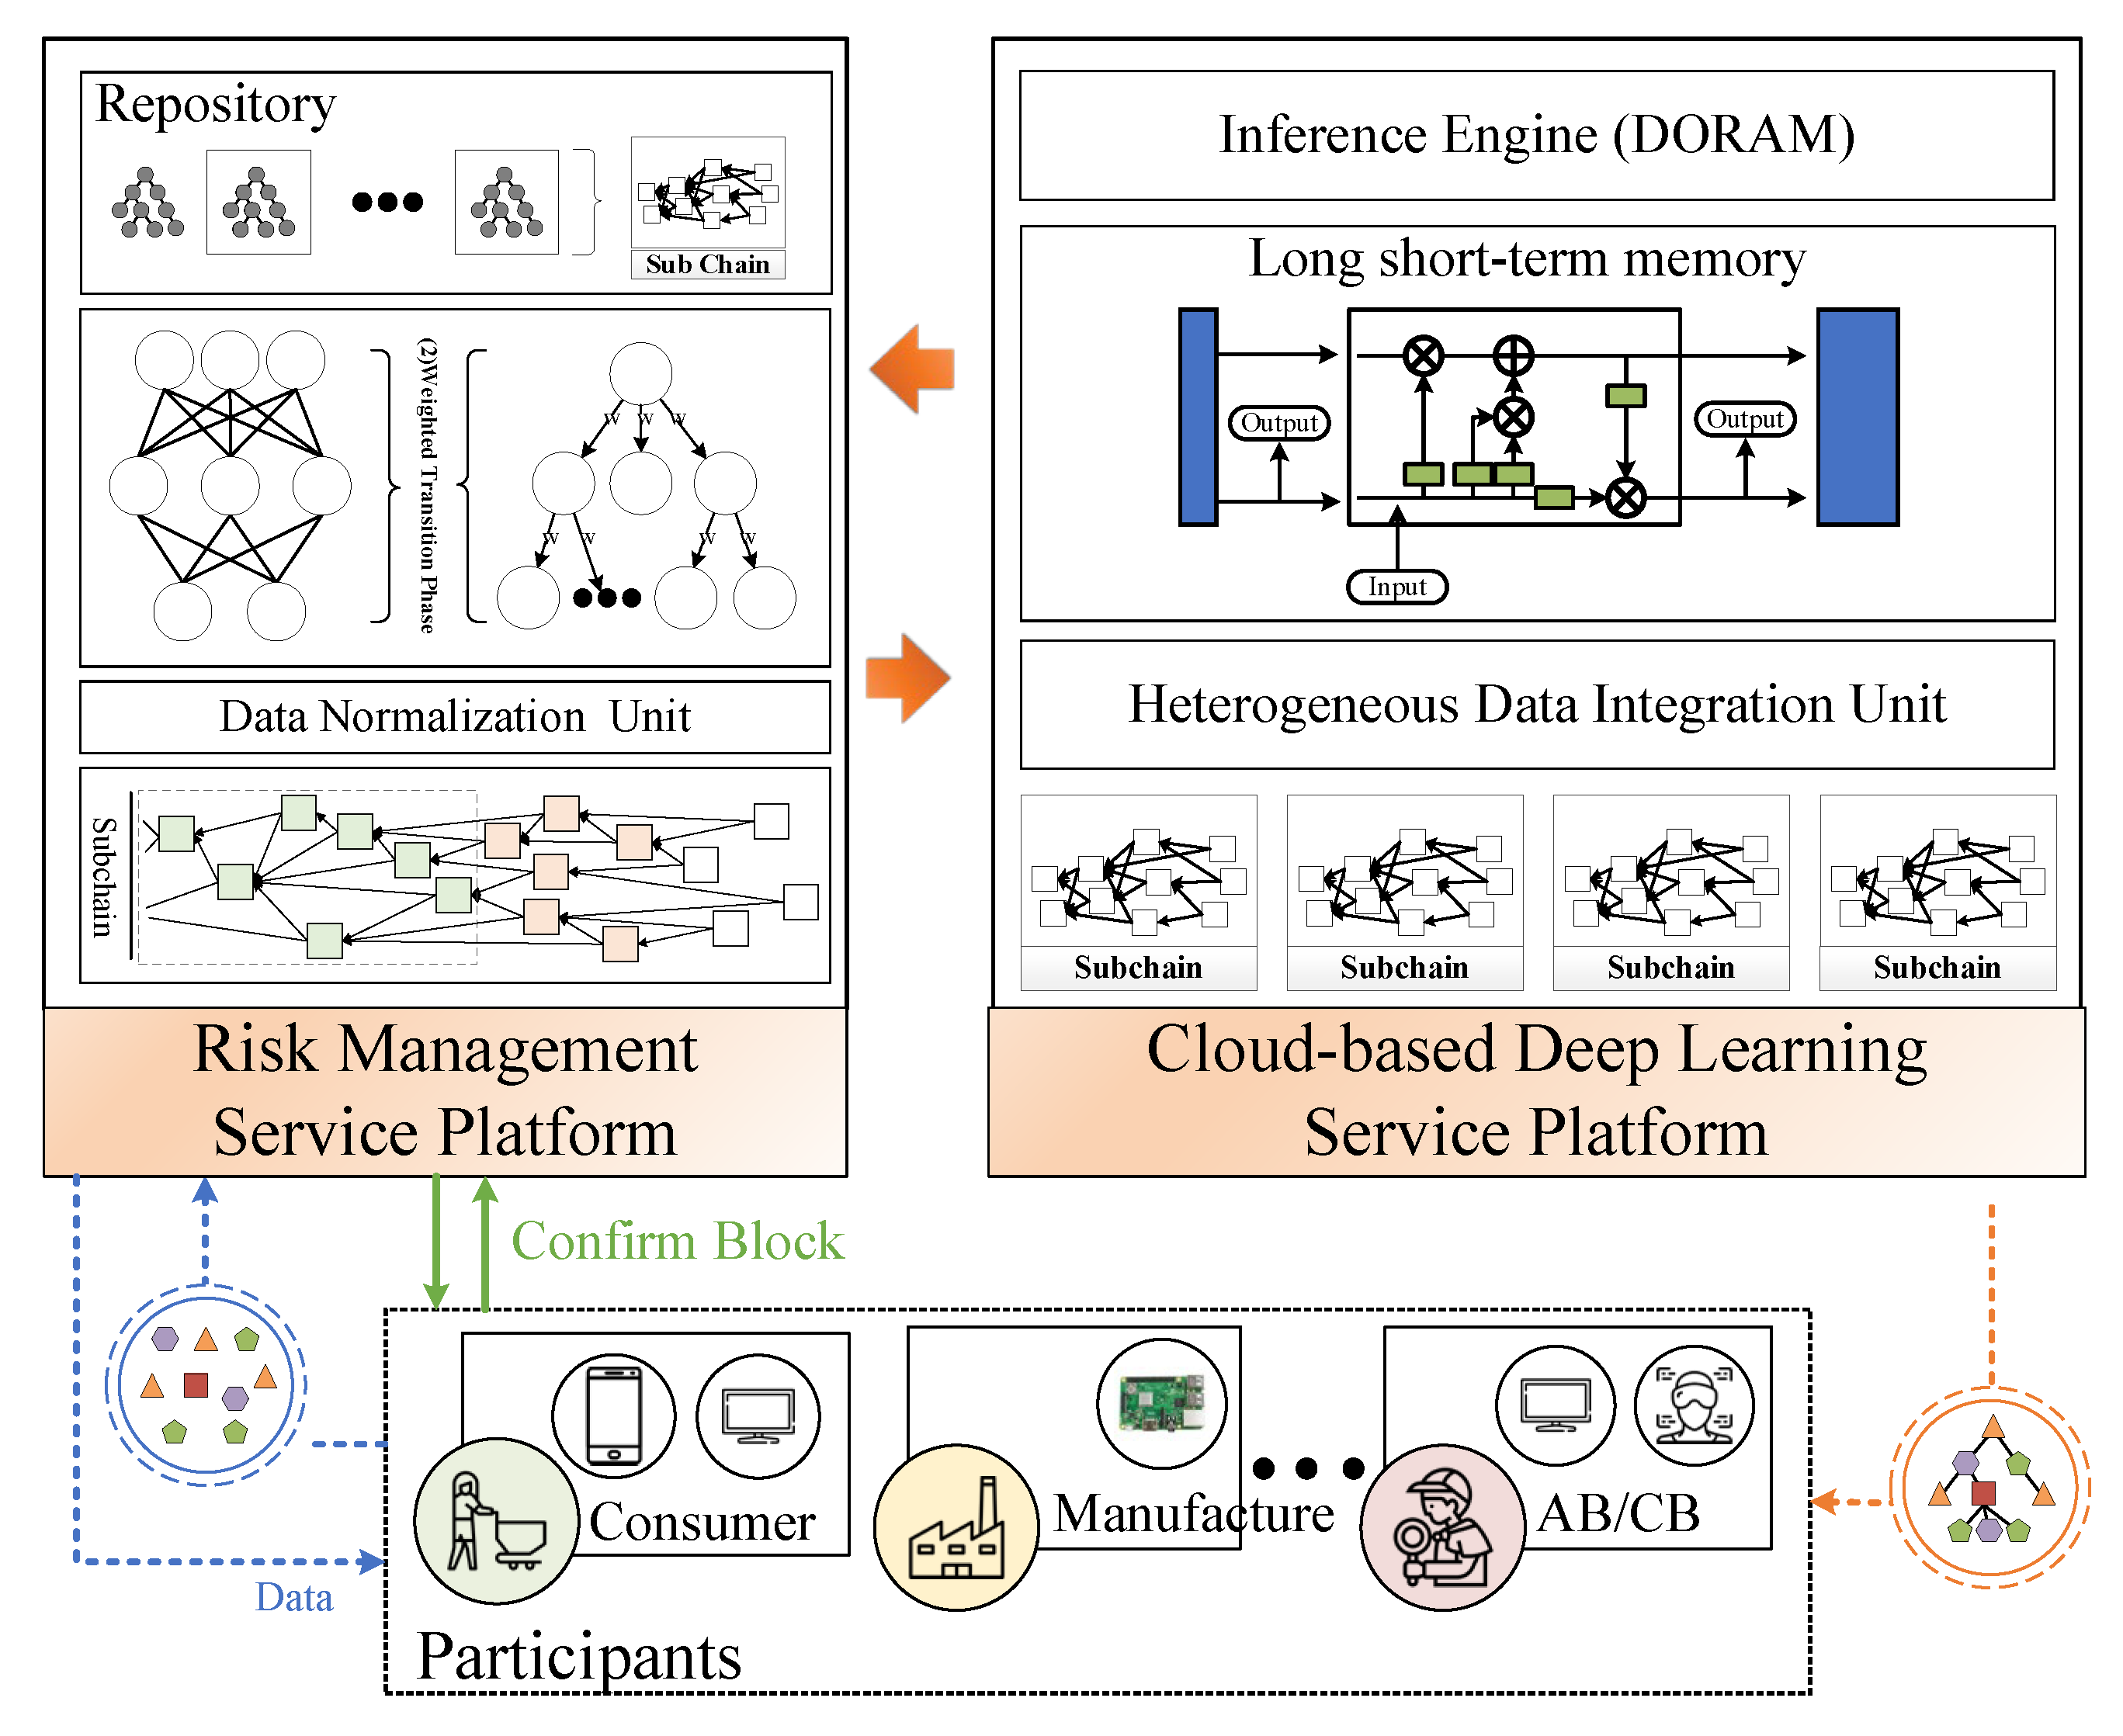
3.2. Risk Management Service Platform
3.3. Cloud-Based Deep Learning Service Platform
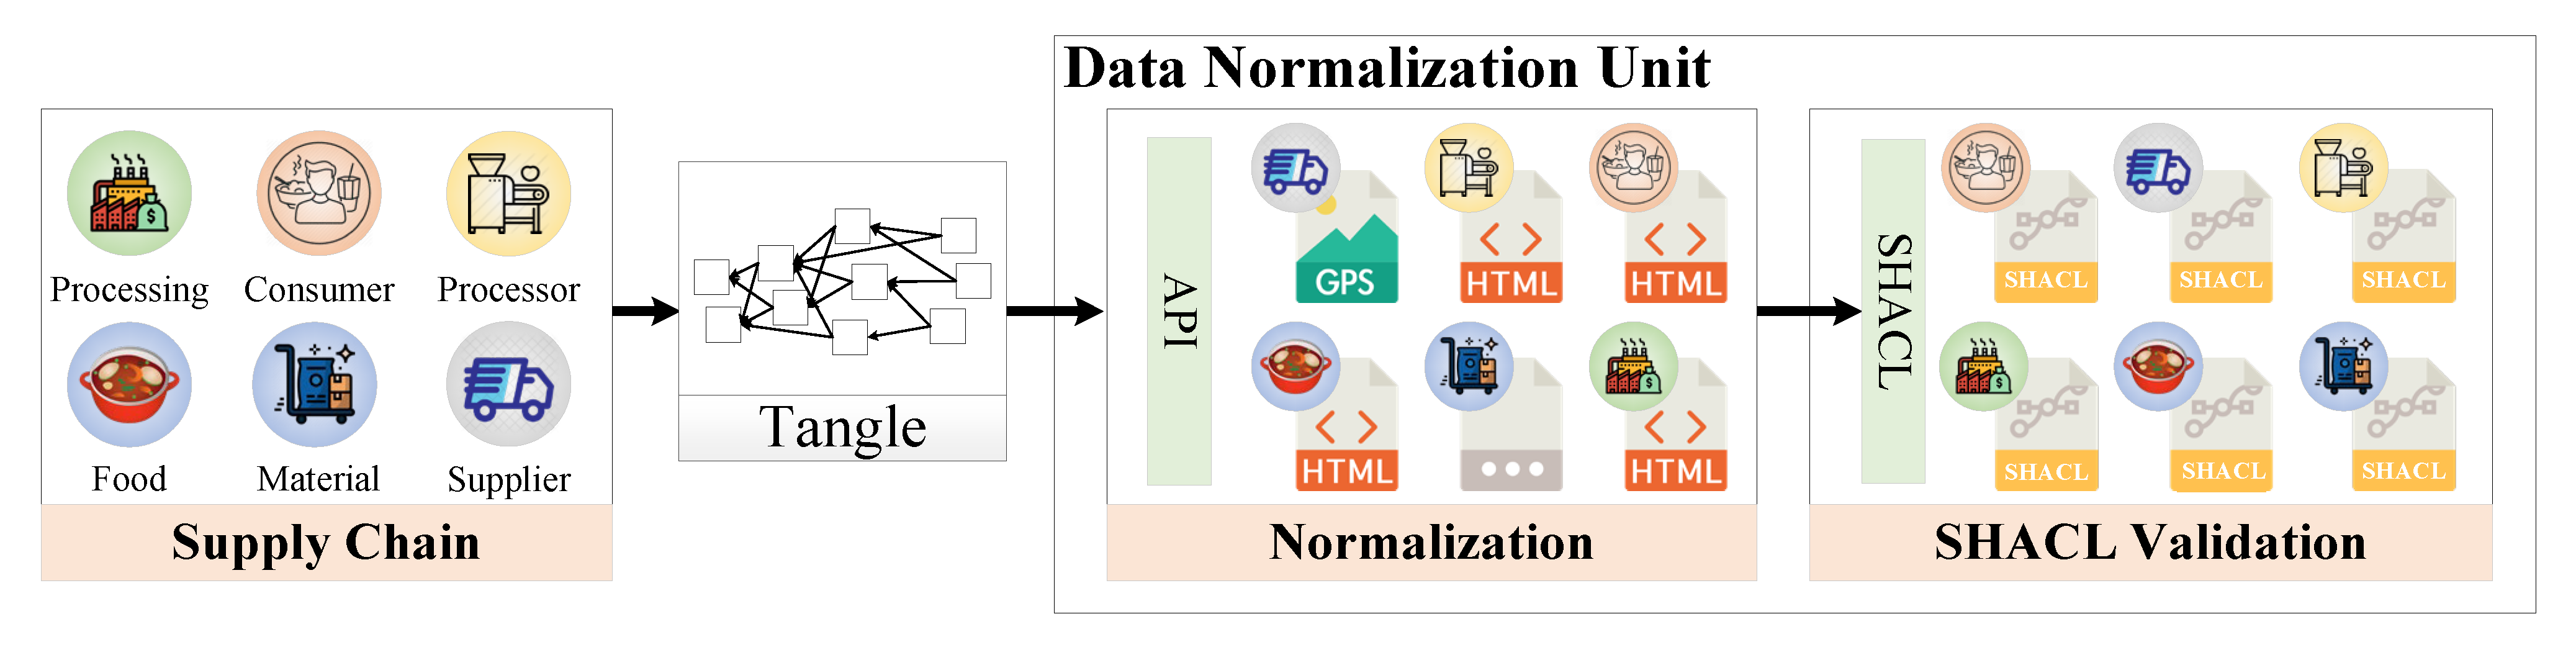
3.3.1. Heterogeneous Data Integration Unit
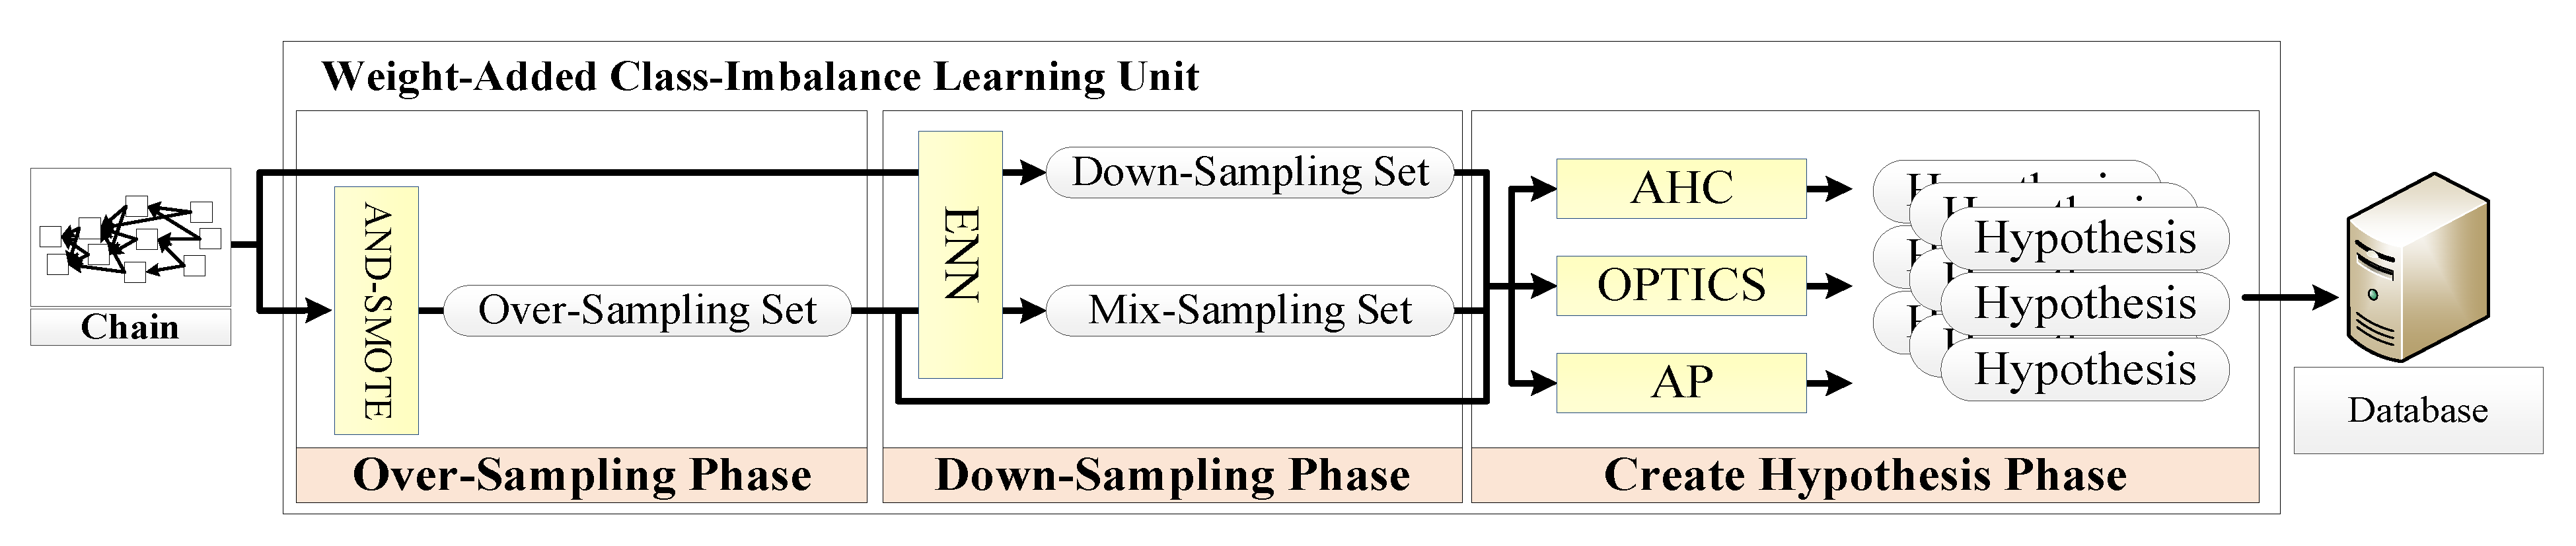
3.3.2. Weight-Added Class-Imbalance Learning Unit
- (1)
- Oversampling phase
- (2)
- Downsampling phase
- (3)
- Create hypothesis phase
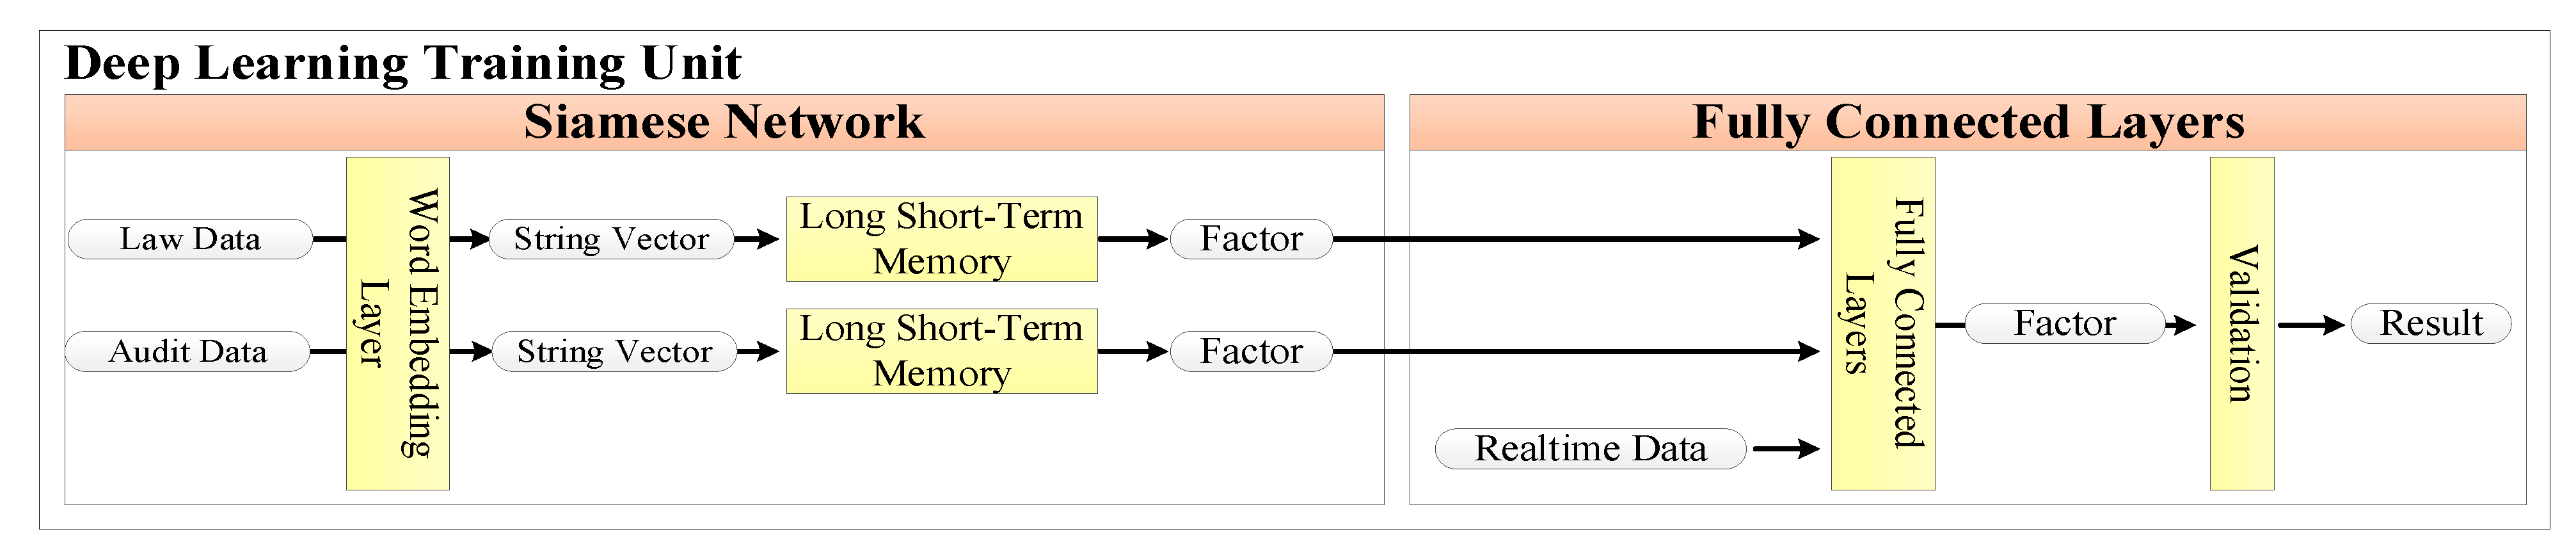
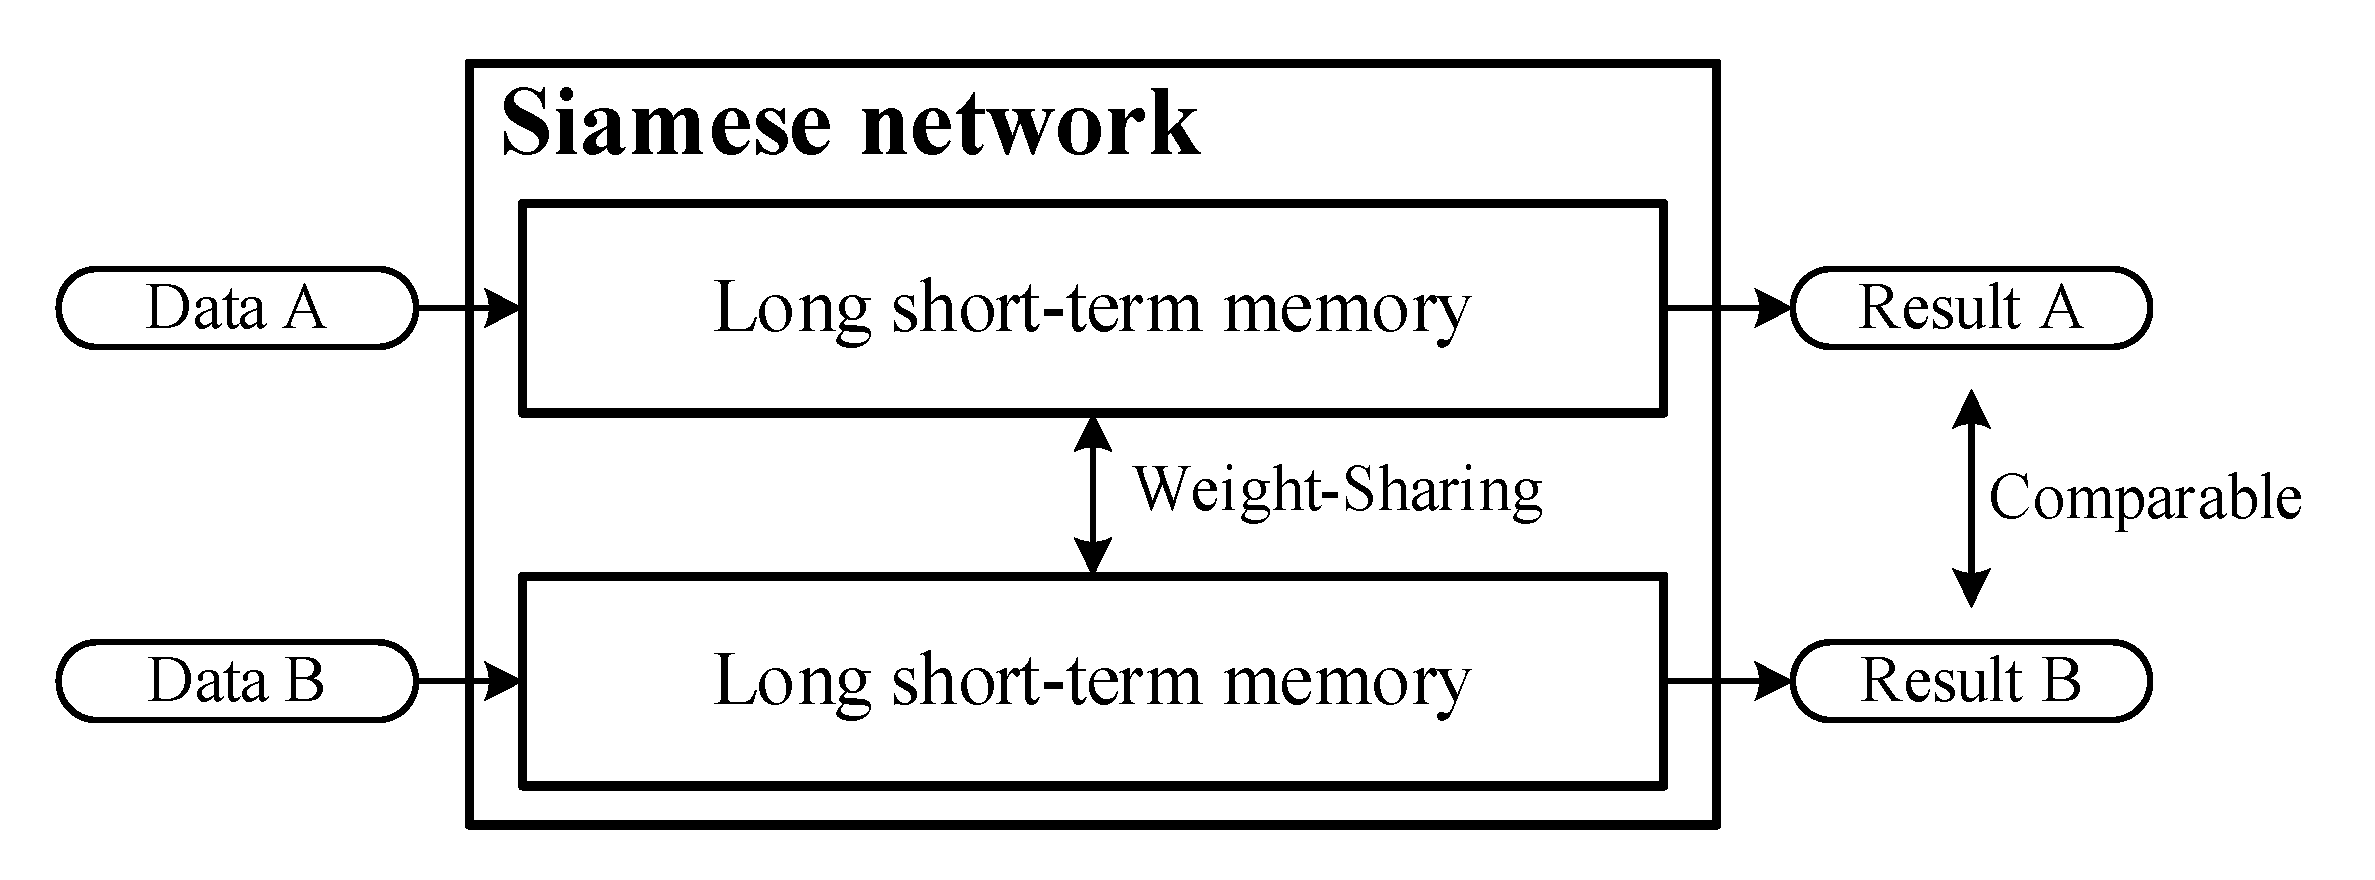
3.3.3. Deep Learning Training Unit
- (1)
- The first step is to decide whether the information needs to be forgotten. This decision is determined by σ—the forget gate—as shown in Equation (14). The value of σ between the previous output and the current input will be between 0 and 1. If ft is 1, it means that the memory is completely retained; if ft is 0, it means that the memory is completely forgotten;
- (2)
- Data will be recorded and updated by the value of σ between 0 and 1 from the input gate. If it is 1, it means complete replacement; if it is 0, it means no replacement is allowed. These processes are shown in Equations (15) and (16). After determining it, is based on tanh() to create a new candidate value and to update the cell state;
- (3)
- Ct is a new state that combines , as described in Equation (17). ft is used to determine the influence of previous memories from the forget gate, as well as to determine the current state of influence from the input gate;
- (4)
- Finally, the hypothesis value h(t) is used to evaluate whether the significant rare data are memorized or forgotten. The detailed formulae are described in Equations (18) and (19):
4. Results and Discussion
5. Conclusions
- (1)
- To develop a verification unit for food safety risk factors. IF4BT is responsible for collecting the manufacturer’s usual production information and internal and external audit information in order to analyze the risk factors.;
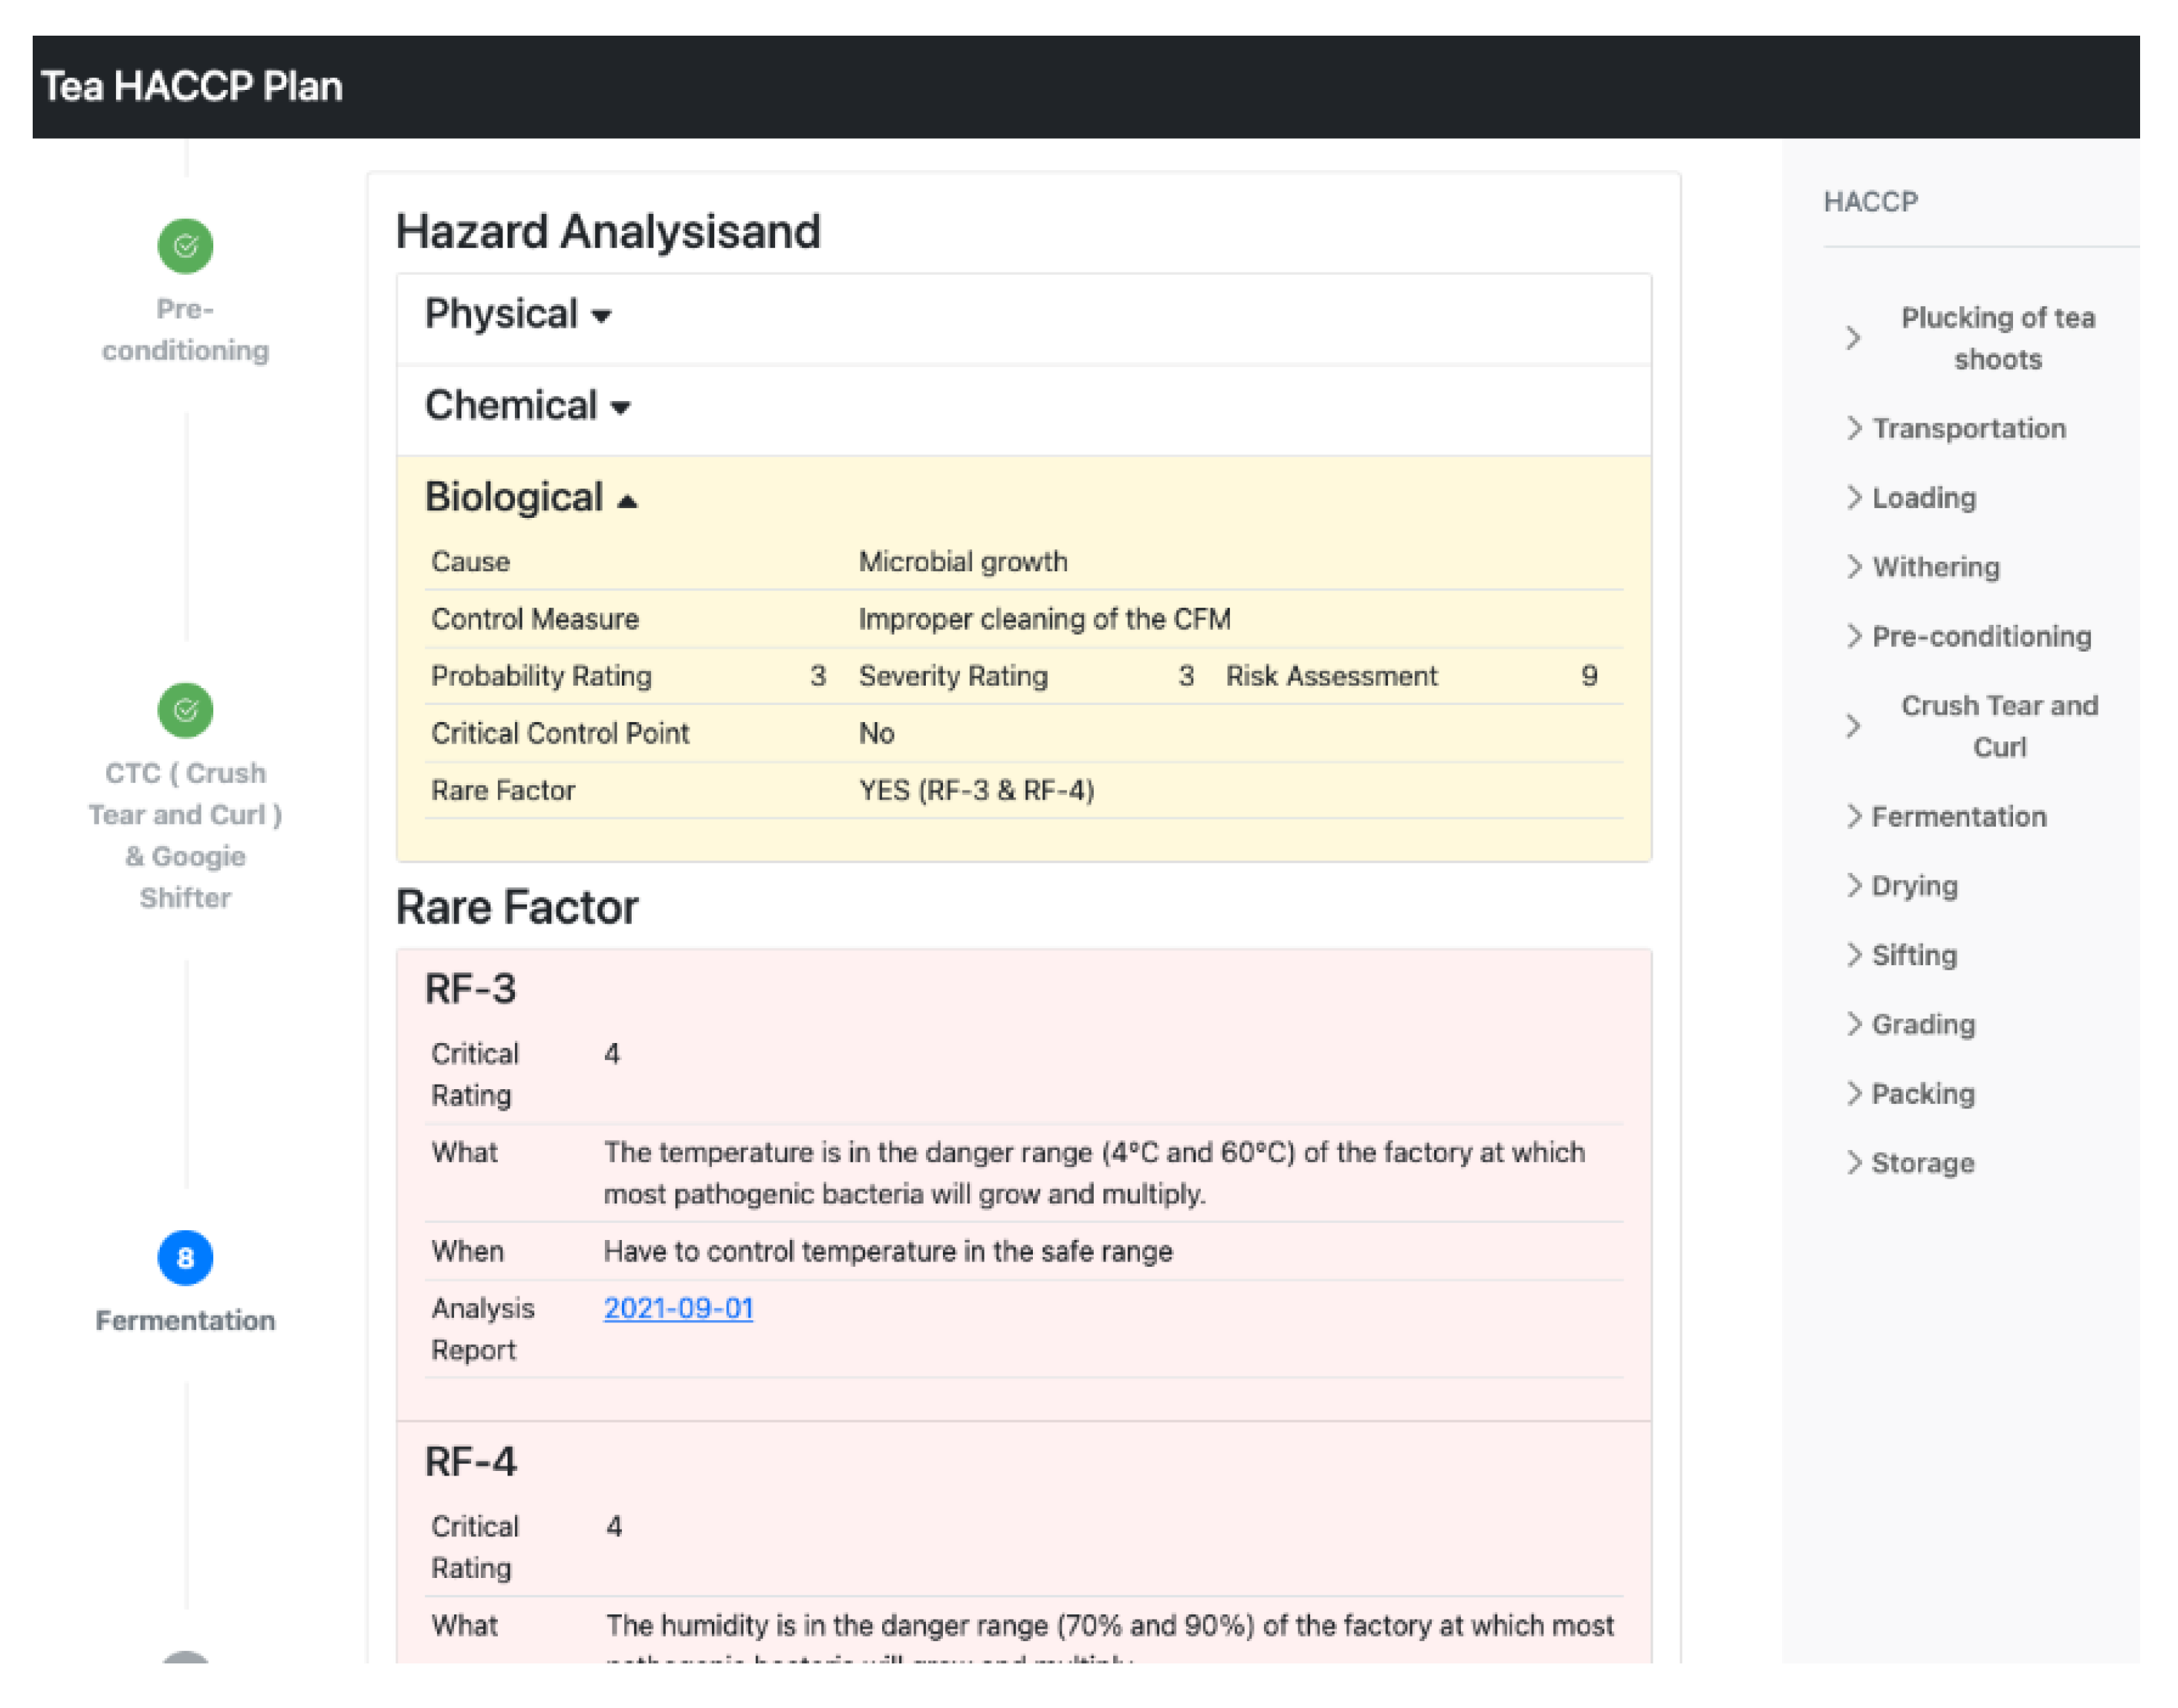
- (2)
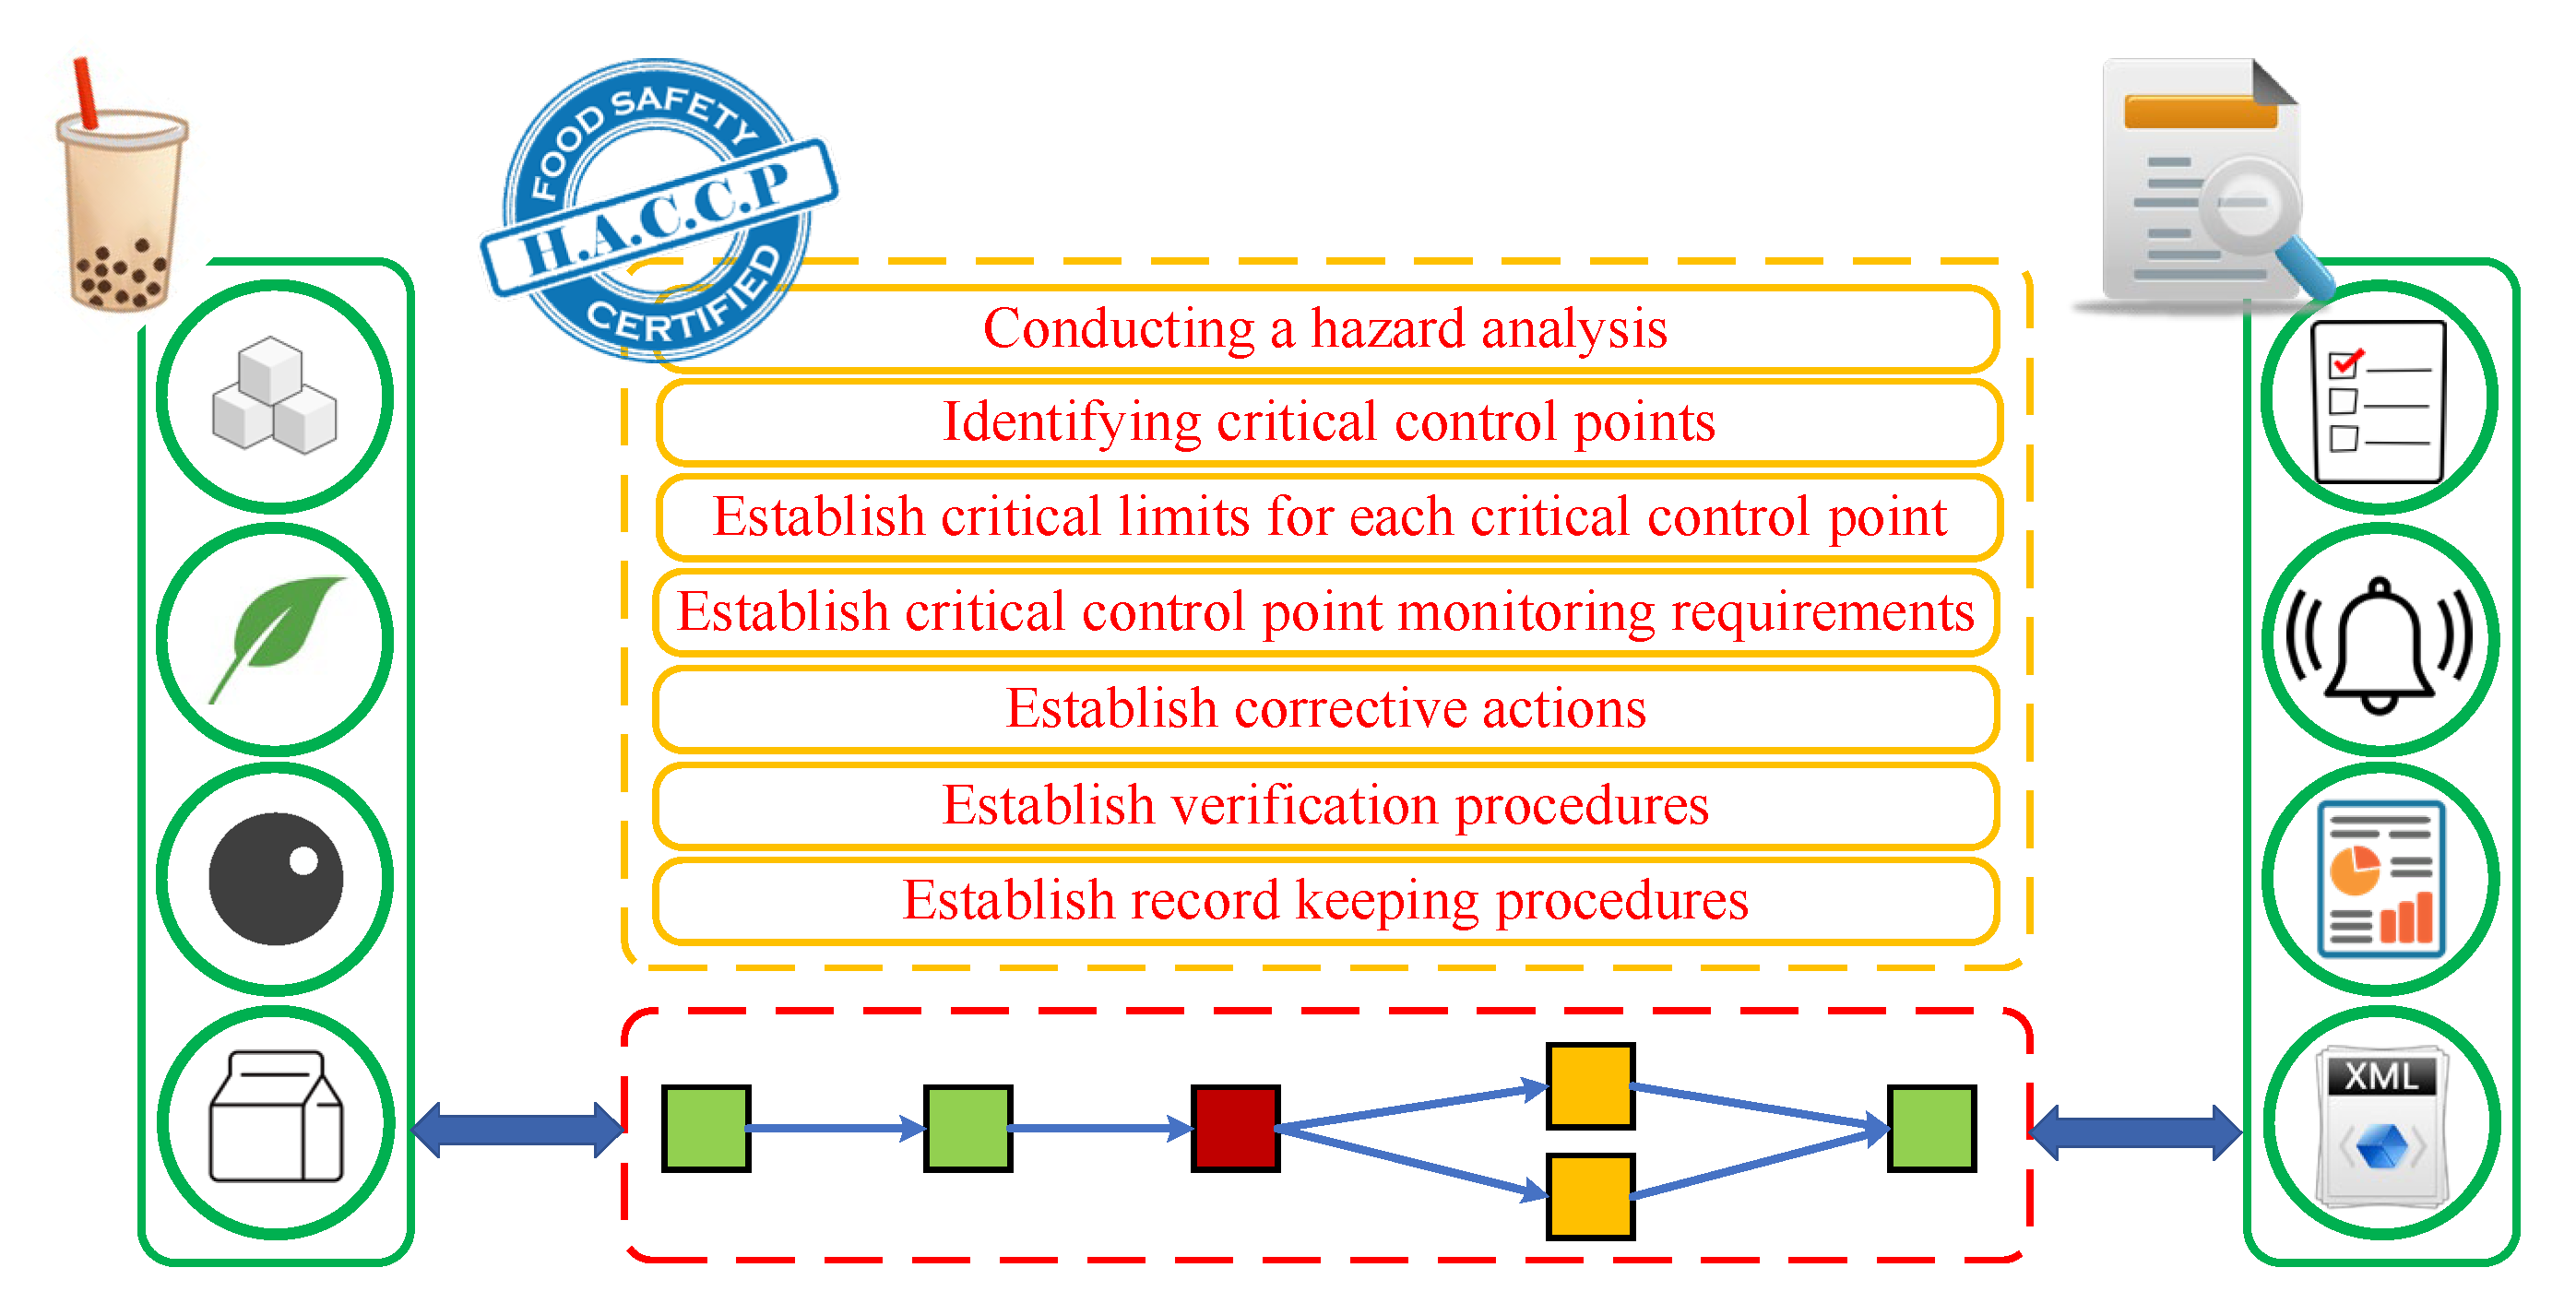
- To construct an HACCP-based food safety management system. It has highly flexible for ISO 22000, FSSC 22000, SQF, and BRCGS;
- (3)
- To design a deep learning inference engine. The inference engine is responsible for identifying the significant rare data of the risk factors for food safety;
- (4)
- To maintain data consistency and transparency. Using the tamperproof mechanism of the IOTA Tangle platform, the internal inspection data are input to the food safety supply chain—including raw materials, production processes, processing, sales, and audit data—on a daily basis in order to ensure the correctness of the information of the food manufacturer. Each check is an audit to increase food safety and reduce food safety issues such as food expiration, food defense, and food fraud.
Author Contributions
Funding
Institutional Review Board Statement
Informed Consent Statement
Data Availability Statement
Acknowledgments
Conflicts of Interest
References
- Anal, A.K.; Perpetuini, G.; Petchkongkaew, A.; Tan, R.; Avallone, S.; Tofalo, R.; Nguyen, H.V.; Ky, S.C.; Ho, P.H.; Phan, T.T.; et al. Food safety risks in traditional fermented food from South-East Asia. Food Control 2020, 109, 106922. [Google Scholar] [CrossRef]
- Walsh, C.; Leva, M.C. A review of human factors and food safety in Ireland. Saf. Sci. 2019, 119, 399–411. [Google Scholar] [CrossRef]
- Duffy, E.W.; Hall, M.G.; Carpentier, F.R.D.; Musicus, A.A.; Meyer, M.L.; Rimm, E.; Taillie, L.S. Nutrition Claims on Fruit Drinks Are Inconsistent Indicators of Nutritional Profile: A Content Analysis of Fruit Drinks Purchased by Households with Young Children. J. Acad. Nutr. Diet. 2021, 121, 36–46. [Google Scholar] [CrossRef]
- Evans, E.W.; Lacey, J.; Taylor, H.R. Development and piloting of a support package to enable small and medium sized food and drink manufacturers to obtain third party food safety certification. Food Control 2021, 127, 108129. [Google Scholar] [CrossRef]
- Dzwolak, W. Assessment of HACCP plans in standardized food safety management systems–the case of small-sized Polish food businesses. Food Control 2019, 106, 106716. [Google Scholar] [CrossRef]
- Chen, H.; Liou, B.K.; Dai, F.J.; Chuang, P.T.; Chen, C.S. Study on the risks of metal detection in food solid seasoning powder and liquid sauce to meet the core concepts of ISO 22000: 2018 based on the Taiwanese experience. Food Control 2020, 111, 107071. [Google Scholar] [CrossRef]
- Bray, T.; Paoli, J.; Sperberg-McQueen, C.M.; Maler, E.; Yergeau, F. Extensible Markup Language (XML) 1.0; World Wide Web Consortium: Cambridge, MA, USA, 2008; p. 5. [Google Scholar]
- Popov, S. The Tangle; IOTA Foundation: Berlin, Germany, 2018; p. 1. [Google Scholar]
- Niya, S.R.; Dordevic, D.; Nabi, A.G.; Mann, T.; Stiller, B. A Platform-Independent, Generic-Purpose, and Blockchain-Based Supply Chain Tracking. In Proceedings of the 2019 IEEE International Conference on Blockchain and Cryptocurrency, Seoul, Korea, 14–17 May 2019; pp. 11–12. [Google Scholar]
- Popov, S.; Moog, H.; Camargo, D.; Capossele, A.; Dimitrov, V.; Gal, A.; Greve, A.; Kusmierz, B.; Mueller, S.; Penzkofer, A.; et al. The Coordicide; IOTA Foundation: Berlin, Germany, 2020; p. 1. [Google Scholar]
- Prajwal, A.; Vaishali, P.; Payal, Z.; Sumit, D. Food Quality Detection and Monitoring System. In Proceedings of the 2020 IEEE International Students’ Conference on Electrical, Electronics and Computer Science, Bhopal, India, 22–23 February 2020; p. 4. [Google Scholar]
- Raju, R.; Bridges, G.E.; Bhadra, S. Wireless Passive Sensors for Food Quality Monitoring: Improving the Safety of Food Products. IEEE Antennas Propag. Mag. 2020, 62, 76–89. [Google Scholar] [CrossRef]
- Zhang, Y.; Ruan, Y.; Liu, F.; Shang, J.; Liu, S. Research on Meat Food Traceability System Based on RFID Technology. In Proceedings of the 2019 IEEE 3rd Information Technology, Networking, Electronic and Automation Control Conference, Chengdu, China, 15–17 March 2019; pp. 2172–2175. [Google Scholar]
- Pal, A.; Kant, K. IoT-Based Sensing and Communications Infrastructure for the Fresh Food Supply Chain. Computer 2018, 51, 76–80. [Google Scholar] [CrossRef]
- Dusenko, S.V. Digital Technology in Ensuring the Safety of Food Services in the Hospitality Industry. In Proceedings of the 2018 IEEE International Conference Quality Management, Transport and Information Security, Information Technologies, St. Petersburg, Russia, 24–28 September 2018; pp. 618–619. [Google Scholar]
- Jing, Z. Application of Information Technology in Food Storage and Transportation Safety Management and Establishment of Information Network Integration Platform for Food Storage and Transportation Safety Management. In Proceedings of the 2018 International Conference on Information Management and Processing, London, UK, 12–14 January 2018; pp. 125–129. [Google Scholar]
- Gallo, A.; Accorsi, R.; Goh, A.; Hsiao, H.; Manzini, R. A traceability-support system to control safety and sustainability indicators in food distribution. Food Control 2021, 124, 107866. [Google Scholar] [CrossRef]
- Todorović, V.; Milić, N.; Lazarević, M. Augmented Reality in Food Production Traceability–Use Case. In Proceedings of the IEEE EUROCON 18th International Conference on Smart Technologies, Novi Sad, Serbia, 1–4 July 2019; p. 5. [Google Scholar]
- Yu, W.; Huang, S. Traceability of Food Safety Based on Block Chain and RFID Technology. In Proceedings of the 11th International Symposium on Computational Intelligence and Design, Hangzhou, China, 8–9 December 2018; pp. 339–342. [Google Scholar]
- Tao, Q.; Cui, X.; Huang, X.; Leigh, A.M.; Gu, H. Food Safety Supervision System Based on Hierarchical Multi-Domain Blockchain Network. IEEE Access 2019, 7, 51817–51826. [Google Scholar] [CrossRef]
- Tian, F. A Supply Chain Traceability System for Food Safety Based on HACCP, Blockchain & Internet of Things. In Proceedings of the 2017 International Conference on Service Systems and Service Management, Dalian, China, 16–18 June 2017; p. 6. [Google Scholar]
- Wahyuni, H.C.; Vanany, I.; Ciptomulyono, U. Application of Bayesian Network for Food Safety Risk in Cattle Slaugtering Industry. In Proceedings of the 2019 IEEE International Conference on Industrial Engineering and Engineering Management, Macao, China, 15–18 December 2019; pp. 450–454. [Google Scholar]
- Dong, Y.; Fu, Z.; Stankovski, S.; Wang, S.; Li, X. Nutritional quality and safety traceability system for China’s leafy vegetable supply chain based on fault tree analysis and QR code. IEEE Access 2020, 8, 161261–161275. [Google Scholar] [CrossRef]
- Hebbar, N. Freshness of Food Detection Using IoT and Machine Learning. In Proceedings of the 2020 International Conference on Emerging Trends in Information Technology and Engineering, Vellore, India, 24–25 February 2020; p. 3. [Google Scholar]
- Hazard Analysis Critical Control Point (HACCP). Available online: https://www.fda.gov/food/guidance-regulation-food-and-dietary-supplements/hazard-analysis-critical-control-point-haccp (accessed on 20 September 2021).
- Finck, M. Blockchain and the General Data Protection Regulation; European Parliamentary Research Service: Brussels, Belgium, 2019; p. 1. [Google Scholar]
- Ferraro, P.; King, C.; Shorten, R. On the stability of unverified transactions in a dag-based distributed ledger. IEEE Trans. Autom. Control. 2019, 65, 3772–3783. [Google Scholar] [CrossRef] [Green Version]
- Kelly, F.P.; Maulloo, A.K.; Tan, D.K.H. Rate Control for Communication Networks: Shadow Prices, Proportional Fairness and Stability. J. Oper. Res. Soc. 1998, 49, 16. [Google Scholar] [CrossRef]
- Abdullah, M.A.; Draief, M. Global Majority Consensus by Local Majority Polling on Graphs of a Given Degree Sequence. Discret. Appl. Math. 2015, 180, 1–10. [Google Scholar] [CrossRef]
- Benjamini, I.; Chan, S.O.; O’Donnell, R.; Tamuz, O.; Tand, L.Y. Convergence, Unanimity and Disagreement in Majority Dynamics on Unimodular Graphs and Random Graphs. Stoch. Process. Appl. 2016, 126, 2719–2733. [Google Scholar] [CrossRef] [Green Version]
- Gärtner, B.; Zehmakan, A.N. Majority Model on Random Regular Graphs. In Proceedings of the 13th Latin American Symposium on Theoretical Informatics, Istanbul, Turkey, 13–15 May 2009; pp. 572–583. [Google Scholar]
- Neudecker, T.; Hartenstein, H. Network Layer Aspects of Permissionless Blockchains. IEEE Commun. Surv. Tutor. 2018, 21, 838–857. [Google Scholar] [CrossRef]
- Szekely, G.; Rizzo, M. Hierarchical Clustering via Joint Between-Within Distances: Extending Ward’s Minimum Variance Method. J. Classif. 2005, 22, 151–183. [Google Scholar] [CrossRef]
- Yun, J.; Ha, J.; Lee, J.S. Automatic Determination of Neighborhood Size in SMOTE. In Proceedings of the 10th International Conference on Ubiquitous Information Management and Communication, Danang, Vietnam, 4–6 January 2016; p. 8. [Google Scholar]
- Batista, G.E.A.P.A.; Prati, R.C.; Monard, M.C. A Study of the Behavior of Several Methods for Balancing Machine Learning Training Data. SIGKDD Explor. 2004, 6, 20–29. [Google Scholar] [CrossRef]
- Wilson, D.R.; Wilson, T.; Martinez, T.R. Reduction Techniques for Exemplar-Based Learning Algorithms. Mach. Learn. 2000, 38, 257–286. [Google Scholar] [CrossRef]
- Wilson, D.L. Asymptotic Properties of Nearest Neighbor Rules Using Edited Data. IEEE Trans. Syst. Man Cybern. 1972, SMC-2, 408–421. [Google Scholar] [CrossRef] [Green Version]
- Day, W.H.; Edelsbrunner, H. Efficient algorithms for agglomerative hierarchical clustering methods. J. Classif. 1984, 1, 7–24. [Google Scholar] [CrossRef]
- Ankerst, M.; Breunig, M.M.; Kriegel, H.P.; Sander, J. OPTICS: Ordering points to identify the clustering structure. ACM Sigmod Rec. 1999, 28, 49–60. [Google Scholar] [CrossRef]
- Frey, B.J.; Dueck, D. Clustering by passing messages between data points. Science 2007, 315, 972–976. [Google Scholar] [CrossRef] [PubMed] [Green Version]
- Hochreiter, S.; Schmidhuber, J. Long Short-Term Memory. Neural Comput. 1997, 9, 1735–1780. [Google Scholar] [CrossRef] [PubMed]
- Chopra, S.; Hadsell, R.; LeCun, Y. Learning a Similarity Metric Discriminatively, with Application to Face Verification. In Proceedings of the 2015 Computer Vision and Pattern Recognition, Boston, MA, USA, 7–12 June 2015; p. 8. [Google Scholar]
- Norouzi, M.; Fleet, D.J.; Salakhutdinov, R. Hamming Distance Metric Learning. In Proceedings of the Advances in Neural Information Processing Systems, Lake Tahoe, NV, USA, 3–6 December 2012; p. 9. [Google Scholar]
- Hagan, M.T.; Demuth, H.B.; Beale, M. Neural Network Design, 2nd ed.; PWS Publishing Co.: Stillwater, OK, USA, 2014. [Google Scholar]
- Kotzamanidis, C.Z.; Arvanitoyannis, I.S.; Skaracis, G.N.; Hadjiantoniou, D.C. Implementation of hazard analysis critical control point (HACCP) to a production line of beet sugar, molasses and pulp: A case study. Zuckerindustrie 2000, 125, 970–977. [Google Scholar]
- Ahmad, I.; Chowdhury, R.S.; Uddin, R.; Shakawat, A.; Rahman, W.U.; Zzaman, W. HACCP Plan and Adoption of HACCP Metasystem in the Tea Industries of Bangladesh. Asian Food Sci. J. 2019, 13, 1–11. [Google Scholar] [CrossRef] [Green Version]
- Tabeen, J.; Yadav, K.C.; Sujit, B. Study of HACCP implementation in milk processing plant at Khyber Agro Pvt. Ltd in Jammu & Kashmir. J. Food Process Preserv. 2016, 7, 610. [Google Scholar]
- Thao, N.T.; Tu, N.T.M.; Liem, N.T.; Huong, N.M.; Pintado, M.; Anh, T.K. Investigation on food safety programs in cassava production at SME level in Vietnam. In Proceedings of the VBFoodNET 2013 Conference, Hanoi, Vietnam, 11 November 2013; p. 7. [Google Scholar]


| Technology | Convenience | Data Consistency | Effectiveness | Scalability | Lightweight Computing |
|---|---|---|---|---|---|
| IoT | V [11,12,13,14] | V [11,12,13,14] | V [12,14] | ||
| Informational Assistance | V [15,16,17,18] | ||||
| Blockchain | V [19,20,21] | V [19,20,21] | |||
| Data Analysis | V [22,23,24] | V [24] |
| Ingredient | Steps | Hazard | Cause/Source | Control Measure |
|---|---|---|---|---|
| Tea [45] | Cultivation | Biological | Disease and insect damage; infections | GLOBAL G.A.P. |
| CTC and Google Shifter | Physical | Metallic contamination | Magnetic arrestor is required | |
| Milk [46] | Pasteurization | Biological | Incorrect temperature or time range in this step | Using thermometer; stainless steel dryer. |
| Sugar [47] | Extraction | Chemical | Residual disinfectant and antifoam to the next stage. | Chemical analysis via GC |
| Crystallization and Centrifugation | Chemical | Heavy metal contamination | Chemical analysis via GC | |
| Drying and Cooling | Chemical | Heavy metal contamination | Chemical analysis via GC | |
| Tapioca balls [48] | Drying | Biological | Insufficient drying leading to the development of microorganisms. | Using thermometer; stainless steel dryer. |
Publisher’s Note: MDPI stays neutral with regard to jurisdictional claims in published maps and institutional affiliations. |
© 2021 by the authors. Licensee MDPI, Basel, Switzerland. This article is an open access article distributed under the terms and conditions of the Creative Commons Attribution (CC BY) license (https://creativecommons.org/licenses/by/4.0/).
Share and Cite
Ku, H.-H.; Chi, C.-H.; Ling, M.-P. Design of an IOTA Tangle-Based Intelligent Food Safety Service Platform for Bubble Tea. Processes 2021, 9, 1937. https://doi.org/10.3390/pr9111937
Ku H-H, Chi C-H, Ling M-P. Design of an IOTA Tangle-Based Intelligent Food Safety Service Platform for Bubble Tea. Processes. 2021; 9(11):1937. https://doi.org/10.3390/pr9111937
Chicago/Turabian StyleKu, Hao-Hsiang, Ching-Ho Chi, and Min-Pei Ling. 2021. "Design of an IOTA Tangle-Based Intelligent Food Safety Service Platform for Bubble Tea" Processes 9, no. 11: 1937. https://doi.org/10.3390/pr9111937
APA StyleKu, H.-H., Chi, C.-H., & Ling, M.-P. (2021). Design of an IOTA Tangle-Based Intelligent Food Safety Service Platform for Bubble Tea. Processes, 9(11), 1937. https://doi.org/10.3390/pr9111937