1. Introduction
Improving a system’s thermal performance is always a consideration in heat transfer. The study and implementation of nanofluids and their synthesis can provide insight into cost-effective methods of drastically improving a system’s thermal performance while presenting relatively few detrimental impacts. The limitations introduced (such as the increase in viscous effects as compared to the pure liquid, which then introduce an added strain on the pumping power for the system) are areas in need of further understanding and improvement. The improvement potential of hybrid nanofluids and new nanofluids grows much more prominent as concentration is increased, as with increases in concentration, an increase in the thermal enhancement often follows.
Jumpholkul et al. [
1] conducted an experimental investigation into the impact of aqueous SiO
2 nanofluids on pressure drop and heat transfer when used in a horizontal tube. For their nanofluid preparation, they conducted a two-stage process to suspend their particles. First, they used commercially available nanoparticles that were then mixed at their target particle concentration and suspended in deionized water, then submerged in an ultrasonic bath for two hours to ensure particle dispersion. Their test section was a tube with a total length of two meters and an internal diameter of 7.1 mm filled with a free swirl generator that acted as a twisted surface to encourage fluid mixture. Over the length of their test section, they applied a heat flux using a DC powered heater that was then insulated using fiberglass cloth. Over the length of the tube, they placed nine thermocouples evenly spaced along the length to measure the temperature of the wall. They had two additional thermocouples, one at the inlet and one at the outlet, to measure the temperature of the water before and after the application of heat flux. They concluded that the inclusion of their SiO
2 nanofluid led to a 545% increase in the Nusselt number when compared to the base fluid on its own.
Attalla [
2] examined the impact of a water-based SiO
2 nanofluid and its resulting impact on heat transfer and friction factor when passed through different conduits at a fixed heat flux. For their nanofluid synthesis, they used commercially available nanoparticles suspended in distilled water and submerged the working fluid in an ultrasonic bath to ensure particle dispersion. The thermophysical properties of the mixture were estimated empirically. Their experimental setup consisted of a heated test section that was then insulated to limit thermal losses to the environment. They placed six thermocouples along the length of the test section with additional thermocouples located at the inlet and outlet of the test section. They also determined the pressure difference across the test’s sections with a pressure loop. They examined the thermal performance of the system by examining the local Nusselt number, they noted that the inclusion of their nanofluid at an optimal concentration of 3 vol.% led to a maximum performance increase of 18.7% when compared to water. However, they noted that, due to the inclusion, the friction factor of the working fluid was increased by 19.6% when compared to the base fluid.
Other nanofluids used in heat enhancement include TiO
2 or titania. Khanlari et al. [
3], in their work, examined the impact of TiO
2 nanoparticles suspended in water when used in a heat exchanger with corrugated thin plates. Their experimental apparatus consisted of test section lines with thermocouples and their steel plates with a corrugation angle of 60°. They used an atmospheric burner to provide the required heat flux for the system. They also carried out a numerical investigation, in which they created their model using Ansys fluent 16 and found that the results from both methods were in good agreement. Their nanofluid did implement a surfactant to ensure particle distribution within the base fluid and to limit any possible sedimentation. They noted that the inclusion of a 2 wt% TiO
2 nanofluid saw an average increase of 6% in the heat transfer coefficient as compared to the base fluid.
Additional research into the impact of TiO
2 was conducted by Mukherjee et al. [
4], in which they examined the impact of five different concentrations varying from 1 wt% to 0.01 wt%. They investigated a commercially available lab-grade nanofluid that was then dispersed in water at varying concentrations. They did not implement a surfactant in their work to ensure nanoparticle stability. They then conducted viscosity measurements and conductivity measurements and noted that their findings were all less than 2.04% of the anticipated results for the examined temperatures. They also examined and measured the pumping power required for each of the different nanoparticle concentrations and developed relations. They noted that TiO
2 nanofluids on their own demonstrated good stability in water and found that lower concentrations exhibited better particle dispersion in the liquid than higher concentration TiO
2 mixtures. They also observed that an increase in nanoparticle concentration resulted in an increase in the thermal conductivity of the nanofluid, noting that, at a certain concentration, the increase in particles present in the working fluids resulted in poor stability.
Other areas of study for the application of nanofluids include flat plate solar collectors, such as the work examined by Bazdidi-Tehrani et al. [
5], in which they conducted a numerical investigation into the impact of TiO
2/water in a ribbed flat-plate solar collector. They noted that the inclusion of the TiO
2 nanofluid resulted in an increase in the efficiency of their system by 10% and that the use of a copper thermofluidic might lead to further enhancement.
Ahmed et al. [
6] also examined the impact of TiO
2 nanofluids. In their work, they examined the impact of nanofluids (suspended in water and suspended with a surfactant) in a car radiator. They noted that, with the inclusion of the nanofluid in a car radiator, the resulting fluid was able to outperform the base fluid in all cases, with an optimal concentration of nanofluid of 0.2% volume and a possible enhancement increase to 47%.
Another nanofluid that is currently being examined for possible improvements to heat transfer is alumina, or Al
2O
3. An example can be seen in the work of Ho et al. [
7,
8,
9] and Hader and Al-Kouz [
10], in which they examined a large range of nanofluid concentrations from 0–10% and a range of applied Reynolds numbers. They used commercially available nanoparticles which they then mixed in water at their desired concentrations for the given experiment. They examined the flow through a circular tube and noted that the use of their nanofluid saw a maximum increase in overall efficiency of 2.84% with a concentration of 10%, noting that the increase in the concentration resulted in an increase in the heat transfer effectiveness ratio.
A next step in examining the possible performance of each nanofluid was to subject them to the same conditions and compare the results. An example of this can be seen in the work of Meisam et al. [
11], who compared the results of Al
2O
3, TiO
2, and SiO
2 nanofluids suspended in water at three concentrations, 0.05, 0.1, and 0.2 wt%. Each of the nanofluids examined were created by suspending commercially available nanofluids and then ensuring the dispersion of particles by submerging the nanofluids in an ultrasonic vibrator. They observed that each of the nanofluids examined saw an increase in the heat transfer coefficient as the concentration of the nanofluid was increased. They noted a maximum 182% increase in the heat transfer enhancement for SiO
2. They also noted that the maximum observed increase in the heat transfer coefficient of each of the nanofluids was observed for 0.1 wt% spare TiO
2, whereas the maximum was observed at 0.1 wt%, suggesting a more ideal concentration. Another example of this can be seen in the work of Bakhti and Si-Ameur [
12]. In their work, they compared the performance of three separate nanofluids (TiO
2, Al
2O
3, and Cu), with each of them suspended in water with varying concentrations from 2–10% volume, all of which were compared to the performance of the base fluid. They implemented an experimental model using the SIMPLE algorithm, which demonstrated that the friction factor of the TiO
2 nanofluid was nearly identical to that of water on its own, with the alumina nanofluid showing only a slight increase in their model, and the copper nanofluid resulting in the largest increase in experienced friction factor. They noted that, as the concentration of each nanofluid increased, the resulting Nusselt number decreased—decreasing the possible enhancement. They found that the TiO
2 nanofluid had the lowest overall Nusselt number, with copper producing the largest.
Alkasmoul et al. [
13] also conducted a comparison between multiple nanofluids. In their work, they compared Al
2O
3, TiO
2, and CuO nanofluids with varying concentrations. They examined forced convection in the turbulent regime and noted that pressure drops in the nanofluids (as the flow rate increased) rose significantly alongside the increase in concentration. They concluded that the nanofluids examined under their conditions were not ideal and did not result in any increase in the possible enhancement of the heat transfer performance. Bioucas et al. [
14] also conducted a comparison of TiO
2, SiO
2, and polystyrene nanoparticles with varied concentrations of up to 0.31 vol.%. They used a steady state parallel-plate heater to ensure that the working temperature was within 298 and 323 K. They compared their numerical model results to their experimental results and found that they were in good agreement. They noted that both their TiO
2 and SiO
2 nanofluids were able to produce enhancement, as compared to water.
Saghir and Rahman [
15] examined the impact of using two distinct nanoparticles suspended in water in an experimental study. In their work, they found that, of their examined nanofluids (consisting of Al
2O
3-Cu, TiO
2-SiO
2, FWCNT-Fe
3O
4, and ND-Fe
3O
4), the best performance was obtained using ND-Fe
3O
4 nanoparticles when suspended in a water-ethylene glycol mix. Arsana et al. [
16] examined a similar nanofluid. In their work, they examined a SiO
2-TiO
2 core-shell nanoparticles at low concentrations in a water/ethylene glycol mixture. Their concentrations varied from 0 to 0.025% mass. They created their own nanoparticles experimentally, unlike most of the above, which used commercially made powders. They then carried out their own analyses on the nanoparticles to determine the size and characteristics of the particles. They noted that, with their overall lower concentration of 0.025%, a maximum increase in the heat transfer effectiveness of 43.75% was achieved without a significant increase in the viscosity of the working fluid.
Hybridization was always the next step to further improve the possible performance offered by different nanofluids. This resulted in the creation of more complicated nanoparticles to offer further enhancement in the thermal performance offered by the resulting nanofluid. An example of this can be seen in the work of Gulzar et al. [
17]. In their work, they examined TiO
2, Al
2O
3, and a hybrid Al
2O
3-TiO
2 nanofluid using Therminol-55 as the base fluid in concentrating solar collectors. They noted that the inclusion of nanofluid in their system resulted in a maximum increase in the thermal conductivity of 8.3% for the hybrid Al
2O
3-TiO
2. They also observed that the inclusion of nanofluid in their collectors presented the possibility of a reduction in the size requirements of the system along with an increase in performance.
Further work with hybrid nanofluids was conducted by Rahman et al. [
18], who examined an Al
2O
3-Cu nanoparticles in water when examined in a rectotrapezoidal enclosure. They conducted a numerical study using COMSOL multiphysics to examine their system. They noted that a lower Rayleigh number resulted in a higher thermal efficiency index for the hybrid nanofluid. They also observed that the use of their hybrid nanofluid resulted in accelerated nanoparticle loading, as a result of which an increase in the rate of heat transfer occurred. This increase led to an increase in the friction factor of the working fluid, which then resulted in higher required pumping power for the system.
Hamid et al. [
19] examined hybrid nanofluids with an investigation into TiO
2-SiO
2 used in conjunction with wire coil inserts. They examined a range of Reynolds numbers from 2300 to 12,000 in their experiment to help identify their possible impact on thermal performance. Their nanofluid was created using commercially available nanoparticles which they then placed in suspension in a water/ethylene glycol mixture with five different concentrations from 0.5 vol.% to 3 vol.%. They noted that their TiO
2-SiO
2 nanofluid at 2.5 vol.% resulted in a 254.4% increase in the maximum heat transfer enhancement as compared to the base fluid. They noted that the friction factor of the nanofluid increased from 1.76 to 6.38 when the wire coil was present in the test section. Ramadhan et al. [
20] also examined a hybrid TiO
2-SiO
2 nanoparticles in a water/EG mixture. They noted that they experienced the largest values of Nusselt number for their 3 vol.% concentration but observed an increase in the friction factor as a result of its inclusion.
Martin et al. [
21] examined a different hybrid nanofluid for their work in a plain heat pipe. They examined a Fe-CuO nanofluid at a 2% mass concentration with 50% contribution of each component. They implemented a surfactant in the aqueous solution to help ensure the nanoparticle suspension in water at a concentration of 0.2% mass. They compared their results to water using the same experimental conditions. They observed a 72.63% increase in the thermal efficiency of the heat pipe compared to distilled water.
3. Results and Discussion
The aim of this experimental study was to examine the performance of multiple nanofluids and hybrid nanofluids and compare their effectiveness to one another using deionized water as a benchmark. The working fluids were all subjected to the same applied heat flux densities, experienced flow rates, and test area. For this work, a three-channel configuration was used with a channel geometry of 0.93 cm height, 0.535 cm in width, and a length of 3.75 cm, and the thickness of the plate where it contacts the heated surface was 0.027 cm thick.
3.1. Surface Temperature Distribution
For this experimental work, the applied heat flux densities remained constant between the different nanofluids as a result of using the AC voltage regulator. The applied heat flux densities were 3.85 W cm−2, 5.17 W cm−2, and 7.51 W cm−2, with three different flow rates implemented (0.1USGPM, 0.2USPGM, and 0.3USPGM). The following temperature distribution plots were a result of the 7 thermocouples located 0.1 cm below the heated surface along the centerline of the block. The y-axis of the plot used the notation of T-Tin, where T is the temperature of that given thermocouple, and Tin represents the temperature measured at the inlet of the test section. The measured inlet temperature was observed to vary between 14.06 °C and 18.65 ℃ for different cases; however, this has been observed previously and was found to be in good agreement with the anticipated results. With the temperature plots, a weak parabolic trend was observable when the nanofluids were examined on their own. However, this parabolic nature grew much more pronounced when the nanofluids were all on a single graph. This parabolic shape, seen in every nanofluid temperature difference, demonstrated that there was an increase in the heat transfer in the inlet and outlet regions of the test section.
Possible sources of losses in this experimental investigation include thermal, in that the housing of the test was made of Delrin, which provided insulation for the heated portion. However, there were still losses even with the insulation provided. Another area of loss was the port for the thermocouples, which were insulated in rockwool. The hole, while small and insulated, could still be a source of thermal losses. Another area of possible deviation may be contamination of the nanofluids. Due to the nature of the study (a comparison between multiple nanofluids), the same apparatus was used for all nanofluids to ensure that the testing environments were as close to identical as possible. After each nanofluid test, the apparatus was cleaned for the next test; however, there will always be a chance of contamination due to fluids or sedimentation left behind in the testing environment. Another area of consideration is sedimentation of the nanoparticles. With nanofluids, there is always a balance between the particles in the fluid. When this balance is disturbed, the particles will agglomerate and fall out of suspension in the working fluid. While this was not observed when the nanofluids were in motion, there was sedimentation observed in the fluids when they were placed into storage after use. With all these areas of possible concern considered, the data was still deemed acceptable and able to offer a better understanding into the behaviour of nanofluids.
3.2. Three-Channel Temperature Distribution
The following figures depict the temperature distributions obtained from the difference in the inlet temperature reading and each thermocouple reading along the test sections length. Each of the figures were obtained from the three-channel experimental data. Initially, each data set was of a parabolic nature with a decrease in the inlet and outlet region—a result of the boundary layer effect which led to an increase in experienced heat transfer in the regions identified.
The boundary layer effect is a result of the interaction of the fluid flow when it enters a channel. Upon entering the channel, a thin layer is formed on the channel walls, and there is an increase in overall fluid flow. Due to the increase in fluid flow, the temperature difference in the thin layer is increased. As a result of this increase in fluid flow and temperature difference, there is a subsequent increase in the experienced heat transfer in this region. Then, as the flow becomes more developed, there is an observable reduction in impact until the flow reaches the fully developed region. The boundary layer thickness is inversely proportional to the local Nusselt number, as noted by Bayomy et al. [
25]. The following table and its fluid physical properties were obtained from literature and can be found in citation [
26,
27,
28].
In
Figure 4, the temperature difference for the 3.85 W cm
−2 case with an applied flow rate of 0.2 USGPM is presented. In this case, it was observable that the temperature differences for the 0.5 wt% and 1 wt% TiO
2 nanofluids were slightly greater than that of the base fluid and resulted in an average increase of 0.15% for the 0.5 wt% TiO
2 and a decrease of −2.23% for the 1 wt% TiO
2. This demonstrated that the nanofluids were in nonideal conditions, as the inclusion of nanofluid often leads to a notable increase in the overall performance (whereas in this instance there was a decrease) as compared to water. Regardless of the poor performance of the TiO
2 nanofluids, the Cu + TiO
2 and TiO
2/SiO
2 nanofluids were both able to offer an average improvement over the base fluid of 12.8% and 16.6%, respectively.
The Reynolds numbers for each of the nanofluids examined are summarized in the table below and were determined using Equation (4) with the values in
Table 1.
where
is the density of the fluid, u is the velocity of the fluid,
De is the characteristic diameter of the channel equal to 1.87 cm, and
is the dynamic viscosity of the fluid.
It is of note that the nanofluids examined were subjected to a range of Reynolds flow regimes, both transitional and turbulent as seen in
Table 2. This Reynolds number was measured at the cross section of all channels. Thus, it decreased as it entered the channels, due to the fluid flow being uniformly distributed between the three channels.
The improvement for each of the nanoparticles examined was evaluated using a percent change calculation, which can be seen in the following, where
Tnf is the temperature of the nanofluid at that stage and
Tw is the temperature of the water under the same conditions.
As compared to
Figure 4, in
Figure 5, it is observable that the temperature difference for water was greater than all the examined nanofluids, showing that the inclusion of the TiO
2, when subjected to an increased heat flux, resulted in an increase in the thermal performance of the fluid. The inclusion of the TiO
2 nanofluid led to decreases in the temperature distribution of 6.5% and 6.92%, on average, for the 0.5 wt% and 1 wt% TiO
2, respectively. This is the first case of flow rate examination wherein the inclusion of the TiO
2 nanofluids resulted in a visible improvement to the thermal performance of the system. Overall, this suggested that, when subjected to an applied heat flux density of 3.85 W cm
−2, the nanofluid was unable to achieve an impactful amount of heat transfer. The difference in performance between the copper hybrid nanofluid and the two concentrations of TiO
2 represented an average difference of 16%. This difference between the two concentrations was significant, showing that the inclusion of the hybrid Cu + TiO
2 had significantly greater impact than the TiO
2 on its own. Lastly, the inclusion of the TiO
2/SiO
2 nanoparticles led to an increase of 2.49% over the copper hybrid, showing that there may be a nanofluid with even more potential than the hybrid nanofluid.
As previously shown in
Figure 6, we noted a further increase in the performance difference between each of the nanofluids. The change in the temperature difference between water and both TiO
2 nanofluids was around 7 °C, whereas, in
Figure 3, the difference was 3 °C on average. This difference represented an increase in the average performance (as compared to water) of 8.9% and 9.25%, respectively, for the 0.5 wt% and 1 wt% TiO
2. Again, the performance of the hybrid nanofluid (as compared to water) was very significant; at an 18.72% decrease in the temperature difference at 0.5 wt%, TiO
2/SiO
2 was able to offer even greater possible enhancement at an average increase of 24.47%.
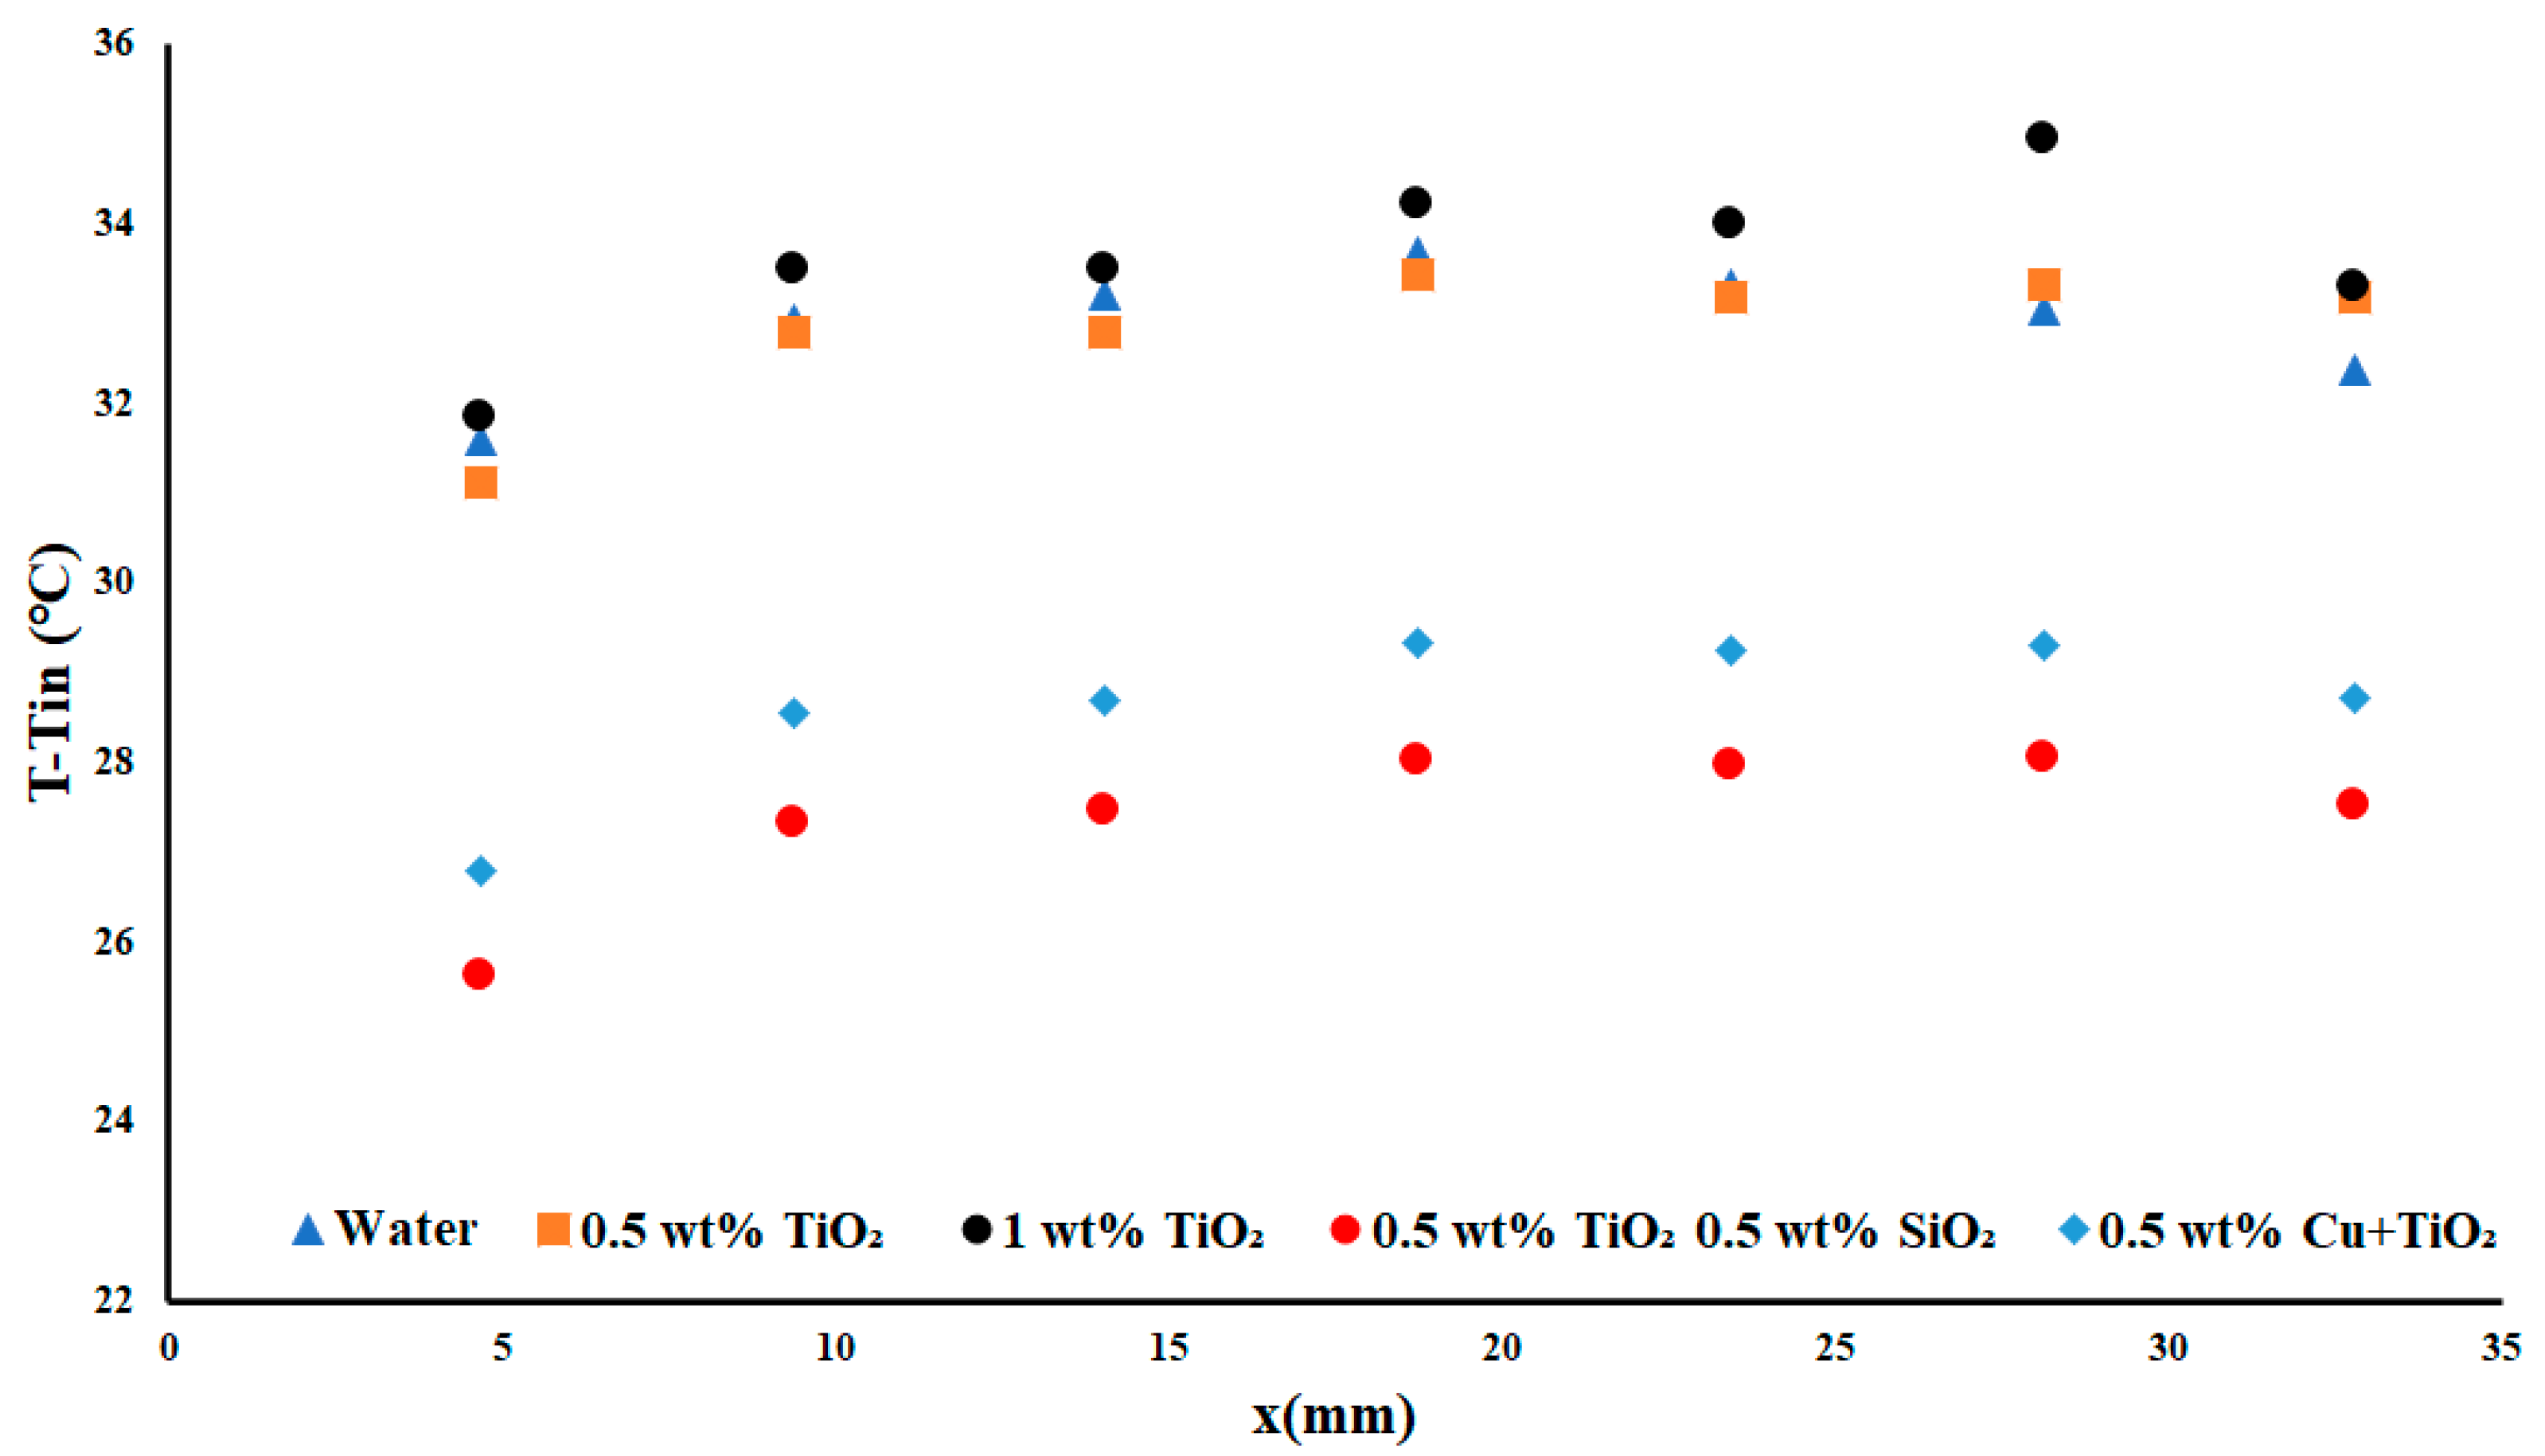
The temperature differences shown in
Figure 7 demonstrated the temperature along the test section for each of the examined nanofluids when subjected to the lowest applied heat flux density of 3.85 watts per square centimetre at the highest fluid flowrate of 0.3 USGPM. We noted that the largest temperature difference between water and 1 wt% TiO
2 was around 3 °C, a difference of 6.92% between the two fluids. The next improvement was of 0.5 wt% TiO
2 over water, at 11.35%, or a 4.43% improvement over the 1 wt% TiO
2. This demonstrated that the ideal concentration of TiO
2 was under 1 wt% for this system. Interestingly, the copper nanofluid was outperformed by the double-monodispersed nanofluid (TiO
2-SiO
2) by a margin of 5.7% for the high-flow, low-applied heat flux density case. When examining all the working fluids in this case, there was an observable decrease in the temperature difference of nearly 10 °C, or 23.43%. This change in temperature difference was deemed significant for a small inclusion of nanoparticles.
An observation of note is that the performance difference between the 0.5 wt% TiO2 nanoparticles and the 1 wt% TiO2 resulted in a significant decrease in the performance as the particle concentration was increased. This was a result of the increase in the particle concentration which, in turn, resulted in an increase in the viscous effects in the working fluid, yielding an overall decrease in the performance. This observation represents a key point of nanofluid experimentation, as an increase in nanoparticle concentration does not always result in an increase in the system performance.
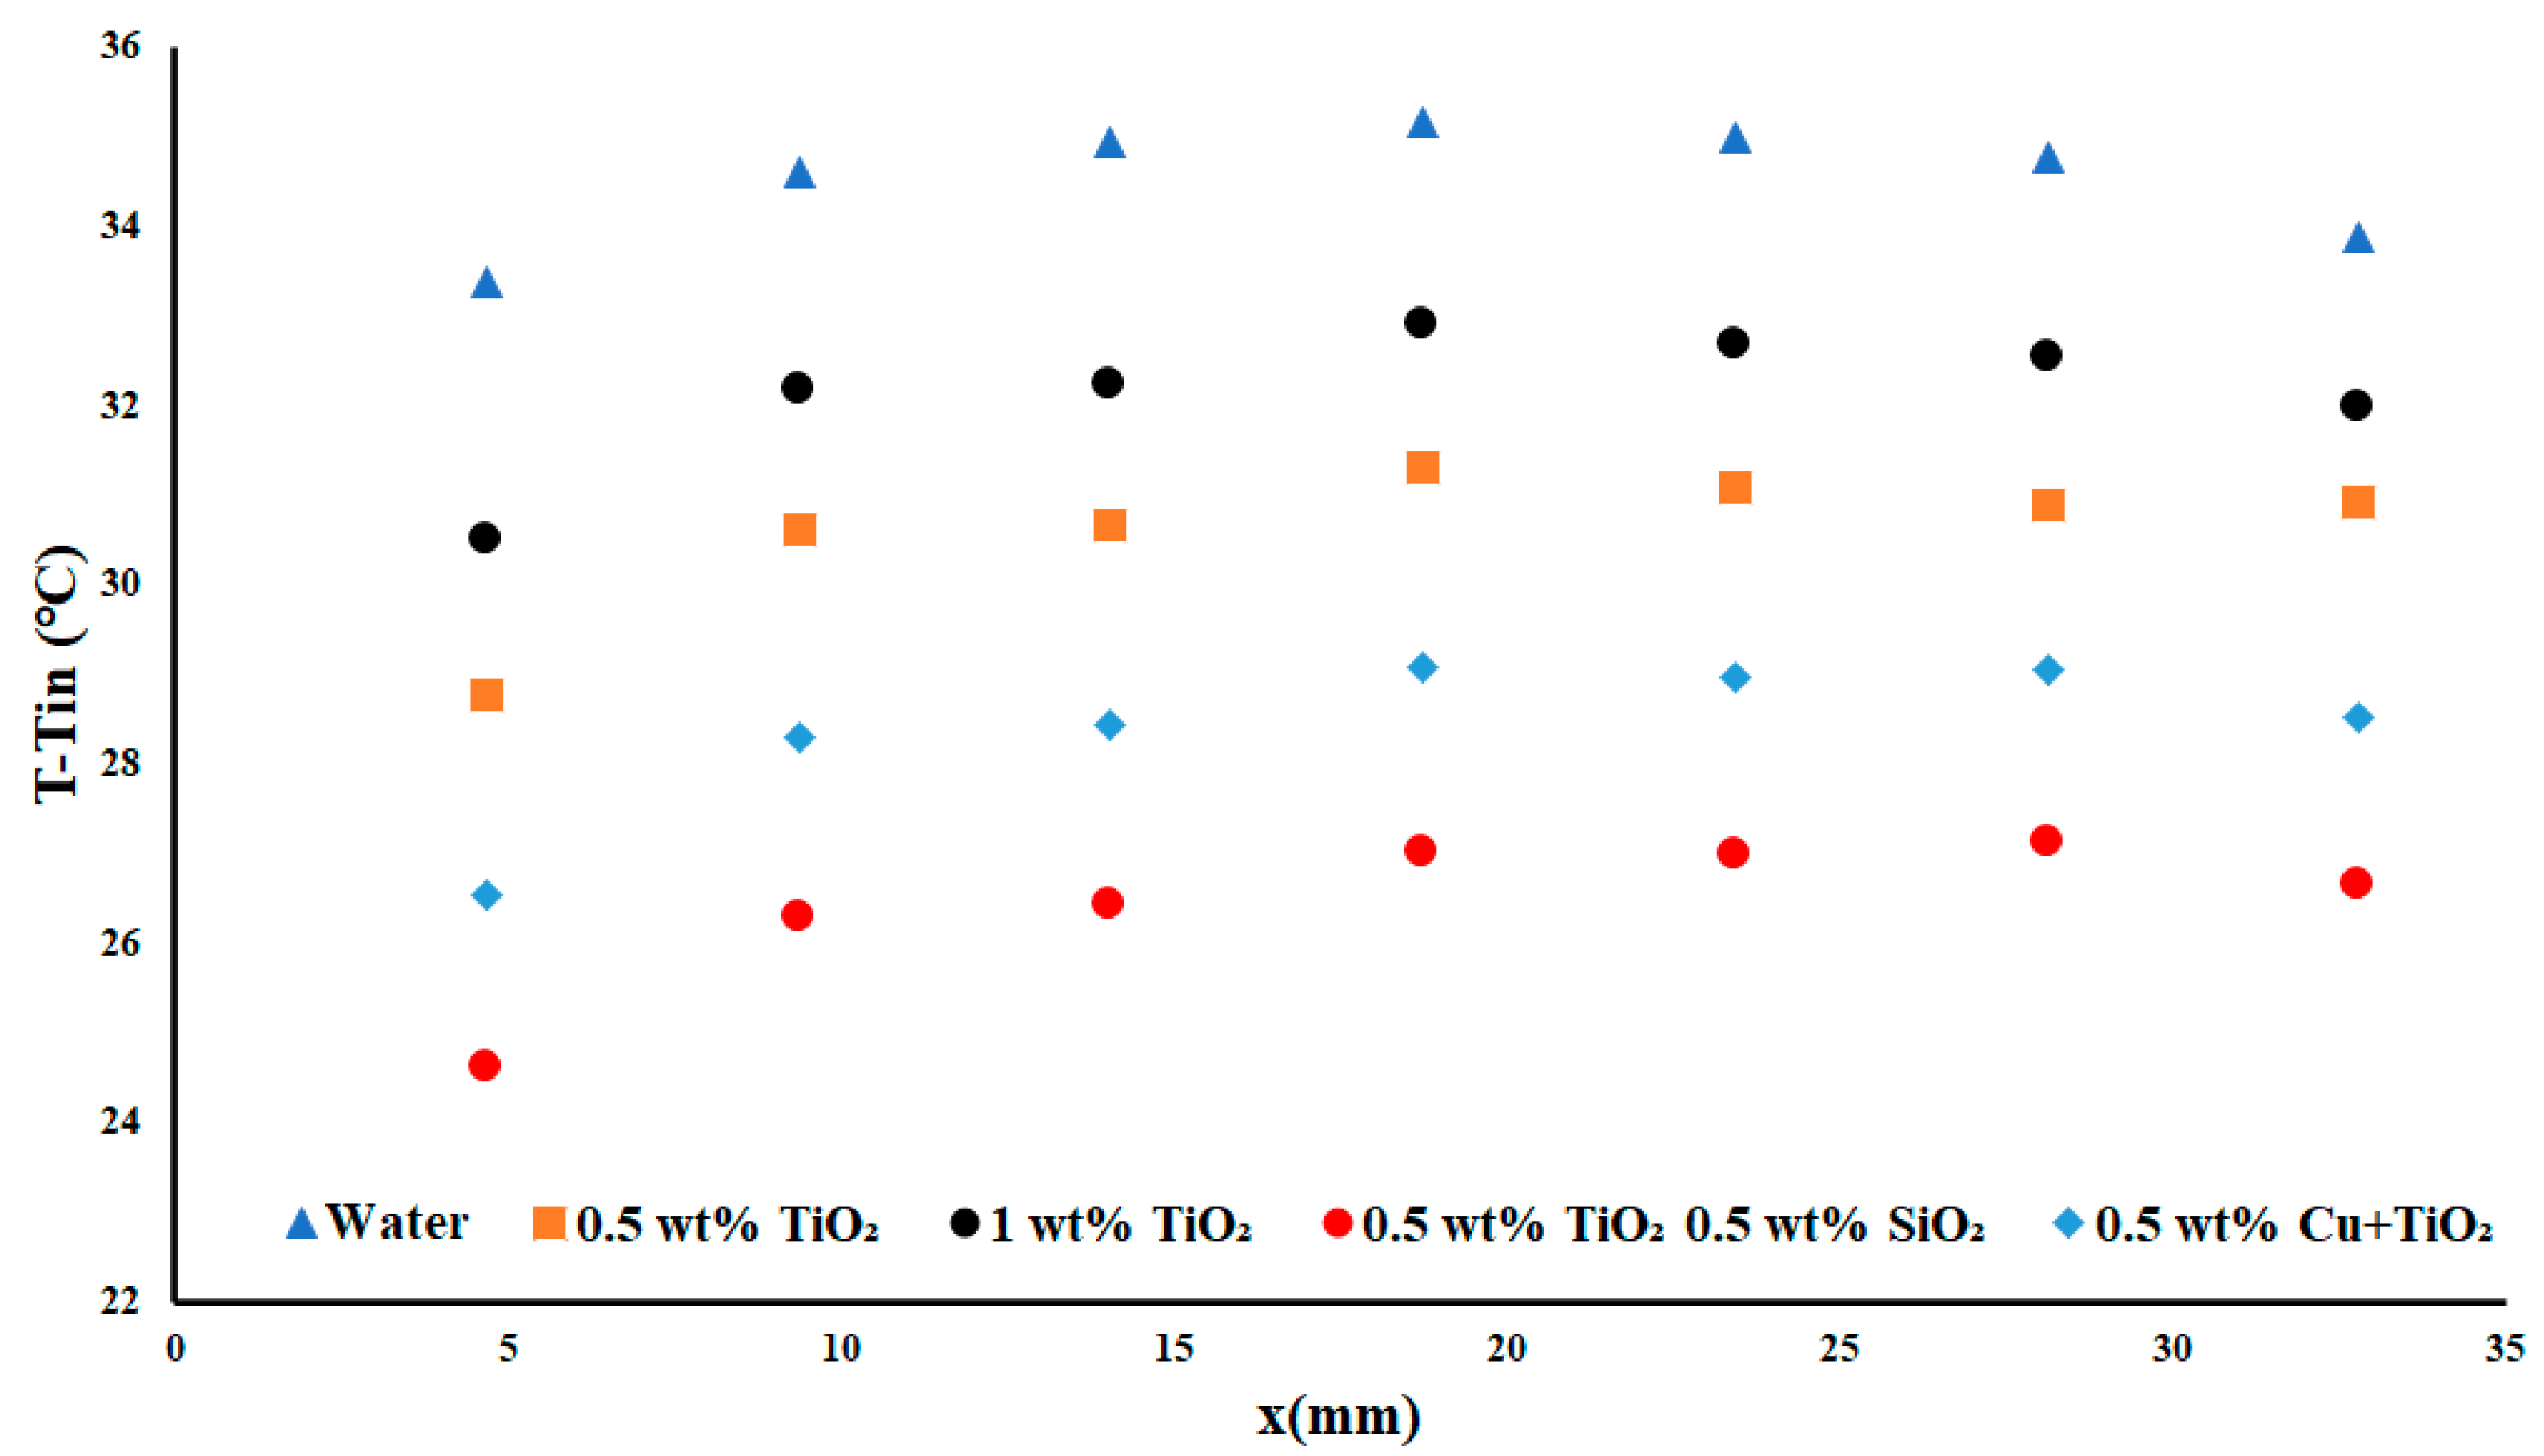
As the applied heat flux density was increased to 5.1 W cm
−2, it was noted that the parabolic shape was maintained along with the temperature difference.
Figure 8 shows that the change between the water temperature difference and that of the first nanofluid increased from the first figure of approximately 3 °C to nearly 5 °C. This increase in the disparity between the water and the nanofluids showed the impact of the nanoparticle inclusion on the experienced heat transfer under the same conditions. Interestingly, the change in the temperature difference between the two concentrations of TiO
2 has essentially been removed—that is to say that they were both performing at nearly the same efficiency, with only a 0.23% difference in their average improvement over water. Copper performed very well but was outperformed by the TiO
2-SiO
2 nanofluid. These results suggested that doubly-monodispersed nanoparticles were better suited for this experiment.
In the above
Figure 9, the highest applied heat flux density case of 7.51 W cm
−2 was presented. The inclusion of TiO
2 at a concentration of 1 wt% led to a decrease in the temperature difference of nearly 10 °C, and a decrease of 25 °C with the highest performing nanofluid. This difference represented a 28.84% decrease in the temperature difference for TiO
2-SiO
2 compared to water. This change in the temperature difference represented a significant improvement, with all nanofluids showing an average improvement ranging from 6.92–28.84% for the highest flow and applied heat flux density cases.
3.3. Local Nusselt Number
A common method for determining the experienced heat enhancement is through the use of the local Nusselt number. To determine the degree of enhancement, the variation of the local Nusselt number along the length of the test section and how the Nusselt number changes with position with a known heat flux density must be measured. For this work, the local Nusselt number was determined through the hydraulic diameter, which was determined to be
De = 0.01879 m, as a product with the convective heat transfer coefficient (W/m °C) over the conductivity of water
kw (W/m/K). The equations below display the formulation for the Nusselt number and that of the heat convection coefficient.
The following figures show the local Nusselt number over the length of the test section for each of the examined nanofluids. When the working fluid enters the channels, there is an increase in the experienced heat transfer in that region as a result of the boundary layer effect.
Figure 10,
Figure 11,
Figure 12 and
Figure 13 depict the 0.2 and 0.3 USGPM flow rate cases for the three-channel heat exchanger with a range of applied heat flux densities.
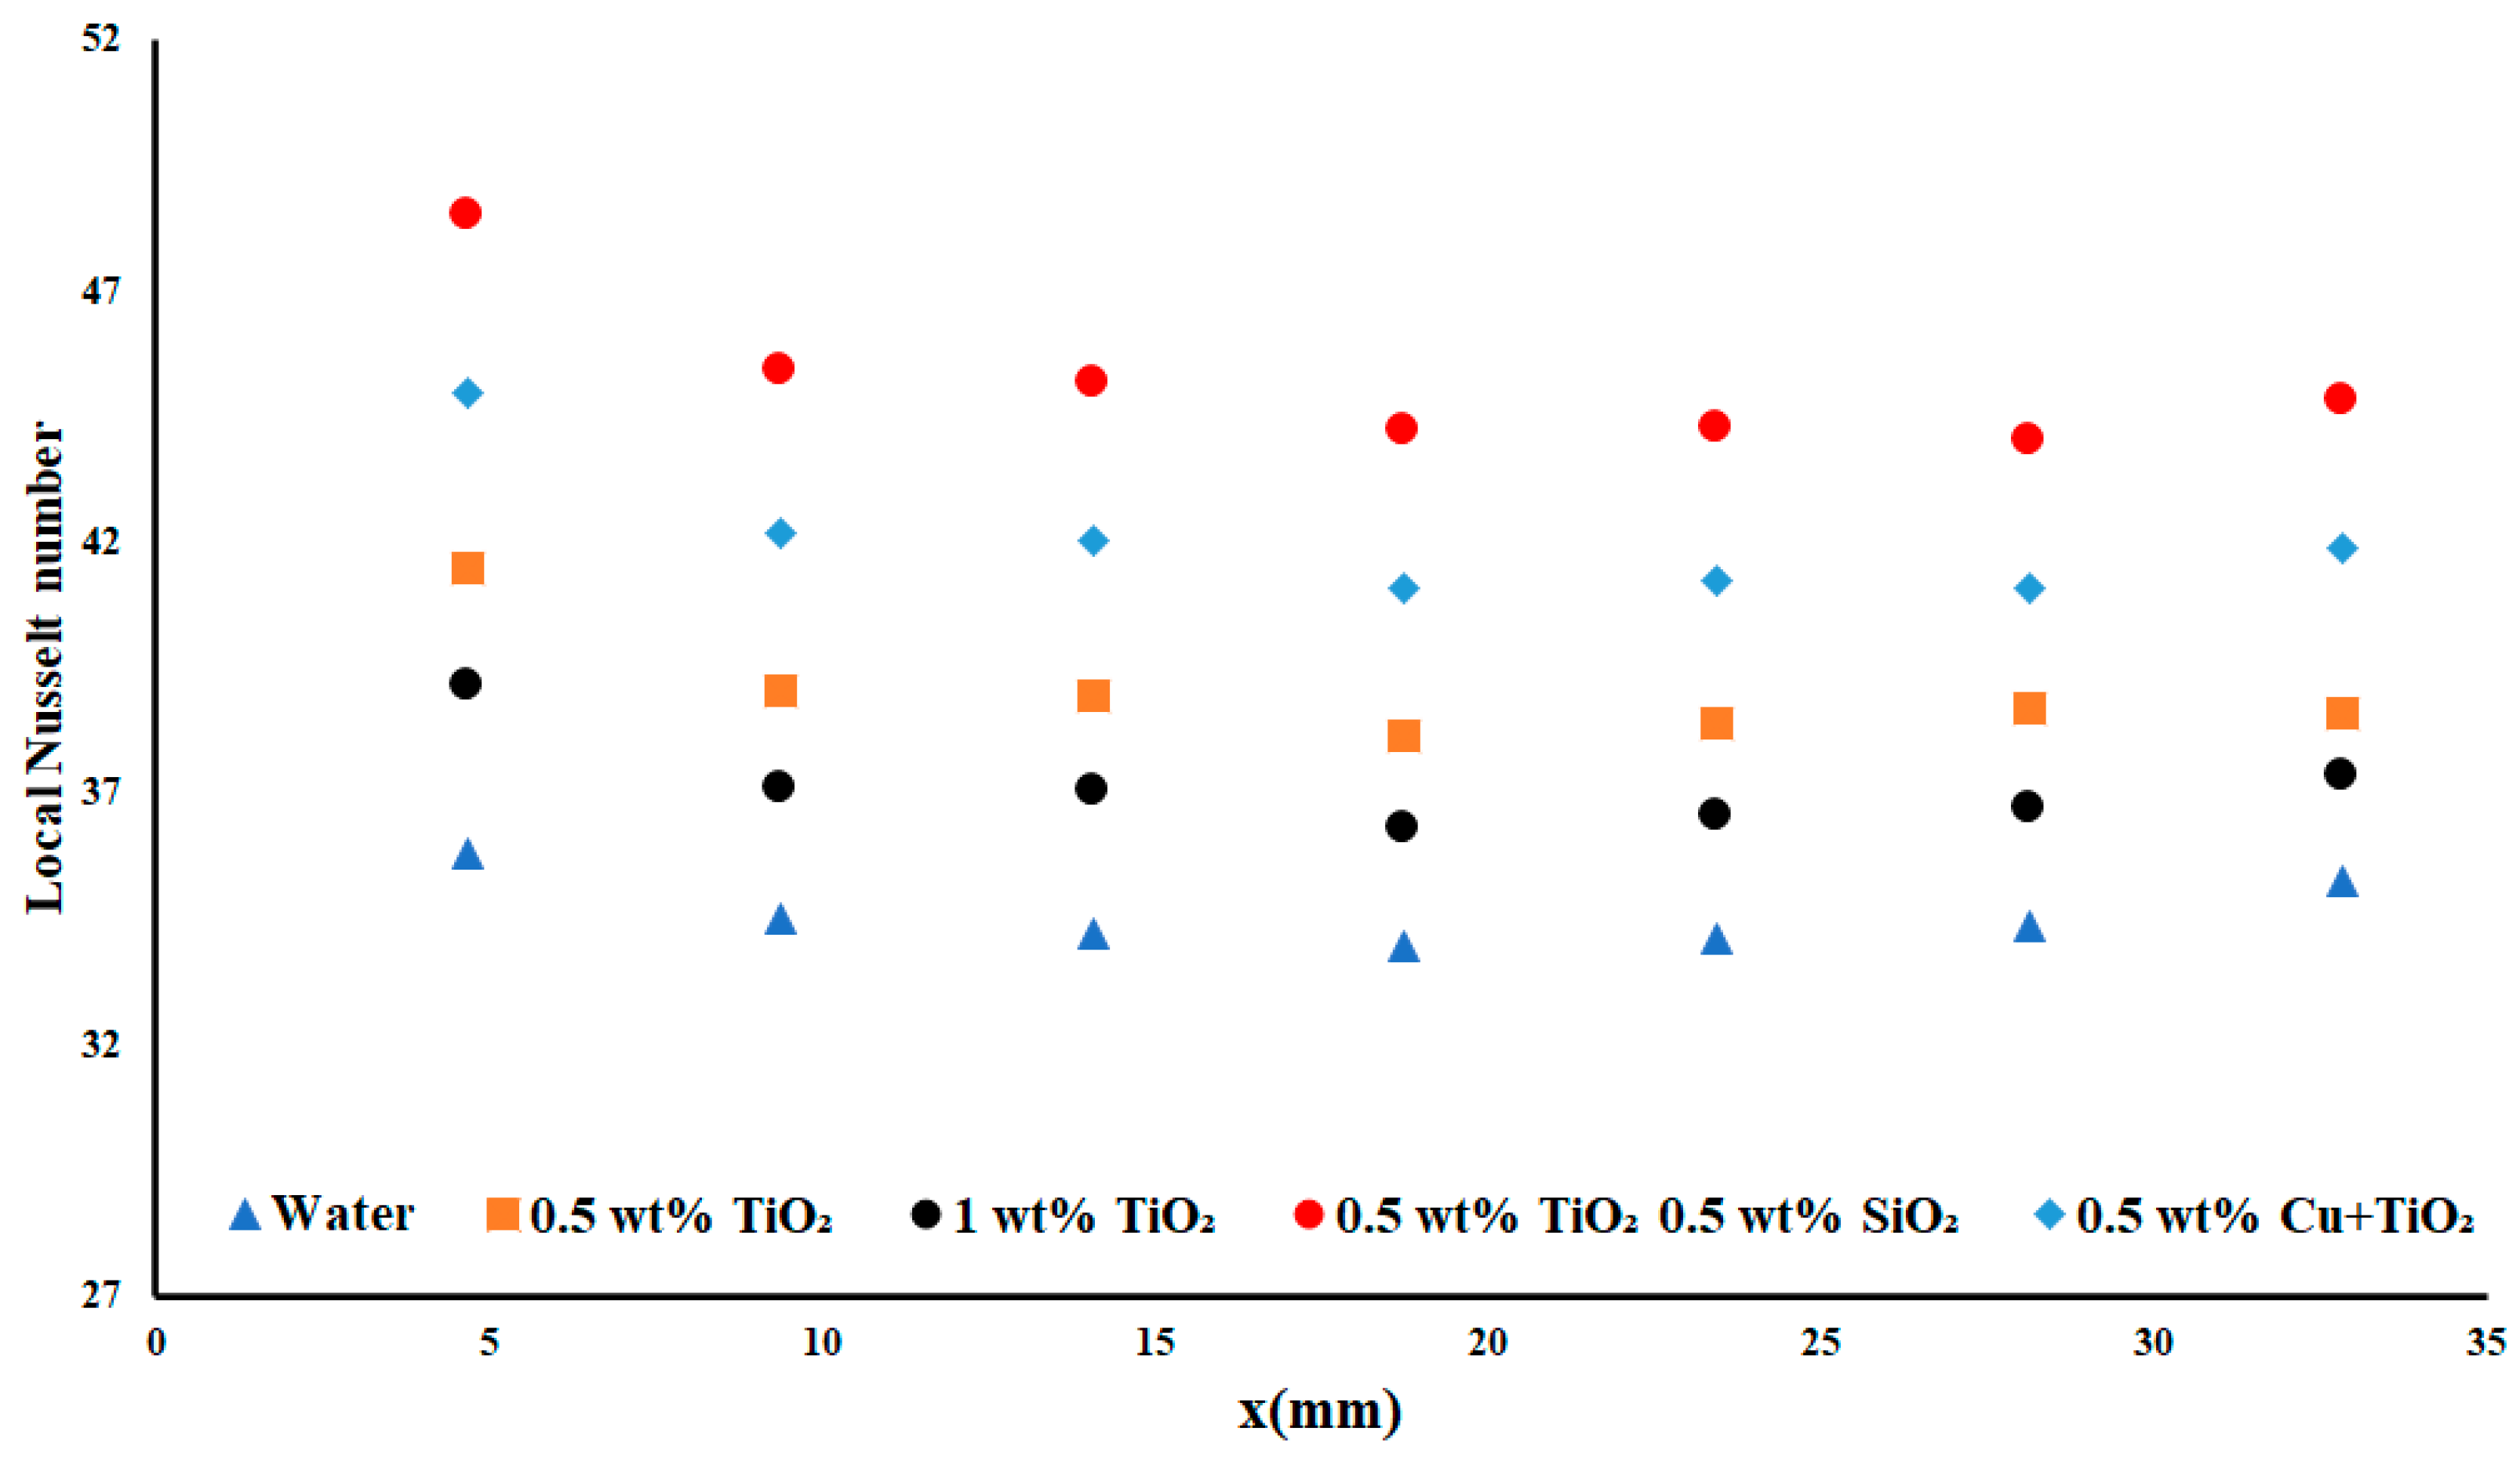
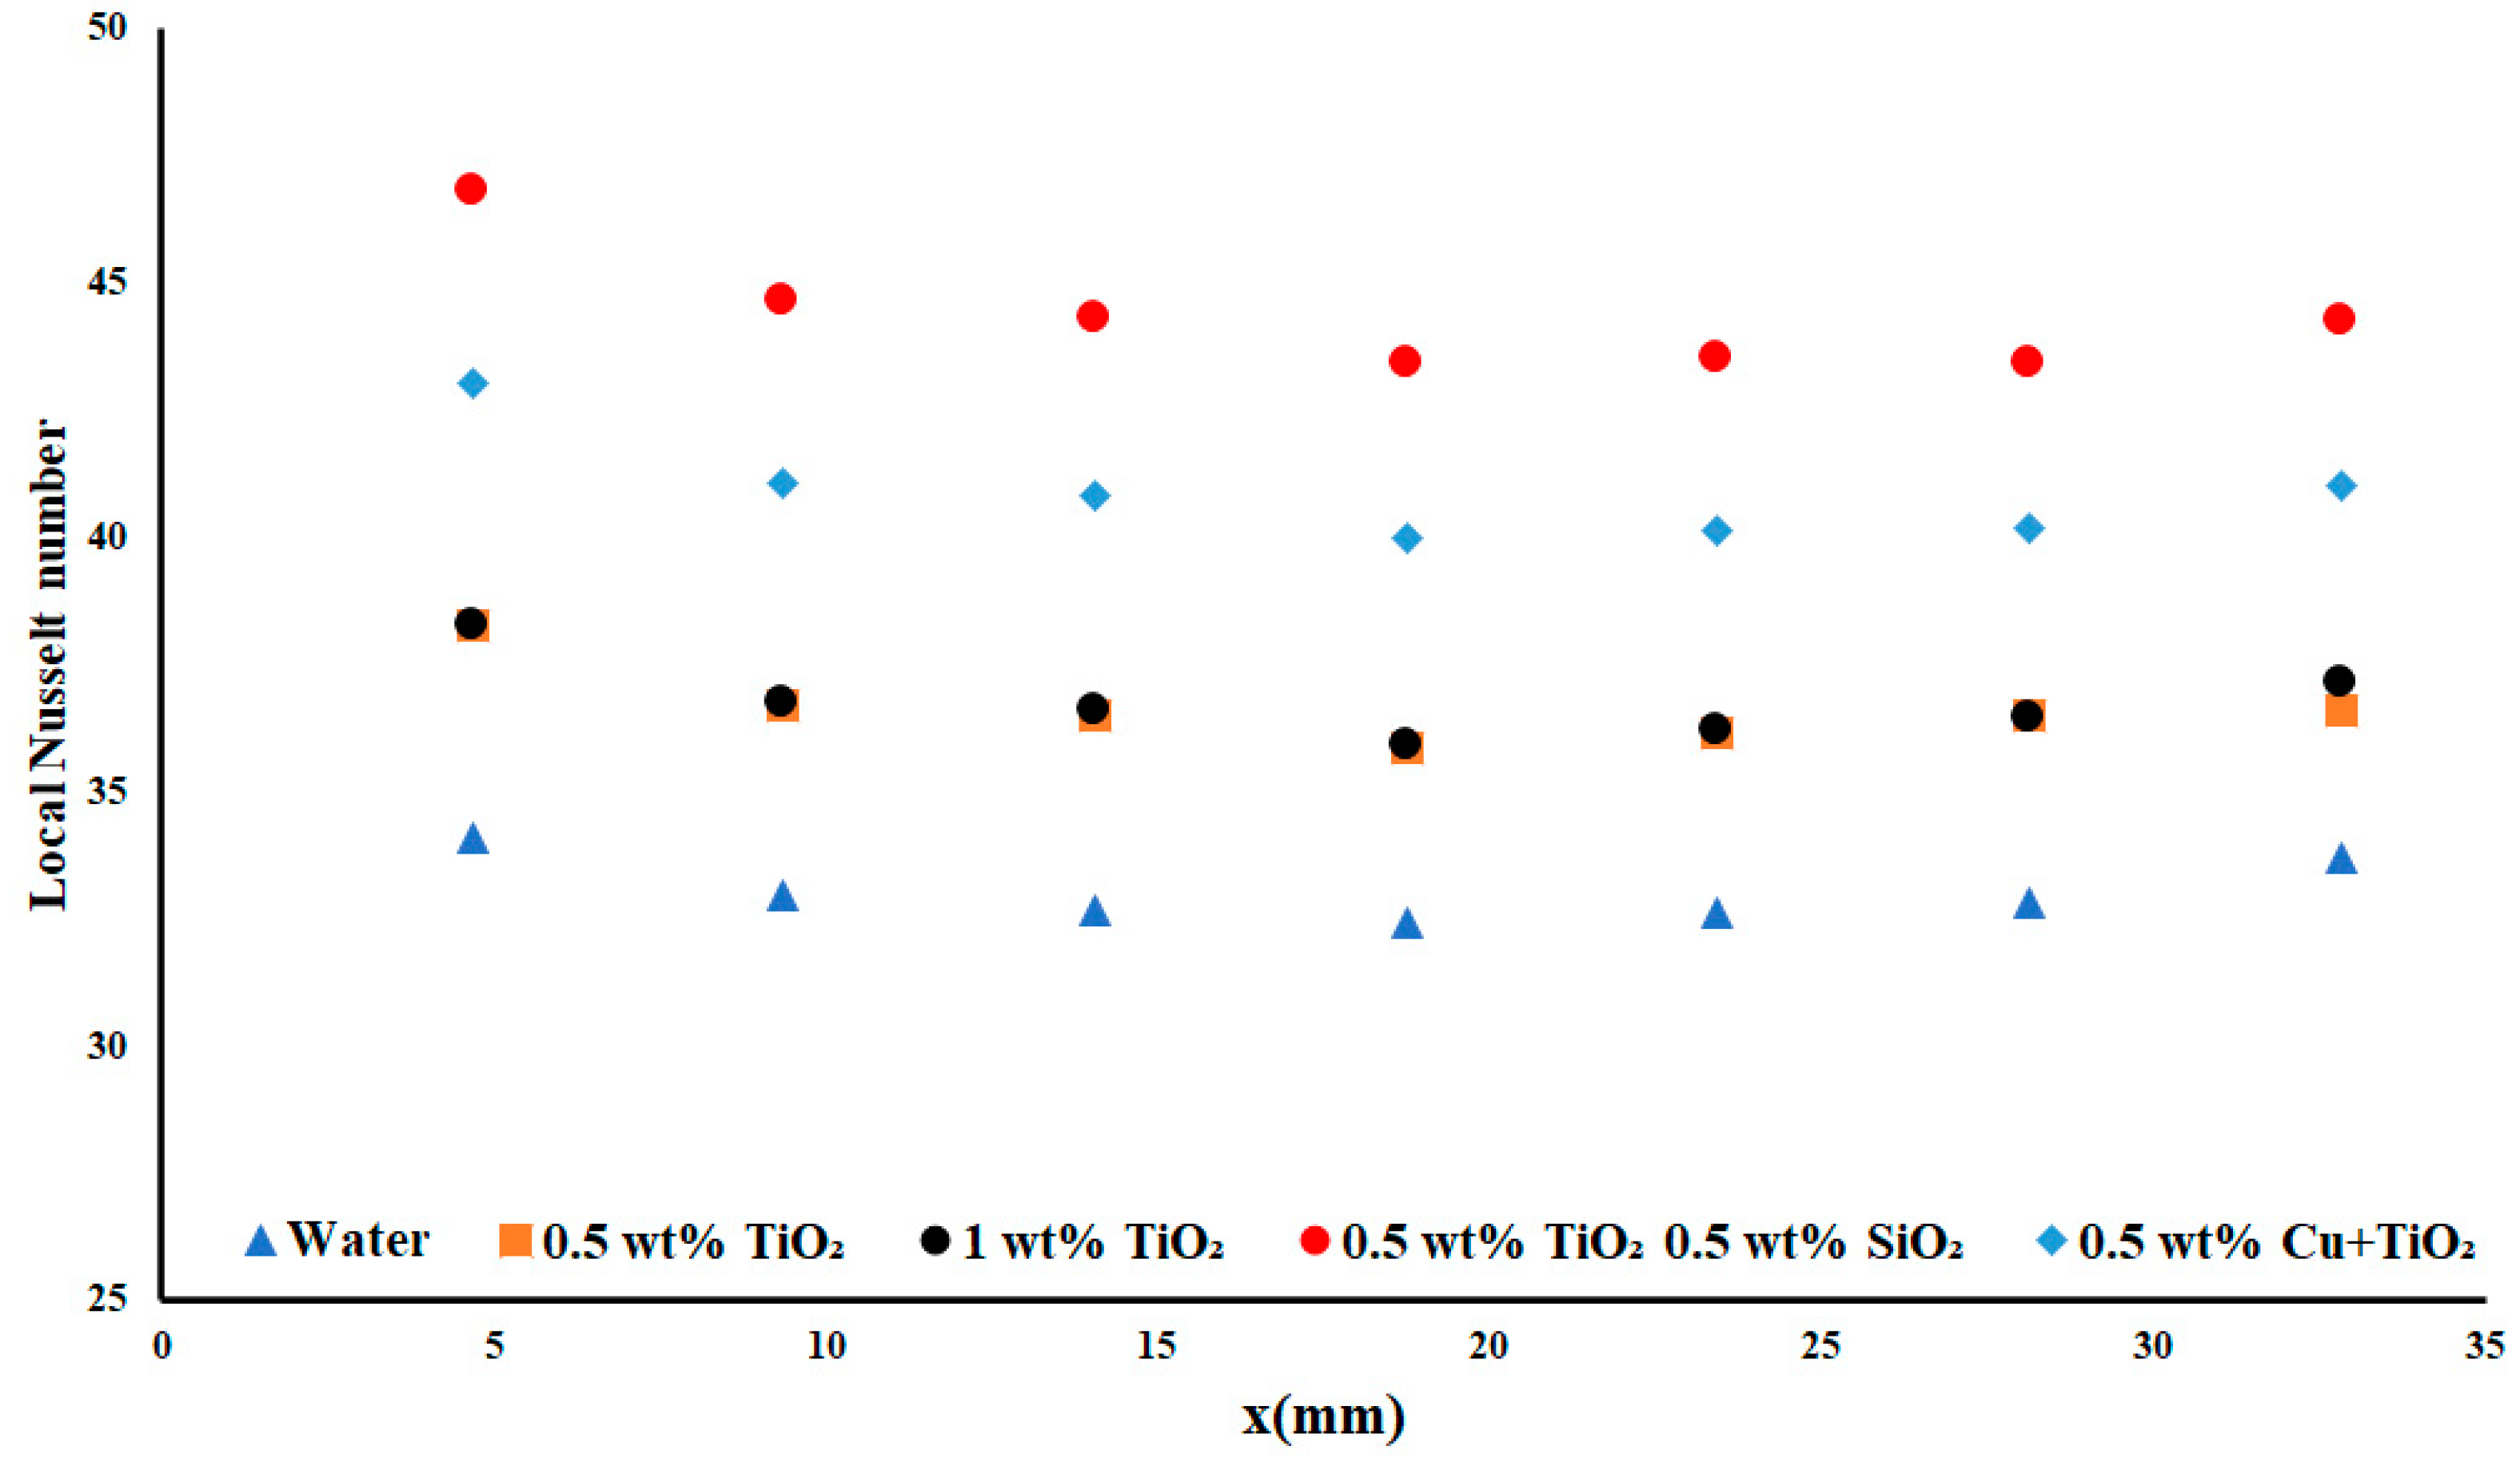
In
Figure 10, the results of the 3.85 W cm
−2 case for the local Nusselt numbers for each of the nanofluids are presented. In this, it was of note that the water case saw an average local Nusselt number of 34.6 over the length of the test. When the water entered the channel, the local Nusselt number increased to 35.79 a gain of 3.4% over the average. This slight increase in the performance in the entry region was a result of the boundary layer effect. The first nanofluid encountered after the water results was the 1 wt% TiO
2. This result—the 0.5 wt% TiO
2 performing better than the 1 wt% TiO
2—was previously seen in analyses of temperature difference, pointing once more to the optimal concentration of TiO
2 being less than 1 wt%. The average local Nusselt number for the 1 wt% TiO
2 was 37.18, an increase of 6.6% compared to that of water. The difference between the 0.5 wt% TiO
2 nanoparticles and the 1 wt% was a further increase of 4.41% for the average local Nusselt number. This difference between the two concentrations was significant compared to the anticipated increase in performance as nanoparticle concentration was increased. The Cu + TiO
2 nanoparticles were able to produce an average local Nusselt number of 42.07, an average increase of 17.35%, Interestingly, the optimal results were obtained from the double-monodispersed TiO
2/SiO
2 nanofluid, which saw an average local Nusselt number of 45.2, or an increase of 23.03% over water.
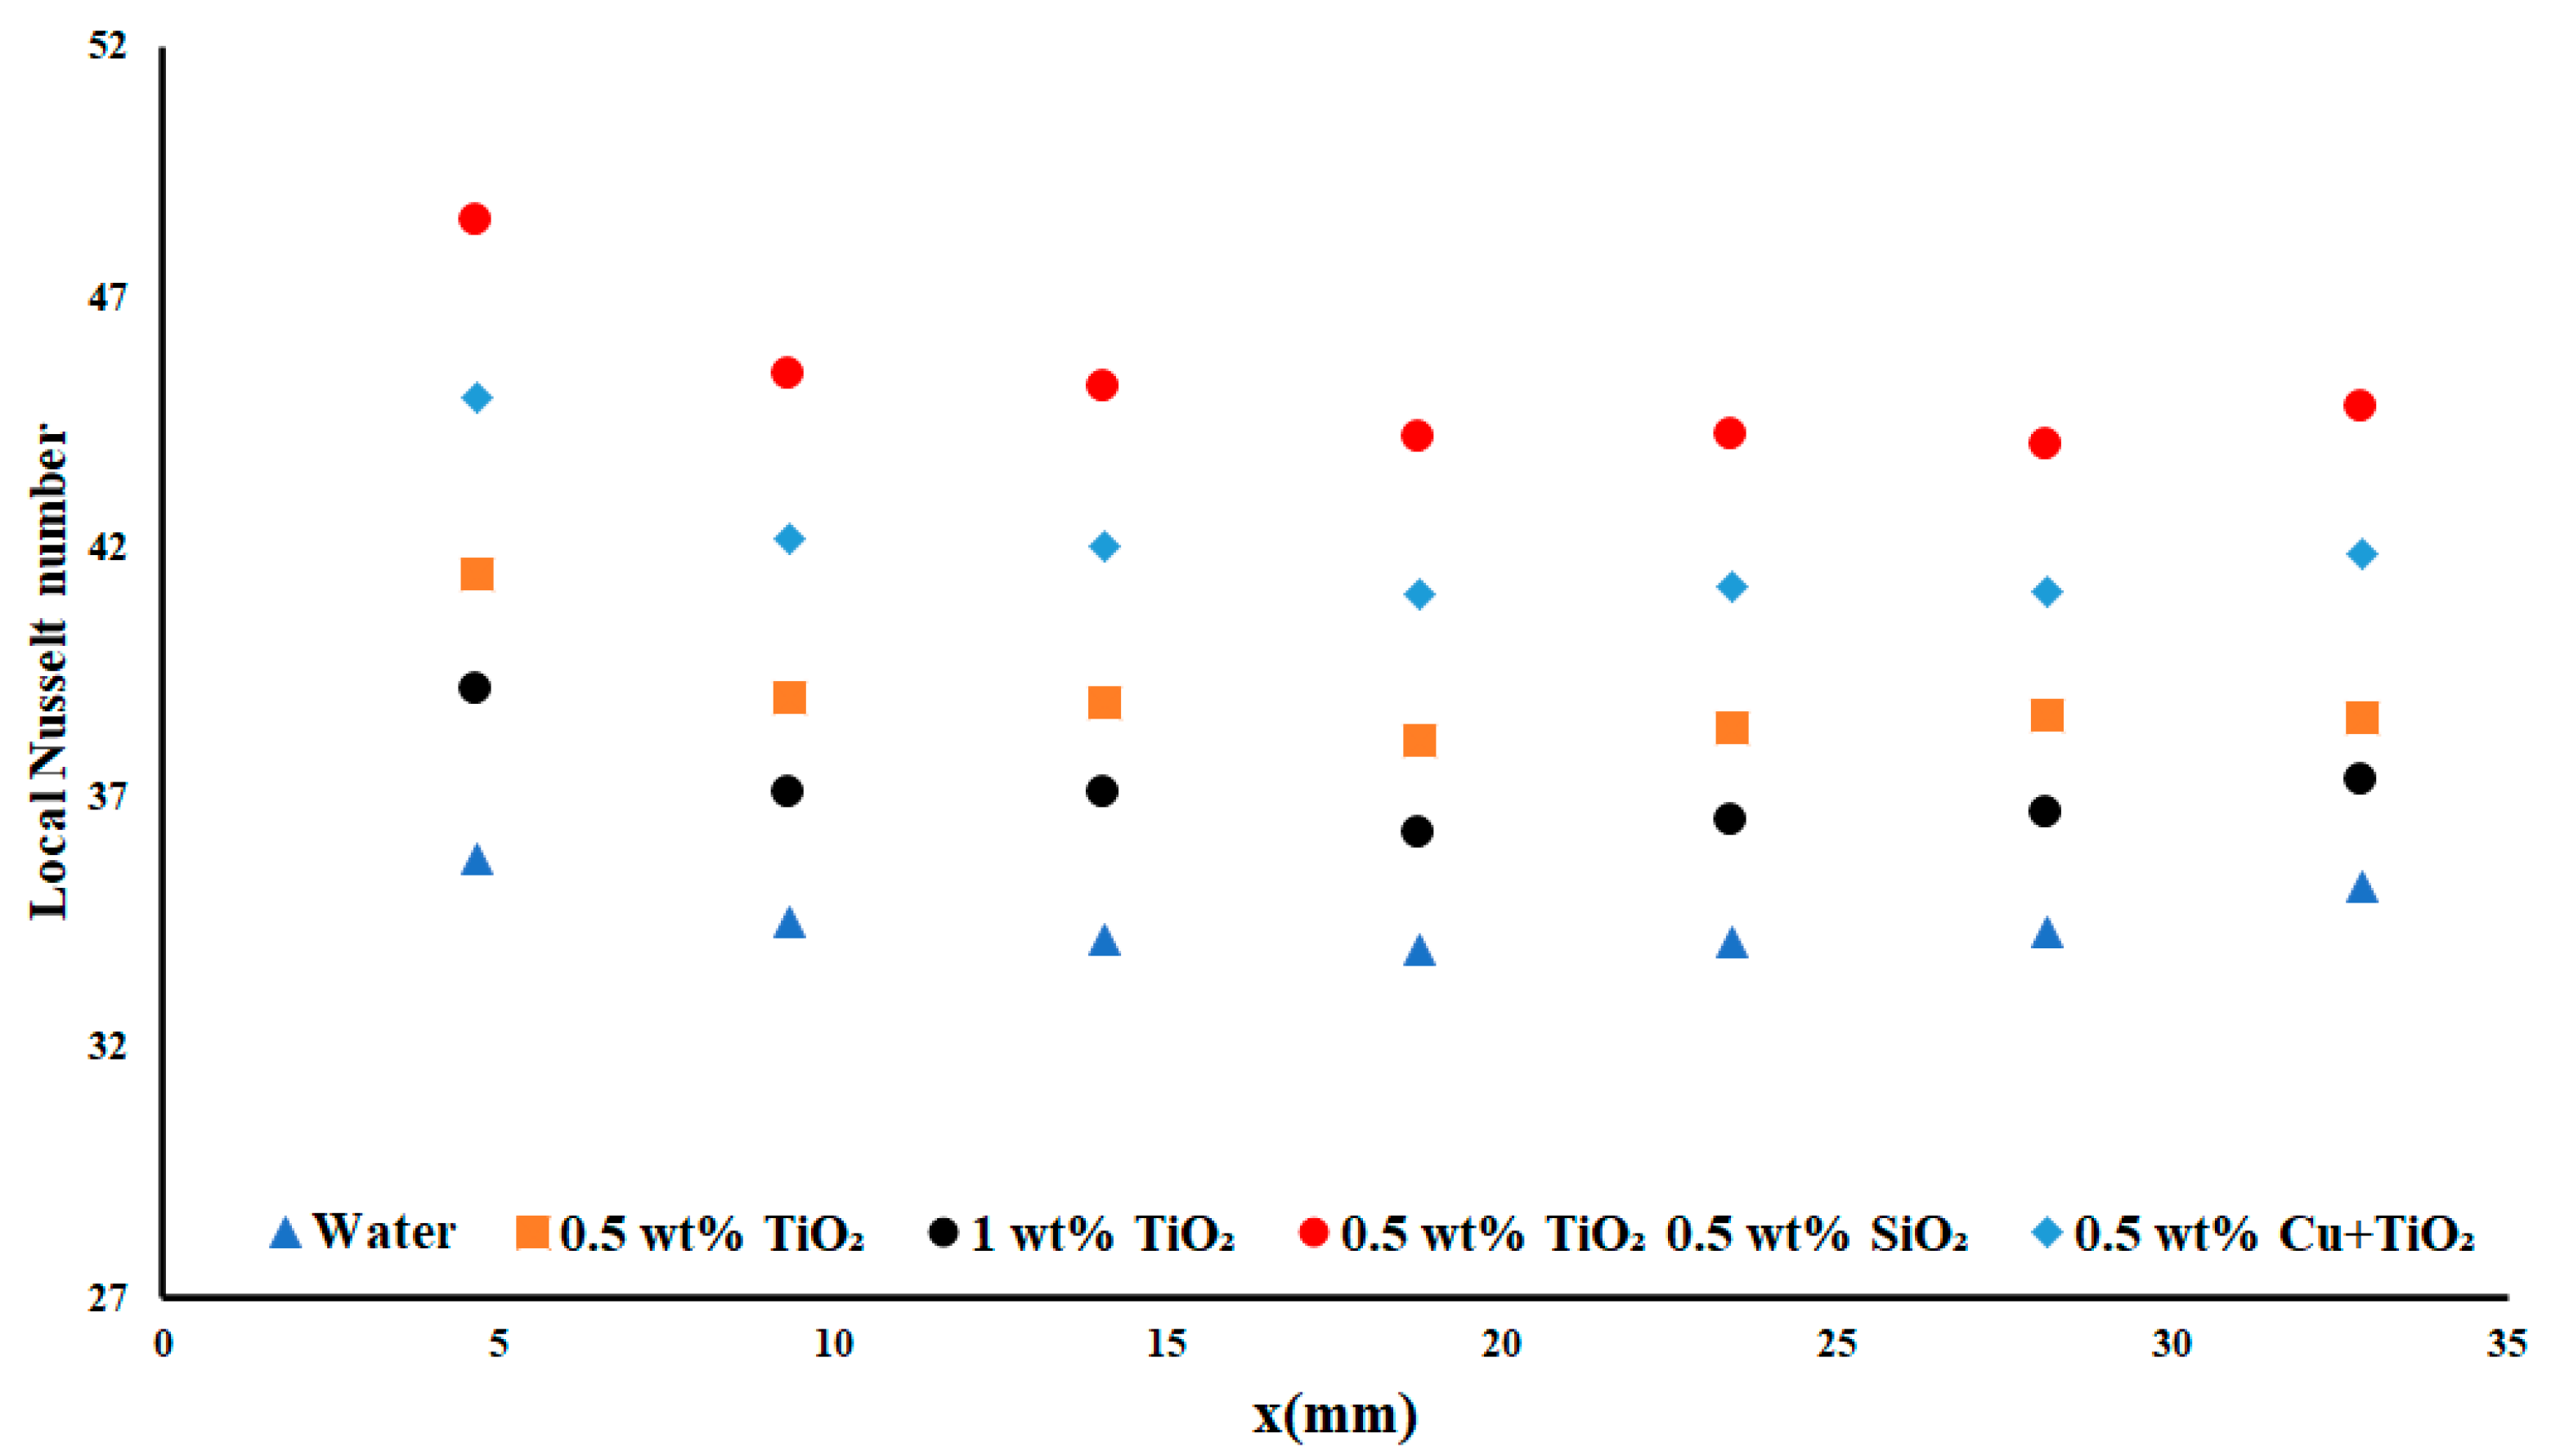
Note that, in
Figure 11, as the applied heat flux density increased to 7.51 W cm
−2, the difference between the two TiO
2 nanofluids decreased, as was also observed in the temperature difference section. The difference between the local Nusselt numbers of water and TiO
2 decreased as the applied heat flux density increased. This case held true for each of the applied nanofluids. As the applied heat flux density increased, the local Nusselt number decreased; however, when examining the increase of flow rate while maintaining the applied heat flux density, a resulting increase in the local Nusselt number was observed. This reaction demonstrated the dependence of the local Nusselt number on the applied flow rate—and the dependence of the Reynolds number on the non-Darcy regime. In this case, the best average local Nusselt number was achieved with the TiO
2/SiO
2 nanofluid, with an average increase of 25.22% compared to water.
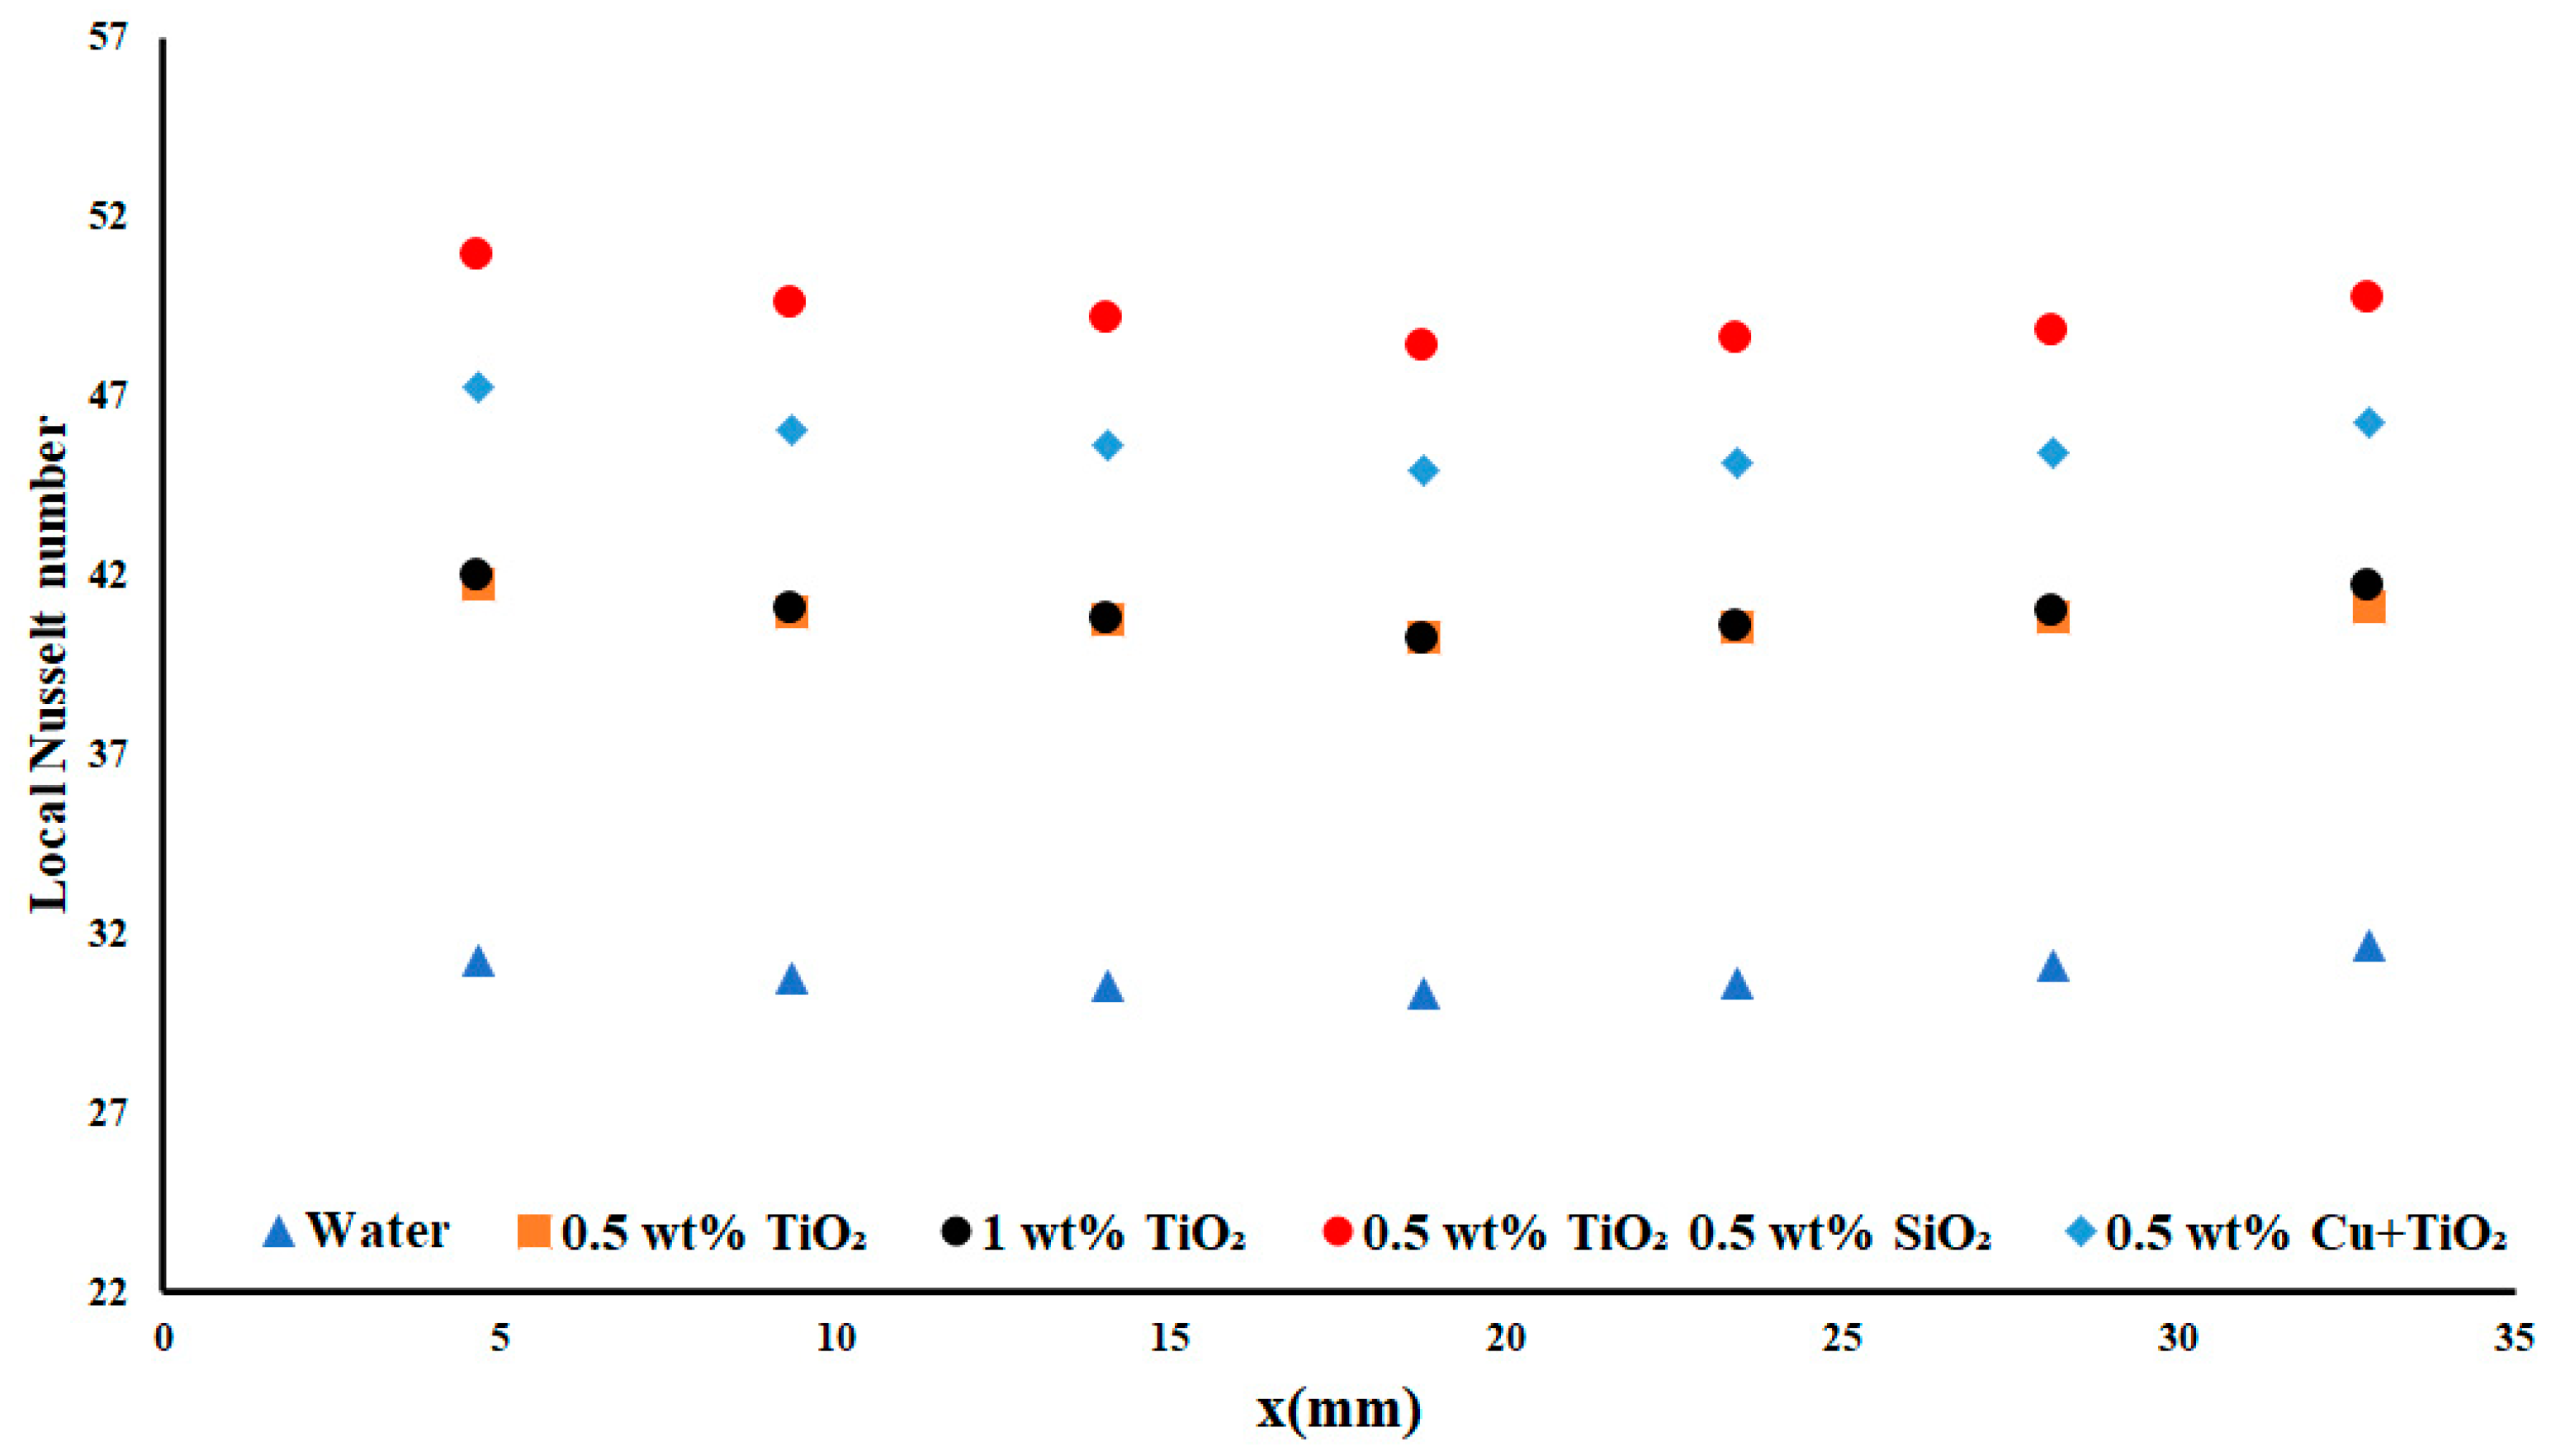
Figure 12 displays the highest applied heat flux density and flow rate case. Similarly, to what was observed before, the performances of both concentrations of TiO
2 yielded similar results, with the 0.5 wt% TiO
2 nanofluid performing 0.27% better, on average. The difference between water and the TiO
2/SiO
2 nanoparticles saw an increase of 28.63%. This increase was rather significant and demonstrated the impact of the TiO
2/SiO
2 double-monodispersed nanoparticles. This performance suggested that the presence of each nanofluid led to augmentation of the performance of the overall fluid to a greater degree than the nanoparticles on their own (as seen when examining the performance of TiO
2 on its own).
There was a slight increase in the heat absorption in the exit region of the test section, as evidenced by the increase in the local Nusselt number in this region. This indicated that there was also an increase in the heat enhancement experienced in this region, as the possible heat enhancement was proportional to the heat flux density. The parabolic shape was clearest for the TiO2/SiO2 nanofluid, in which a strong curve was visible in the entry region, demonstrating the largest impact of the boundary layer effect. A smaller (but still clear) curve was observed on the outlet regime, again pointing to a boundary layer effect, but in a reduced capacity.
Another possible reason for the observed increase in the heat absorption in the exit region may be the sedimentation of the nanoparticles when they move toward the exit region of the channels. This sedimentation would result in additional time for the absorption of heat by the nanoparticles before they re-entered the working fluid, thus increasing the heat absorption in that region.
As shown in
Figure 13, the 0.2 USGPM flow rate for the 7.5 W cm
−2 resulted in a maximum improvement of 38.68% over distilled water for the local Nusselt number, and an average improvement of 37.31% over water. This was an increase of 4.77% over the hybrid copper and TiO
2 nanofluid. This sharp increase in the local Nusselt number performance over distilled water for the same experimental apparatus and testing conditions was deemed significant as it demonstrated the importance of nanoparticle concentration and selection for each apparatus.
The greatest impact of the nanoparticles’ inclusion, when compared to the performance of water, was observed when comparing the lowest average increase in the nanofluid performance. It still yielded an increase of 24.42% in the local Nusselt number. This increase showcased the improvements in cooling made possible by nanofluids, as often, even a suboptimal nanofluid selection can still result in a net improvement to the possible heat transfer of the system. Pressure drop was not examined along the length of the test section. However, when increasing a nanoparticle concentration in the working fluid, the experienced viscous effects will increase, and subsequently have a detrimental impact on the system performance.
A comparison of the performance of all of the examined nanoparticles and their concentrations was determined to be useful. In
Figure 13, note that the flow rate of 0.2 USGPM yielded the optimal results for each of the nanofluids, with the largest value obtained when examining the largest highest applied heat flux. This was an interesting result, as the largest applied flow rate would suggest the ability to provide greater possible heat removal due to the greater mass flow of the working fluid. However, the largest value was obtained at 0.2 USGPM flow rate, with an improvement of approximately 19 (a 23% increase) in the average local Nusselt number for the TiO
2/SiO
2 nanofluid over the 0.3USGPM flow. This demonstrated that flow rate had a significant effect on the potential performance of the system. Overall, similar improvements were observed between the 0.3 USGPM flow rate and the 0.2 USGPM flow rate, with one notable exception: the performance of the 0.5 wt% and 1 wt% TiO
2 nanofluid for the 0.2USGPM flow rate yielded results near and below those found for water. This indicated that the nanofluid was in non-ideal operating conditions when under the lowest applied heat flux density situation. As the applied heat flux density was increased, the performance of both concentrations of nanofluids increased above that of water by at least 6.9%, on average.


