Abstract
A series of the DEM simulations of the outflow of wooden spheres from a flat-bottomed container was reported, considering the maximum diameter to arrest the flow. Numerical simulations of the discharge process were performed, and the micro-mechanics of the discharged particles were described. The effect of the sliding friction coefficient between particles, rolling friction coefficient, and modulus of elasticity of particles on the clogging process was investigated. The results of the simulations of the mass flow rate of spheres have shown a fairly close agreement with the experimental results. The real particles of wood were not perfectly spherical, their properties were anisotropic, and their frictional properties were non-homogenously distributed on the surface. Nevertheless, these deviations from ideal conditions did not produce a considerable discrepancy in the results. No direct relationship between the interparticle friction and the clogging was found; however, a relationship between the stability of the dome formed at flow arrest and the rolling friction was observed. An increase in Young’s modulus of particles by two orders of magnitude did not affect the clogging process, but a slightly higher probability of clogging was found for softer particles.
1. Introduction
Gravitational flow is a basic phenomenon for numerous technologies important for undisturbed flow, dosing based on the flow rate, consistency of the composition of mixtures in agriculture, as well as the food or pharmaceutical industry. Although the process of flowing grains has been studied for many decades, it is still insufficiently elucidated. The study of the hopper discharge of granular materials has an extensive history and still remains an important research area, as the general understanding of the problem is far from being satisfactory. Silos and hoppers have simple structures; however, their discharge still faces many problems, such as discontinuous discharge [1,2], clogging [3,4,5,6], and silo collapse [7,8].
Numerous efforts have been made to predict the mass flow rate of granular materials discharged from the silo. A study on the flow rate of sands and seeds varying in grain size discharged from a silo with various outlet widths conducted by Beverloo et al. in 1961 [9] revealed a relationship between the mass flow rate and the mean grain diameter. The authors proposed a law predicting the flow rate of grains through an orifice considering its dependence on different parameters. The flow of granular materials through an orifice was widely studied during the next decades [10,11,12,13]. It has been revealed that the flow rate is different for small and large orifices. While the flow rate of grains through large orifices is known to be dependent on its diameter to a 5/2 power law [9], this relation breaks down for small orifices [14,15]. Gella et al. [16] found that the relationship between the mass flow and the nature of contacts between beads, friction, or differences in kinetic energy per unit area is not trivial, and further research is necessary to clarify these questions. Numerical simulations of flow from a hopper conducted by Danczyk et al. [17] showed high sensitivity of flow to contact parameters and the need for detailed local observations of the process for the validation of the computational technique.
The Beverloo law or other models based thereon facilitate a very good estimation of the mass flow rate of particles with various PSD and particle shapes [15,18]. However, the physical significance of some model parameters remains unknown or at least unclear [17]. The issue requires further investigations. Reports on numerical investigations point out an influence of the parameters of simulations on the flow rate that are not easy to compare with real effects. For example, the coefficients of friction are usually uneven on the particle surface, and the coefficient of restitution has clear importance only for perfect spheres characterized by identical material parameters. In addition, in this case, the question of how to transfer simulation results onto real systems remains largely unresolved. Another unresolved problem regarding discharge flow is conditions for undisturbed flow and the shape of the arch (or dome) of stagnant material above the outlet after flow arrest. The majority of reported results regarding this issue were obtained in 2D configurations.
In recent years, many efforts have also been undertaken to understand the physical mechanisms leading to clogging in the discharge of silos by gravity [19,20,21]. The cause of the formation of arches or domes upon the outlet opening is the ability of the material to sustain uniaxial or biaxial compression, which develops next to the exposed surface of arches or channels. This fact was first recognized by Jenike and Leser [19] and became the basis of several theoretical analyses of arching in hoppers [22,23,24]. The Jenike theory has been modified over the years [22,23,25,26]; however, all these authors assumed that arching might occur if the strength of particles is greater than the weight-induced stresses.
It is known that the occurrence of arching is a function of the hopper geometry and the outlet size [4,21,27]. Although extensive theoretical and experimental studies have been conducted on the arching phenomenon over the last decades, the prediction of the hopper critical outlet size preventing arching is still unsatisfactory. The theories predict a larger outlet size than that found in model or full-scale hopper tests [25,28,29].
Experimental studies on the effect of the particle shape on discharge and clogging have been carried out by Hafez et al. [6] for spherical, elongated, faceted, and non-convex particles. Since the particle shape determines mobility, interlocking, and the angle of repose, it also highly affects the discharge process and clogging in silos. It was found that cubes and 3D crosses are the most prone to clogging. This is related to their ability to interlock or the development of face-to-face contacts that can resist torque and enhance bridging.
A study on the effect of the shape of the grains on the clogging of the flow, conducted by Goldberg et al. [30], showed that the clogging probability presents a nonlinear response as a function of the number of vertexes of the polygons. The authors found that the size and shape of the blocking arches display a much larger variability for some polygons, particularly for squares than for disks.
In recent decades, a micromechanical approach has been developed that seeks an explanation of the in-bulk behavior of granular material based on the interactions between particles. Much new insight regarding the flow behavior of granular materials has been gained due to the development of modern measurement techniques (particle image velocimetry technique, X-ray tomography) and the development of numerical methods, e.g., the Discrete Element Method (DEM). In the present project, a gravity outflow of wooden spheres was measured, and the discharge process was simulated using DEM. The extent of differences between the real process and simulations was analyzed, and an attempt to point out their sources was undertaken.
The objectives of the reported project were: (a) to check the ability of DEM to model the experimental behavior considering the flow rate, (b) to analyze the influence of material properties on the flow rate and the critical size of the orifice below which the flow is jammed, and (c) to explain the dynamic mechanisms of flow commencement and arrest based on particle interactions obtained in simulations.
2. Materials and Methods
2.1. Experimental Setup
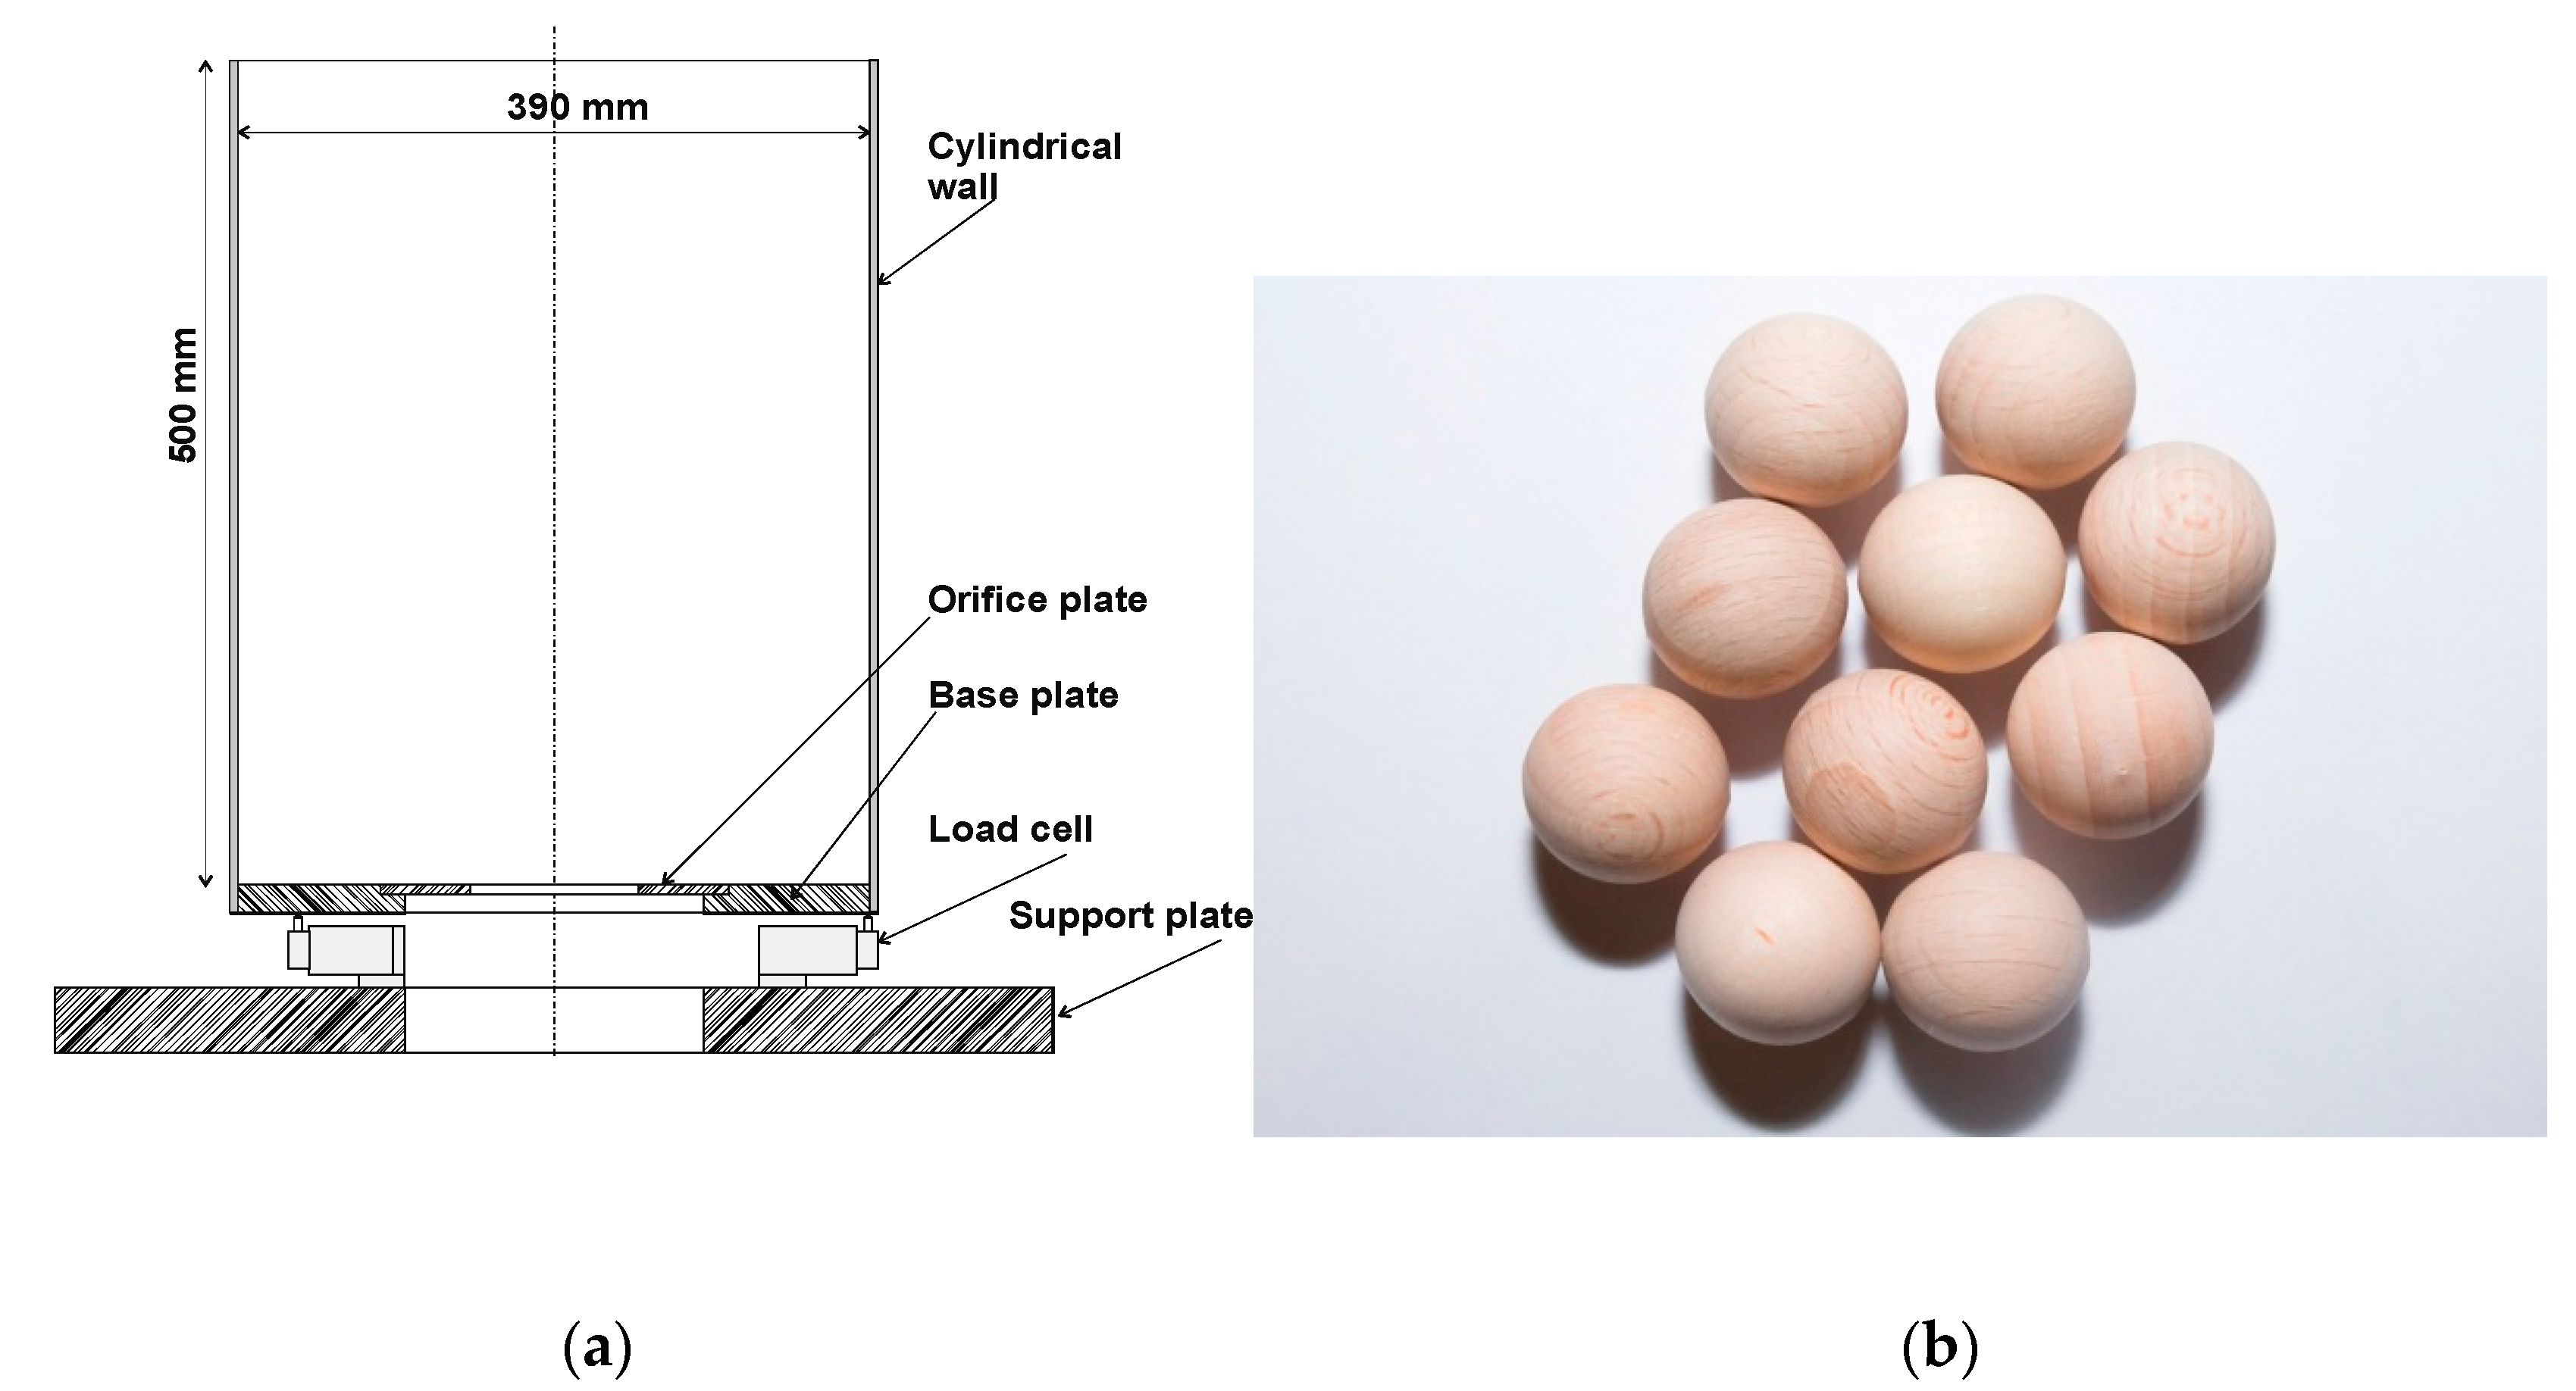
An experimental silo was used to measure the mass flow rate of wooden particles during discharge. The cylindrical container (Figure 1a) was 0.39 m in diameter and 0.5 m high. It was equipped with interchangeable discharge orifices of diameters D0 from 0.05 to 0.15 m with 0.01 m increments. The container wall was made of PVC, while its flat floor was made of plywood. The particles used for the experiment were wooden spheres. Based on measurements on 30 randomly picked particles the exact sizes in each dimension were estimated as 14.63 ± 0.21 mm, 14.84 ± 0.18 mm, 15.40 ± 0.07 mm, for simplicity approximated to a perfect sphere with 15 mm in diameter (dp) and the mass of 1.28 g. Figure 1b depicts a typical particle used for the experiment. Thus, the silo diameter was 26.7 times the particle diameter, which according to our earlier experience and the findings reported by Zuriguel et al. [31], allowed the finite size of the bin to be neglected. The number of particles in sample N was equal to 14,208. A repeatable filling procedure was adopted to maintain a similar geometrical bedding structure in subsequent tests. A plastic tube of 0.28 m inside diameter and 0.78 m high was placed axially on the container floor. The measured number of particles was poured into the tube, and it was slowly raised while the particles filled the container. When the filling was complete, the top free surface was leveled, and the height of the bedding was measured to allow the calculation of the solid fraction. The discharge gate was opened, and the total vertical load on the silo was measured, based on that mass, and the number of particles in the container was calculated until the discharge was completed. Forces were measured using three load cells HBM Z8 with a nominal load of 50 kg.
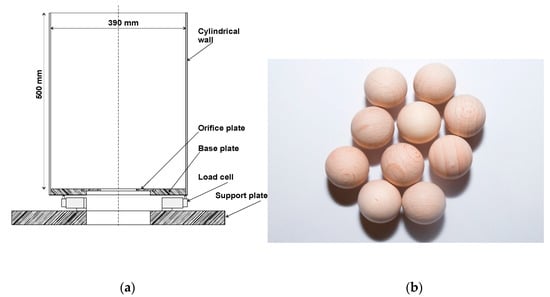
Figure 1.
Scheme of the model bin with load cells attached (a), and real view of typical particle used in experiment (b).
2.2. Numerical Setup
The numerical simulations were performed in a configuration reflecting the laboratory test stand. The DEM open-source software LIGGGHTS developed by Kloss et al. [32] was used for numerical simulations. The internal interactions were modeled using the Hertz–Mindlin theory of elastic frictional collisions between particles (particle–wall) for simulations based on the work by Mindlin and Deresiewicz [33,34]. A damping term in the contact model was adopted as proposed by Tsuji, Tanaka, and Ishida [35], i.e., assuming that the coefficient of restitution has a constant value for given particle properties.
Particles have been modeled as mono-sized wooden spheres with a diameter dp of 0.015 m. Due to the imperfect shape and roughness of the wooden spheres, the experimental setup could not be replicated perfectly in simulation. Instead of having the same number of particles, we aimed to have exactly the same initial height and mass of the bed; therefore, slightly more particles were used in simulations. The particles were randomly generated in the inner cylinder and allowed to settle; then, the inner cylinder moved upward with a constant velocity of 0.05 m/s. The bed prepared in this way was allowed to settle until the total kinetic energy dropped below 10−10 J, i.e., to a level of numerical noise. The particles were then discharged through a centrally located orifice (with a diameter D0). The filling part was performed with a time step of 10−6 s, while the time step for the discharge part was refined to 10−7 s. The basic material properties are presented in Table 1. Two types of numerical experiments were performed. In the first case, the particles bed was generated and stabilized using the basic parameters. Next, the silo discharge was simulated with adjusted material parameters. That case was termed from restart. In the second case, termed from beginning, the filling, stabilizing, and discharge processes were performed with an adjusted parameter. In the second case, termed from beginning, the filling, stabilizing, and discharge processes were performed with an adjusted parameter to study its influence on the clogging of the material. Young’s modulus E was tested using 0.0828 GPa, 8.28 GPa, and 828 GPa, i.e., 0.01, 1, and 100 times the basic value. The artificial rolling resistance was introduced using the coefficients of rolling friction µrp and µrw of 0.01, 0.05, and 0.1. Based on preliminary tests and analysis, the typical value of mobilization of friction during discharge was estimated in the range from 0.12 to 0.2. Therefore, the series of simulations using coefficient of particle–particle friction µpp of 0.12, 0.13, 0.14, 0.15, 0.16, 0.18, 0.20 was performed. Additionally, one upper-end value of µpp of 0.6 was used for comparison.

Table 1.
Basic material properties.
3. Results
3.1. Outflow Rate Fitting the Beverloo Equation
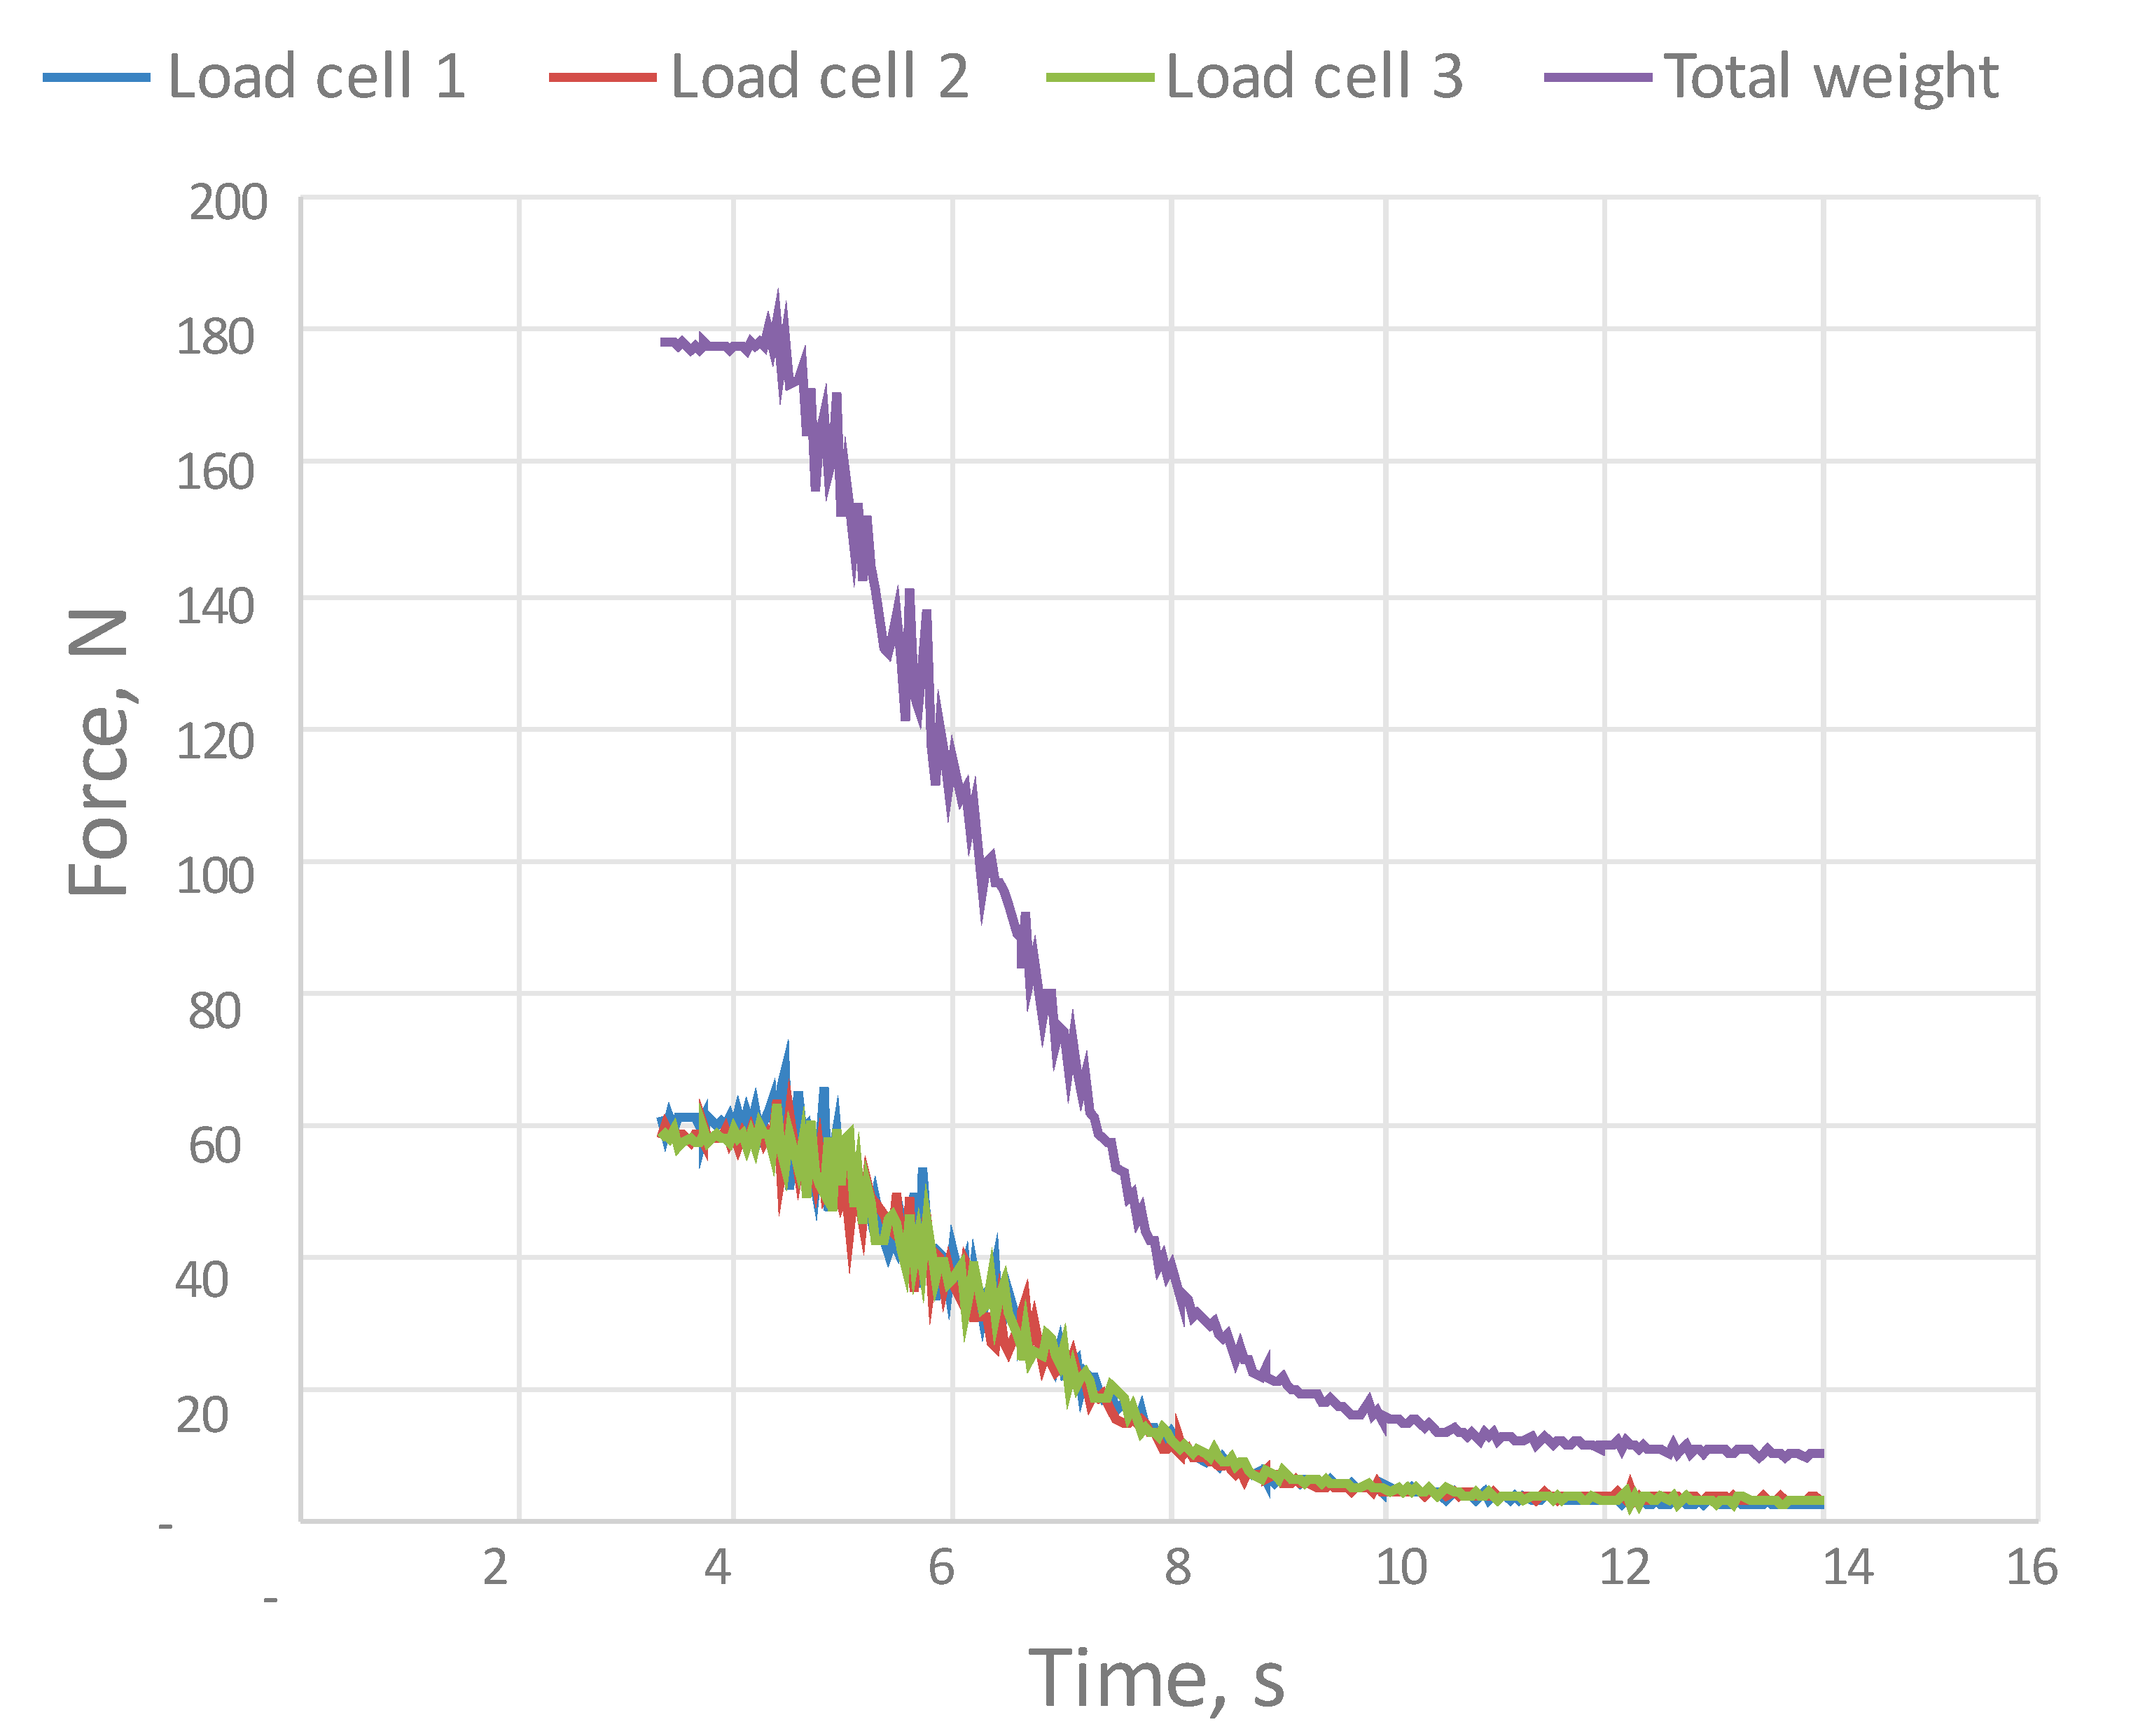
Figure 2 illustrates typical force–time characteristics for the last phase of detention and during the discharge. The results showed a fairly even distribution of the load between three load cells typical for symmetric conditions. There were visible harsh fluctuations in the measured forces produced by flow disturbances that were slightly lower at relationships of total weight vs. time. This result points to fluctuations in the horizontal position of the center of gravity of the material in the container due to variations in the flow channel geometry. In the time span of approximately 4.5 to 8 s, the characteristic was nearly linear. The discharge rate was slower and nonlinear in the last phase. The curve did not reach zero due to the dead zone remaining on the bottom of the container.
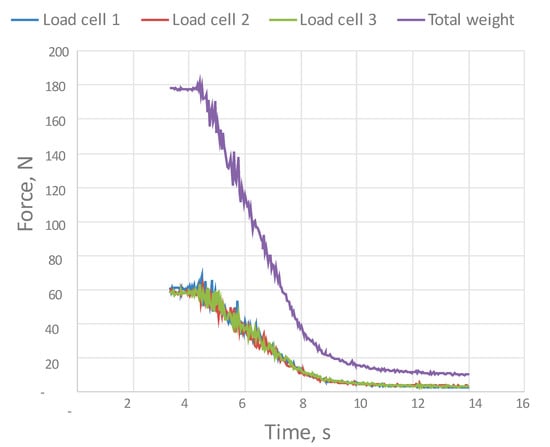
Figure 2.
Loads on the three load cells supporting the container and weight of the material in the container vs. discharge time.
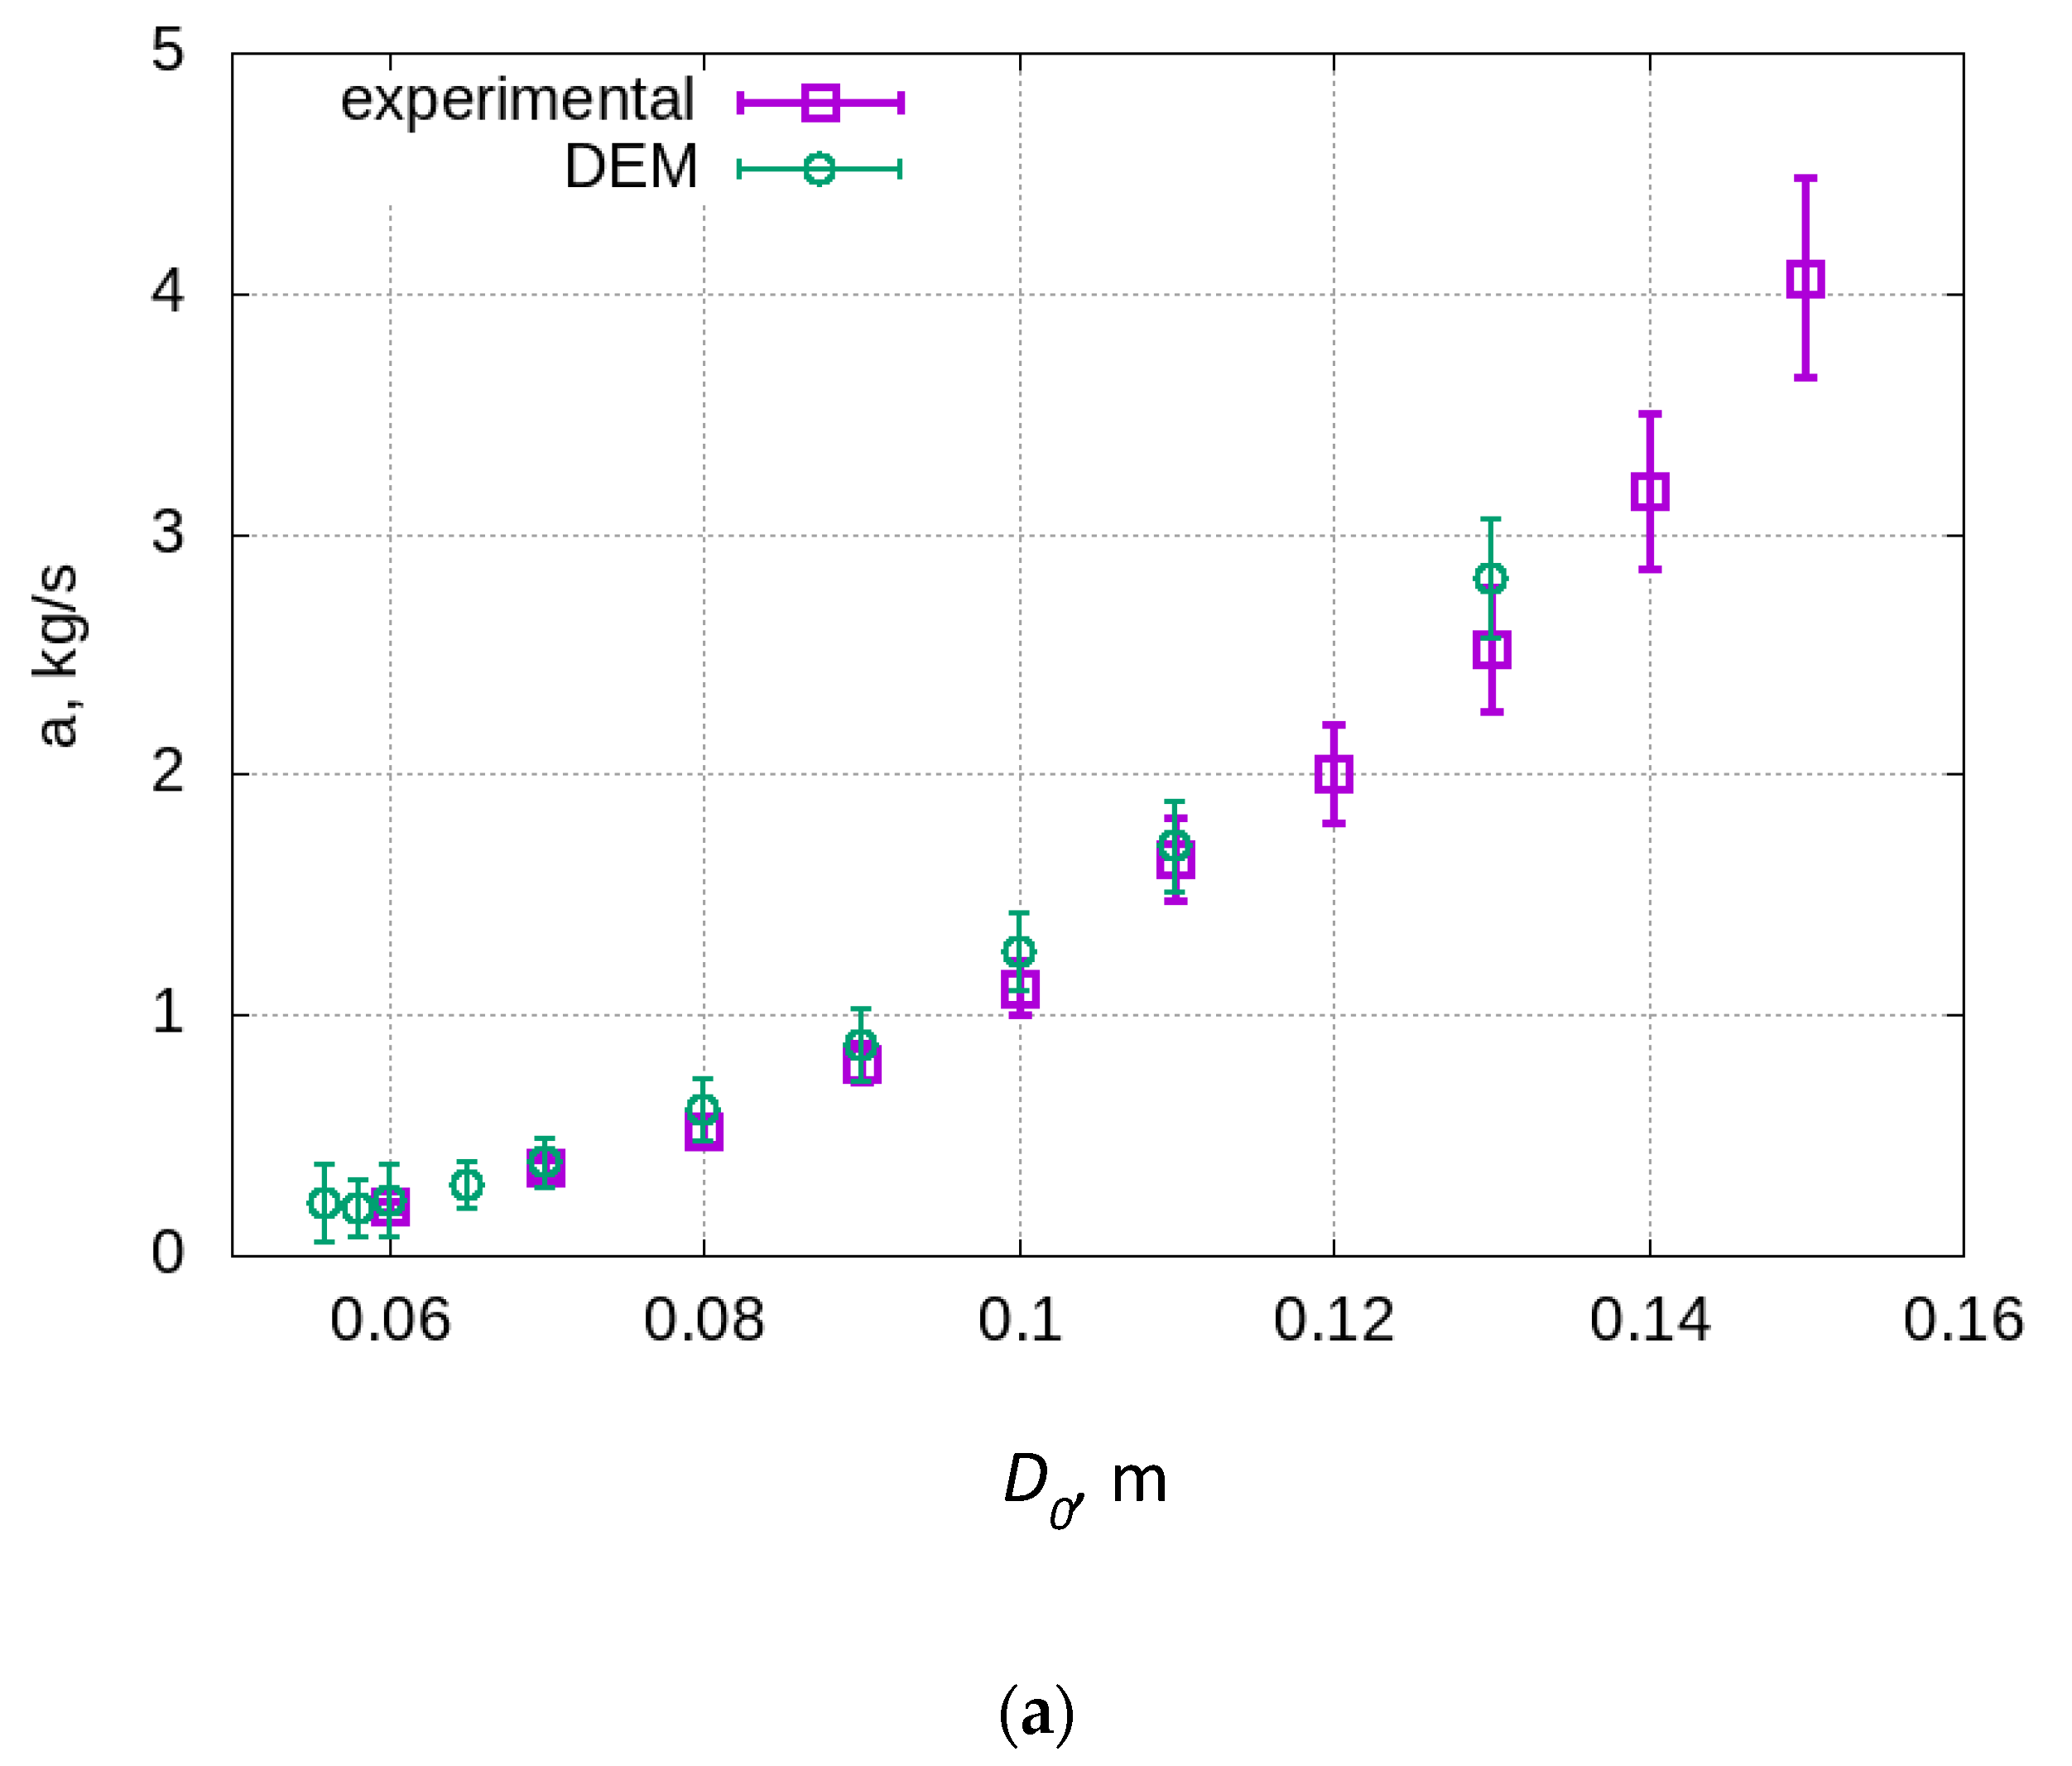
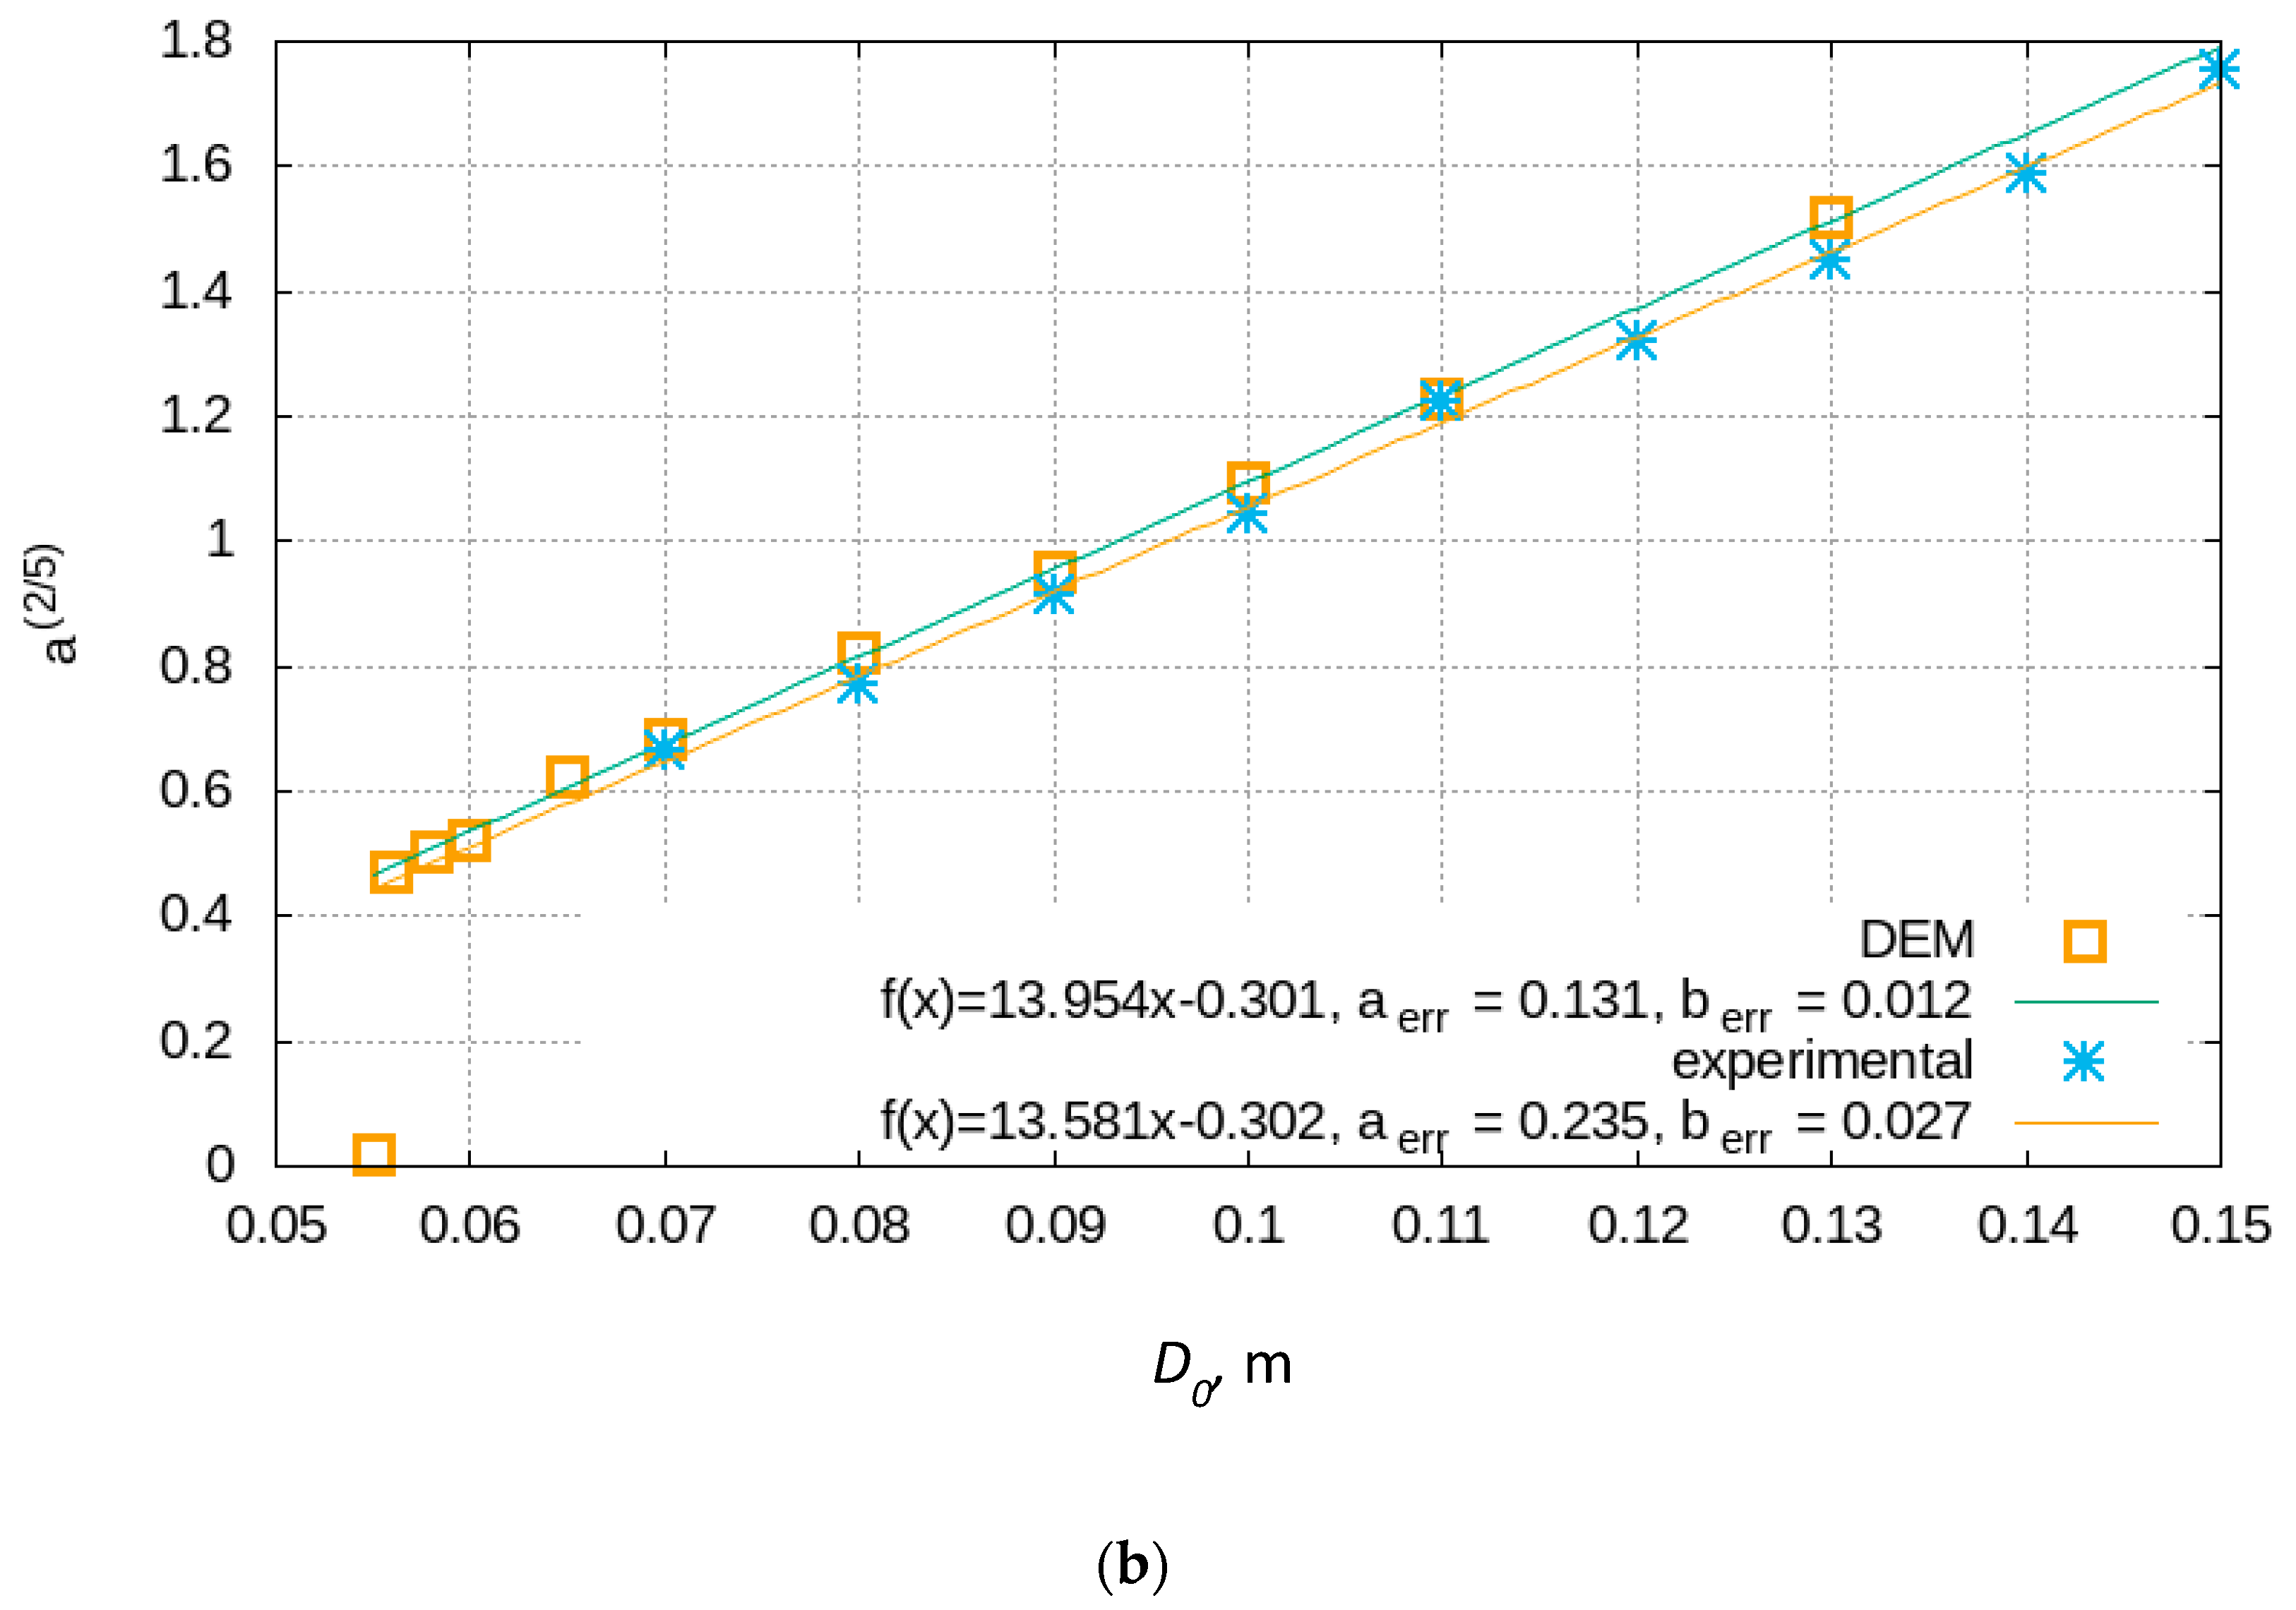
The relationships between the diameter of the discharge orifice and the outflow rate are presented in Figure 3a. Additionally, Figure 3b presents the outflow rate to the power of 2/5 for the experimental and numerical results and for the fitted Beverloo law are shown in Figure 3.
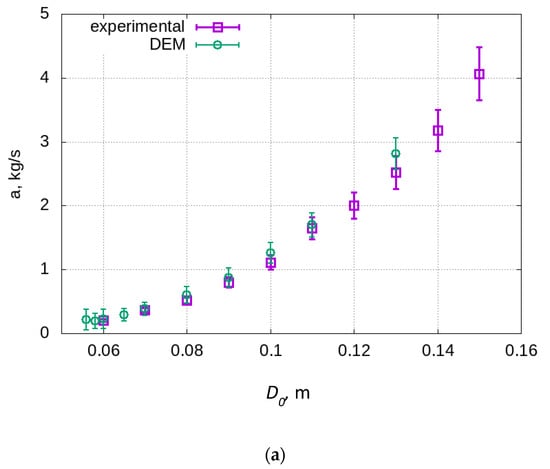
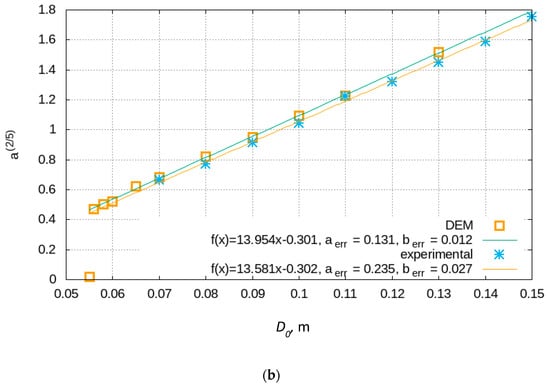
Figure 3.
Relationships between the diameter of the discharge orifice D0 and the outflow rate a (a), and at power 2/5: experimental data, numerical results, and Beverloo law fitting (b).
The results of laboratory testing and simulations showed very close agreement; although the real particles of wood were not perfectly spherical, their properties were anisotropic and frictional properties were non-homogenously distributed on the surface. Such uneven surface properties were more pronounced for higher discharge rates. The simulation results tended to overestimate the experimental values in the simulations with large orifice diameters. In the experiments, undisturbed flow was observed for an orifice diameter higher than 60 mm, i.e., for D0/dp > 4.0, while undisturbed flow in simulations was observed for D0/dp ≥ 4.2.
The Beverloo equation is one of the most widely accepted relationships between the particle discharge rate and the diameter of the outlet in a flat bottom cylindrical silo. It is expressed as follows:
where W is the mass flow rate, ρb is the bulk density, g is the gravitational acceleration, L is the outlet width, dp is the mean particle diameter, k is the Beverloo constant, and C is the shape factor. The values of parameters k and C are known to depend on both the silo geometry and the properties of particles. As shown by Uñac et al. [18], k depends more strongly on the properties of the particles, while C is more strongly influenced by the geometry of the hopper. The authors found that no definite conclusion about the correct value of k expected in given experimental conditions can be drawn. The values of k = 1.38 and C = 0.589 obtained in this study were comparable to those reported in the literature. In the pioneering study conducted by Beverloo et al. [9], parameter k was equal to 2.9 for sand and 1.4 for seeds with a nearly spherical shape (rapeseed and kale).
3.2. Transition from Detention to Discharge Commencement
Granulated materials produce strong interactions between particles, which create limitations in the application of methods originating from the continuum approach to calculate the flow rate, e.g., the Beverloo approach. One of the conditions that must definitely be fulfilled for the Beverloo equation to predict the flow rate with acceptable precision is the minimal orifice diameter. For spherical particles, this minimum value is in a range from 6 to 10 particle diameters, depending on the material properties. This cut-off is not a sharp one, but it is rather a smooth transition from disturbed-erratic flow to a stable-continuous one.
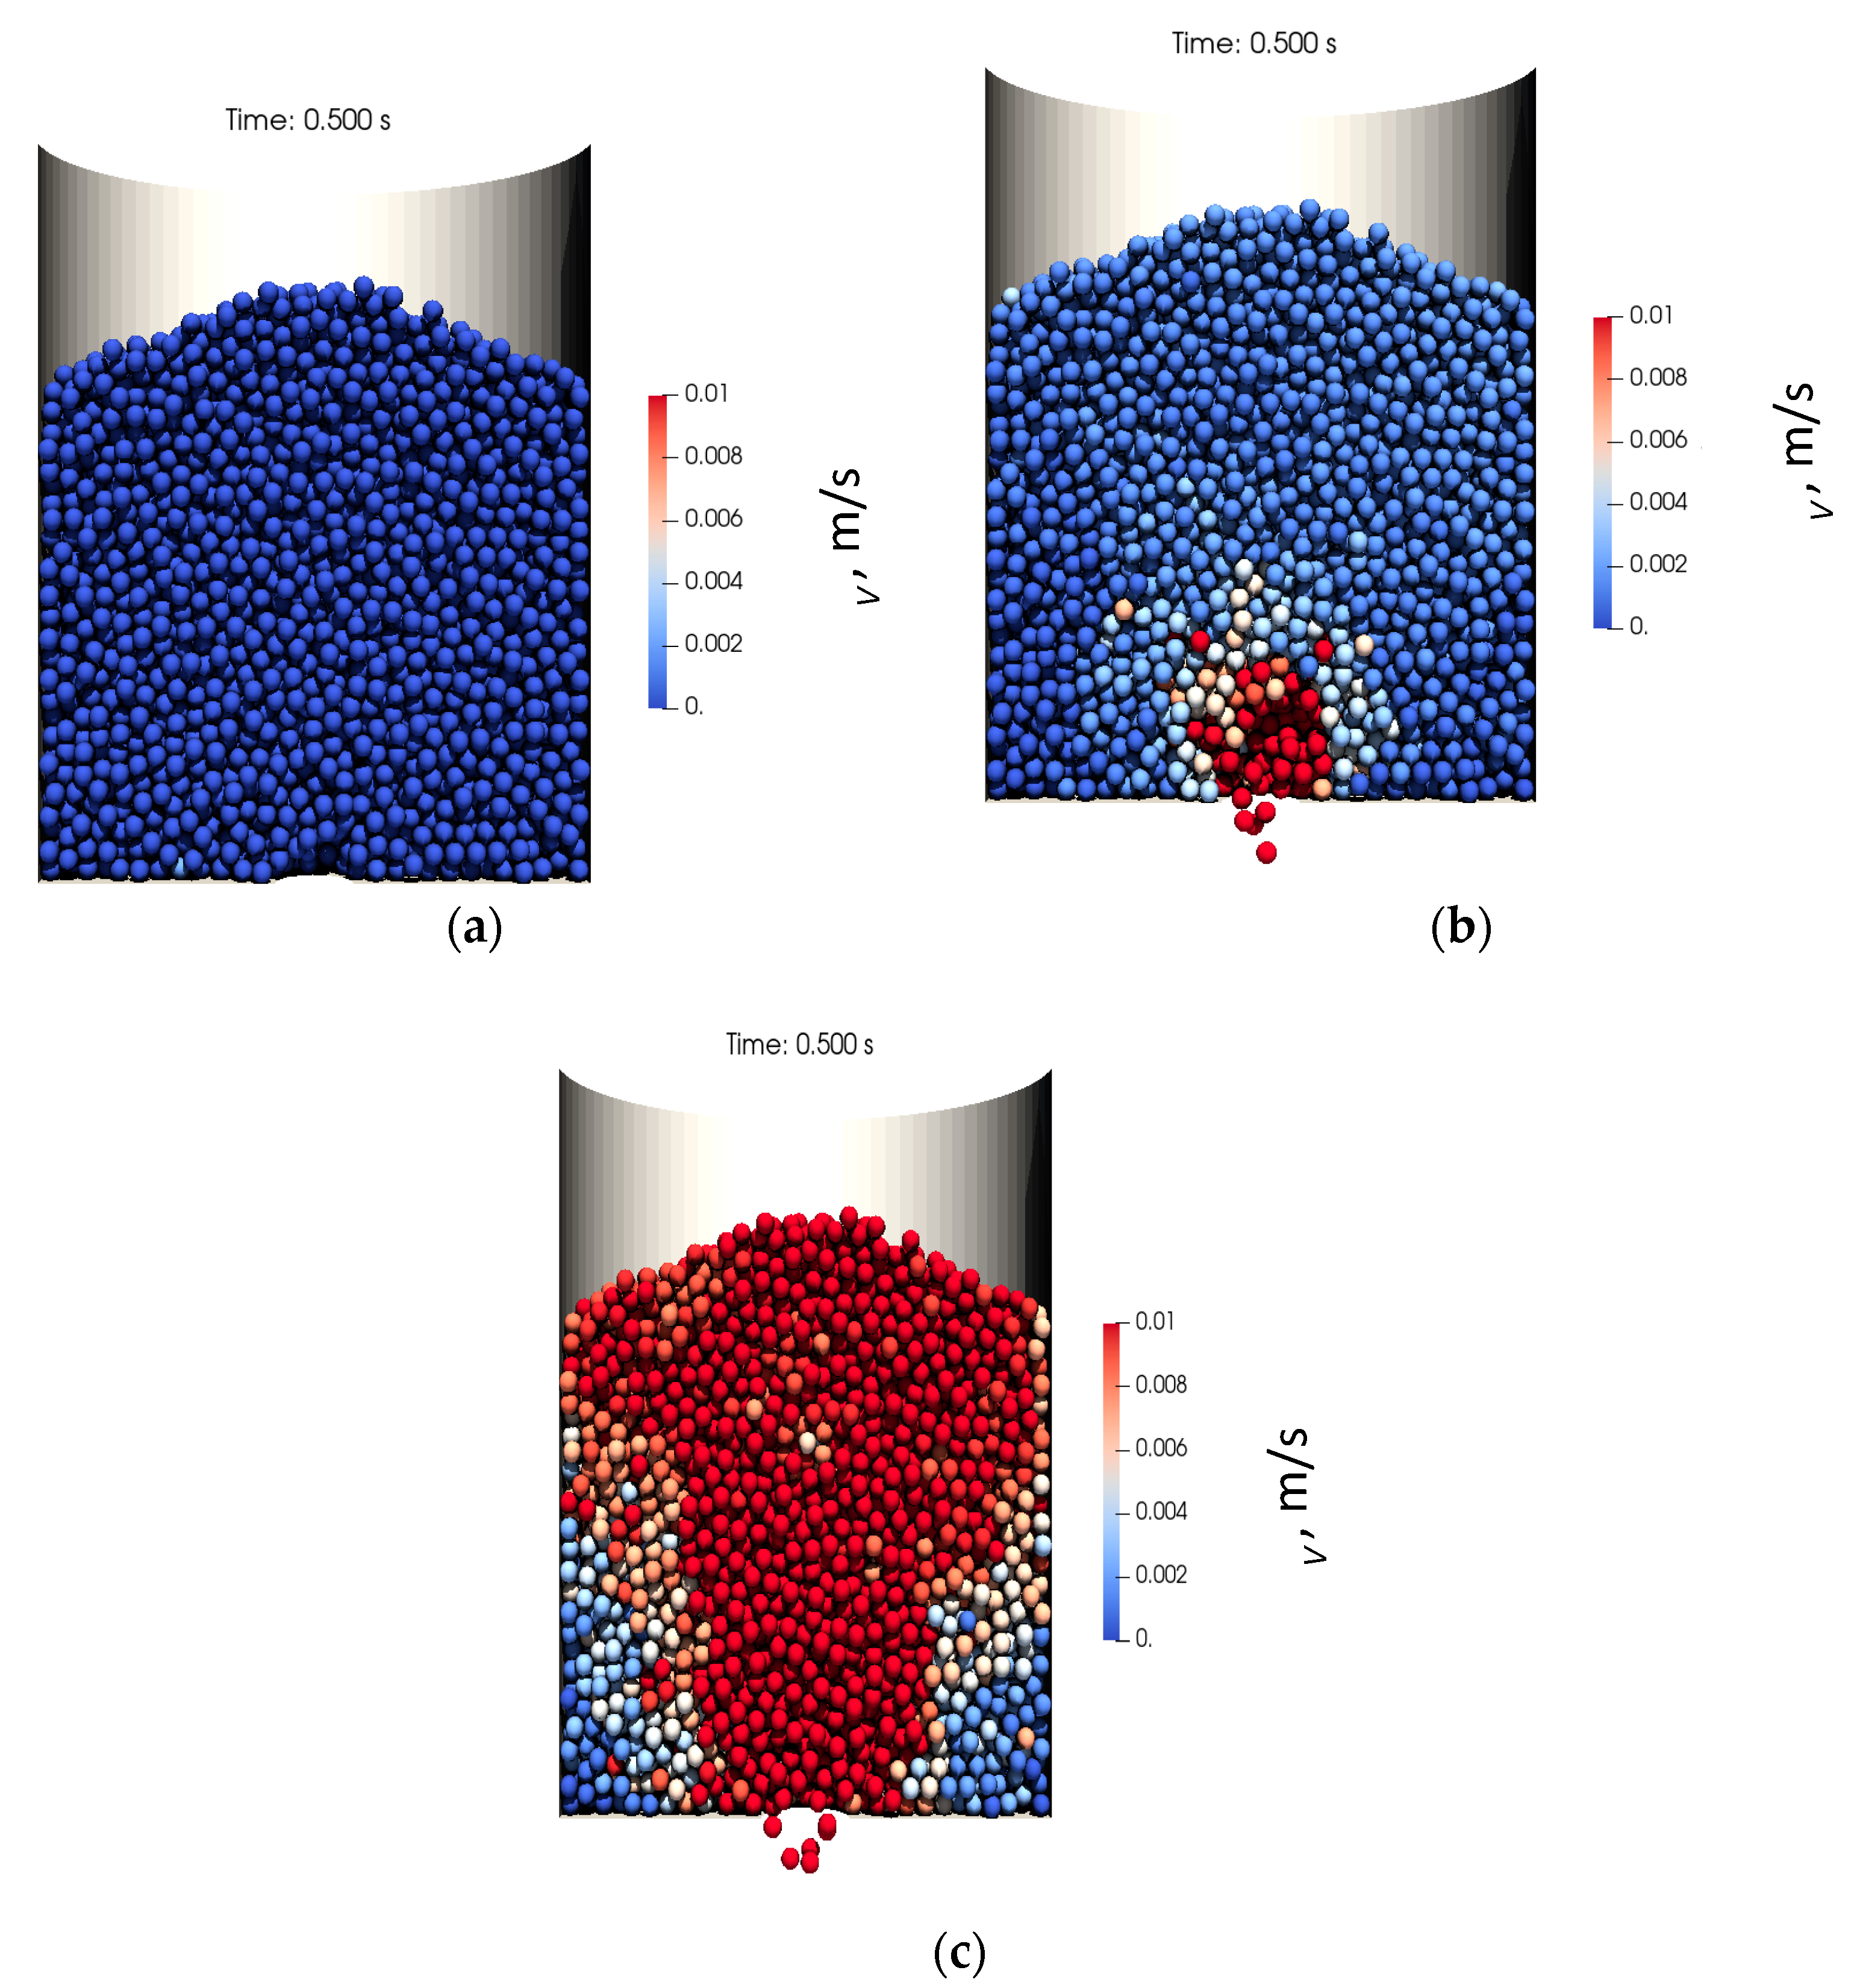
Three typical simulation outcomes are presented in Figure 4. In Figure 4a, only several particles in the closest proximity of the discharge gate were removed, and a stable arch was formed. In Figure 4b, the material was not clogged from the beginning but was prone to form a stable clog at a later time. The outflow was erratic, and the dynamic arches were formed and destroyed. The particle movement inside the silo radically switched in time from movement only around the discharge orifice to a pattern typical of mass/funnel flow. Figure 4c shows the typical mass/funnel flow pattern widely known from the literature. Three zones are visible: particles close to the silo axis moving downward as a stable block, the dead zone, i.e., the area in which particles are stagnant, observed in the lower corners of the silo, and the shear zone in between.
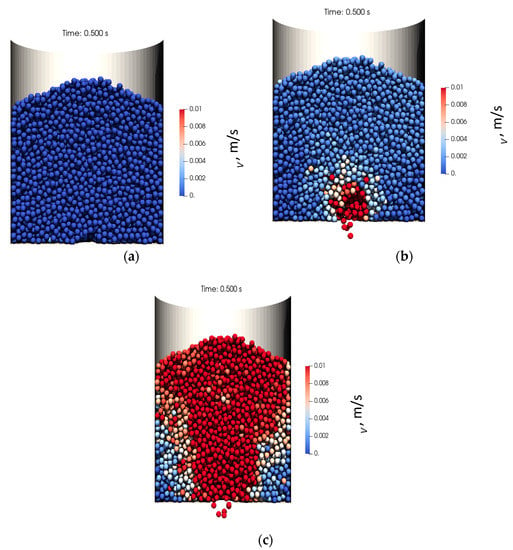
Figure 4.
Cross-section of the bedding after discharge commencement at flow arrest (D0 = 55 mm) (a), unstable discharge (D0 = 56 mm) (b), and smooth discharge (c) (D0 = 70 mm).
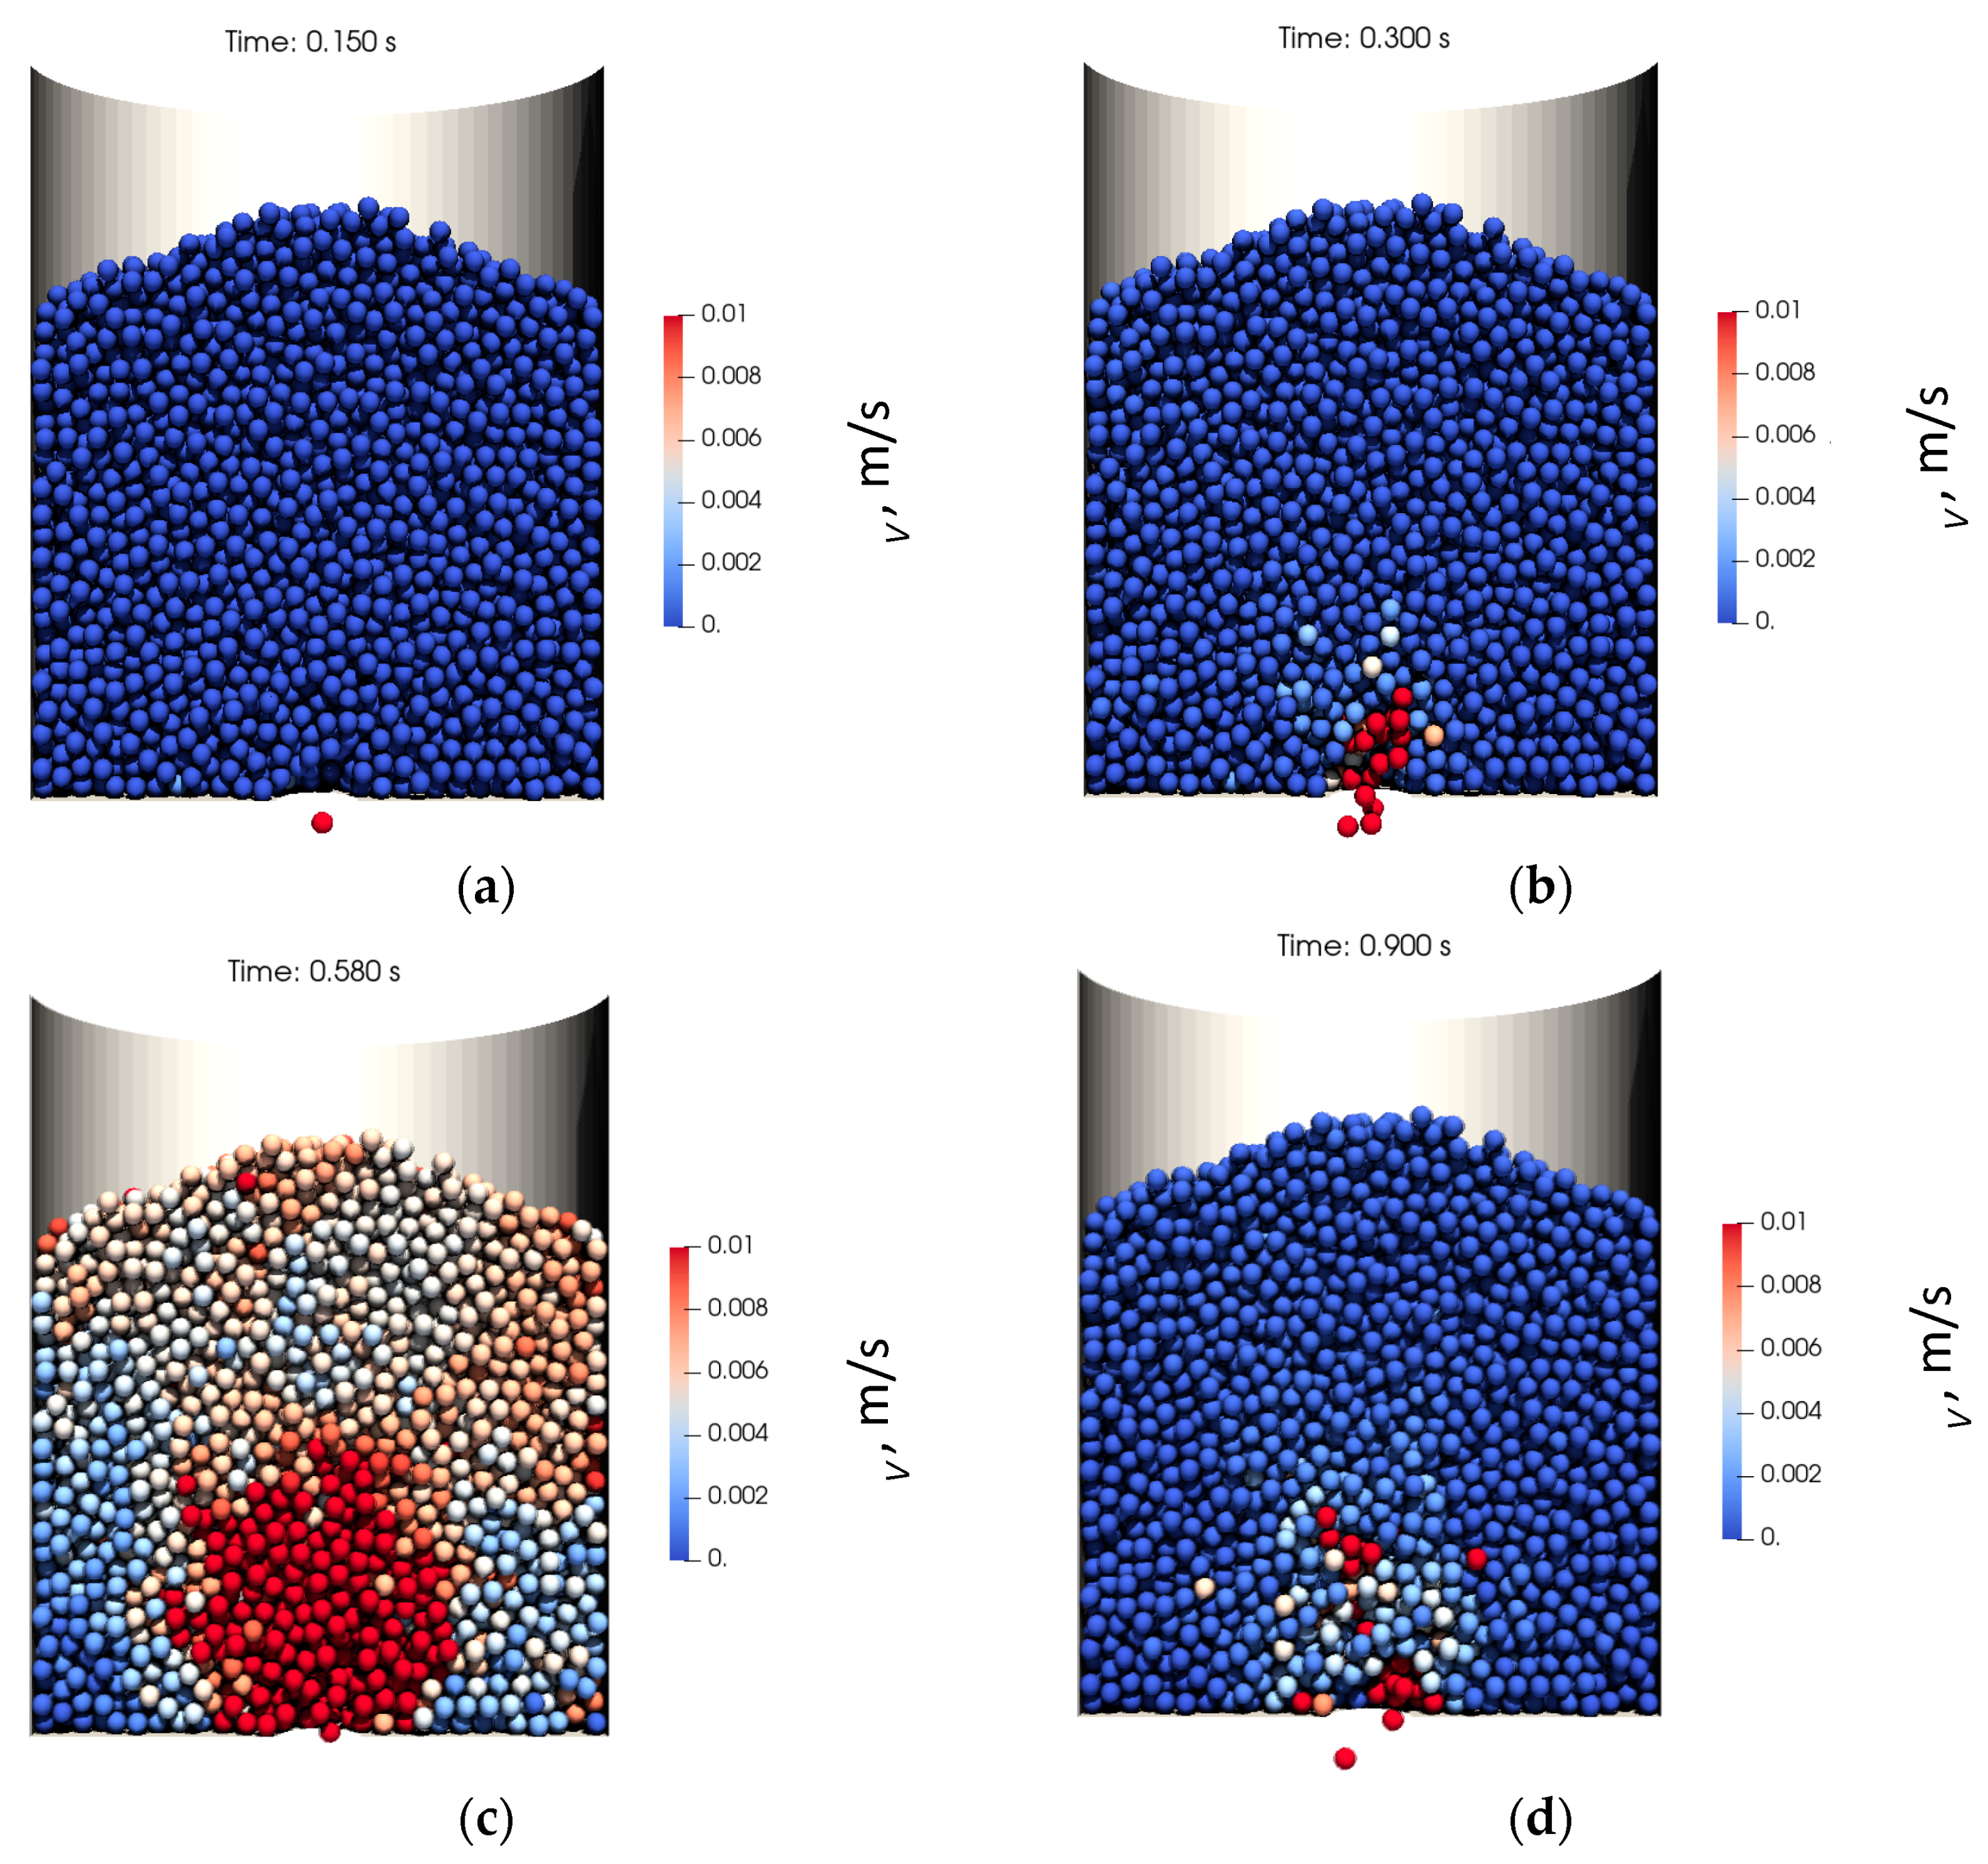
A typical unstable flow is shown in Figure 4b and Figure 5. Similar to the orifice size of 55 mm (Figure 4a), an almost stable arch began forming after the discharge initiation (Figure 5a—0.15 s after discharge initiation). However, in this case, some minor fluctuations led to the breakage of the arch (Figure 5b—0.3 s). In close proximity to the gate, strong local loosening of the material occurs, and several particles without contact with neighbors reached a velocity above 0.04 m/s (Figure 4b—0.5 s). Above these particles, an empty space can be observed, above which a group of particles with velocities between 0.02 m/s and 0.04 m/s commenced to move down. Figure 5c shows the state after 0.58 s of discharge where the range of deformation was much larger and reached the free surface of the bedding. The rapid movement of particles in wide volume led to blockage of the flow channel, and particle velocity decreased (Figure 5d—0.9 s). This stage was reached in a series of fluctuations where particles in the considered region slowed down and accelerated alternately. There was a probability of forming a stable arch; however, the described stages repeated and became more blurred with material loosening during the discharge.
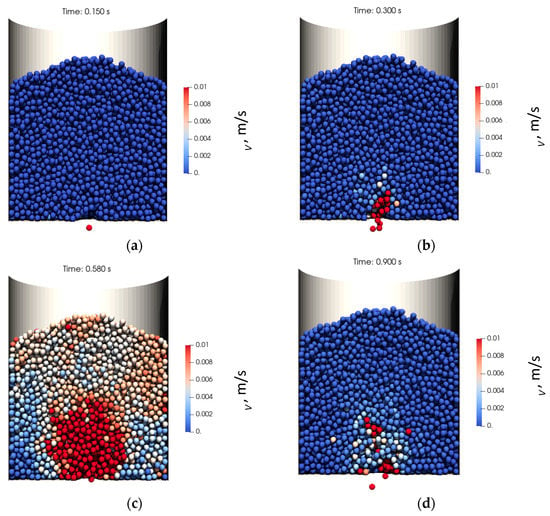
Figure 5.
Cross-section of the bedding of unstable flow for an orifice size of 56 mm, after 0.15 s (a), 0.3 s (b), 0.58 s (c), and 0.9 s (d).
3.3. Influence of the Coefficient of Sliding Friction, the Coefficient of Rolling Friction, and Young’s Modulus on Flow Arrest
Contrary to the experimental approaches, the numerical method allowed manipulating the material parameters and tracking individual particles in a full 3D setup. Therefore, several numerical tests were performed to analyze the flowing (disturbed flow) and non-flowing state (stable arch). The effect of the orifice diameter D0, the coefficient of particle–particle friction µpp, and the coefficient of rolling friction µrp on the material flow and the process of arch formation in the silo was studied. Table 2 presents the effect of the orifice diameter and the coefficient of particle–particle friction on the bulk density, ρb, and clogging process. The letter Y stands for ‘yes’ (clogging), and N denotes ‘no’ (no clogging).

Table 2.
Dependence of bulk density ρb and occurrence of the clogging process (Y—clogging, N—no clogging) on the orifice size D0 and the particle–particle friction coefficient µpp.
The investigation of the impact of the orifice size D0 on the flow of the material was conducted using a stable bed of particles with material parameters specified in Table 1. It was found that the orifice size of 0.055 m (equal to 3.67dp) was the maximal size at which the material was clogged right after opening the discharge gate. Only several particles from the close neighborhood of the discharge gate left the container. The increase in the orifice diameter to 0.056 m (3.73dp) was found to be sufficient for particles to produce unstable discharge. Even though the possibility of the particle clogging was not negligible, it did not occur with a further increase in the orifice size to 0.065 m.
The generation of the bedding separately for each simulation run may reflect the conditions of the real processes. However, DEM allows modifying the material parameters and rerunning the same bedding. Unfortunately, maintenance of the identical initial geometrical structure of the sample of the material after adjustment of material parameters is usually not possible. A decrease in the interparticle friction coefficient led to the reorganization of the contact network and an increase in the kinetic energy of particles. The increase in the μpp had no effect on the contact network, and a slight increase in the bulk density with an increase in the coefficient of particle–particle friction was observed.
The simulations were performed both for a pre-generated bed with the basic parameters and coefficient of friction adjusted before the discharge initialization (from restart) and for the full filling–discharge run using adjusted parameters (from beginning). The simulation results are presented in Table 2.
No direct relationship between µpp and the clogging process was observed. In the series of restarted runs, the material was less prone to clog at the discharge initiation due to the unnatural contact structure. The material formed a stable arch at the very beginning only at µpp = 0.12. From a practical point of view, very interesting results were obtained for µpp = 0.2 and 0.6 when the orifice size was 0.06 m. The discharge initiation did not result in an immediate clog, but the flow stopped at about 0.99 s and 3.2 s after opening the discharge gate. In the simulations where the bed was generated with given parameters, no flow arrest was observed within the first 5 s of the silo discharge. Afterward, the material was either in clog (for µpp = 0.14, 0.15, 0.16, 0.18, and 0.60 and D0 = 0.060 m) or exhibited unstable flow (for µpp = 0.12, 0.13, 0.20, and 0.60 and D0 = 0.056 m).
Even if no clear effect of µpp on the arch formation was found, the influence of friction on the internal structure of the bed, represented in Table 2 as a global bulk density, was clearly visible. The value of bulk density varied from 457 to 471.7 kg/m3 in the clean simulation runs and from 460 to 464.5 kg/m3 in the restarted runs after resettling it until the kinetic energy of the particles decreased below 1.6 × 10⁻¹⁰ J.
The coefficient of rolling friction µrp was originally introduced as a simple and computationally inexpensive means to complicate the spherical shape of the particle. In this study, the Constant Directional Torque (CDT) model, which adds torque resistance to the particle [36], was applied. The behavior of the newly generated beds with the value of µrp of 0.01, 0.05, and 0.1 for orifice sizes not exceeding 0.060 m and with µrp of 0.3 and 0.8 for orifice sizes larger than 0.060 m was studied.
A strong relationship between the clogging and the coefficient of rolling friction µrp was observed. The minimal orifice diameter for which no dome was formed in material with basic material parameters (µpp = 0.36, µrp = 0) was 0.056 m. The introduction of the coefficient of rolling friction of 0.01 resulted in flow arrest, which also occurred for µrp equal to 0.05 or 0.1. For the orifice size of 0.060 m, the material flow was arrested when the coefficient of rolling friction was 0.1. This effect was not observed for smaller values of µrp. The material clogging took place for D0 = 0.07 m (i.e., almost half of the diameter of the silo) and µrp in a range from 0.3 to 0.8. For an orifice diameter of 0.075 m (equaled to 5dp), even as high µrp as 0.8 did not disturb the flow of the material from the silo. Thus, it may be concluded that the incapability of particles of free rotation is one of the main causes of discharge orifice clogging.
No predictable pattern of clogging of the material in the deposit was observed when Young’s modulus increased or decreased by two orders of magnitude.
3.4. Micro-Mechanical Analysis of Clogging
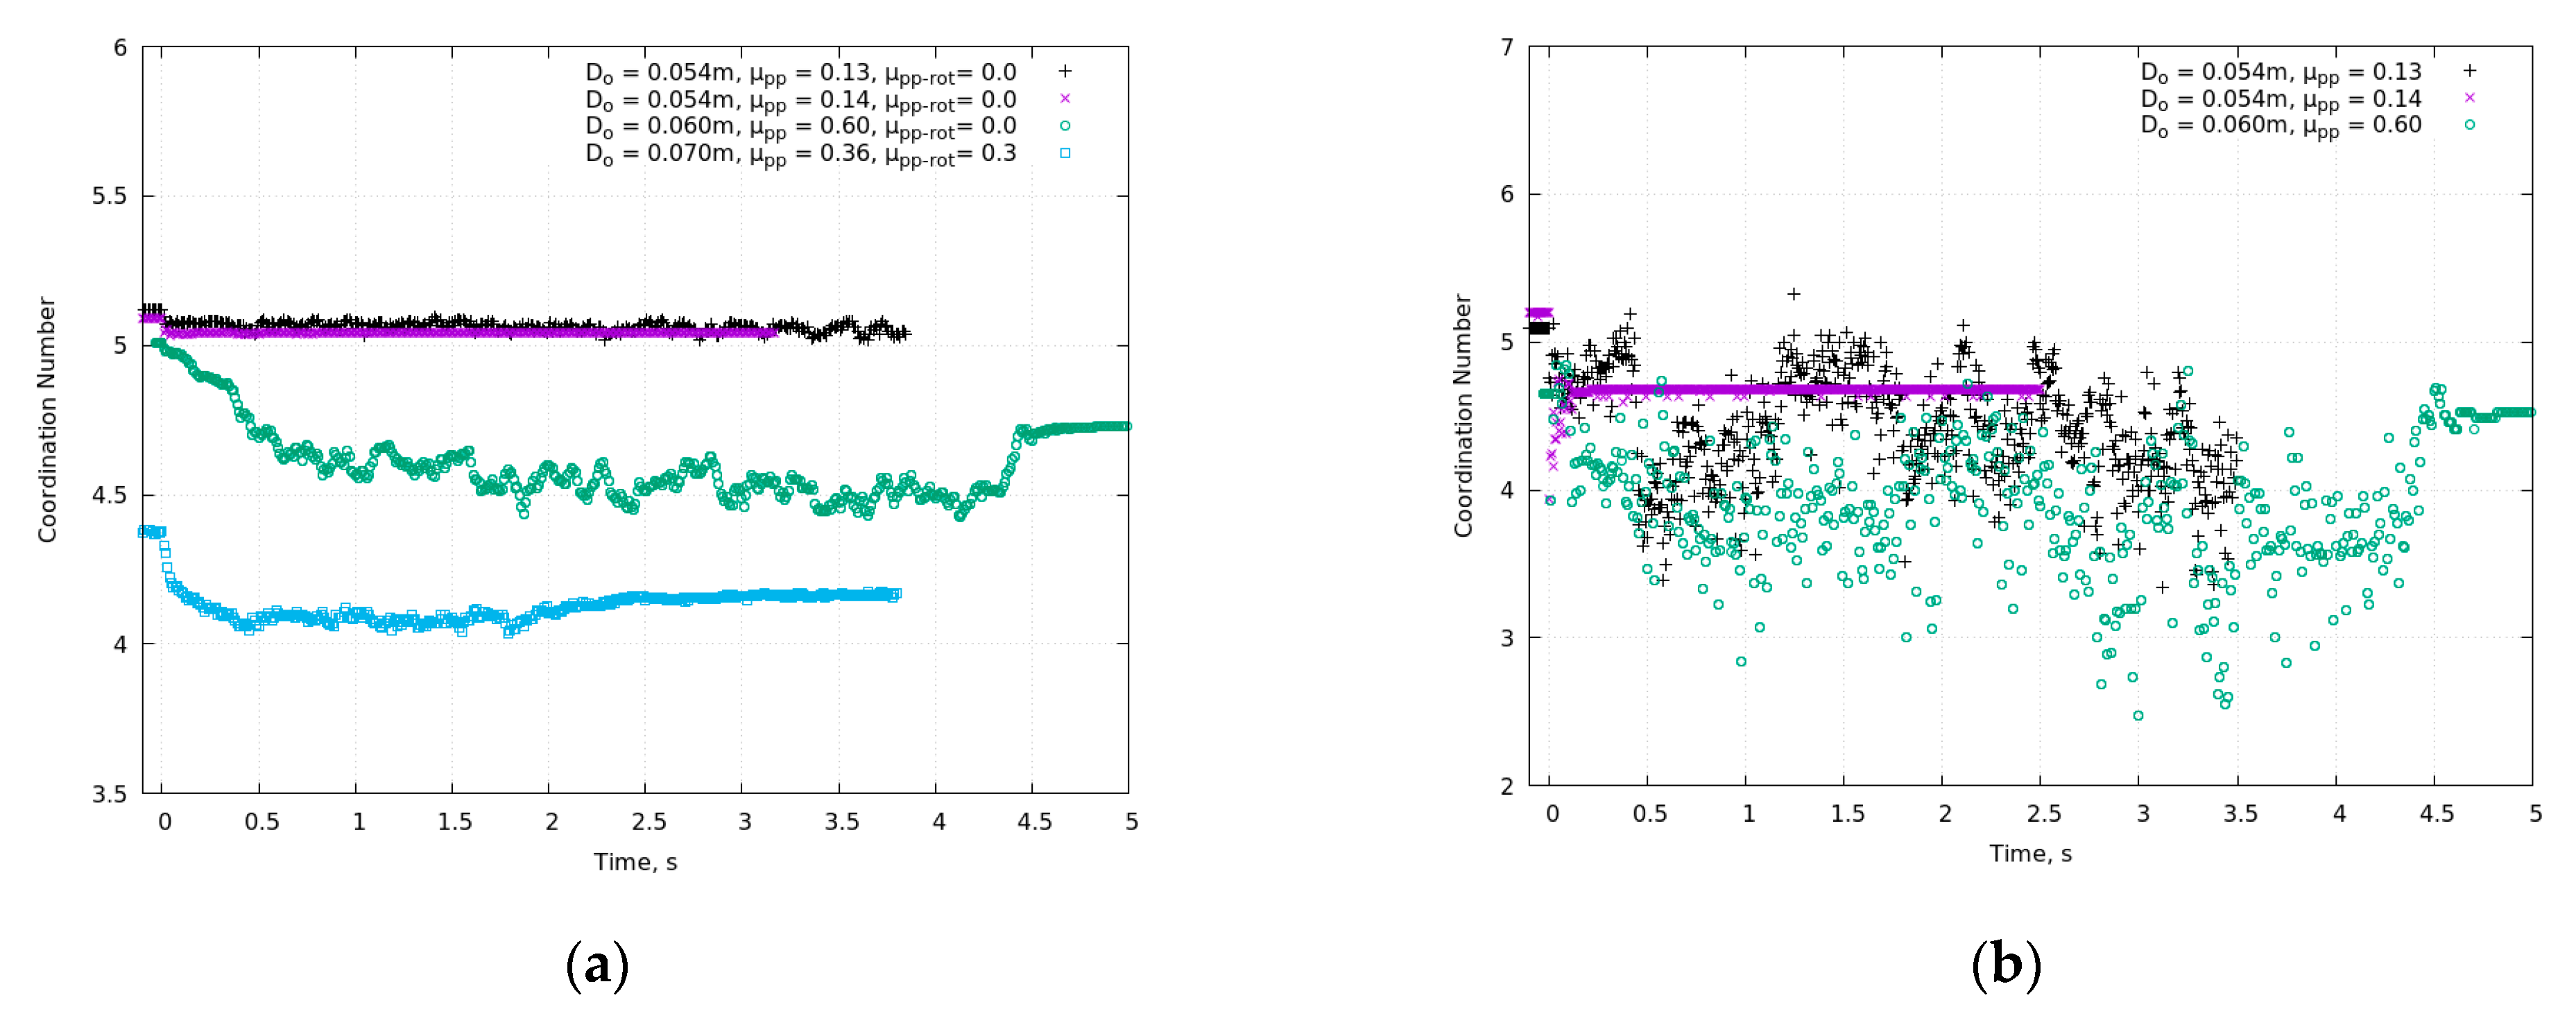
The evolutions of the average coordination number z with time at the end of detention (negative times) and after opening the orifice for D0 = 0.054 m and µpp = 0.13 and 0.14, as well as D0 = 0.06 m and µpp = 0.06, for µrp = 0 are presented in Figure 6. The coordination numbers were calculated for the whole bedding (Figure 6a) or in the proximity of the outlet (cylinder 0.2 m in diameter and 0.11 m high) (Figure 6b). Figure 6a additionally presents the results predicted for D0 = 0.07 m, µpp = 0.36 and µrp = 0.3.
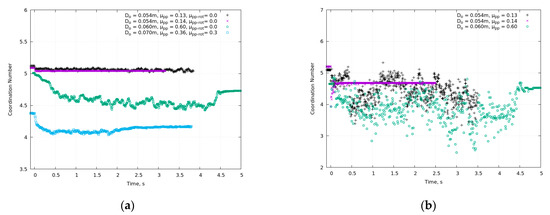
Figure 6.
Evolutions of the average coordination number with time at the end of detention (negative times) and after opening the orifice for various values of D0, µpp, and µrp, for the whole bin (a) and in the proximity of the outlet (cylinder 0.11 m high, 0.1 m radius) (b).
The lowest variations in the average coordination number were observed in beddings composed of particles with µrp = 0. In these cases, the coordination number was 5.12 and 5.09 for the coefficient of interparticle sliding friction of 0.13 and 0.14, respectively. An increase in µpp to 0.60 resulted in a z value of 5.01. However, the largest decrease in the coordination number was observed when the coefficient of rolling friction was introduced. For µrp = 0.3 the static z was equal to 4.37.
These results are in agreement with a general tendency that the higher the friction is, the smaller the coordination number is [37]. Maximum possible z = 6 is the value for a frictionless assembly of spherical particles.
In all cases, a significant decrease in the coordination number was observed after opening the discharge gate, which was due to losing support from this part of the bottom and loosening the material inside the bed.
In the two presented cases with D0 = 0.054 m, only the first decrease was observed. In the simulation with µpp of 0.14, which produced a stable arch just after the discharge initiation, the value of z was reduced to about 5.04 and remained stable at this value. The simulation with µpp of 0.13 produced a different outcome: in the first 5 s of the simulation time, the discharge was never stopped. However, the value of z was only slightly different from that calculated for µpp = 0.14. It fluctuated at a stable level in the range from 5.03 to 5.09. The phase of loosening of the material after the discharge start was more pronounced for the larger orifice sizes D0 (0.06 m and 0.07 m at Figure 6a). In these cases, the sudden drop in the coordination number due to the loosening of the support at the discharge gate was followed by a further slow decrease in z with time. The length of this phase depended on the orifice size and was connected with the discharge rate. It took about 0.4 s for D0 = 0.06 m and about 1 s for D0 = 0.07 m. After the loosening phase, as in the case with D0 = 0.054 m and µpp = 0.13, the fluctuation of the coordination number stabilized at z around 4.5–4.6 for the orifice size of 0.06 m, the coefficient of sliding friction of 0.06, and the particle–particle rolling friction coefficient of 0, and about 4.1 for the orifice size of 0.07 m, coefficient of sliding friction of 0.36, and the coefficient of rolling friction of 0.3.
When the flow of the material was about to arrest at approximately 4.4 s after the discharge start, a rapid increase in z was observed from 4.5 to 4.72 for D0 of 0.06 m. In DEM simulations, this effect was not synchronized with the arrest of movement in the particle bed; still, some particles were in motion, e.g., some loose particles continued to move toward the discharge gate, some oscillations were still visible even in the upper parts of the container, and the particle movement ceased only about 0.3 s afterward, at about 4.7 s. If a relatively high µrp of 0.3 was used, only a weak build-up from an average of about 4.1 to 4.16 was observed for D0 of 0.07 m. This leads to the conclusion that the build-up is mostly realized through rotations. If an additional restriction of rotation was applied, only spatial fluctuations were allowed, and no such increase was observed.
Figure 6b shows the evolution of the coordination number with time at the end of detention and during the commencement of the silo discharge obtained for the 0.1 m in diameter and 0.11 m high cylinder coaxial with the outlet orifice. The oscillations observed in Figure 6a originated mostly from the close proximity of the orifice. The fluctuations in the z(t) relationship after opening the orifice (Figure 6b) were much stronger due to the close distance to the origin of the disturbance, i.e., the orifice. The coordination number varied from about 3.5 to 5.1 for D0 = 0.054 m and µpp = 0.13 and from 2.5 to 4.9 for D0 = 0.06 m and µpp = 0.06. For D0 = 0.054 m and µpp = 0.13, a rapid decrease in the z value from 5.04 to 3.79 was observed at the beginning of the discharge process due to the loss of support from the discharge gate. In the next silo discharge stage, the z value increased to 4.68.
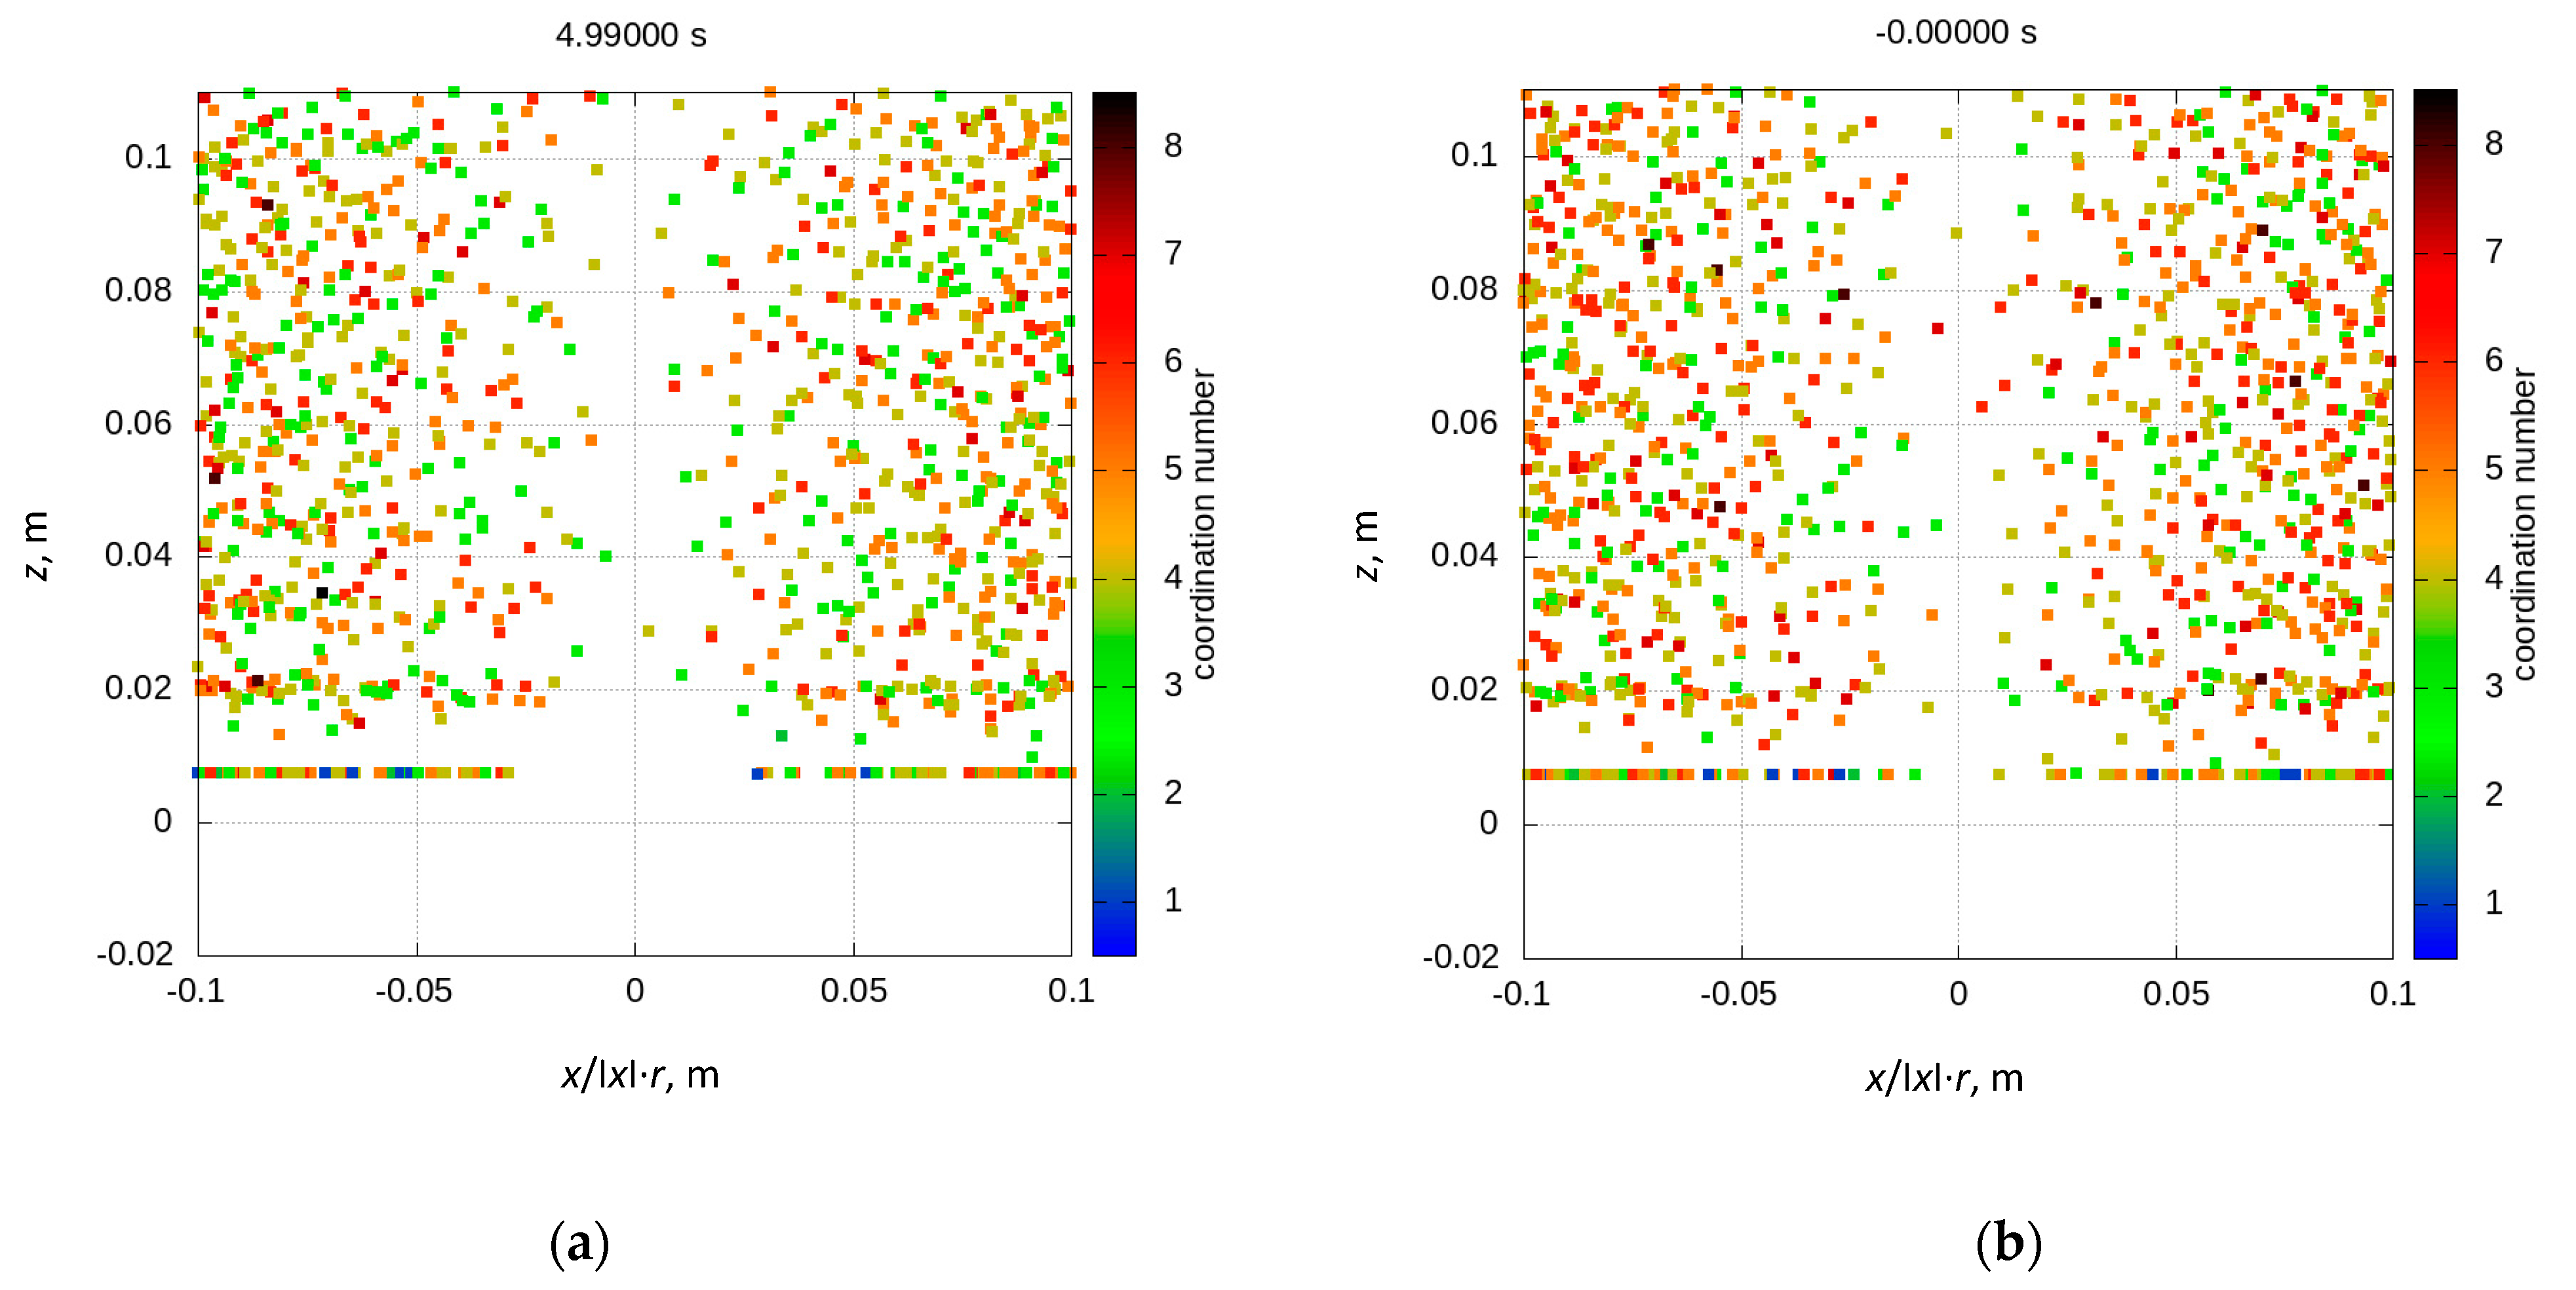
Figure 7 presents the radial distribution of the coordination number in the bedding. Before the discharge initiation (Figure 7a), the coordination number was distributed rather uniformly with a typical value in a range from 3 to 6, and after clogging (Figure 7b), the loosening of the material led to decreasing the value of the typical coordination number especially observed at the upper end of the scale, i.e., much fewer particles with coordination number equal to 6 and above.
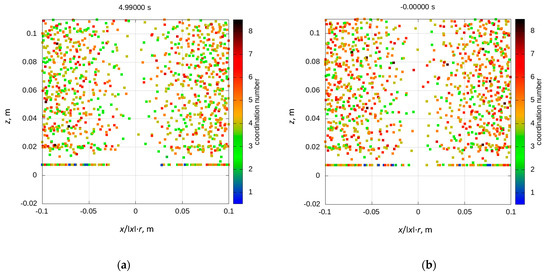
Figure 7.
Radial distribution of the coordination number in close proximity of the discharge gate for D0 = 0.6, µpp = 0.6, and µrp = 0, before discharge initiation (a) and after clogging (b).
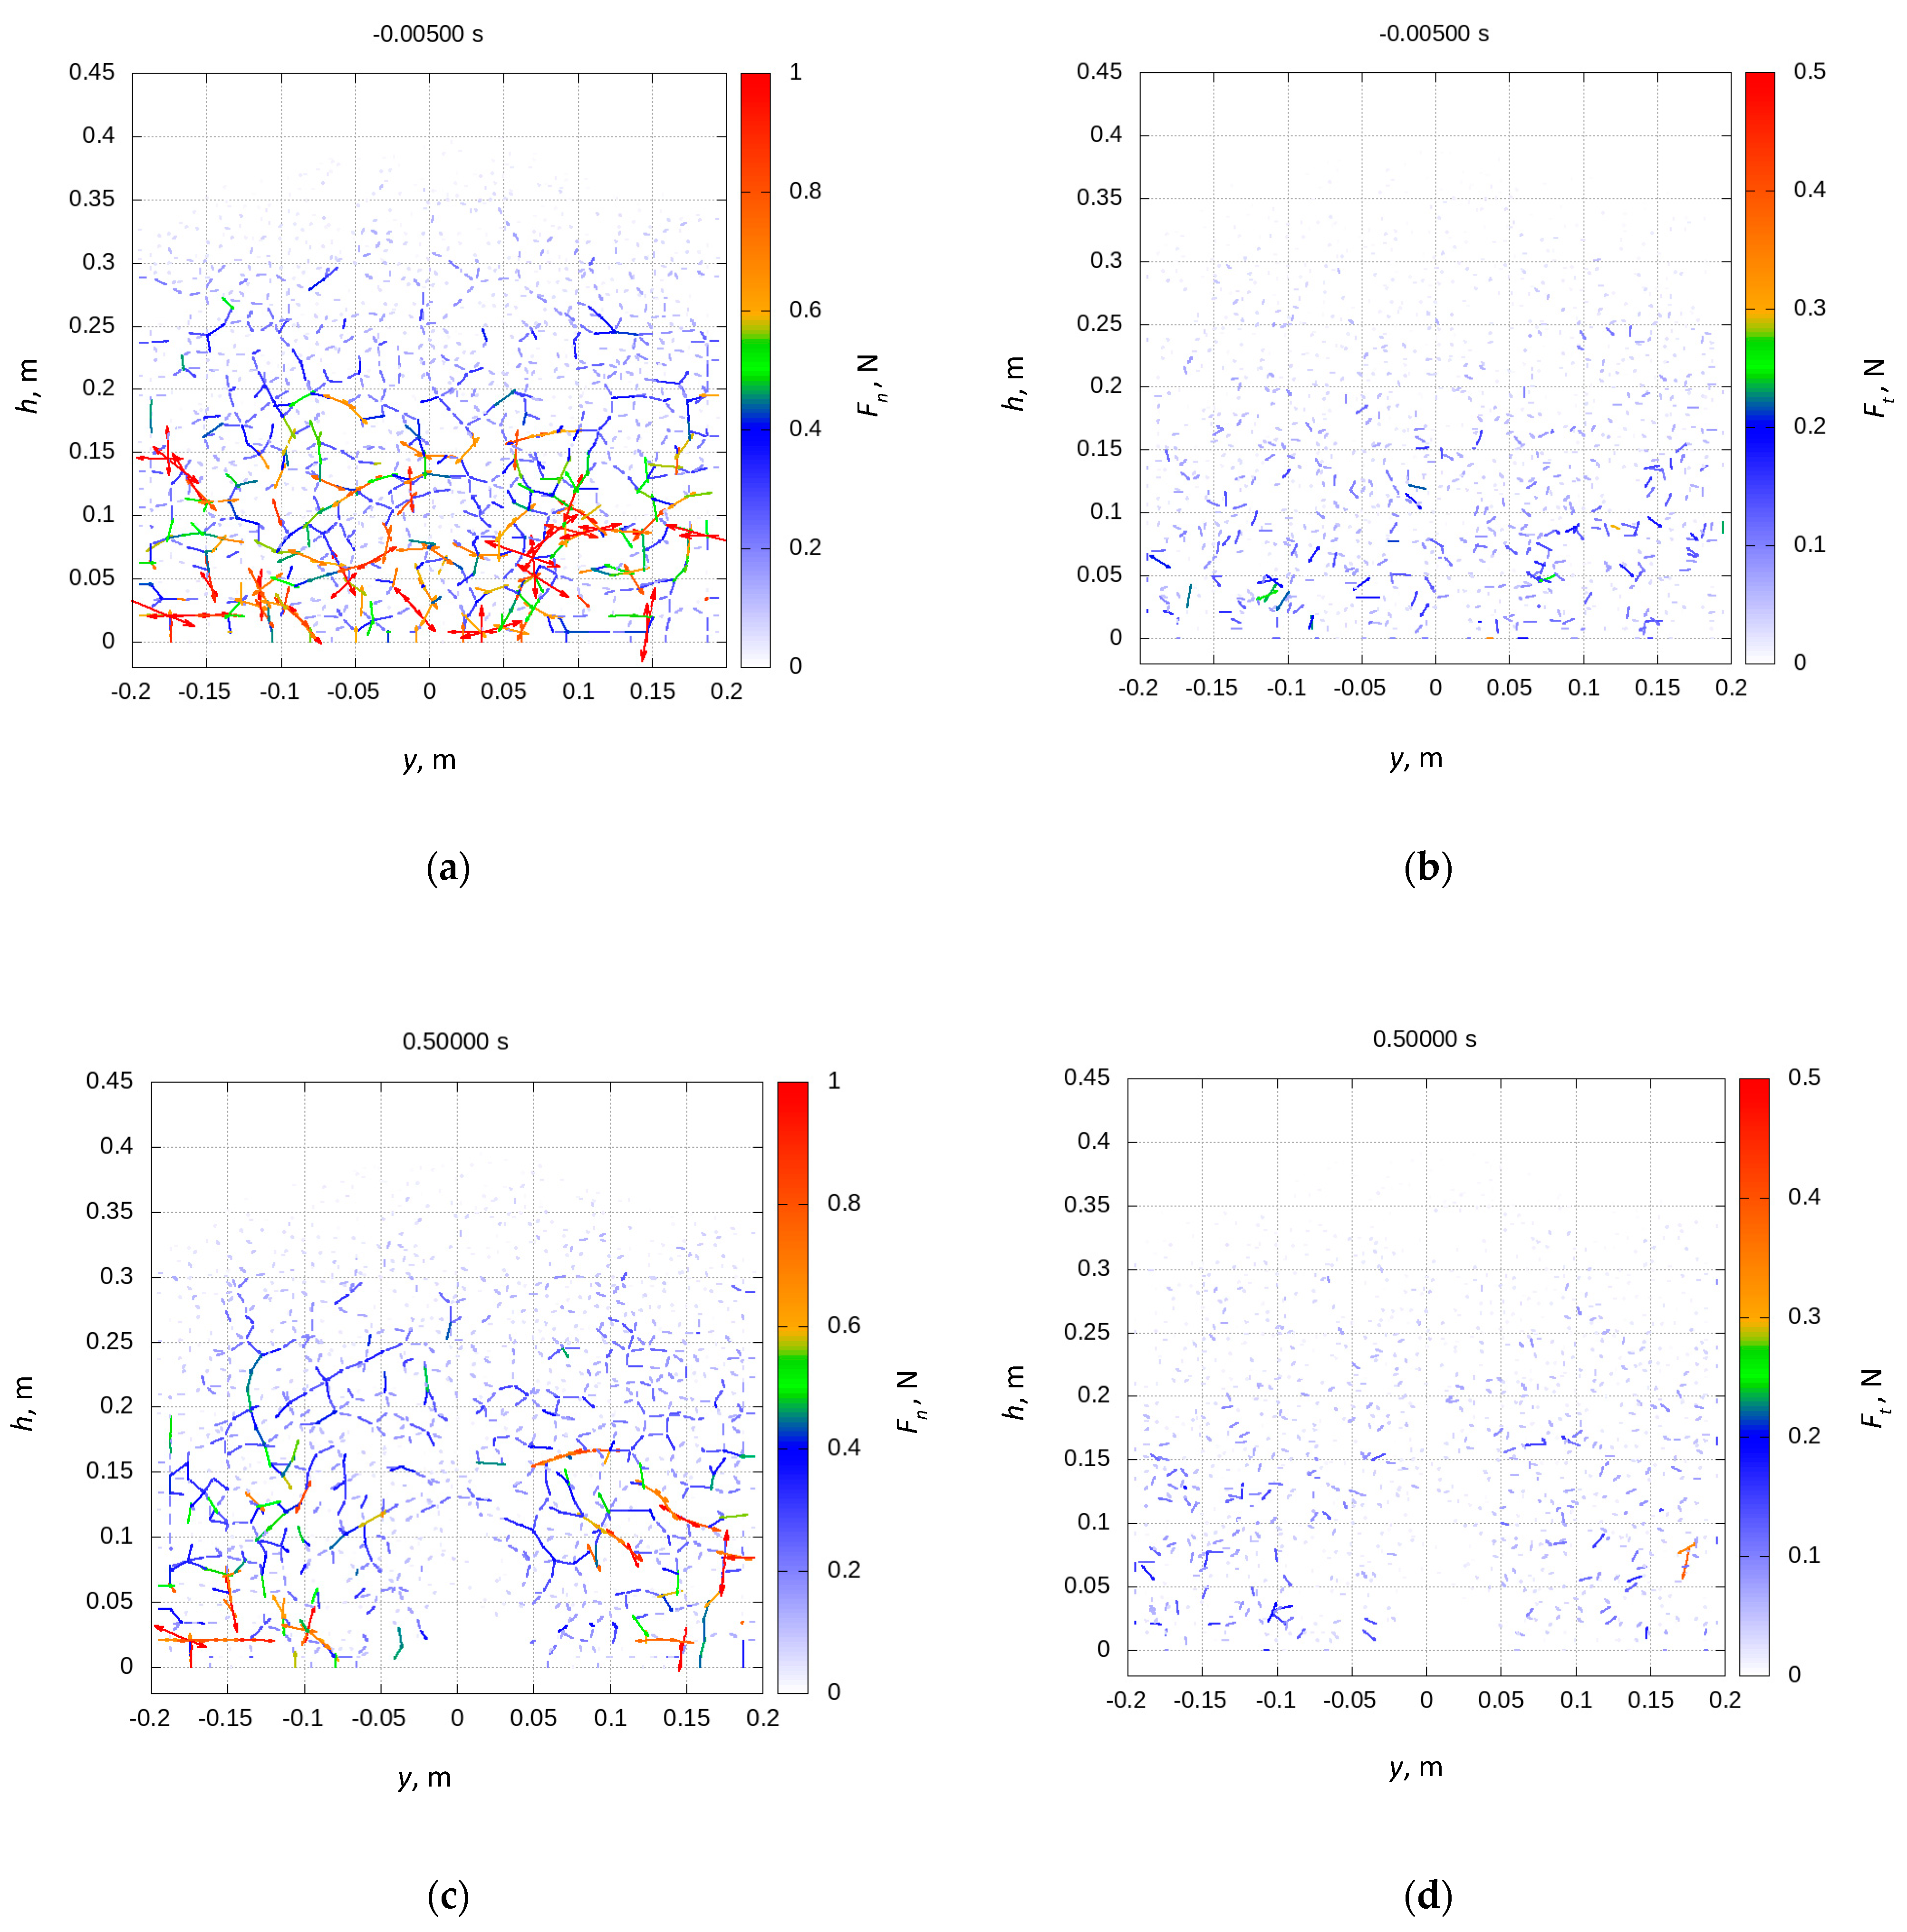
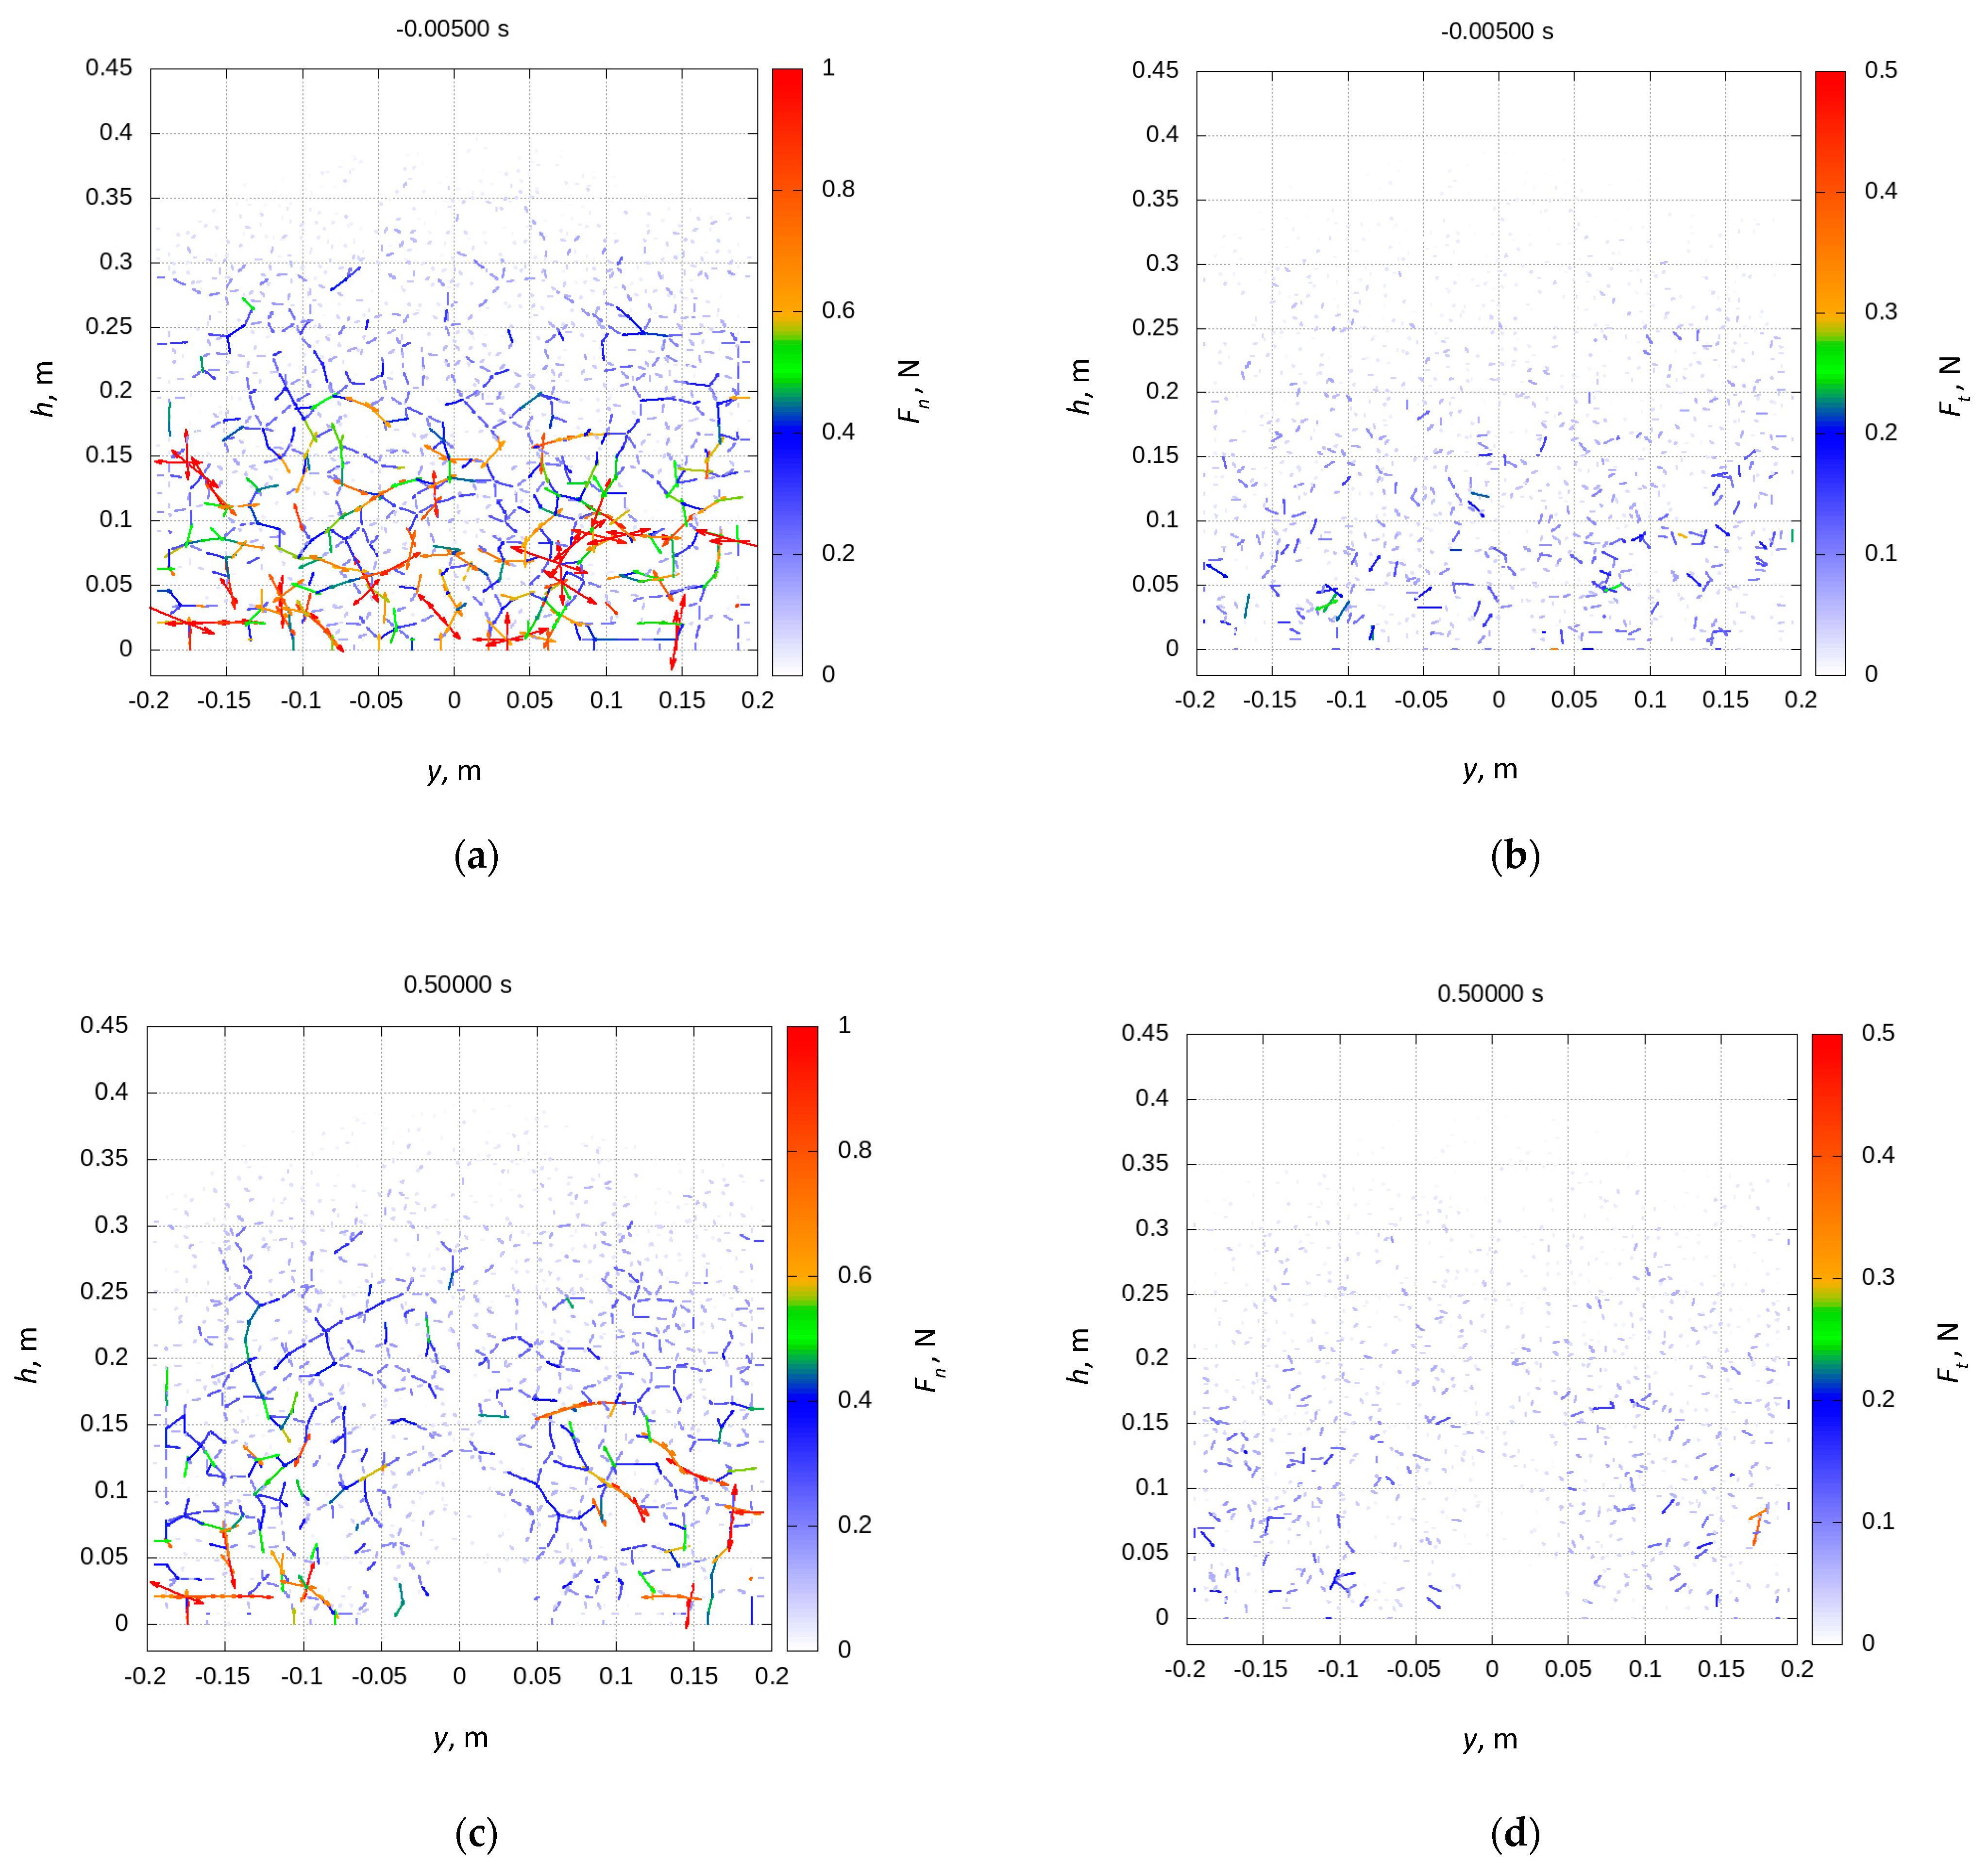
In the DEM simulations, the interparticle forces were calculated based on the Hertz–Mindlin theory of elastic frictional collisions between particles. The networks of interparticle normal and tangential forces at the end of detention and discharge commencement are shown in Figure 8 and Figure 9. The illustration was extracted for certain time steps for an orifice size of 0.055 m (Figure 8) and 0.056 m (Figure 9), coefficient of sliding friction of 0.36, and no rolling friction. The forces in the bedding in the static state are shown in Figure 7a and, at this point, were independent of the size of the orifice. In the lower part of the bedding, chains of stronger normal forces marked in red are visible. At the discharge commencement, redistribution of contact forces took place, the number of strong forces decreased, and fewer force chains directed downward could be observed. In terms of continuum mechanics, this trend may be described as the rotation of the principal stresses where the larger principal stress rotates toward a horizontal and vertical floor load decrease [38]. While forming a stable arch (Figure 8), the particles above the orifice were removed; hence, no contact forces in this area were present. In this case, the stable dome was formed, but no strong normal forces above the orifice and the dome were observed.
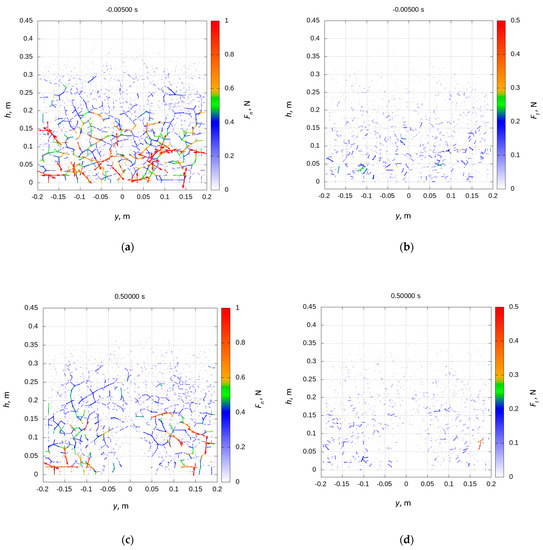
Figure 8.
Network of interparticle normal (left column) and tangential (right column) forces at the cross-section of the bedding with D0 = 0.055 m at static conditions (a,b) and at flow arrest (c,d).
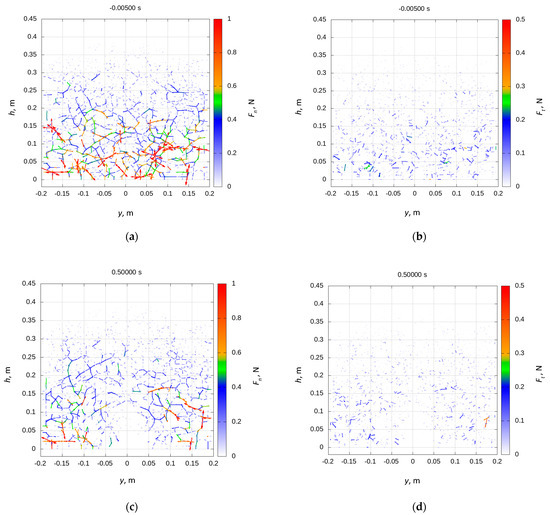
Figure 9.
Network of interparticle normal (left column) and tangential (right column) forces at the cross-section of the bedding for D0 = 0.056 m at discharge time of 0.3 s (a,b) and 0.58 s (c,d).
In contrast to the case with D0 = 0.056 m, where no flow arrest occurred, an arch structure of stronger forces at a height equal to about two times the height of the dome was formed above the center of the floor during the discharge process (Figure 9a). This arch was later broken (Figure 9b), and an undisturbed mass flow phase was observed (compare with velocity profiles in Figure 5b,c).
In the DEM code, the particle–particle coefficient of friction µpp, also known as the Coulomb limit, was the cut-off parameter in the calculation of tangential contact force. If the computed tangential to normal force ratio exceeded the value of the coefficient of friction, the tangential force decreased to fulfill this condition. The friction force between particles is presented in the right columns in Figure 8 and Figure 9. Following the normal force pattern, the value of the tangential force component decreased, and no strong force mobilization was observed.
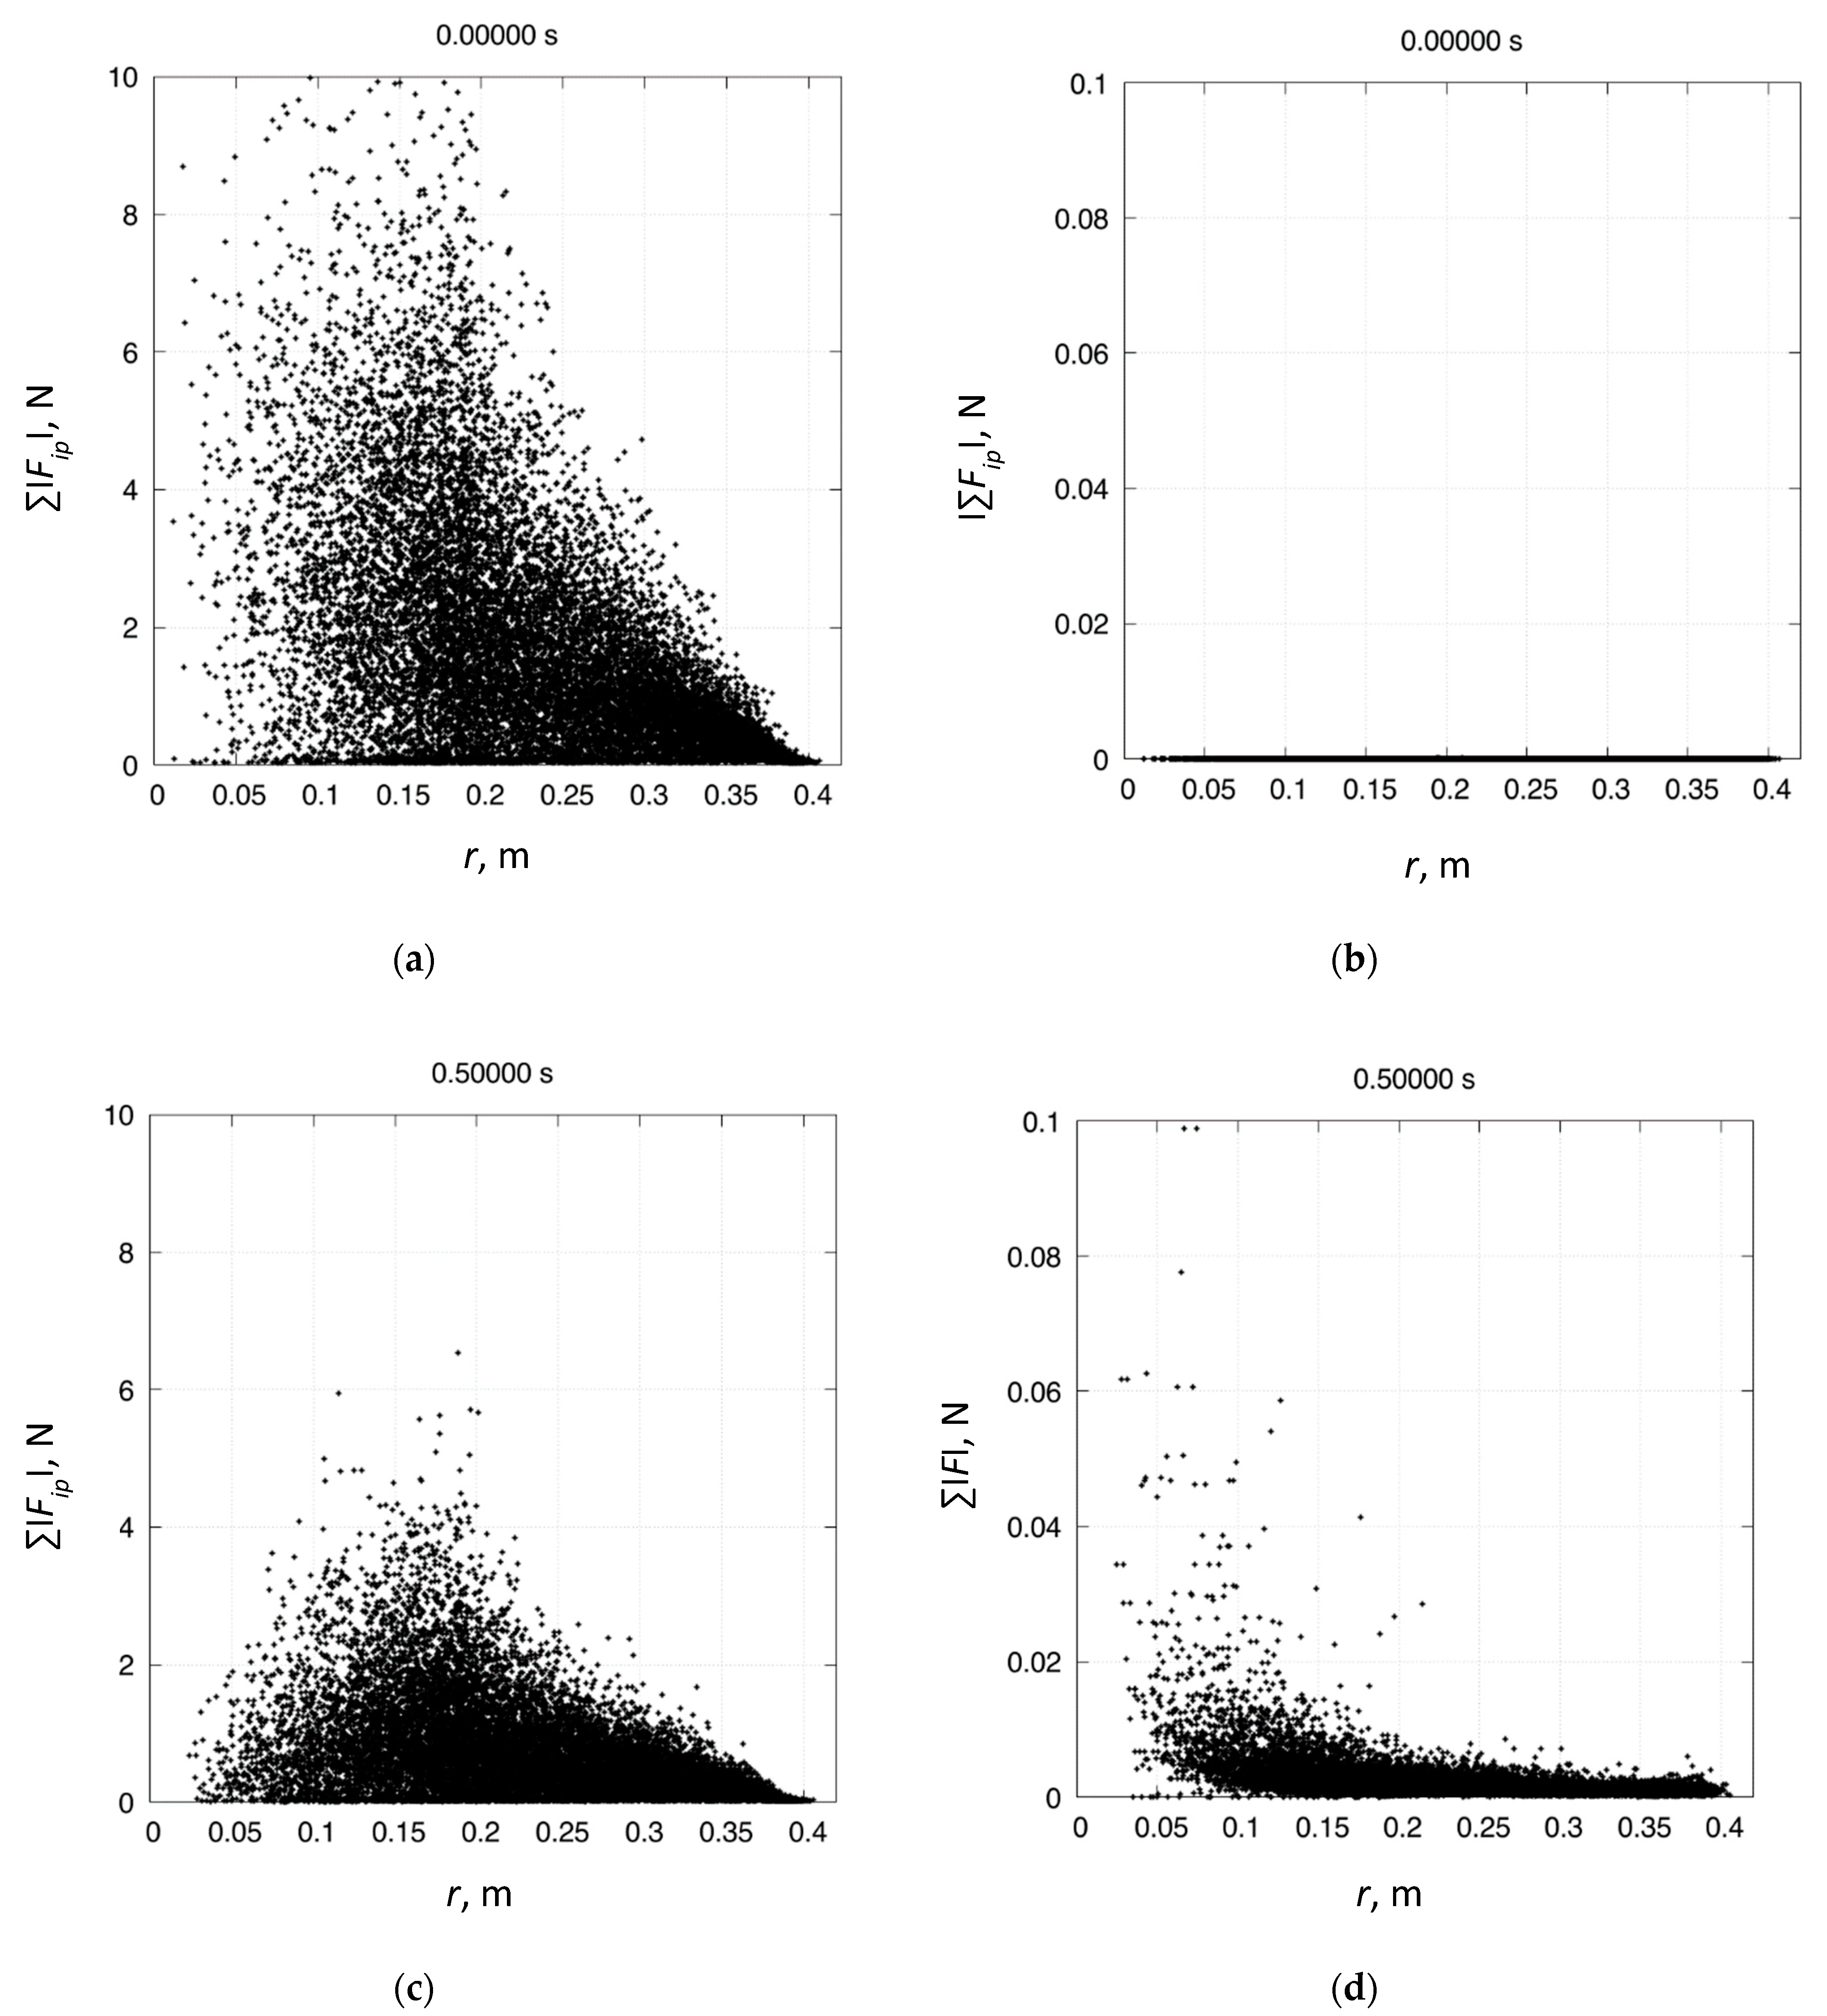
Figure 10 illustrates the distribution of the contact forces acting on particles as dependent on the distance from the center of the discharge orifice. Figure 10a,c represent the distribution of sums of the lengths of vectors of compressive forces acting on particles, while Figure 10b,d show the lengths of the resultant of sums of vectors of the same forces. The upper pair of the graphs shows the state just before opening the orifice, and the lower pair of graphs shows the situation after 0.5 s of discharge. The highest forces corresponding to mean pressure in the bedding occurred in the static case, where the resultant forces were simultaneously nearly equal to zero, reflecting the load equilibrium. This simulation outcome agreed with the known behavior of the bedding. The commencement of discharge resulted in a decrease in the density of the bedding in proximity to the orifice accompanied by a decrease in the coordination number.
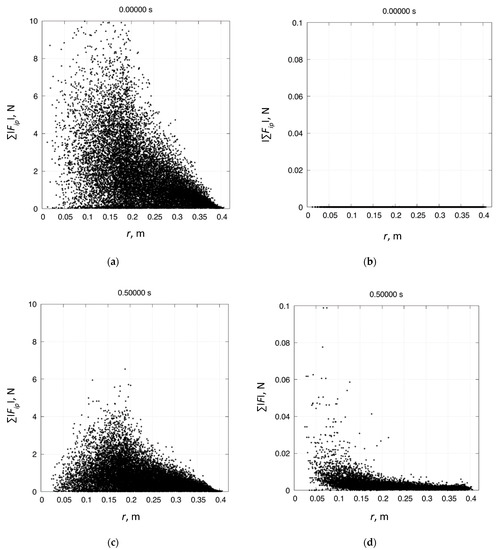
Figure 10.
Forces acting on the particles as a function of distance from the center of the orifice for D0 = 0.056 m. Compressive forces, Σ |Fip|, (a,c) and resultant forces, |Σ Fip|, (b,d) in the static state, and after 0.5 s of discharge.
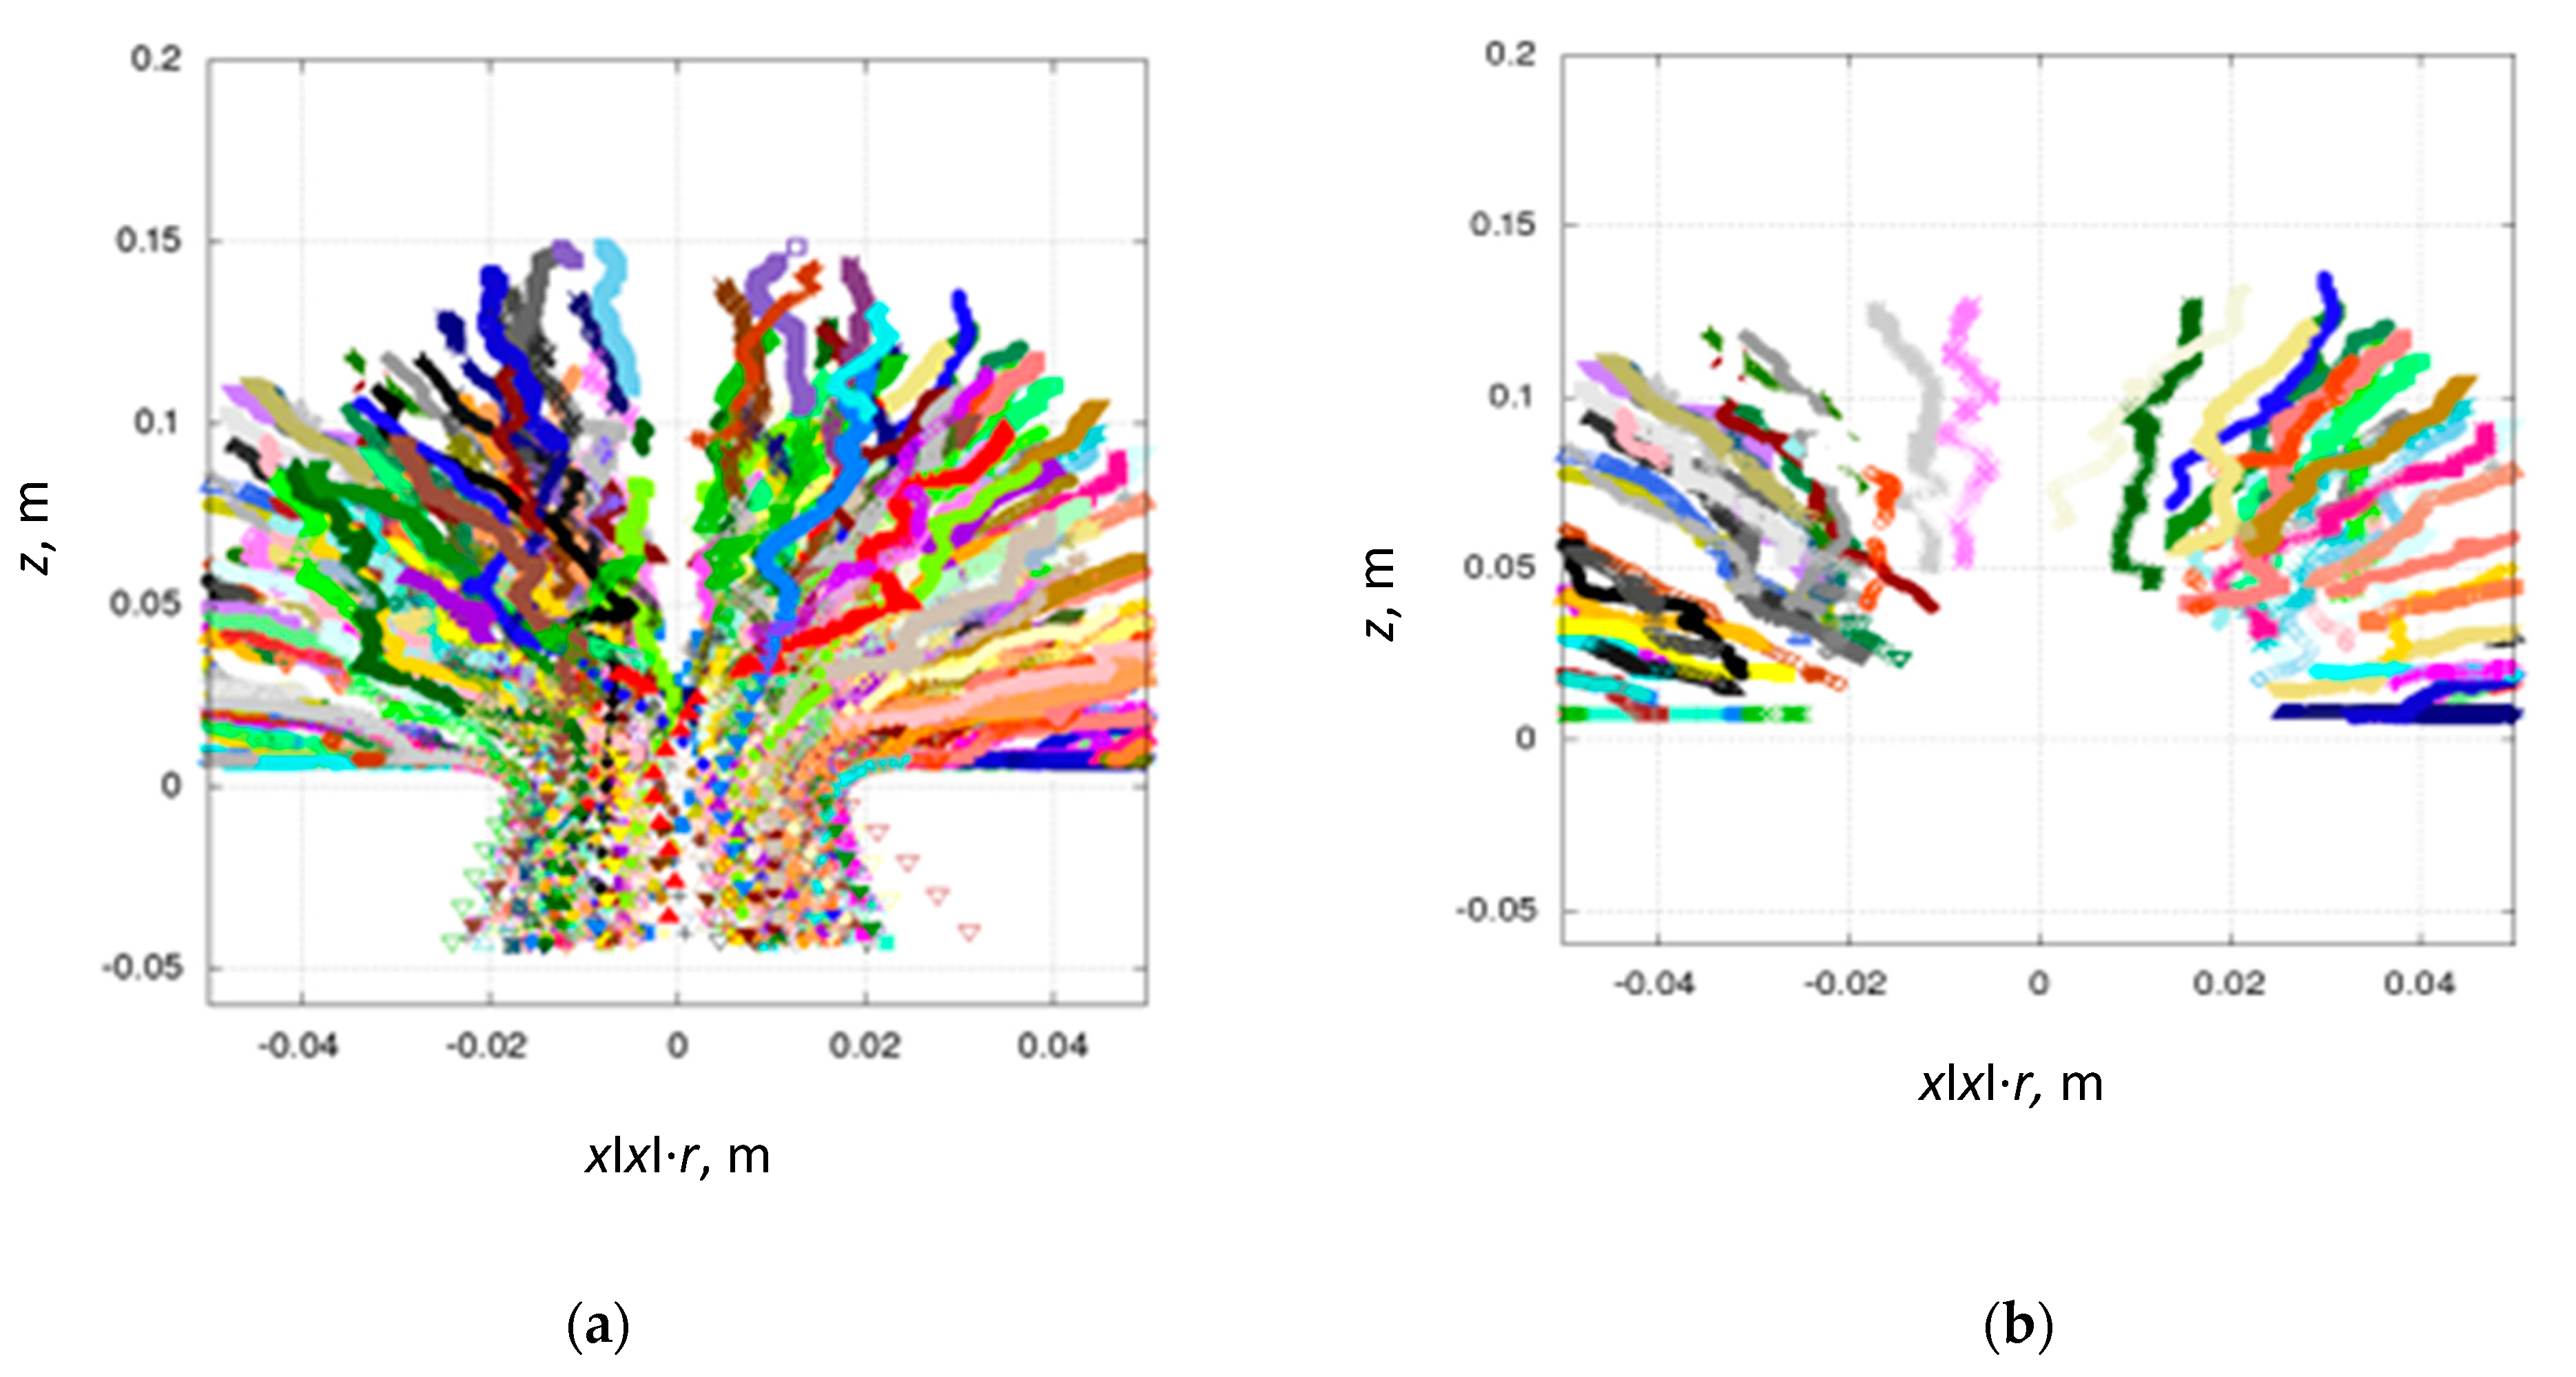
Another view of deformation in the proximity of the orifice is shown as trajectories of particles at the discharge commencement. Figure 11a presents all particles in the considered area, while Figure 11b shows only particles that form a stable dome. The particles in the bedding moved toward the center of the orifice in a radial flow pattern. In close proximity to the outlet, the direction of the flow changed toward a vertical parallel. This effect can also be seen in Figure 10d as a concentration of large resultant forces above the edge of the orifice, i.e., for r of approximately 0.1 m. The truncated trajectories in Figure 11b represent the arrest of flow and formation of a stable dome.
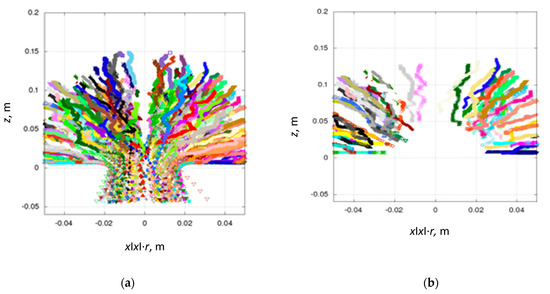
Figure 11.
Typical trajectories of particles at discharge commencement: all particles (a) and particles that will eventually form the dome (b).
Similar effects were observed in detail by Xiao et al. [5] in the 2D experimental setup containing one layer of spherical particles 3.5 mm in diameter. Such configuration of testing is frequently used because it allows recording the movement of individual particles by a high-speed camera. Next, the velocities of particles were determined by using the image processing technique and further elaboration of digital images with appropriate algorithms. The authors stated that the state of motion of particles changes from irregular at different radial positions to the vertical movement of particles in the whole region under the transition boundary. It has been shown that the positions of velocity gradient transitions can be fitted with a parabolic arch. Ahmadi and Hoseininia [39] tested arching in a 2D system using plastic beads and gravel. The test apparatus was a flat plate with an adjustable inclination with a trapdoor having an adjustable width. The authors applied a second-order parabola for the outline of the stable arch and concluded that it gave an acceptable prediction for a wide range of inclination angles and trapdoor widths.
Alonso-Marroquin and Mora [40] investigated mass flow rate in a two-dimensional hopper using DEM simulations. The tested assembly consisted of particles randomly generated between 0.93 d and 1.06 d, with a mean diameter d = 0.3 m. The authors obtained velocity profiles with a slight deviation from parabolic but proposed that their profiles can still be approximated by parabolic profiles. However, the conclusion was that “including a robust Beverloo relation for the mass flow requires an in-depth revision of the adopted theories based on a larger set of numerical and experimental data that should include the effect of hopper angle, particle polydispersity, and particle shape.”
3.5. Flow Arrest. Shape of the Dome
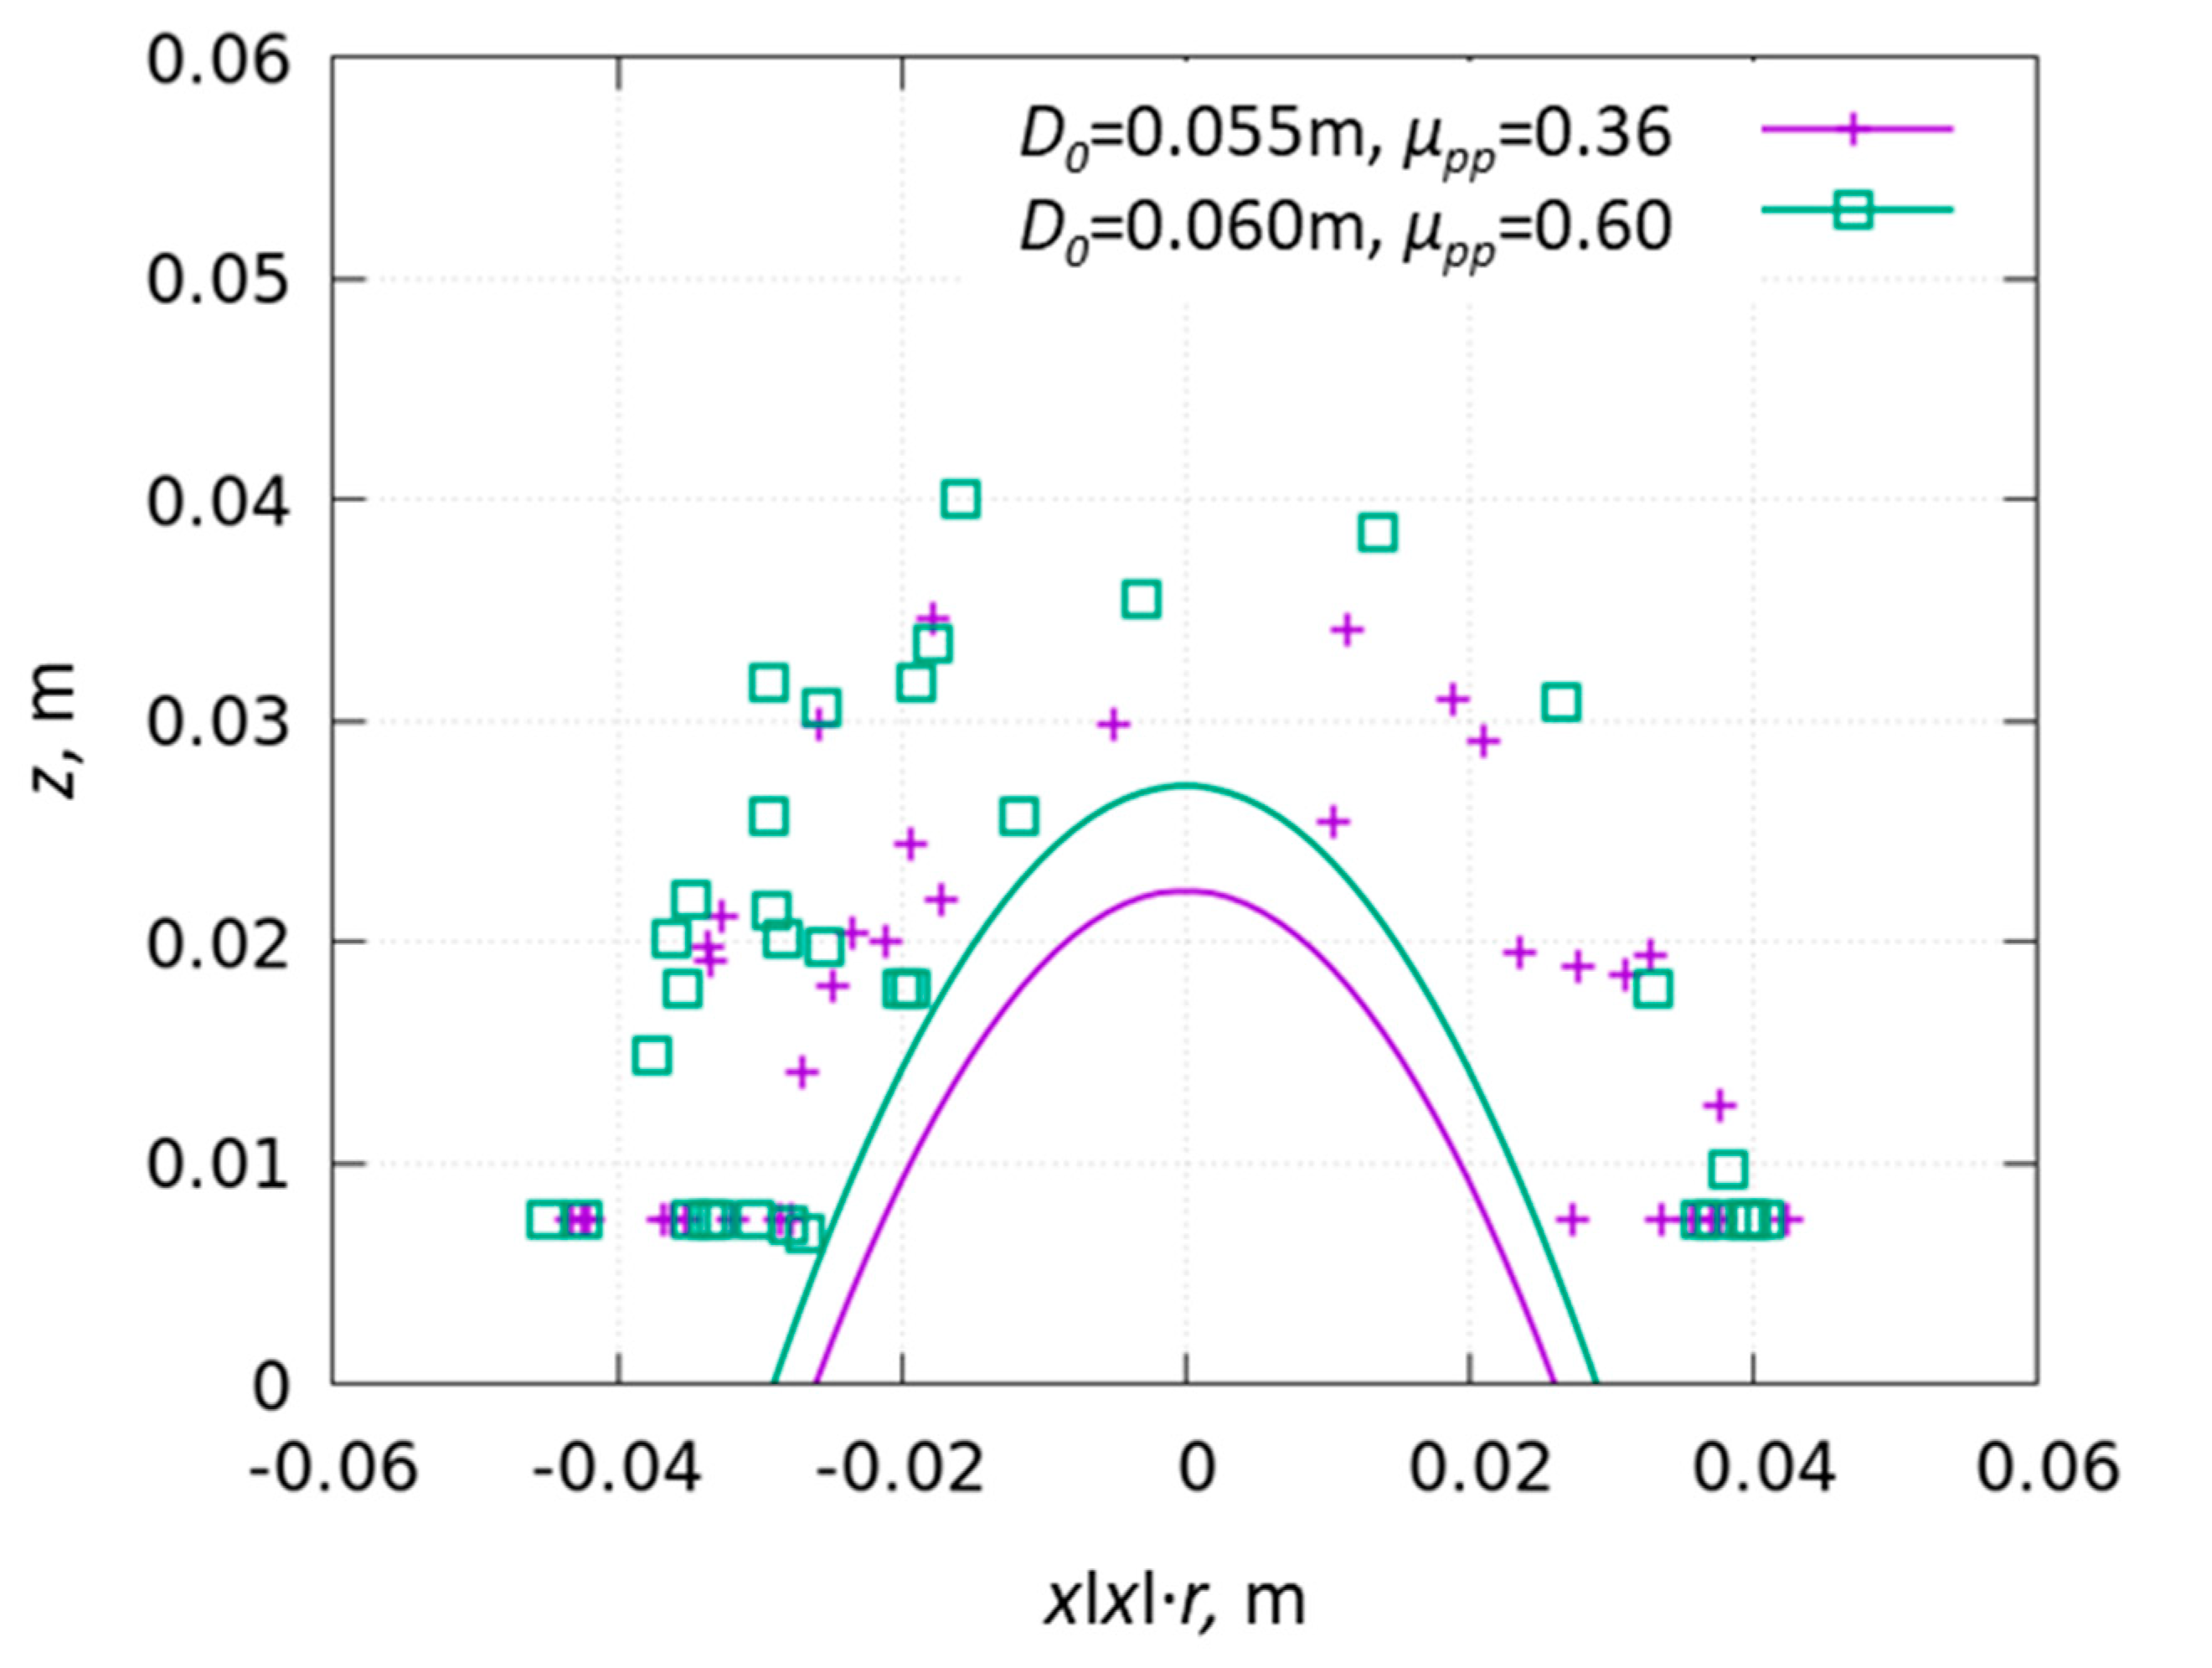
Figure 12 illustrates the distribution of centers of the spheres forming the dome at the arrest of flow and fitted parabola. Original 3D visualization was transformed to 2D based on the distance to the silo axis multiplied by the sign of the x coordinate vs. height. Compared to arches formed in 2D testing configurations (such as [5,21,31,39]), the geometry of the 3D dome was far more complex. The dome in Figure 12 was constructed from 47 particles distributed in a layer approximately 2 cm thick. 2D containers used by the referenced authors were very little wider than one particle diameter what enforced the location of contact points on nearly one plane. In such a regular network, contact forces might be transmitted only in the plane of the illustration. As a result, formed arches were composed of 4 to several particles. It is not clear to which extent mechanical effects observed in real 3D beddings may be interpreted based on such test configurations. A further degree of complexity was introduced by the non-repeatability of the geometrical structure of assemblies generated for subsequent testing or numerical simulations. Silbert et al. [37] concluded that in general, “for hyperstatic packings of monodisperse spheres, the force network is not uniquely determined by the packing protocol and the loadings on the particles. It follows that the determination of the force network for hyperstatic packings of perfectly rigid particles is an ill-posed problem. Frictional packings of hard spheres achieve a multitude of hyperstatic packings that depend on system parameters and construction history.” Therefore, regarding our results, the geometrical form of the dome and underlying network of intergranular forces assuring its stability may be very different and unrepeatable in consecutive runs of testing. Thus, searching for a closer description of the shape of the dome in particular realization would be of very limited use for the general behavior of an assembly.
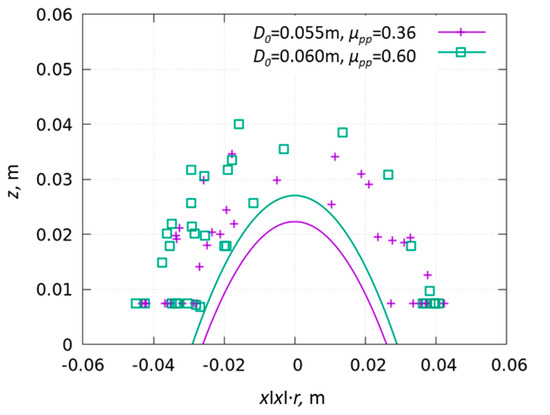
Figure 12.
Distribution of centers of spheres forming the dome at flow arrest and parabola fitted into points on particle surface being closest to empty space created by stable arch.
The conditions for forming the dome were not exactly repeatable because the geometry of the network of contact points depends on the interplay of numerous factors, such as the filling method, imperfections of the shape of particles, or uneven surface properties. These effects were observed earlier in tests in various load configurations. O’Sullivan et al. [41] observed that the response of assemblages of hexagonally packed rods is very sensitive to minor changes in rod geometry. The strength of the assemblage decreased significantly with small increases in the standard deviation of the rod sizes. Numerical simulations indicated that the strength of an assembly of hexagonally packed oblique rods was lower than the strength of an assembly of perfectly round rods. The numerical simulations indicated that the response of the rod assemblage was influenced by the surface friction values; the strength decreased when the standard deviation of the distribution of this parameter increased. Only when the measured variations in particle geometry and frictional properties were incorporated into the model, a good match between the laboratory test data and the numerical simulations was observed. Similar conclusions were drawn by Danczyk et al. [17] based on testing the flow of mustard seeds from a hopper and DEM simulations of this process. The authors found that the mere use of macroscopic observations of the flow rate from the hopper was not sufficient to produce validated numerical simulations. It would not be possible to predict the flow in more complex geometries either confidently. Their results emphasized the need for local observations of the flow for the validation of numerical simulations.
4. Conclusions
In this paper, the outflow of spherical particles from a flat floor cylindrical bin was examined. The flow rate of spherical wooden particles was tested in a laboratory experiment, and DEM simulations were performed. One to one DEM simulations showed good general agreement with experimental results and with the Beverloo statement.
The main novelties of the reported project include the one-to-one simulation of testing and 3D visualizations of effects observed on the particle scale. The spatial distribution of contacts in the proximity of the discharge orifice has been illustrated. The reorientation of the network of contact forces accompanying the transition from the static to dynamic state (commencement of discharge) has been shown.
The following detailed conclusions were drawn:
- The results of the laboratory determination of the mass flow rate of spheres have shown fairly close agreement with the results of simulations. The real particles of wood were not perfectly spherical. Their properties were anisotropic, and their frictional properties were non-homogenously distributed on the surface; however, these deviations from ideal conditions did not produce a considerable discrepancy in the results. Our results confirmed the validity of the Beverloo equation for tests wherein no clogs were observed. Even in the tests without clogs, load fluctuations were observed because the mass of the falling particle was large enough to produce observable dynamic forces.
- The shape of the dome formed above the outlet was found to vary in the replications of simulations. This was a result of the impossibility to exactly reproduce the fabric of the assembly in a static state and its transient response to discharge initiation. The shape of the dome was fairly irregular and can be described by a body that is not more complex than a paraboloid.
- Friction is a basic factor forming the strength of a granular assembly composed of spheres. It influences bulk density and the internal structure, but no direct pattern between interparticle friction and clogging was found. A direct relationship between the stability of the dome formed at flow arrest and the rolling friction was found.
- Variations in Young’s modulus of particles by 2 orders of magnitude did not produce a predictable effect on clogging of the material, but a slightly higher probability of clogging was found for softer particles.
- The trajectories of particles in the proximity to the outlet were not smooth lines; they formed rather broken paths with more or less frequent changes in directions. Thus, the transformation of potential energy into kinetic energy of the individual particle in time must be a collection of discrete events, very different for various particles. Consequently, the spatial distribution of trajectories is rather far from axial symmetry.
Author Contributions
Conceptualization, R.K. and M.M.; methodology R.K. and P.P.; software, R.K.; validation, J.W. and M.S.; formal analysis, J.W., and J.H.; investigation, M.B.; resources, R.K. and J.W.; data curation, R.K. and M.M.; writing—original draft preparation R.K.; writing—review and editing, M.M.; visualization, J.W.; supervision, J.H. All authors have read and agreed to the published version of the manuscript.
Funding
This research received no external funding.
Institutional Review Board Statement
Not applicable.
Informed Consent Statement
Not applicable.
Conflicts of Interest
The authors declare no conflict of interest.
References
- Pariseau, W.G. Discontinuous velocity fields in gravity flows of granular materials through slots. Powder Technol. 1969, 3, 218–226. [Google Scholar] [CrossRef]
- Hidaka, J.; Kirimoto, Y.; Miwa, S.; Makino, K. Discontinuous flow and frictional property of granular materials. KONA Powder Part. J. 1986, 4, 23–34. [Google Scholar] [CrossRef]
- Börzsönyi, T.; Somfai, E.; Szabó, B.; Wegner, S.; Mier, P.; Rose, G.; Stannarius, R. Packing, alignment and flow of shape-anisotropic grains in a 3D silo experiment. New J. Phys. 2016, 18, 093017. [Google Scholar] [CrossRef]
- Ashour, A.; Wegner, S.; Trittel, T.; Borzsonyi, T.; Stannarius, R. Outflow and clogging of shape-anisotropic grains in hoppers with small apertures. Soft Matter 2017, 13, 402–414. [Google Scholar] [CrossRef] [PubMed]
- Xiao, Y.; Han, Y.; Jia, F.; Liu, H.; Li, G.; Chen, P.; Meng, X.; Bai, S. Experimental study of granular flow transition near the outlet in a flat-bottomed silo. Biosyst. Eng. 2021, 202, 16–27. [Google Scholar] [CrossRef]
- Hafez, A.; Liu, Q.; Finkbeiner, T.; Alouhali, R.A.; Moellendick, T.E.; Carlos Santamarina, J. The effect of particle shape on discharge and clogging. Sci. Rep. 2021, 11, 3309. [Google Scholar] [CrossRef] [PubMed]
- Colonnello, C.; Reyes, L.I.; Clement, E.; Gutierrez, G. Behavior of grains in contact with the wall of a silo during the initial instants of a discharge-driven collapse. Phys. A Stat. Mech. Appl. 2014, 398, 35–42. [Google Scholar] [CrossRef][Green Version]
- Gutiérrez, G.; Colonnello, C.; Boltenhagen, P.; Darias, J.R.; Peralta-Fabi, R.; Brau, F.; Clément, E. Silo collapse under granular discharge. Phys. Rev. Lett. 2015, 114, 018001. [Google Scholar] [CrossRef]
- Beverloo, W.A.; Leniger, H.A.; De Velde, J.V. The flow of granular solids through orifices. Chem. Eng. Sci. 1961, 15, 260–269. [Google Scholar] [CrossRef]
- Nedderman, R.M.; Tüzün, U.; Savage, S.B.; Houlsby, G.T. The flow of granular materials I: Discharge rates from hoppers. J. Chem. Eng. Sci. 1982, 32, 1597–1609. [Google Scholar] [CrossRef]
- Tüzün, U.; Houlsby, G.T.; Nedderman, R.M.; Savage, S.B. The flow of granular materials II: Velocity distributions in slow flow. J. Chem. Eng. Sci. 1982, 37, 1691–1709. [Google Scholar] [CrossRef]
- Savage, S.B.; Nedderman, R.M.; Tüzün, U.; Houlsby, G.T. The flow of granular materials III: Rapid shear flows. J. Chem. Eng. Sci. 1983, 38, 189–195. [Google Scholar] [CrossRef]
- Tighe, B.P.; Sperl, M. Pressure and motion of dry sand: Translation of Hagens paper from 1852. Granul. Matter 2007, 9, 141–144. [Google Scholar] [CrossRef]
- Garcimartín, A.; Mankoc, C.; Janda, A.; Arévalo, R.; Pastor, J.M.; Zuriguel, I.; Maza, D. Flow and jamming of granular matter through an orifice. Traffic Granul. Flow 2007, 7, 471–486. [Google Scholar]
- Mankoc, C.; Janda, A.; Arévalo, R.; Pastor, J.M.; Zuriguel, I.; Garcimartíın, A.; Maza, D. The flow rate of granular materials through an orifice. Granul. Matter 2007, 9, 407–414. [Google Scholar] [CrossRef]
- Gella, D.; Maza, D.; Zuriguel, I. Role of particle size in the kinematic properties of silo flow. Phys. Rev. E 2017, 95, 052904. [Google Scholar] [CrossRef]
- Danczyk, M.; Meaclem, T.; Mehdizad, M.; Clarke, D.; Galvosas, P.; Fullard, L.; Holland, D. Influence of contact parameters on Discrete Element method (DEM) simulations of flow from hopper: Comparison with magnetic resonance imaging (MRI) measurements. Powder Technol. 2020, 372, 671–684. [Google Scholar] [CrossRef]
- Uñac, R.O.; Vidales, A.M.; Benegas, O.A.; Ippolito, I. Experimental study of discharge rate fluctuations in a silo with different hopper geometries. Powder Technol. 2012, 225, 214–220. [Google Scholar] [CrossRef]
- Jenike, A.W.; Leser, T. A flow–no-flow criterion in the gravity flow of powders in converging channels. In Proceedings of the 4th International Congress on Rheology, Brown University, Providence, RI, USA, August 26–30 1963; pp. 125–141. [Google Scholar]
- Drescher, A. Some aspect of flow of granular materials in hoppers. Philos. Trans. R. Soc. Lond. A 1998, 356, 2649–2666. [Google Scholar] [CrossRef]
- Lozano, C.; Zuriguel, I.; Garcimartín, A. Stability of clogging arches in a silo submitted to vertical vibrations. Phys. Rev. E 2015, 91, 062203. [Google Scholar] [CrossRef] [PubMed]
- Jenike, A.W. Gravity flow of bulk solids. Utah Univ. Eng. Exp. Stn. Bull. 1961, 108, 47–83. [Google Scholar]
- Jenike, A.W. Discussion: “Stress and velocity fields in the gravity flow of bulk solids”. J. Appl. Mech.. Trans. ASME 1964, 31, 5. [Google Scholar] [CrossRef]
- Drescher, A. Analytical Methods. In Bin-Load Analysis; Elsevier: Amsterdam, The Netherlands, 1991. [Google Scholar]
- Walker, D.M. An approximate theory for pressures and arching in hoppers. Chem. Eng. Sci. 1966, 21, 975. [Google Scholar] [CrossRef]
- Stainforth, P.T.; Ashley, R.C. An analytical hopper design method for cohesive powders. Powder Technol. 1973, 7, 215. [Google Scholar] [CrossRef]
- To, K.; Lai, P.-Y.; Pak, H.K. Jamming of granular flow in a two-dimensional hopper. Phys. Rev. Lett. 2001, 86, 71. [Google Scholar] [CrossRef]
- Walker, D.M. A basis for bunker design. Powder Technol. 1967, 1, 228. [Google Scholar] [CrossRef]
- Enstad, G.G. A Novel Theory on the Arching and Doming in Mass Flow Hoppers; The Chr. Michelsen Institute Bergen: Bergen, Norway, 1981. [Google Scholar]
- Goldberg, E.; Carlevaro, C.M.; Pugnaloni, L.A. Clogging in two-dimensions: Effect of particle shape. J. Stat. Mech. Theory Exp. 2018, 11, 113201. [Google Scholar] [CrossRef]
- Zuriguel, I.; Maza, D.; Pugnaloni, L.A.; Pastor, J.M.; Garcimartín, A. Jamming during the discharge of granular material from a silo. Phys. Rev. E 2005, 71, 051303. [Google Scholar] [CrossRef]
- Kloss, C.; Goniva, C.; Hager, A.; Amberger, S.; Pirker, S. Models, algorithms and validation for opensource DEM and CFD-DEM. Prog. Comput. Fluid Dyn. Int. J. 2012, 12, 140–152. [Google Scholar] [CrossRef]
- Di Renzo, A.; Di Maio, F. Comparison of contact-force models for the simulation of collisions in DEM-based granular flow codes. Chem. Eng. Sci. 2004, 59, 525–541. [Google Scholar] [CrossRef]
- Horabik, J.; Beczek, M.; Mazur, R.; Parafiniuk, P.; Ryżak, M.; Molenda, M. Determination of the restitution coefficient of seeds and coefficients of visco-elastic Hertz contact models for DEM simulations. Biosyst. Eng. 2017, 161, 106–119. [Google Scholar] [CrossRef]
- Tsuji, Y.; Tanaka, T.; Ishida, T. Lagrangian numerical simulation of plug flow of cohesionless particles in a horizontal pipe. Powder Technol. 1992, 71, 239–250. [Google Scholar] [CrossRef]
- Ai, J.; Chen, J.-F.; Rotter, J.M.; Ooi, J.Y. Assessment of rolling resistance models in discrete element simulations. Powder Technol. 2011, 206, 269–282. [Google Scholar] [CrossRef]
- Silbert, L.E.; Ertas, D.; Grest, G.S.; Halsey, T.C.; Levine, D. Geometry of frictionless and frictional sphere packings. Phys. Rev. E 2002, 3, 031304. [Google Scholar] [CrossRef]
- Molenda, M.; Horabik, J.; Ross, I.J. Dynamic load response in a model bin at the start of grain discharge. Trans. ASABE 1995, 38, 1869–1873. [Google Scholar] [CrossRef]
- Ahmadi, A.; Hosseininia, E.S. An experimental investigation on stable arch formation in cohesionless granular materials using developed trapdoor test. Powder Technol. 2018, 330, 137–146. [Google Scholar] [CrossRef]
- Alonso-Marroquin, F.; Mora, P. Beverloo law for hopper flow derived from self-similar profiles. Granul. Matter 2021, 23, 7. [Google Scholar] [CrossRef]
- O’Sullivan, C.; Bray, J.D.; Riemer, M.F. Influence of particle shape and surface friction variability on response of rod-shaped particulate media. J. Eng. Mech. 2002, 128, 1182–1192. [Google Scholar] [CrossRef]
Publisher’s Note: MDPI stays neutral with regard to jurisdictional claims in published maps and institutional affiliations. |
© 2021 by the authors. Licensee MDPI, Basel, Switzerland. This article is an open access article distributed under the terms and conditions of the Creative Commons Attribution (CC BY) license (https://creativecommons.org/licenses/by/4.0/).

