
Oscillation of Gas Density in the Gas Filament Remained by a Streamer Discharge in Water

Abstract
:1. Introduction
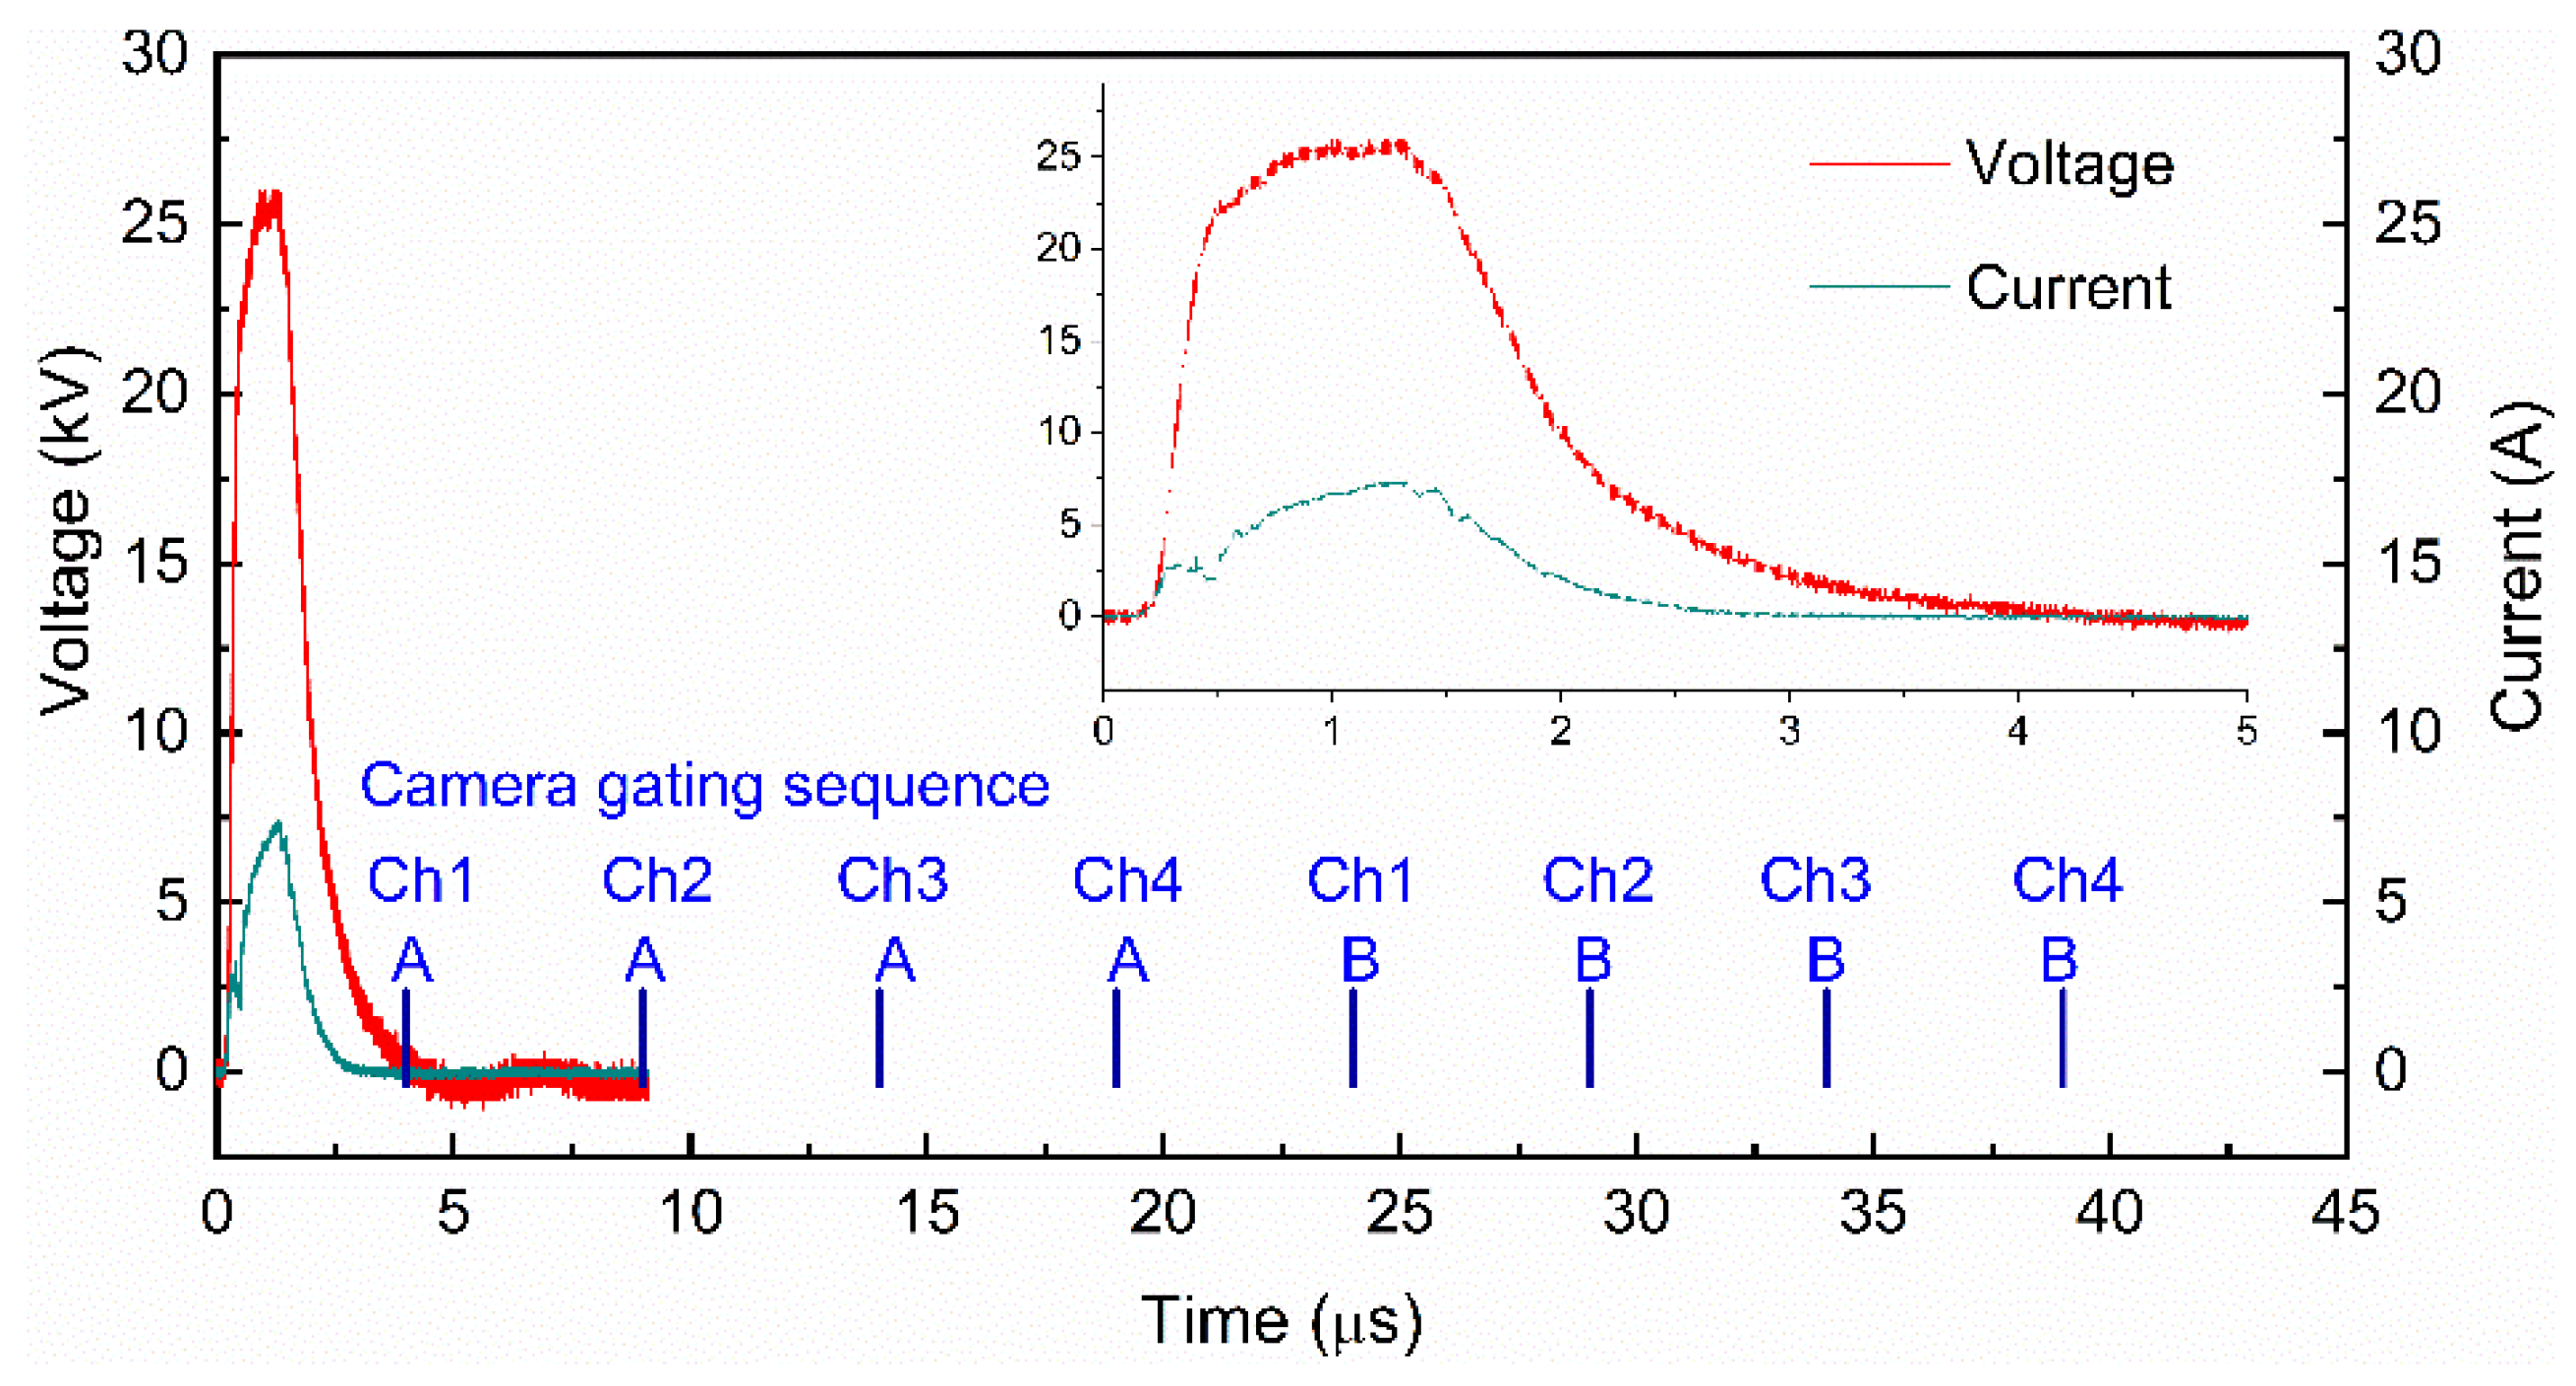
2. Methods
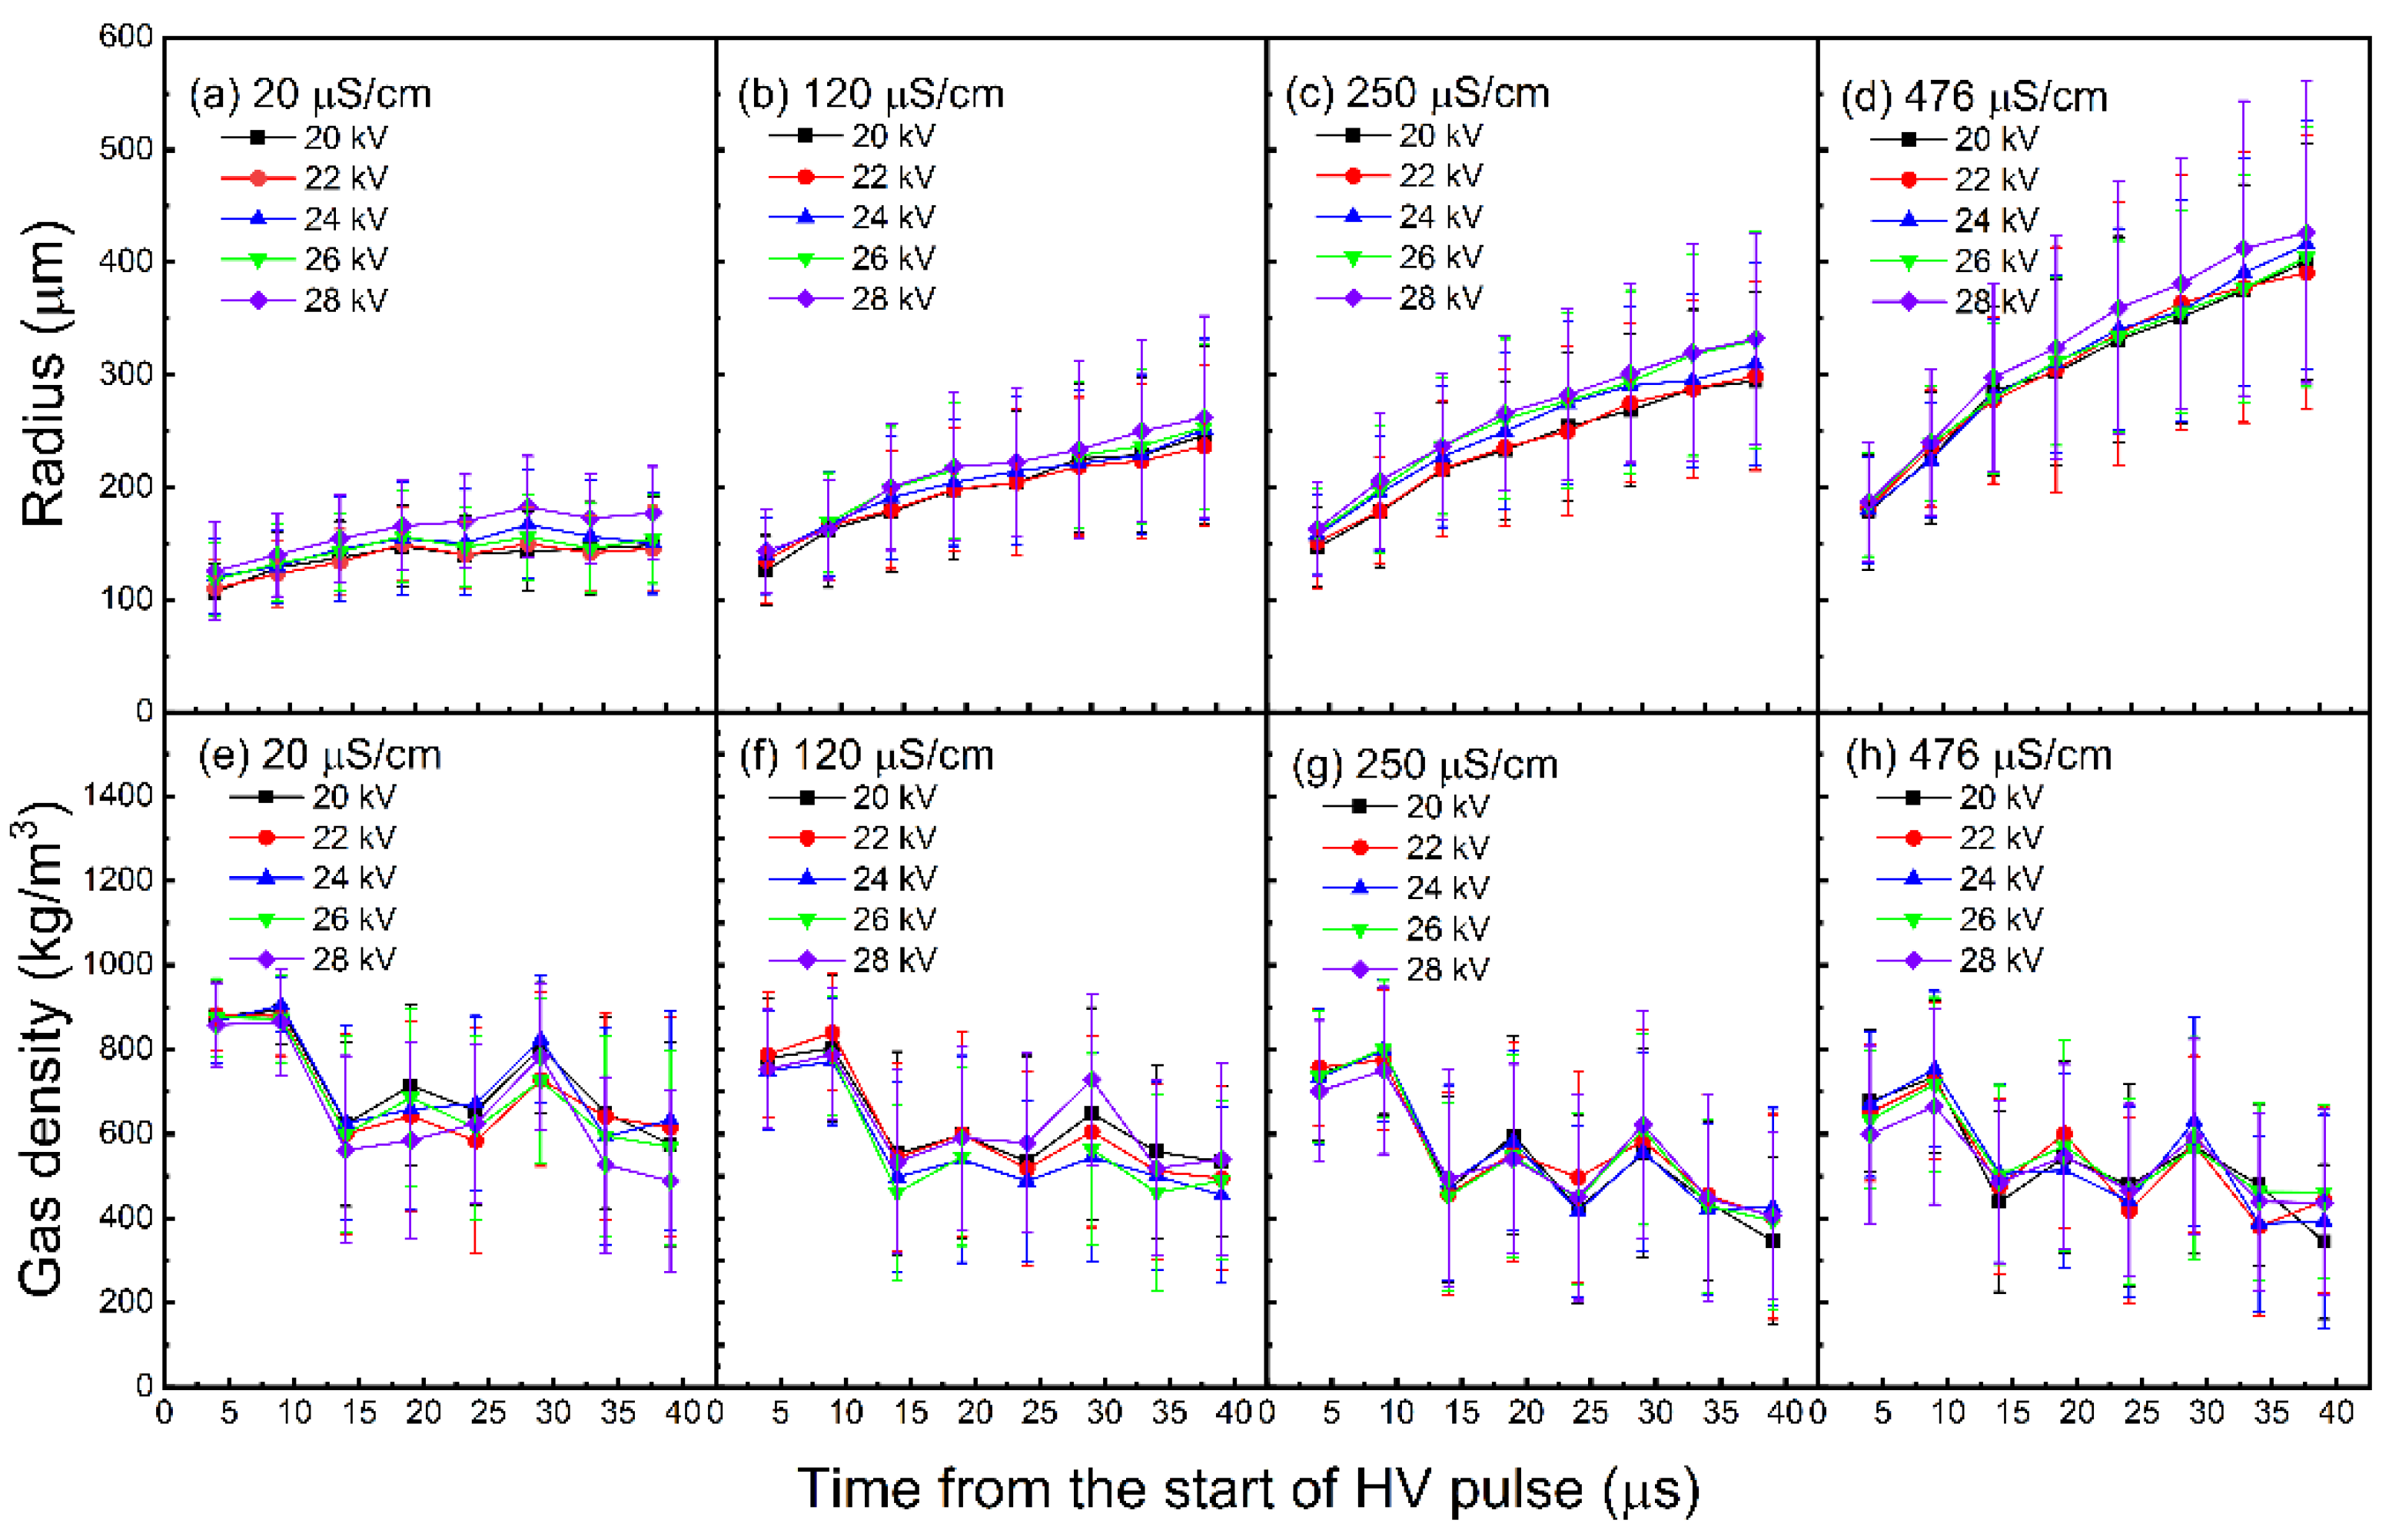
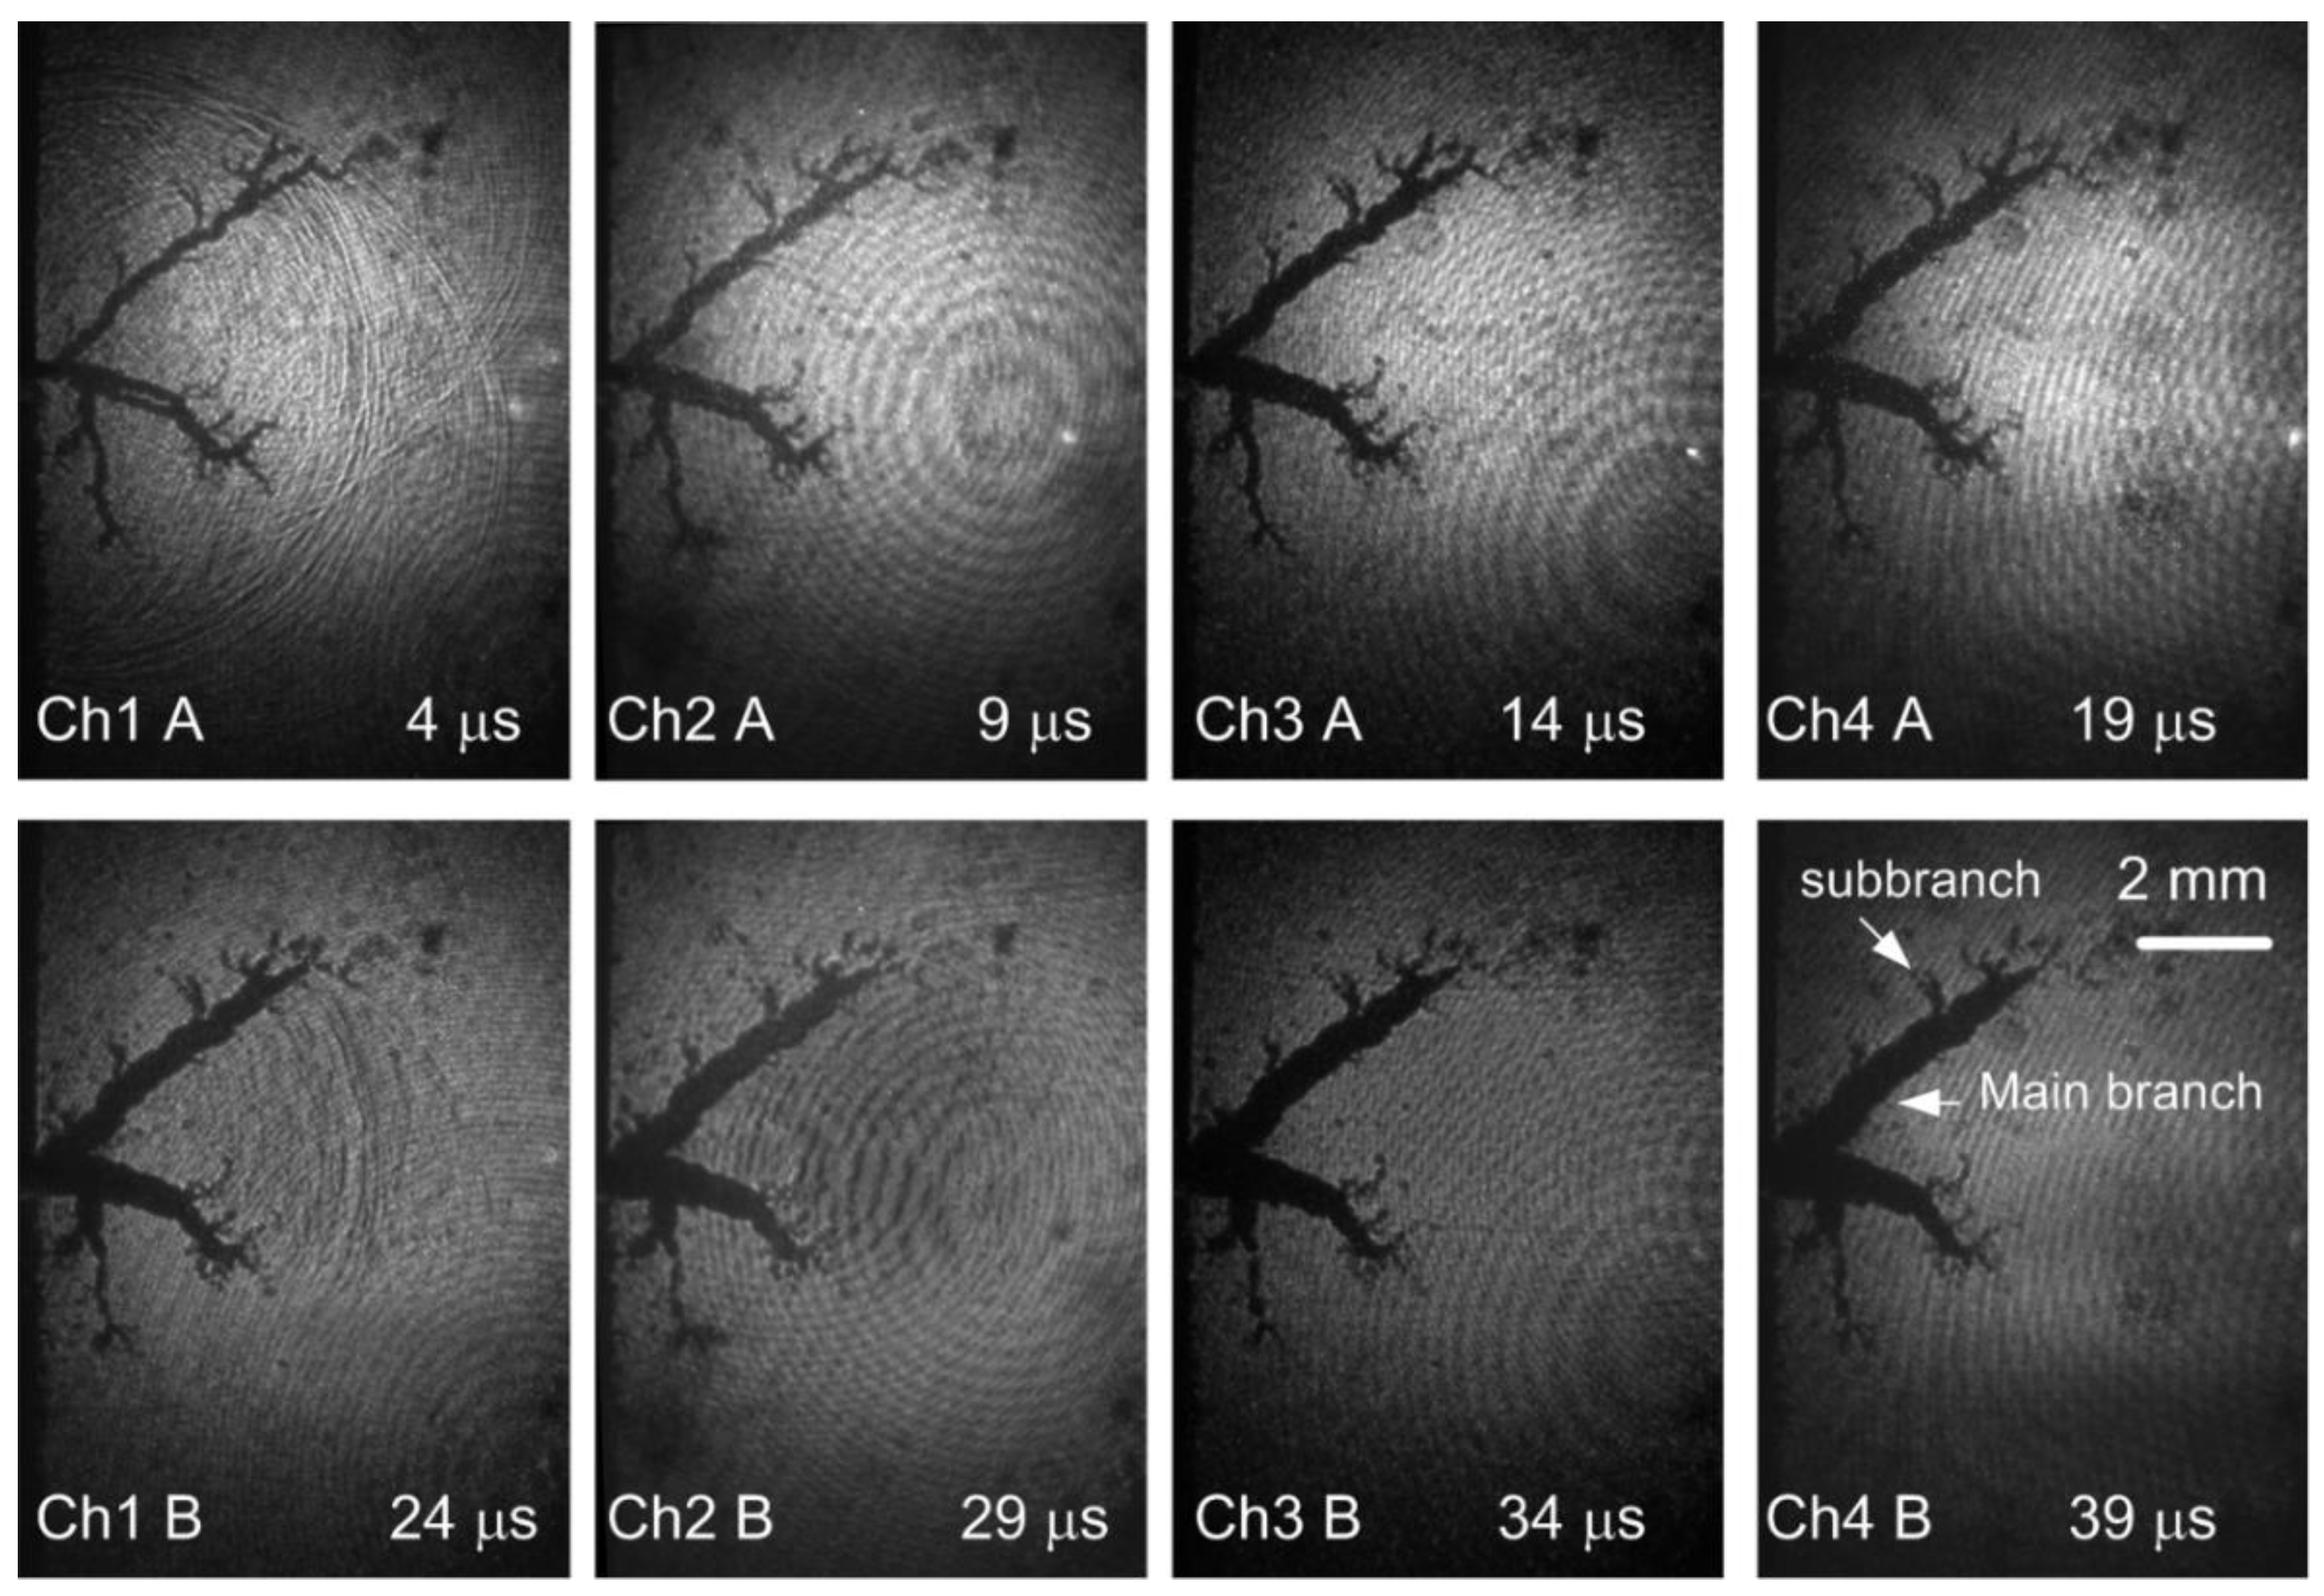
3. Results
4. Conclusions
Author Contributions
Funding
Data Availability Statement
Conflicts of Interest
References
- Locke, B.R.; Thagard, S.M. Analysis and Review of Chemical Reactions and Transport Processes in Pulsed Electrical Discharge Plasma Formed Directly in Liquid Water. Plasma Chem. Plasma Process. 2012, 32, 875–917. [Google Scholar] [CrossRef]
- Sato, M.; Ohgiyama, T.; Clements, J. Formation of chemical species and their effects on microorganisms using a pulsed high-voltage discharge in water. IEEE Trans. Ind. Appl. 1996, 32, 106–112. [Google Scholar] [CrossRef]
- Gupta, S.B.; Bluhm, H. The Potential of Pulsed Underwater Streamer Discharges as a Disinfection Technique. IEEE Trans. Plasma Sci. 2008, 36, 1621–1632. [Google Scholar] [CrossRef]
- Šunka, P. Pulse electrical discharges in water and their applications. Phys. Plasmas 2001, 8, 2587–2594. [Google Scholar] [CrossRef]
- Ceccato, P.H.; Guaitella, O.; Le Gloahec, M.R.; Rousseau, A. Time-resolved nanosecond imaging of the propagation of a corona-like plasma discharge in water at positive applied voltage polarity. J. Phys. D Appl. Phys. 2010, 43, 175202. [Google Scholar] [CrossRef] [Green Version]
- Wen, X.; Xue, X.; Liu, X.; Li, J.; Zhou, Y. Propagation behavior of microsecond pulsed positive streamer discharge in water. J. Appl. Phys. 2019, 125, 133302. [Google Scholar] [CrossRef]
- Lukes, P.; Clupek, M.; Babicky, V.; Sunka, P. Ultraviolet radiation from the pulsed corona discharge in water. Plasma Source Sci. Technol. 2008, 17, 024012. [Google Scholar] [CrossRef]
- Simek, M.; Clupek, M.; Babicky, V.; Lukes, P.; Sunka, P. Emission spectra of a pulse needle-to-plane corona-like discharge in conductive aqueous solutions. Plasma Sources Sci. Technol. 2012, 21, 055031. [Google Scholar] [CrossRef]
- Fridman, G.; Friedman, G.; Gutsol, A.; Shekhter, A.B.; Vasilets, V.N.; Fridman, A. Applied plasma medicine. Plasma Process. Polym. 2008, 5, 503. [Google Scholar] [CrossRef]
- Saito, N.; Bratescu, M.A.; Hashimi, K. Solution plasma: A new reaction field for nanomaterials synthesis. Jpn. J. Appl. Phys. 2017, 57, 0102A4. [Google Scholar] [CrossRef]
- Ostrikov, K.; Cvelbar, U.; Murphy, A. Plasma nanoscience: Setting directions, tackling grand challenges. J. Phys. D Appl. Phys. 2011, 44, 174001. [Google Scholar] [CrossRef]
- Sharma, A.; Locke, B.; Arce, P.; Finney, W. A Preliminary Study of Pulsed Streamer Corona Discharge for the Degradation of Phenol in Aqueous Solutions. Hazard. Waste Hazard. Mater. 1993, 10, 209–219. [Google Scholar] [CrossRef]
- Sugiarto, A.T.; Ito, S.; Ohshima, T.; Sato, M.; Skalny, J.D. Oxidative decoloration of dyes by pulsed discharge plasma in water. J. Electrost. 2003, 58, 135–145. [Google Scholar] [CrossRef]
- Wen, X.Q.; Liu, G.S.; Ding, Z.F. Temporal Evolution of the Pulsed Positive Streamer Discharge in Water. IEEE Trans. Plasma Sci. 2012, 40, 438–442. [Google Scholar] [CrossRef]
- An, W.; Baumung, K.; Bluhm, H. Underwater streamer propagation analyzed from detailed measurements of pressure release. J. Appl. Phys. 2007, 101, 053302. [Google Scholar] [CrossRef]
- Wen, X.Q.; Liu, G.S.; Ding, Z.F. Time-Resolved Images of the Decay of the Gas Channel Induced by Pulsed Positive Streamer Discharge in Water. IEEE Trans. Plasma Sci. 2011, 39, 1758–1761. [Google Scholar] [CrossRef]
- Sharbaugh, A.H.; Devins, J.C.; Rzad, S.J. Progress in the Field of Electric Breakdown in Dielectric Liquids. IEEE Trans. Electr. Insul. 1978, EI-13, 249–276. [Google Scholar] [CrossRef]
- Lesaint, O. Prebreakdown phenomena in liquids: Propagation ‘modes’ and basic physical properties. J. Phys. D Appl. Phys. 2016, 49, 144001. [Google Scholar] [CrossRef]
- Bruggeman, P.J.; Kushner, M.J.; Locke, B.R.; Gardeniers, J.G.E.; Graham, W.G.; Graves, D.B.; Hofman-Caris, R.C.H.M.; Maric, D.; Reid, J.P.; Ceriani, E.; et al. Plasma–liquid interactions: A review and roadmap. Plasma Sources Sci. Technol. 2016, 25, 053002. [Google Scholar] [CrossRef]
- Vanraes, P.; Bogaerts, A. Plasma physics of liquids—A focused review. Appl. Phys. Rev. 2018, 5, 031103. [Google Scholar] [CrossRef]
- Sun, A.; Huo, C.; Zhuang, J. Formation mechanism of streamer discharges in liquids: A review. High. Volt. 2016, 1, 74–80. [Google Scholar] [CrossRef]
- Fujita, H.; Kanazawa, S.; Ohtani, K.; Komiya, A.; Kaneko, T.; Sato, T. Initiation process and propagation mechanism of positive streamer discharge in water. J. Appl. Phys. 2014, 116, 213301. [Google Scholar] [CrossRef]
- Fujita, H.; Kanazawa, S.; Ohtani, K.; Komiya, A.; Sato, T. Spatiotemporal analysis of propagation mechanism of positive primary streamer in water. J. Appl. Phys. 2013, 113, 113304. [Google Scholar] [CrossRef]
- Starikovskiy, A.; Yang, Y.; Cho, Y.I.; Fridman, A. Non-equilibrium plasma in liquid water: Dynamics of generation and quenching. Plasma Sources Sci. Technol. 2011, 20, 024003. [Google Scholar] [CrossRef]
- Seepersad, Y.; Pekker, M.; Shneider, M.N.; Fridman, A.; Dobrynin, D. Investigation of positive and negative modes of nanosecond pulsed discharge in water and electrostriction model of initiation. J. Phys. D Appl. Phys. 2013, 46, 355201. [Google Scholar] [CrossRef] [Green Version]
- Šimek, M.; Hoffer, P.; Tungli, J.; Prukner, V.; Schmidt, J.; Bílek, P.; Bonaventura, Z. Investigation of the initial phases of nanosecond discharges in liquid water. Plasma Sources Sci. Technol. 2020, 29, 064001. [Google Scholar] [CrossRef]
- Lauterborn, W.; Kurz, T. Physics of bubble oscillations. Rep. Prog. Phys. 2010, 73, 106501. [Google Scholar] [CrossRef]
- Wen, X.Q.; Li, S.H.; Liu, J.Y.; Niu, Z.W. Experimental measurement of vapor density in the discharge channel of a pulsed positive streamer discharge in water. Appl. Phys. Lett. 2014, 105, 084104. [Google Scholar] [CrossRef]
- Wen, X.; Zhou, Y.; Xue, X.; Yang, Y. Study on the residual gaseous filament of microsecond pulsed positive streamer discharge in water. Phys. Plasmas 2021, 28, 013507. [Google Scholar] [CrossRef]
- Wen, X.Q.; Xue, X.D. Shock wave release behavior of a pulsed positive streamer discharge in water. AIP Adv. 2019, 9, 075310. [Google Scholar]
- Katsuki, S.; Tanaka, K.; Fudamoto, T.; Namihira, T.; Akiyama, H.; Bluhm, H. Shock Waves due to Pulsed Streamer Discharges in Water. Jpn. J. Appl. Phys. 2006, 45, 239–242. [Google Scholar] [CrossRef]

Publisher’s Note: MDPI stays neutral with regard to jurisdictional claims in published maps and institutional affiliations. |
© 2021 by the authors. Licensee MDPI, Basel, Switzerland. This article is an open access article distributed under the terms and conditions of the Creative Commons Attribution (CC BY) license (https://creativecommons.org/licenses/by/4.0/).
Share and Cite
Wen, X.; Zhou, Y.; Xue, X.; Yang, Y. Oscillation of Gas Density in the Gas Filament Remained by a Streamer Discharge in Water. Processes 2021, 9, 1809. https://doi.org/10.3390/pr9101809
Wen X, Zhou Y, Xue X, Yang Y. Oscillation of Gas Density in the Gas Filament Remained by a Streamer Discharge in Water. Processes. 2021; 9(10):1809. https://doi.org/10.3390/pr9101809
Chicago/Turabian StyleWen, Xiaoqiong, Yibing Zhou, Xiaodong Xue, and Yuantian Yang. 2021. "Oscillation of Gas Density in the Gas Filament Remained by a Streamer Discharge in Water" Processes 9, no. 10: 1809. https://doi.org/10.3390/pr9101809
APA StyleWen, X., Zhou, Y., Xue, X., & Yang, Y. (2021). Oscillation of Gas Density in the Gas Filament Remained by a Streamer Discharge in Water. Processes, 9(10), 1809. https://doi.org/10.3390/pr9101809