Abstract
The complex ventilation system development process is associated with the stages of modelling, design, execution, and testing. Each of these steps requires the use of measuring equipment that is capable of determining the basic parameters of the flow. In the process of calibrating instruments for measuring flow velocity, one of the limitations is the size of the calibrated devices positioned in the test section of the wind tunnel. This is related to the change in the flow condition within the vicinity of the calibrated anemometers, which is caused by the blockage effect. Instruments with significant dimensions in relation to the cross-sectional area of the wind tunnel test section may have an impact on the reference velocity as indicated by the standard. In such cases, the calibration results may be affected by additional systematic error. This article presents a study of this effect using a real case of a calibration laboratory and commonly used sensors. The influence of different types of air velocity sensors on velocity profiles in the measurement standard area is also investigated. Additionally, the area of the blockage effect is described. The obtained results indicate the possibility of a proper placement for the measuring standard due to minimization of the flow-blocking effect.
1. Introduction
Having reliable knowledge of flow velocity is of significant importance in many areas related to mass and heat transport. In the case of ventilation measurement, precise velocity flow information is critical to ensure the safety of work in places with limited fresh air access (e.g., mines, tunnels) [1]. It is also useful information in making financial decisions like preliminary estimations of the wind energy potential of a site [2]. Many studies have been conducted based on the accurate measurement of flow velocities [3]. These include tests performed both in wind tunnels and under real measurement conditions, like studies on the wake effect from wind turbines, turbulent boundary layer research, heat loss experiments, and many others [3,4,5,6]. Ventilation measurement methods and devices are also used to determine boundary conditions and validate numerical models in computational fluid dynamics [7].
Reliability, and the value of this knowledge, is related to the measuring equipment which is used to collect data. The various types of anemometers applied in measurement systems should be periodically calibrated in laboratories. To ensure a low value of calibration uncertainty, accredited laboratories are obligated to validate the applied measurement procedures and minimalize the negative influence of flow phenomena occurring in the air flow [8]. Each calibration procedure should take into account the factors that significantly influence measurement results. These factors should be included in the uncertainty budgets of the calibration methods. Some of these factors are obvious (e.g., quality of measurement standards, calibrated instrument properties), but some of them are still unrecognized and under-research.
When calibrating instruments for measuring flow velocity (e.g., hot-wire anemometers, pitot-static tubes, vane and cup anemometers, ultrasonic anemometers), the calibration process assumes that air flow is applied to the anemometer at a constant velocity v∞. The value of this velocity is determined simultaneously by the measurement standard (reference anemometer) and the calibrated instrument placed in its immediate vicinity. During this calibration, any differences between the measurements and the degrees of uncertainty are determined. The uncertainty associated with determining calibration results is influenced by factors which affect the result of both standard velocity and the calibrated device measurement. Various laboratories use different measurement standards, such as measuring orifices, pitot-static tubes, LDV, and ultrasonic anemometers [9]. Depending on the type of measurement standard, uncertainty budgets are developed for calibrations with the assumption that factors will affect the accuracy of calibration [10,11]. For measurements based on pressure measurements (e.g., pitot-static tube, measuring orifices), these factors are related to the accuracy of the differential pressure measurement and the accuracy of determining the air density. Uncertainty budgets also determine the impact of factors related to the design and operation of wind tunnels. Such factors include the level of fluctuation in the flow velocity in the test section and the accuracy of determining the correction factor for the flow velocity caused by the different placements of the standard and the calibrated instruments.
Along with the development of knowledge about physical phenomena accompanying various types of measurements, their impact on the results of calibration is also taken into account. Research has been conducted related to the impact of various calibrating tunnels on the obtained measurement results [11]. The results of such research are also presented in [12,13,14,15]. Studies are limited to the specific types of wind tunnels with a specified size of the measurement section, counteractions, and standard–calibrated instrument arrangement.
One of the currently discussed issues associated with flow phenomena in wind tunnels [16] is the influence of the blockage effect on the calibration of anemometers. The blockage effect occurs when the flow encounters an obstacle. Immediately before the blocking element, space is created, which is characterized by changes in static pressure in relation to undisturbed flow up to the stagnation point (i.e., the place where the static pressure is equal to the total pressure and the flow velocity in the space is 0 m/s, see P1–Figure 1). Then, the stream is separated, and the obstacle is flooded around. The size of the area in which there is a change in the static pressure due to blockage of the flow depends on the size of the blocking element and the flow rate.
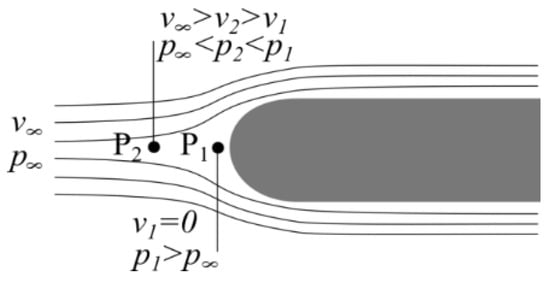
Figure 1.
Flow accumulation before an obstacle.
The applied calibration procedures for anemometric devices assume a reference flow velocity measurement in front of the calibrated measuring device (e.g., point P2). This is especially justified in cases where the standard measurement is made using non-invasive methods (e.g., LDA) that do not interfere with the flow directly in front of the calibrated measuring device. In cases such as this, the determined reference velocity v2, which acts on the active element of the measuring sensor, is underestimated in relation to the velocity v∞, which is actually causing the response of the calibrated device.
In a different approach, the measurement standard can be placed in a different place in the test section of the wind tunnel. Then, the calibration result (difference between the standard and the calibrated instrument indication vstd-vanem) is affected by an additional factor (non-uniformity of the flow velocity profile) which influences the v∞. All of these additional factors and their influences are shown in the schematic diagram in Figure 2. Such a solution is important when a standard (instrument measuring the reference velocity) which disturbs the air flow is used. This applies to any type of instrument that requires direct contact with the flow.
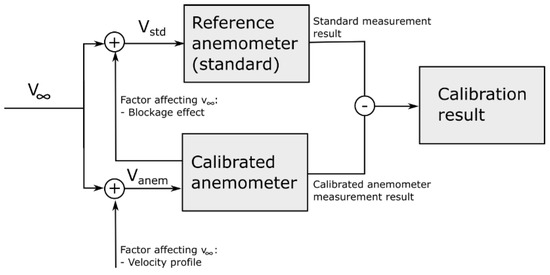
Figure 2.
Schematic diagram of the calibration.
The aim of the present research is to investigate the interaction between the reference standard and the calibrated instrument during the calibration process. The assessment of this impact is important in order to optimize the arrangement of instruments in the measurement space, assuming the blockage effect’s impact on the calibration result is minimized.
In the works presented so far related to the blocking effect during the calibration of measuring instruments, the focus has been on the study of the probes themselves, mainly cup anemometers. In the analyzed case, experimental tests utilizing commonly used measuring instruments with built into bodies of significant dimensions are presented. Such instruments are used in measurements related to mass transport in HVAC systems and climate systems (analysis of mass and energy transport in HVAC systems). In these studies, hot-wire probes are used, makingh it possible to limit the invasiveness of the measurement method and enable wide frequency band measurement.
2. Research Methodology
2.1. Test Section of the Tunnel in the Calibration Laboratory for Ventilation Measuring Instruments
At the Strata Mechanics Research Institute of the Polish Academy of Sciences, an open aerodynamic tunnel is used for regular calibrations. It is equipped with two standards. The first is a multi-hole orifice plate, which is used in the range of low velocities (0.15 to 1.5 m/s). The second is a pitot-static tube, which is used in the range of 1.5 to 40 m/s. Both standards indicate a reference pressure related to the reference flow velocity at the wind tunnel test section.
The pitot-static tube is placed at the base of the section, inside the inlet zone. This placement eliminates the influence of flow disturbances affecting the calibrated instruments mounted in the central part of the test section. Different locations of the standard and calibrated instruments require the adjustment of the reference flow velocity. It is caused by the non-uniform velocity profile. This increases the uncertainty of the performed calibrations. The test section is connected to a suction fan by means of a diffuser with the second standard, the multi-hole orifice plate.
2.2. Calibrated Measuring Instruments
The devices which are calibrated routinely in the calibration laboratory include various types of anemometers. They are all used in various types of ventilation measurement cases. Hand-operated vane anemometers are calibrated the most frequently. Meteorological stations equipped with cup anemometer sensors are among the largest calibrated objects. Both types of instruments are available in versions where sensors are permanently connected to the housings. This requires the placement of the entire instrument in the test section. Exemplary arrangements of such devices in the test section are shown in Figure 3 and Figure 4.
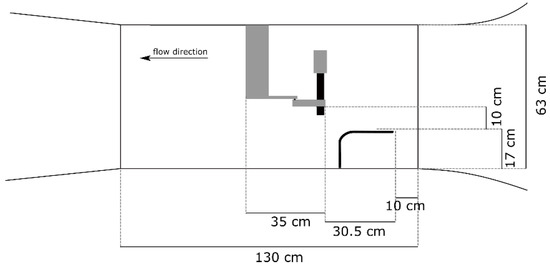
Figure 3.
Position of calibrated instrument in a test section: vane anemometer.
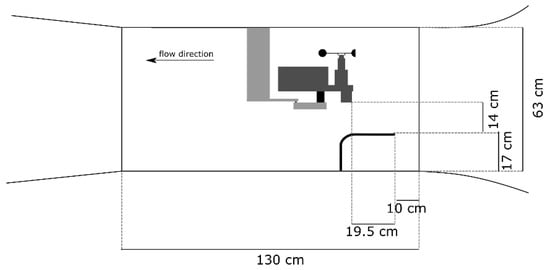
Figure 4.
Position of calibrated instrument in a test section: weather station.
The illustrated location of the calibrated measuring instruments indicates short distances (0.14 m vertically and 0.20 m horizontally) between the calibrated measuring instruments and the active element of the applied measurement standard. This introduces the risk of backward impacts of the calibrated instruments on the standard, caused by the blocking of the flow and the formation of a zone of changed static pressure in the vicinity of the calibrated instruments. Figure 5 presents the dimensions and position of the instruments in the cross section of the measurement section.
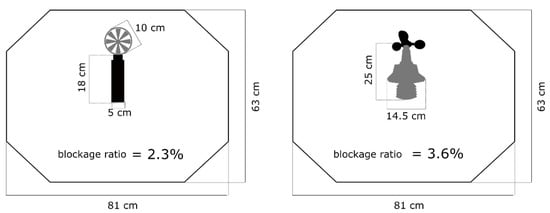
Figure 5.
Calibrated instruments/the cross section of the measurement section.
The flow blockage ratios for both types of calibrated anemometers were determined on the basis of instrument dimensions and the cross-sectional area of the measurement section. The flow blockage factor was expressed as the quotient of the surface area of the solid-state elements of individual instruments to the area of the wind tunnel cross section expressed in percent. For a manual anemometer, the flow blockage factor is 2.3%, and for the biggest weather station anemometers it is 3.6%. Both values of the flow blockage ratio are within the limit of 5% which is specified for closed wind tunnels [8], which is related to the effect of blocking the flow and acceleration of the air stream flowing around objects placed in the wind tunnel test section. Each calibration tunnel has a different specification which assumes different geometry, dimensions, and flow characteristics. It is highly recommended to analyse flow phenomena separately for each tunnel.
2.3. Measurement System
In tests related to assessing the impact of calibrated instruments on the results of flow velocity measurements through a measurement standard, it is necessary to determine velocity profiles in the vicinity of the calibrated measuring instrument. To avoid any significant influence of measurement sensor on the velocity profile, the smallest available hot-wire anemometer sensor (HWA) equipped with a wire diameter of 5 µm was used. This setup allows the flow rate to be determined while avoiding the introduction of additional, significant disturbances in the velocity profile. Such anemometers are commonly used in research related to boundary layer and velocity profile measurements [17,18]. The hot-wire measurement system and the probe used were included in the CCC2002 measuring module [19,20,21]. Before the experiments, the static characteristics of the thermo anemometric system were precisely determined, and the whole system was adjusted to the value of the reference velocity. The adjustment was completed with the expanded uncertainty with a 95% confidence level and was equal to 0.05 m/s for 1.5 m/s, 0.13 m/s for 10 m/s and 0.29 m/s for 20 m/s.
3. Results
3.1. Flow Blockage Zone Determination
To study of the impact of the calibrated device on the velocity in the area occupied by the standard in the form of a pitot-static tube, it was necessary to disassemble it, allowing for flow measurements in the area occupied by the standard. Determination of the area of impact of calibrated devices on the measurement standard indications require measurements with constantly controlled flow velocity in the tunnel. For this purpose, the experiment was conducted in the low-velocity range (up to 0.5 m/s) with a multi-hole measuring orifice as a standard.
The method of determining the flow blockage zone consisted of performing a series of measurements of flow velocity at a large number of points in the area covering the space between the calibrated measuring instrument and the beginning of the pitot-static tube. At each point, a series of measurements was carried out with the frequency of 1 kHz in 5 s. The averaged results from these measurements are shown in Figure 6. The individual testing points at which the measurements of the flow velocity were taken are marked. The horizontal dashed lines indicate the levels at which the measurements were made. Vertical lines refer to the distance from the furthest elements of the calibrated measuring instruments to the point determining the start position of the pitot-static tube.
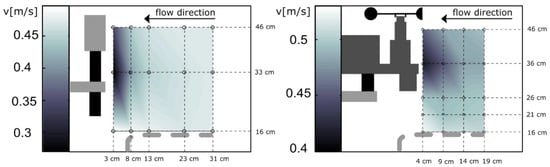
Figure 6.
Velocity profiles in front of calibrated measuring instruments.
In both analysed cases, the longitudinal velocity gradient in the wind tunnel test section was observed. The blockage effect arose in a space above the area in which the measurement standard was placed. The range of the zone with the velocity altered by blockage varied depending on the type of device (size and location in relation to the standard). With the vane anemometer, the observable blockage zone expired between 13 and 23 cm from the beginning of the device. However, with the weather station anemometer, this effect was visible over the entire length of the analysed measurement area.
In order to accurately determine the coverage of the zone, additional measurements were made for different flow velocities (0.5, 10 and 20 m/s), with the pitot-static tube as a standard for higher velocities. The measurements were carried out directly in front of the measuring instruments at heights from the tunnel base of 33 cm for the vane anemometer and 36 cm for the weather station (i.e., 17 and 20 cm above the –pitot-static tube, respectively). The measurements were carried out in the spatial range from the beginning of the measuring instrument to the point on the x-axis corresponding to the beginning of the pitot-static tube in the case of the vane anemometer, and to the beginning of the tunnel test section for the weather station. The measuring points are shown in Figure 7.
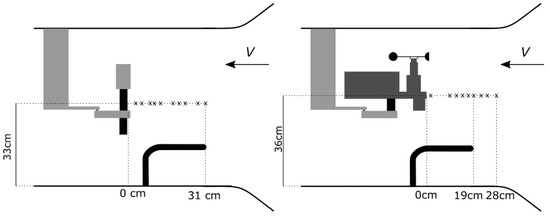
Figure 7.
Probing lines with measuring points.
During the measurements, information about the average velocity values was collected at subsequent measurement points. In order to determine the level of change in the velocity value, segmental differences were determined between the average velocity values recorded directly in front of the measuring instrument. For this purpose, the average value of the flow velocity recorded in the previous position of the hot-wire sensor was subtracted from the average value of the velocity recorded by the hot-wire measurement system in the given measurement position. The results are shown in Figure 7, Table 1, and Table 2. In Figure 8, the vertical dotted lines indicate the position corresponding to the beginning of the pitot-static tube.

Table 1.
Variability of velocity: vane anemometer.
Table 2.
Variability of velocity: weather station.
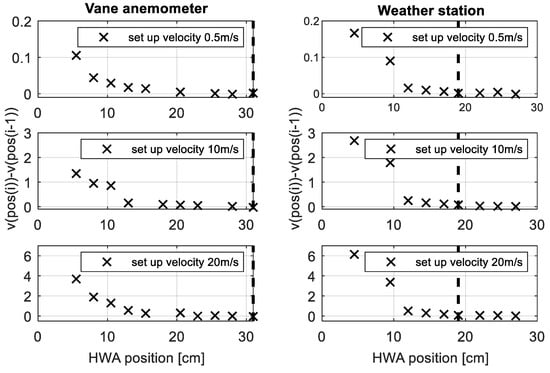
Figure 8.
Differences in velocities position to position.
In both analysed cases, the flow blockage area was dependent on the flow velocity. In the tested range of flow velocities, this zone increased only to a certain distance. In the case of the vane anemometer, this distance was 25.5 cm, and the blockage zone did not reach the location of the velocity standard.
For the weather station anemometer, at the distance corresponding to the position of the active part of the measurement standard, the impact of blockage on the flow was noticeable for the velocities of 10 and 20 m/s. Differences in the average flow velocity at this point related to the measurement point located 2 cm closer to the weather station were 0.08 and 0.07 m/s, respectively.
3.2. Impact on the Standard
The test results show a large impact of the blockage effect on the velocity profile in the tunnel test section. The determined velocity profiles in the vicinity of calibrated instruments (Figure 4) show that zones with the altered velocity were located directly in front of the instruments, above the reference standard. In order to check how the position of the calibrated device affected the velocity field in the place where the reference measurement was installed (measurement part of the pitot-static tube), an additional experiment was carried out. For this experiment we determined the velocity at the place of the standard in two cases. In the first case, the velocity was measured in the absence of a calibrated instrument in the test section. In the second case, the calibrated instrument was assembled.
The experiment was carried out at a flow velocity of 0.5 m/s, with a multi-hole orifice plate as the measurement standard. Velocity values were measured at a frequency of 1 kHz in 5 s. The results of the measurements are shown in Figure 9 and Table 3. Figure 9 presents the decimated signal (frequency 100 Hz).
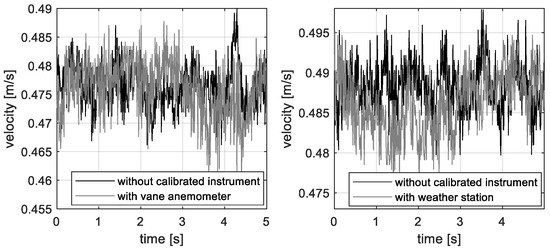
Figure 9.
Registered velocities.
Table 3.
Flow velocity in place.
In both cases, the amplitudes of the registered signals were similar. The differences between the amplitudes of the signals in the experiments with and without calibrated instruments did not exceed 0.004 m/s in the case of the weather station anemometer, and did not exceed 0.001 m/s in the case of the vane anemometer. The analysis of the mean values of the signals and their standard deviation did not indicate any changes related to the introduction of the calibrated devices to the flow. In both cases the differences did not exceed 0.002 m/s.
The obtained results show that the selected location of the calibrated measuring instruments did not disturb the velocity profile in the area of the measurement standard.
4. Discussion and Future Works
The results of the experiments indicate the need to study the measurement quality in specific laboratories in order to unify the calibration methods and set the limits for the types of calibrated instruments. Possession of the most accurate measurement standard does not guarantee correct calibration in the case of a poorly designed test stand. In anemometer calibration, the flow quality and the size of the calibrated instrument may interfere with the measurement standard indications.
In this paper, I presented the range of the impact zones of instruments calibrated both in the area in front of the calibrated instrument (Figure 6) and on the probing line in the area with the greatest range of this zone (Figure 8). The results showed that the range of the zone with the velocity altered by the blockage effect in the case of the largest calibrated instruments was limited to the distance at which the measurement standard was installed. In the presented case, in which the largest measuring instruments were analysed, we observed the influence of instrument location in the test section on the sensor readings. The determined range of the velocity zone altered by the blockage allows for the verification of the correct placement of the reference standard in the analysed measurement case.
Our results showed that the blockage effect could be reduced by changing the position of the standard. In the short test sections, proper placement of the standard (reference anemometer) allowed for calibration with a higher blockage ratio. The selection of such a place must be preceded by a prior verification of the flow velocity profile and the introduction of possible corrections due to the profile’s unevenness.
The presented relationship between the standard and the calibrated anemometer is only one of the several parameters included in the calibration uncertainty budget. The value of correction is determined by the distance between the standard and the calibrated object. It is also correlated with the correction of the velocity profile in the test section of the wind tunnel. Calibration processes require the consideration of many factors which are correlated to each other. Contemporary research such as [22] provides examples of reducing redundant features and multiple parameters. On the basis of the present results, I will perform a multiple-parameter analysis in the case of anemometer calibration.
Funding
This research was funded by Strata Mechanics Research Institute Polish Academy of Sciences.
Institutional Review Board Statement
Not applicable.
Informed Consent Statement
Not applicable.
Data Availability Statement
The data presented in this study are available on request from the corresponding author. The data are not publicly available due to company’s policy.
Conflicts of Interest
The author declares no conflict of interest.
References
- Skotniczny, P. Transient states in the flow of the air-methane mixture at the longwall outlet, induced by a sudden methane outflow. Arch. Min. Sci. 2014, 59, 887–896. [Google Scholar] [CrossRef] [Green Version]
- Sathyajith, M. Wind Energy Fundamentals, Resource Analysis and Economics; Springer: Berlin/Heidelberg, Germany, 2006. [Google Scholar]
- Schümann, H.; Pierella, F.; Sætran, L. Experimental Investigation of Wind Turbine Wakes in the Wind Tunnel. Energy Procedia 2013, 35, 285–296. [Google Scholar] [CrossRef] [Green Version]
- Tian, W.; Ozbay, A.; Wang, X.D.; Hu, H. Experimental investigation on the wake interference among wind turbines sited in atmospheric boundary layer winds. Acta Mech. Sin. 2017, 33, 742–753. [Google Scholar] [CrossRef]
- Socha, K.; Socha, M. Hot-wire anemometric method for flow velocity vector measurement in 2D gas flows based on artificial neural network. Flow Meas. Instrum. 2015, 46, 163–169. [Google Scholar] [CrossRef]
- Sinha, R.; Gulhane, N.P.; Ocłoń, P.; Taler, J.; Gorji, R. The Wind Test on Heat Loss from Three Coil Cavity Receiver for a Parabolic Dish Collector. In Proceedings of the XII International Conference on Computational Heat, Mass And Momentum Transfer (ICCHMT 2019), Rome, Italy, 3–6 September 2019; Volume 128. [Google Scholar]
- Sosnowski, M.; Gnatowska, R.; Grabowska, K.; Krzywanski, J.; Jamrozik, A. Numerical analysis of flow inbuilding arrangement: Computational domain discretization. Appl. Sci. 2019, 9, 941. [Google Scholar] [CrossRef] [Green Version]
- Krach, A.; Kruczkowski, J. Calibration of a system for measuring low air flow velocity in a wind tunnel. Metrologia 2016, 53, 1012–1023. [Google Scholar] [CrossRef]
- Barlow, J.B.; Rae, W.H.; Pope, A., Jr. Low-Speed Wind Tunnel Testing, 3rd ed.; John Wiley & Sons: New York, NY, USA, 1999. [Google Scholar]
- Yeh, T.T.; Hall, J.M. An Uncertainty Analysis of the NIST Airspeed Standards. In Proceedings of the ASME/JSME 2007 5th Joint Fluids Engineering Conference, San Diego, CA, USA, 30 July–2 August 2007; pp. 135–142. [Google Scholar]
- Dahlberg, J.Å. An Investigation of Wind Tunnel Blockage Effects on Cup Anemometer Calibrations; FOI-R-2006-SE; Swedish Defence Research Agency: Stockholm, Sweden, 2006. [Google Scholar]
- Westermann, D.; Balaresque, N.; Busche, P. Systematic Deviation of the Anemometer Calibration Due to Geometrical Interference; Report of Deutsche WindGuard; Deutsche WindGuard Wind Tunnel Services GmbH: Varel, Germany, 2011. [Google Scholar]
- Hansen, O.F.; Hansen, S.O.; Leif, K. Wind tunnel calibration of cup anemometers. In Proceedings of the AWEA Windpower Conference, Atlanta, GA, USA, 3–6 June 2012. [Google Scholar]
- Sørensen, J.N.; Shen, W.Z.; Mikkelsen, R. Wall Correction Model for Wind Tunnels with Open Test Section. AIAA J. 2006, 44, 1890–1894. [Google Scholar] [CrossRef]
- Guerrero-Villar, F.; Dorado, R.; Medina-Sánchez, G.; Torres-Jimenez, E. Alternative Calibration of Cup Anemometers: A Way to Reduce the Uncertainty of Wind Power Density Estimation. Sensors 2019, 19, 2029. [Google Scholar] [CrossRef] [PubMed] [Green Version]
- EURAMET Website. Experimental Study of Blockage Effect in wind Tunnels for Calibrations of Anemometers EURAMET Project—Technical Protocol. 2018. Available online: https://www.euramet.org/ (accessed on 8 October 2021).
- Skotniczny, P.; Ostrogorski, P. Three-dimensional air velocity distributions in the vicinity of a mine heading’s sidewall. Arch. Min. Sci. 2018, 63, 335–352. [Google Scholar]
- Dróżdż, A.; Elsner, W. Comparison of Single and X-Wire Measurements of Streamwise Velocity Fluctuations in Turbulent Boundary Layer. J. Theor. Appl. Mech. 2014, 52, 499–505. [Google Scholar]
- Ligęza, P. Constant-bandwidth constant-temperature hot-wire anemometer. Rev. Sci. Instrum. 2007, 78, 075104. [Google Scholar] [CrossRef] [PubMed]
- Ligęza, P. Static and dynamic parameters of hot-wire sensors in a wide range of filament diameters as a criterion for optimal sensor selection in measurement process. Measurement 2020, 151, 107177. [Google Scholar] [CrossRef]
- Ligęza, P.; Jamróz, P.; Ostrogórski, P. Methods for dynamic behavior improvement of tachometric and thermal anemometers by active control. Measurement 2020, 166, 108147. [Google Scholar] [CrossRef]
- Ding, S.; Tian, G.; Sutthaweekul, R. Non-destructive hardness prediction for 18CrNiMo7-6 steel based on feature selection and fusion of Magnetic Barkhausen Noise. NDT E Int. 2019, 107, 102138. [Google Scholar] [CrossRef]
Publisher’s Note: MDPI stays neutral with regard to jurisdictional claims in published maps and institutional affiliations. |
© 2021 by the author. Licensee MDPI, Basel, Switzerland. This article is an open access article distributed under the terms and conditions of the Creative Commons Attribution (CC BY) license (https://creativecommons.org/licenses/by/4.0/).