Abstract
In the application of DPFs (diesel particulate filters), temperature prediction and control technology during the regeneration phase has always been a great challenge, which directly affects the safety and performance of diesel vehicles. In this study, based on theoretical analysis and sample gas bench test results, a one-dimensional simulation model is built with GT-POWER software. The effects of soot loading quantity and oxygen concentration on regeneration temperature performance are studied. Simulation results show that, when the soot loading quantity exceeds 46 g (12.7 g/L), the maximum temperature inside DPF during the regeneration phase would be higher than 800 °C, and the risk of burning crack would be high. When the oxygen concentration in the exhaust gas is low (lower than 7%), the fuel injected into exhaust gas fails to give off enough heat, and the exhaust gas temperature fails to reach the target regeneration temperature, hydrocarbon emission could be found from the DPF outlet position; when the oxygen concentration in the exhaust gas reaches 7% or above, the DPF inlet temperature could reach the target temperature, accompanied by less hydrocarbon emission. Combined with the simulation results, engine test bench validation was carried out. The results show that the simulation results and test results agree well.
1. Introduction
In recent years, with the continuous upgrading of internal combustion engine emission regulations worldwide, engine combustion technology itself has been limited to meet the requirements of emission regulations, and aftertreatment technology has been placed in an increasingly important position [1]. In response to the emission regulations on PM (particulate matter) and PN (particulate number), engine and vehicle manufacturers generally adopt particulate filter technology to meet regulatory requirements.
When the aftertreatment system is in DPF regeneration mode, a specific amount of fuel is injected into the engine combustion chamber through post injection of the engine fuel system, or directly injected into the front position of DOC (diesel oxidation catalyst) through the HCI (hydrocarbon injection) system. This part of fuel does not participate in the combustion process in the engine combustion chamber but enters the aftertreatment system. The heat released by chemical reactions inside DOC increases the exhaust gas temperature. When high-temperature exhaust gas enters DPF, it chemically reacts with particles accumulated in DPF, oxidizing particles into gaseous matter, and exhausting into the atmosphere. This is the regeneration process of DPF.
In the application of DPF technology, the issue of how to control the regeneration temperature to avoid DPF burning crack failure while reducing as much as possible the deterioration of fuel economy and drivability caused by DPF regeneration challenges the industry.
In practice, engine running conditions and environmental factors vary and are difficult to predict, which results in great challenges in DPF regeneration temperature prediction and control [2]. Studies have shown that the temperature performance of DPF during the regeneration phase is greatly affected by several factors, including soot loading quantity inside DPF [3,4,5], the chemical properties of precious metal catalysts coated on DOC and DPF [6,7,8], and exhaust components, etc. Therefore, researchers have been trying to explore the relationship between influencing factors and regeneration temperature performance through experimental methods.
Regarding the effect of soot loading quantity, experiment results show that the internal peak temperature and maximum temperature gradient of DPF are positively correlated with the initial soot loading quantity, and negatively correlated with the exhaust mass flow rate [9]. Especially when the engine is running under drop-to-idle conditions, the influence of the soot loading quantity on the regeneration temperature performance is particularly prominent [10,11]. Additionally, the increase of the exhaust mass flow rate in the thermal regeneration process will lead to an increase of the temperature value from the filter section to the contraction section along the axial direction [12].
Regarding the effect of the chemical properties of precious metal catalysts coated on DOC and DPF, a study showed that the DPF carrier material and channel structure have influence on the regeneration temperature. Aluminum titanate and cordierite, compared to silicon carbide, can give significant advantages in reducing the temperature loss through DPF [13,14,15]. People have also investigated optimized coating technology, and several formulations for the catalytic coating of silicon carbide DPFs have been successfully tested [16,17,18,19,20].
Regarding the effect of the exhaust components and engine operation conditions, research showed that a transient change in the exhaust mass flow rate is more effective at reducing the peak temperature and temperature gradient than a transient change of the exhaust gas oxygen concentration [21]. Further research shows that the water vapor in the exhaust gas can promote the oxidation of NO2 (nitrogen dioxide) to solid particles, and its promotion effect increases with a decrease of the temperature [22]. Experimental measurements by a high-speed infrared camera during engine transient regeneration conditions showed that the DPF peak temperature is highly influenced by the exhaust temperature, exhaust mass flow rate, and oxygen concentration [23].
At the same time, people have made great efforts in the simulation of DPF regeneration temperature prediction. Compared with experimental research, simulation better eliminates the adverse effects of experimental errors and environmental factors, and it can cover some working conditions that are ignored and cannot be achieved by experiments. Simulation and experiment results show that when the DPF wall temperature is 800 °C or higher, filter clogging can be avoided so as to achieve continuous regeneration [24,25]. Further studies on regeneration temperature prediction show that the root mean-square temperature error using the diesel oxidation catalyst-catalyzed particulate filter estimator was within 3.2 °C compared to the experimental data [26,27].
The above-mentioned research is of great significance to promote the DPF technology, but for the establishment of a simulation model, the above-mentioned research rarely mentions the mechanism of the internal chemical reactions inside DOC and DPF due to adopting the method of fitting experimental data. This may be effective in the mathematical simulation of the test results, but it ignores the process of chemical reactions, which biases the understanding of the profound connection between the temperature performance of the regeneration process and the factors that affect it. The modeling of chemical reactions helps to understand the influencing factors affecting DPF regeneration temperature performance more systematically. Based on the SGBT (sample gas bench test) test result, we carried out one-dimensional modeling of the DOC+DPF system and analyzed the effects of the soot loading quantity and exhaust gas oxygen concentration on regeneration temperature performance.
2. Methods
DOC+DPF is a complex system. The internal chemical reactions of DOC are analyzed theoretically in Section 2.1.1 and Section 2.1.2, and the SGBT test is used to determine the values of some parameters used in the theoretical formula. At the same time, the engine test bench is built in Section 2.2 to verify the accuracy of the model built in this study.
2.1. DOC+DPF System Modeling
In the aftertreatment system, the DOC is located after the turbocharger outlet and before the DPF inlet. The internal chemical reactions of DOC and DPF are affected by factors, such as the catalyst formulation, coating process, exhaust gas composition, soot loading quantity, etc. Modeling of the chemical reactions occurring inside DOC and DPF is helpful to analyze and predict the temperature performance in an aftertreatment system during the regeneration phase. This paper analyzes the main chemical reactions inside DOC using the SGBT test. The test result is used for building the DOC+DPF one-dimensional model.
2.1.1. Theoretical Basis of Catalytic Oxidation Technology
The main chemical reactions occurring inside DOC are shown in Equations (1)–(5), where HC stands for hydrocarbon, O2 stands for oxygen, CO2 stands for carbon dioxide, H2O stands for water, CO stands for carbon monoxide, NO stands for nitric oxide, SO2 stands for sulfur dioxide, SO3 stands for sulfur trioxide, and H2SO4 stands for sulfuric acid. Among them, Equation (1) is the main chemical reaction that occurs during the DPF regeneration phase:
HC + O2 → CO2 + H2O + Heat
CO + O2 → CO2 + Heat
NO + O2 → NO2 + Heat
SO2 + O2 → SO3 + Heat
SO3 + H2O → H2SO4 + Heat
As shown in Equation (6), this paper analyzes the chemical reactions that occur inside DOC and DPF based on the calculation principle of the chemical reaction rate of the oxidation-type catalytic converter proposed by Douglas et al. [28]:
where Rm (mol·m−3·s−1) stands for the reaction rate of components; m represents the component name, for example, the reaction rate of carbon monoxide is represented by RCO, and the reaction rate of hydrocarbons is represented by RC3H6 and RC3H8 participating in the chemical reaction, etc; km (mol m−3 s−1) stands for the pre-referential factor, which is related to the evaporative pyrolysis rate; Tact (K) stands for the activation temperature of chemical reactions; Tw (K) stands for the carrier wall temperature; and Xm (mol s−1) stands for the molar concentration of components.
Further analysis of Equation (6) shows that:
- The chemical reaction speed is negatively correlated with the activation temperature, that is, the higher the activation temperature, the more difficult it is for the chemical reaction to occur. The activation temperature is mainly affected by the mass weight of the noble metal (mainly platinum, palladium, etc.) coated on DOC and DPF, as well as the coating process, and is also related to the aging status of DOC and DPF.
- The higher the carrier wall temperature, the higher the chemical reaction rate would be. The wall temperature of the carrier is mainly affected by factors, such as the temperature, carrier material, specific heat capacity, heat transfer efficiency, and exhaust gas mass flow rate.
- The chemical reaction rate is positively correlated with the molar concentration of components participating in chemical reactions, that is, the higher the molar concentration of the component, the higher the chemical reaction rate would be. The molar concentration of components in the exhaust is mainly affected by factors, such as the fuel quality, engine running condition, system aging condition, EGR (exhaust gas recirculation) rate, and exhaust gas temperature.
To model and analyze the internal chemical reactions of DOC and DPF, and to determine the km and Tact values of different components, a DOC SGBT test is designed in this study. Among the variables to be determined, Tact can be obtained directly through the SGBT test, and km could be fitted according to Equation (6).
2.1.2. Sample Gas Bench Test
As shown in Figure 1, we used HORIBA’s heated THC analyzer, FTX-ONE-FTIR to perform DOC SGBT. The main parameters of the gas analyzer, standard gas, and DOC used in the test are shown in Table 1.
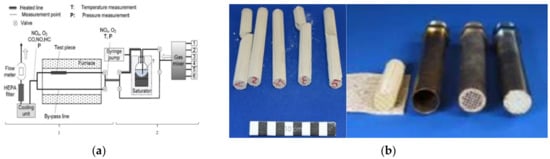
Figure 1.
Schematic diagram for SGBT. 1 in (a) Testing and monitoring equipment 2 in (a) Standard gas (b) SGBT sampling.

Table 1.
Test equipment for SGBT.
Diesel has a high energy density, and it is commonly used for internal combustion engines, such as vehicles, ships, and railway locomotives. For the safety of the test equipment and environment, test gas is used in SGBT instead of diesel. The composition of diesel is complicated. Table 2 shows the main technical characteristics of diesel [29]. According to the mass ratio of carbon, hydrogen, and oxygen in its composition, gaseous propylene (chemical formula: C3H6) and propane (C3H8) with a composition ratio of 2:1 are used in this study instead of diesel.
Table 2.
Main technical characteristics of diesel.
According to the main components of the exhaust gas collected by the engine bench test and the main components of diesel, the standard gas shown in Table 3 is introduced into the test device, as shown in Figure 2, and the heating device is set to ramp up at a rate of 1 °C/min to verify the conversion efficiency of DOC to C3H6 and C3H8 when the space velocity is 50,000 and 80,000 h−1 at different exhaust temperatures. Among them, CxHy is a mixture of C3H6 and C3H8, the volume ratio of the two is 2:1, and the rest of the standard gas is nitrogen.
Table 3.
Component composition for DOC SGBT.
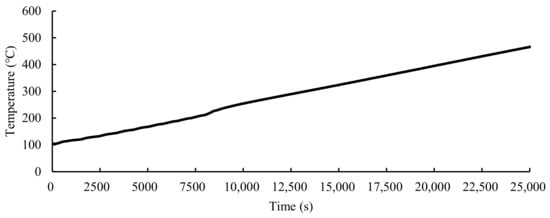
Figure 2.
Temperature ramp-up curve.
As shown in Figure 3 and Figure 4, the C3H6 concentration in the 0–6800 s time range of experiment 1 remains stable at around 93 ppm, and the C3H8 concentration remains stable at around 46 ppm. During this phase, the DOC temperature is between 104 and 216.5 °C. Within the time range 6800–16,000 s, the concentration of C3H6 decreases from 93 ppm to 0 ppm, while the concentration of C3H8 remains stable around 46 ppm. During this phase, the DOC temperature is between 216.5 and 383.5 °C. Within the time range of 16,000–24,000 s, the C3H8 concentration drops from 46ppm to about 5 ppm, and the DOC temperature during this phase reaches around 383.5–518 °C.
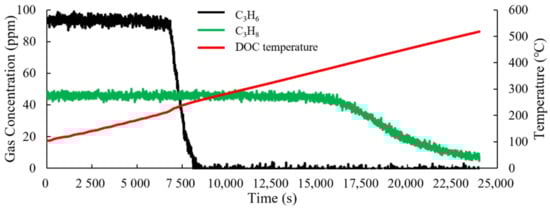
Figure 3.
Change in the hydrocarbon concentration in test 1.
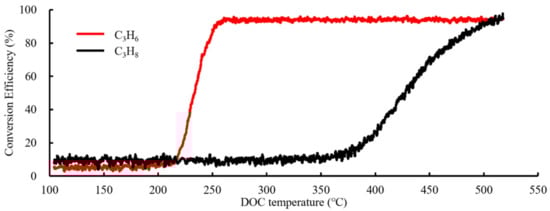
Figure 4.
Hydrocarbon conversion efficiency curve in test 1.
The activation temperature (Tact) represents the temperature at which the conversion efficiency of C3H6 and C3H8 begins to change significantly. In experiment 1, Tact of C3H6 is 216.5 °C, and Tact of C3H8 is 383.5 °C. T50 represents the exhaust gas temperature when the conversion efficiency of C3H6 and C3H8 reaches 50%. The T50 temperature of C3H6 is 233 °C, and the T50 temperature of C3H8 is 440 °C.
As shown in Figure 5 and Figure 6, the C3H6 concentration in the 0–6103 s time range of test 2 remains stable at around 88 ppm, and the C3H8 concentration remains stable at around 44.3 ppm. During this phase, the DOC temperature is between 104.5 and 218 °C. In the time range of 6103–15,967 s, the concentration of C3H6 decreases from 88 ppm to 0 ppm, while the concentration of C3H8 remains stable around 44.3 ppm. During this phase, the DOC temperature is between 218 and 384.5 °C; the concentration of C3H8 decreases from 44.3 ppm to about 10.9 ppm in the time range of 15,967~23,999s. During this phase, the DOC temperature reaches around 384.5–519.5 °C.
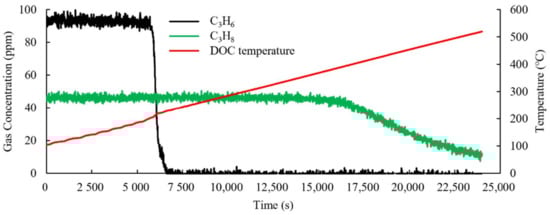
Figure 5.
Change in the hydrocarbon concentration in test 2.
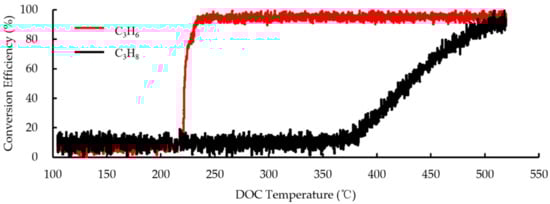
Figure 6.
Hydrocarbon conversion efficiency curve in test 2.
According to the test results of experiment 2, Tact of C3H6 is 218 °C, Tact of C3H8 is 384.5 °C, the T50 temperature of C3H6 is 222 °C, and the T50 temperature of C3H8 is 430.5 °C.
The SGBT result and data fitting result are summarized in Table 4.
Table 4.
Analysis of the results for SGBT.
2.1.3. DOC+DPF One-Dimensional Modeling
One-dimensional modeling of the aftertreatment system could help to analyze the influence of the factors on the regeneration temperature performance, which is of great significance to speed up the development process in engineering applications.
As shown in Figure 7, the simulation model takes the aftertreatment system composed of DOC, DPF, sensors, and pipelines as research objects, and the regeneration process of DPF is simulated in this paper.
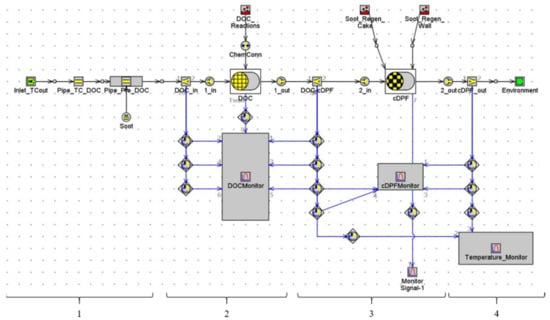
Figure 7.
Schematic diagram of the DOC + DPF simulation model. 1. Soot inlet and its pipeline module. 2. DOC_Reactions, DOC and DOCMonitor modules. 3. Soot_Regen_Cake, Soot_Regen_Wall, cDPF and cDPFMonitor modules. 4. Temperature Monitor module.
The basic parameters of DOC and DPF used in the model are shown in Table 5.
Table 5.
Basic parameters of DOC and DPF.
As shown in Figure 8, the above-mentioned SGBT test results can be used as data input of the one-dimensional DOC + DPF simulation model, which is helpful for modeling and analyzing the internal chemical reactions of DOC.
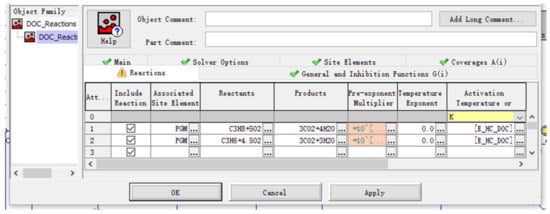
Figure 8.
Modeling of the DOC internal chemical reactions.
2.2. Experimental Setup
To verify the one-dimensional model built in this study, we used the aftertreatment system used in the D25TCIF engine as the research object and carried out engine test bench validation.
As shown in Figure 9 and Table 6, the engine used in the engine test bench validation is an in-line four-cylinder, direct-injection, four-stroke, turbocharged, high-pressure common rail diesel engine. The equipment used in the test includes a hydraulic dynamometer (type CW440), thermocouples (type TMB-K-0.5-600), electronic balance (type IND560), temperature acquisition modules (type ETAS ES620 and ES650), etc. the DOC and DPF information used for the simulation and test bench validation is the same.
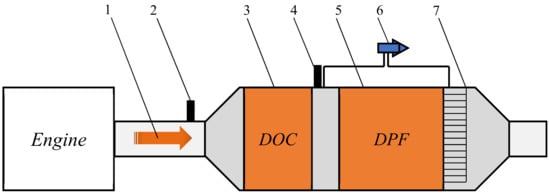
Figure 9.
Schematic diagram of the bench test. 1. Exhaust flow direction 2. DOC inlet temperature sensor 3. DOC 4. DPF inlet temperature sensor 5. DPF 6. Delta pressure sensor 7. Thermal couple temperature sensors.
Table 6.
Component information.
As shown in Figure 10, to validate the influence of the soot loading quantity on the DPF temperature field under regeneration conditions, thermocouple temperature sensors are installed at several locations inside DPF. Three groups of DPFs with different initial soot loading quantities are selected for the experiment. The initial soot loading quantity is 15.5 g (4.28 g L−1), 21.9 g (6.05 g L−1), and 36.5 g (10.08 g L−1).
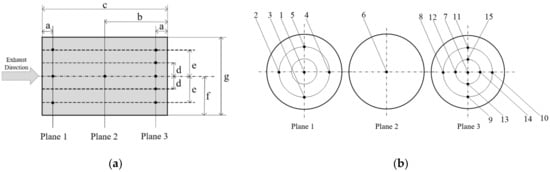
Figure 10.
Distribution of monitoring points. (a) Radial view of temperature sensor locations inside DPF. a: 20 mm b: 63.5 mm c: 127 mm d: 31.8 mm e: 63.5 mm f: 95.3 mm g: 190.5 mm. (b) Axial view of temperature sensor locations inside DPF.
3. Results and Discussion
3.1. Model Prediction
3.1.1. Effect of the Soot Loading Quantity on Steady-State Regeneration Temperature Performance
The soot loading quantity has great effects on the DPF temperature field during the regeneration phase. If the soot loading quantity is too high, when regeneration occurs, the particulate matter will burn violently in the DPF, and the temperature will rise sharply, which will cause the precious metal catalyst coating to fall off and carrier ablation. However, if the soot loading quantity is too low, it will lead to an increase in the regeneration frequency, and also adversely affect vehicle drivability and fuel consumption. Therefore, understanding the effect of the soot loading quantity on the regeneration temperature performance is helpful to improve system safety, reduce fuel consumption, and improve vehicle performance.
As shown in Figure 11, to simulate the temperature field distribution on the central axis of DPF during the regeneration process, we set up seven temperature simulation points on the DPF axis, which are represented by S1~S7. Simulation point S1 is located at the center of the DPF inlet face, S2 is located 20 mm away from the DPF inlet face, S3 is located 31.8 mm away from the DPF inlet face, and S4 is located 63.5 mm away from the DPF inlet face. S5 is located 95.3 mm away from the DPF inlet face, S6 is located 20 mm away from the DPF outlet face, and S7 is located at the center of the DPF outlet face.
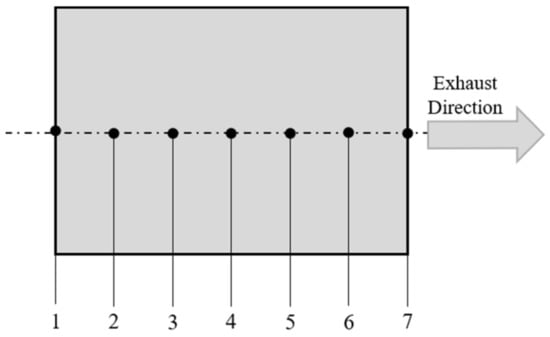
Figure 11.
Schematic diagram of the DPF temperature simulation points. 1. S1 2. S2 3. S3 4. S4 5. S5 6. S6 7. S7.
The exhaust temperature, exhaust mass flow rate, and oxygen concentration under certain engine operating conditions are selected as the model input, and the influence of the initial soot loading quantity on the DPF inner temperature field during the regeneration phase is analyzed. The analysis result is shown in Figure 12 and Table 7.
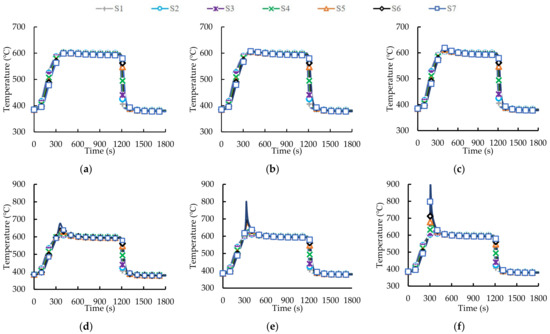
Figure 12.
The DPF regeneration temperature distribution with different initial soot loading quantity. (a). 10 g (b). 15.5 g (c). 21.9 g (d). 36.5 g (e). 46 g (f). 56 g.
Table 7.
Maximum DPF inner temperature with different initial soot loading quantities.
The simulation results show that:
- In the initial stage of regeneration, the temperature of the front part of DPF is higher than the temperature of the rear part, owing to the process of heat conduction. When time elapses, the temperature of the rear part of DPF rapidly rises and exceeds the temperature of the front, owing to the concentrated distribution of particle matter. At the rear of DPF, when particle matter burns, a lot of heat is released, which causes the temperature of the rear of DPF to rise.
- When the initial soot loading quantity is 10 g, the maximum temperature inside DPF reaches 603.2 °C; when the initial soot loading quantity is 15.5 g, the maximum temperature inside DPF reaches 607.7 °C; when the initial soot loading quantity is 21.9 °C, the maximum temperature reaches 619.1 °C; when the initial soot loading quantity is 36.5 °C, the maximum temperature reaches 677.1 °C; when the initial soot loading quantity is 46 g, the maximum temperature reaches 801.1 °C; and when the initial soot loading quantity is 56 g, the maximum temperature reaches 908.8 °C. Based on the above analysis, when the initial soot loading quantity reaches 46 g or above, the internal temperature of DPF would be high, and there is a high risk of the catalyst coating falling off or the carrier burning the crack.
In engineering applications, the soot loading quantity before regeneration is often affected by the vehicle operating conditions and other factors. If the vehicle runs for a long time in low-speed and low-torque conditions that are not suitable for regeneration, the soot loading quantity in DPF increases and cannot be regenerated. Based on the above analysis, when DPF is regenerated with a high soot loading quantity, the DPF inner peak temperature is also high, and the risk of burning cracking is high. Therefore, the soot loading quantity should be strictly controlled to reduce DPF over-temperature failure risk, and the simulation results from this paper could supply a reference soot loading limitation for safe regeneration in practical applications
3.1.2. Effect of Oxygen Density on Regeneration Temperature Performance
The oxygen concentration in the exhaust gas has a great influence on the occurrence of chemical reactions and the temperature distribution inside DPF during the regeneration phase. Therefore, a full understanding of the effect of the oxygen concentration on the regeneration temperature is of great significance for understanding the DPF regeneration process.
As shown in Table 8, this paper selected the typical regeneration conditions and performed simulation calculations about the DPF regeneration temperature performance with different oxygen concentrations. The temperature performance of each position inside DPF was also calculated and is shown in Table 8. Additionally, the concentration of unburnt fuel from the DPF outlet is analyzed in Figure 13.
Table 8.
Regeneration analysis with different oxygen concentrations.
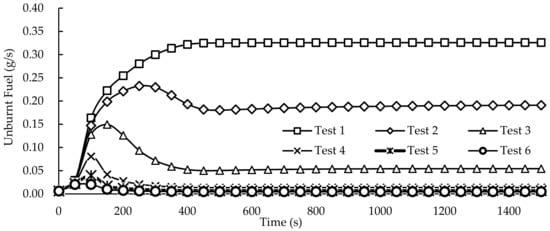
Figure 13.
Unburnt fuel analysis with different oxygen concentrations.
From the above simulation analysis results:
- When the oxygen concentration in the exhaust gas is low, the fuel injected into the exhaust gas during the regeneration phase fails to fully chemically react and release enough heat, and the exhaust gas temperature fails to reach the target temperature, and a large amount of hydrocarbon emission from the DPF outlet is found.
- When the oxygen concentration in the exhaust reaches 7% and above, the exhaust temperature at the inlet of DPF can reach the target temperature, accompanied by a small amount of hydrocarbon emission from the DPF outlet.
According to the above analysis, the necessary exhaust oxygen concentration is one of the key factors for the successful regeneration of DPF. In engineering applications, the oxygen concentration in exhaust gas is often affected by factors, such as the EGR rate and TVA (throttle valve) rate. Therefore, proper calibration during the regeneration phase is important.
3.2. Engine Test Bench Validation
According to the simulation results, the soot loading quantity has a great effect on the peak temperature during the DPF regeneration phase. When the initial soot loading quantity exceeds 46 g, the risk of burning cracking is high; therefore, we only conducted simulation calculations. The comparison between the test results and simulation results is shown in Figure 14 and Table 9.
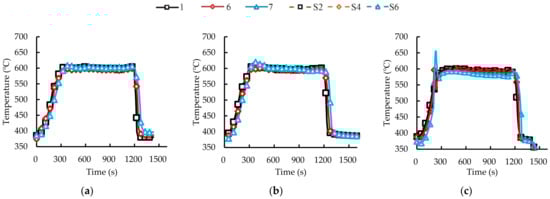
Figure 14.
Comparison between the simulation result and test result. (a). 15.5 g (b). 21.9 g (c). 36.5 g.
Table 9.
Comparison of the test results and simulation results with different initial soot loading quantities.
The results show that when the initial soot loading quantity is 15.5 g, the error between the test result and simulation result is between −6.0 and 3.8 °C, and the relative error is −1.0–0.4%; when the initial soot loading quantity is 21.9 g, the error between the test result and simulation result is between −8.5 and 5.0 °C, and the relative error is −1.4–0.8%; and when the initial soot loading quantity is 36.5 g, the error between the test value and simulation value is between −22.1 and 7.2 °C, and the relative error is −3.7–1.1%. Combined with the test results and simulation results, the one-dimensional simulation model built in this study can predict the internal temperature field of DPF during the regeneration phase accurately, which is important to improve the regeneration safety of an aftertreatment system.
4. Conclusions
In this paper, a one-dimensional simulation model was built, and an SGBT test was carried out to obtain catalyst’s basic performance data, which was used for model calibration. The effect of the soot loading quantity and oxygen concentration on regeneration temperature performance was simulated. The main conclusions drawn from the analysis and research are as follows:
- (1)
- The SGBT result shows that the activation temperature of C3H6 is between 216.5 and 218 °C, and the activation temperature of C3H8 is between 383.5 and 384.5 °C. The T50 temperature deviation of C3H6 and C3H8 at different space speeds is about 18 to 20 °C. The T50 temperature is lower when the airspeed is higher.
- (2)
- A DOC+DPF regeneration temperature prediction model was built, which can be used to simulate and calculate the axial temperature distribution of DOC and DPF during the regeneration phase.
- (3)
- The analysis results of the influence of the oxygen concentration on regeneration temperature performance show that when the oxygen concentration in the exhaust gas is low (less than 7%), the fuel injected into the exhaust gas during the regeneration phase fails to undergo a chemical reaction and release sufficient heat, the exhaust gas temperature fails to reach the target temperature, and a large amount of unburnt fuel leakage occurs; when the oxygen concentration in the exhaust gas reaches 7% or above, the exhaust temperature at the inlet of the DPF can reach the target temperature with a small amount of unburnt fuel leakage.
- (4)
- To verify the technical feasibility of the one-dimensional prediction model, a steady-state engine test bench regeneration test with different initial soot loading quantities was carried out in this paper. The test results show that the simulation results have a small deviation from the actual measurement results of the engine test bench. This result has guiding significance for reducing the DPF regeneration failure rate in actual engineering applications.
The research on DPF is a complex and systematic work, and its work covers many fields, such as mechanics, electricity, chemistry, acoustics, etc. Future research may establish a more detailed one-dimensional simulation model to simulate the influence of factors, such as the packaging structure of the aftertreatment system and the influence of the ambient temperature on DPF regeneration temperature performance. The influence of the exhaust gas composition should also be fully considered, such as the influence of SO2 on the catalytic performance, the influence of NO and NO2 on the regeneration temperature performance, etc.
Author Contributions
Methodology, X.S.; formal analysis, D.J.; investigation, Q.W.; writing original draft preparation, X.S.; writing and editing, Y.L.; review, X.S.; project administration, D.J. All authors have read and agreed to the published version of the manuscript.
Funding
This work is financially supported by the National Youth Science Foundation of China (Grant NO.2210020419).
Institutional Review Board Statement
Not applicable.
Informed Consent Statement
Not applicable.
Data Availability Statement
The data presented in this study are available in the main text of the article.
Conflicts of Interest
The authors declare no conflict of interest.
Nomenclature
| DPF | diesel particulate filter |
| DOC | diesel oxidation catalyst |
| HC | hydrocarbon |
| O2 | oxygen |
| CO2 | carbon dioxide |
| H2O | water |
| CO | carbon monoxide |
| NO | nitric oxide |
| SO2 | sulfur dioxide |
| SO3 | sulfur trioxide |
| H2SO4 | sulfuric acid |
| SV | space velocity |
| HCI | hydrocarbon injection |
| PM | particulate matter |
| PN | particulate number |
| SGBT | sample gas bench test |
| NO2 | nitrogen dioxide |
| CuFe2O4 | copper iron oxide |
| Pt | platinum |
| Pd | palladium |
References
- Reşitoğlu, İ.A.; Altinişik, K.; Keskin, A. The pollutant emissions from diesel-engine vehicles and exhaust aftertreatment systems. Clean Technol. Environ. Policy 2015, 17, 15–27. [Google Scholar] [CrossRef]
- Guan, B.; Zhan, R.; Lin, H.; Huang, Z. Review of the state-of-the-art of exhaust particulate filter technology in internal combustion engines. J. Environ. Manag. 2015, 154, 225–258. [Google Scholar] [CrossRef] [PubMed]
- Fang, J.; Meng, Z.; Li, J.; Du, Y.; Qin, Y.; Jiang, Y.; Bai, W.; Chase, G.G. The effect of operating parameters on regeneration characteristics and particulate emission characteristics of diesel particulate filters. Appl. Therm. Eng. 2019, 148, 860–867. [Google Scholar] [CrossRef]
- Martirosyan, K.S.; Chen, K.; Luss, D. Behavior features of soot combustion in diesel particulate filter. Chem. Eng. Sci. 2010, 65, 42–46. [Google Scholar] [CrossRef]
- Di Sarli, V.; Di Benedetto, A. Combined effects of soot load and catalyst activity on the regeneration dynamics of catalytic diesel particulate filters. AIChE J. 2018, 64, 1714–1722. [Google Scholar] [CrossRef]
- Nossova, L.; Caravaggio, G.; Couillard, M.; Ntais, S. Effect of preparation method on the performance of silver-zirconia catalysts for soot oxidation in diesel engine exhaust. Appl. Catal. B Environ. 2018, 225, 538–549. [Google Scholar] [CrossRef]
- Deng, W.; Hu, Q.; Liu, T.; Wang, X.; Zhang, Y.; Song, W.; Sun, Y.; Bi, X.; Yu, J.; Yang, W.; et al. Primary particulate emissions and secondary organic aerosol (SOA) formation from idling diesel vehicle exhaust in China. Sci. Total Environ. 2017, 593–594, 462–469. [Google Scholar] [CrossRef] [PubMed]
- Fayad, M.; Fernández-Rodríguez, D.; Herreros, J.; Lapuerta, M.; Tsolakis, A. Interactions between aftertreatment systems architecture and combustion of oxygenated fuels for improved low temperature catalysts activity. Fuel 2018, 229, 189–197. [Google Scholar] [CrossRef]
- Tong, D.; Zhang, J.; Wang, G.; Yang, B.; Cai, K.; Liu, S.; Abdalla, A.; Shuai, S.-J. Experimental Study and Numerical Interpretation on the Temperature Field of DPF during Active Regeneration with Hydrocarbon Injection. SAE Tech. Pap. Ser. 2018. [Google Scholar] [CrossRef]
- Tan, P.-Q.; Duan, L.-S.; Li, E.-F.; Hu, Z.-Y.; Lou, D.-M. Experimental study on the temperature characteristics of a diesel particulate filter during a drop to idle active regeneration process. Appl. Therm. Eng. 2020, 178, 115628. [Google Scholar] [CrossRef]
- D’Aniello, F.; Rossomando, B.; Arsie, I.; Pianese, C. Development and Experimental Validation of a Control Oriented Model of a Catalytic DPF. SAE Tech. Pap. Ser. 2019, 1–14. [Google Scholar] [CrossRef]
- Deng, Y.; Cui, J.; E, J.; Zhang, B.; Zhao, X.; Zhang, Z.; Han, D. Investigations on the temperature distribution of the diesel particulate filter in the thermal regeneration process and its field synergy analysis. Appl. Therm. Eng. 2017, 123, 92–102. [Google Scholar] [CrossRef]
- Millo, F.; Andreata, M.; Rafigh, M.; Mercuri, D.; Pozzi, C. Impact on vehicle fuel economy of the soot loading on diesel particulate filters made of different substrate materials. Energy 2015, 86, 19–30. [Google Scholar] [CrossRef]
- Higuchi, N.; Mochida, S.; Kojima, M. Optimized Regeneration Conditions of Ceramic Honeycomb Diesel Particulate Filters; SAE International: Warrendale, PA, USA, 1983. [Google Scholar]
- Iwata, H.; Konstandopoulos, A.G.; Nakamura, K.; Ogiso, A.; Ogyu, K.; Shibata, T.; Ohno, K. Further Experimental Study of Asymmetric Plugging Layout on DPFs: Effect of Wall Thickness on Pressure Drop and Soot Oxidation; SAE International: Warrendale, PA, USA, 2015. [Google Scholar]
- Quiles-Díaz, S.; Giménez-Mañogil, J.; García-García, A. Catalytic performance of CuO/Ce0.8Zr0.2O2 loaded onto SiC-DPF in NOx-assisted combustion of diesel soot. RSC Adv. 2015, 5, 17018–17029. [Google Scholar] [CrossRef]
- Di Sarli, V.; Landi, G.; Di Benedetto, A.; Lisi, L. Synergy Between Ceria and Metals (Ag or Cu) in Catalytic Diesel Particulate Filters: Effect of the Metal Content and of the Preparation Method on the Regeneration Performance. Top. Catal. 2021, 64, 256–269. [Google Scholar] [CrossRef]
- Rossomando, B.; Arsie, I.; Meloni, E.; Palma, V.; Pianese, C. Experimental Testing of a Low Temperature Regenerating Catalytic DPF at the Exhaust of a Light-Duty Diesel Engine. SAE Tech. Pap. Ser. 2018, 1–9. [Google Scholar] [CrossRef]
- Rossomando, B.; Arsie, I.; Meloni, E.; Palma, V.; Pianese, C. Experimental Test on the Feasibility of Passive Regeneration in a Catalytic DPF at the Exhaust of a Light-Duty Diesel Engine. SAE Tech. Pap. Ser. 2019, 1–10. [Google Scholar] [CrossRef]
- Tang, T.; Zhang, J.; Cao, D.; Shuai, S.; Zhao, Y. Experimental study on filtration and continuous regeneration of a particulate filter system for heavy-duty diesel engines. J. Environ. Sci. 2014, 26, 2434–2439. [Google Scholar] [CrossRef] [PubMed]
- Meng, Z.; Zhang, J.; Chen, C.; Yan, Y. A numerical investigation of the diesel particle filter regeneration process under temperature pulse conditions. Heat Mass Transf. 2016, 53, 1589–1602. [Google Scholar] [CrossRef]
- Soltani, S.; Andersson, R.; Andersson, B. The Effect of Exhaust Gas Composition on the Kinetics of Soot Oxidation and Diesel Particulate Filter Regeneration. Fuel 2018, 220, 453–463. [Google Scholar] [CrossRef]
- Chen, K.; Luss, D. Temperature rise during stationary and dynamic regeneration of a diesel particulate filter. Rev. Chem. Eng. 2010, 26, 133–147. [Google Scholar] [CrossRef]
- Yamamoto, K.; Yamauchi, K. Numerical simulation of continuously regenerating diesel particulate filter. Proc. Combust. Inst. 2013, 34, 3083–3090. [Google Scholar] [CrossRef]
- Sarli, V.D.; Benedetto, A.D. Modeling and simulation of soot combustion dynamics in a catalytic diesel particulate filter. Chem. Eng. Sci. 2015, 137, 69–78. [Google Scholar] [CrossRef]
- Mahadevan, B.S.; Johnson, J.H.; Shahbakhti, M. Development of a Catalyzed Diesel Particulate Filter Multi-zone Model for Simulation of Axial and Radial Substrate Temperature and Particulate Matter Distribution. Emiss. Control. Sci. Technol. 2015, 1, 183–202. [Google Scholar] [CrossRef][Green Version]
- Thiengkaew, K.; Khongsup, V.; Wirojsakunchai, E. Sensitivities Of Diesel Particulate Filter Clean And Loading Models. In Proceedings of the 2015 2nd International Conference on Mechatronics and Mechanical Engineering (ICMME 2015), Singapore, 15–16 September 2015; Volume 34, p. 02005. [Google Scholar]
- Douglas, R.; Carberry, B.P. Modelling of oxidation catalysts for two-stroke cycle engines. SAE Trans. 1996, 105, 1179–1191. [Google Scholar]
- Li, L.; Li, G.; Zhu, Z. Oxygenated Diesel Fuels and Their Research Status. Tract. Farm Transp. 2007, 34, 6–9. [Google Scholar]
Publisher’s Note: MDPI stays neutral with regard to jurisdictional claims in published maps and institutional affiliations. |
© 2021 by the authors. Licensee MDPI, Basel, Switzerland. This article is an open access article distributed under the terms and conditions of the Creative Commons Attribution (CC BY) license (https://creativecommons.org/licenses/by/4.0/).