Article

Phosphate and Ammonium Removal from Water through Electrochemical and Chemical Precipitation of Struvite

Research Unit of Sustainable Chemistry, University of Oulu, P.O. Box 4300, FI-90014 Oulu, Finland
*
Author to whom correspondence should be addressed.
Processes 2021, 9(1), 150; https://doi.org/10.3390/pr9010150
Submission received: 12 December 2020 / Revised: 9 January 2021 / Accepted: 10 January 2021 / Published: 14 January 2021
(This article belongs to the Special Issue Control and Optimization of Wastewater Treatment Technology)

Abstract

:
Batch electrocoagulation (BEC), continuous electrocoagulation (CEC), and chemical precipitation (CP) were compared in struvite (MgNH4PO4·6H2O) precipitation from synthetic and authentic water. In synthetic water treatment (SWT), struvite yield was in BEC 1.72, CEC 0.61, and CP 1.54 kg/m3. Corresponding values in authentic water treatment (AWT) were 2.55, 3.04, and 2.47 kg/m3. In SWT, 1 kg struvite costs in BEC, CEC, and CP were 0.55, 0.55, and 0.11 €, respectively, for AWT 0.35, 0.22 and 0.07 €. Phosphate removal in SWT was 93.6, 74.5, and 71.6% in BEC, CEC, and CP, respectively, the corresponding rates in AWT were 89.7, 77.8, and 74.4%. Ammonium removal for SWT in BEC, CEC, and CP were 79.4, 51.5, and 62.5%, respectively, rates in AWT 56.1, 64.1, and 60.9%. Efficiency in CEC and BEC are equal in nutrient recovery in SWT, although energy efficiency was better in CEC. CP is cheaper than BEC and CEC.

1. Introduction

Wastewater, especially municipal wastewater contains nutrients such as phosphate and nitrogen. These nutrients cause eutrophication in water bodies [1,2]. In many countries, the removal of phosphorus from municipal wastewater is mandatory. Similarly, regulations to remove nitrogen are in place, and such regulations are becoming more stringent worldwide. Nitrogen and phosphorus are the key nutrients to all organisms and are vital in increasing the scale of food production [3,4,5,6]. When an insufficient amount of phosphorus is available to organisms, poor growth occurs [7,8]. Nitrogen is currently causing huge financial losses every year in the European Union (EU) area alone mainly due to eutrophication. This loss is even higher than the cost of nitrogen supplementation in the EU [9,10,11]. The method used for phosphorus removal is chemical precipitation using aluminum or iron precipitant prior to the biological process. This reduces the potential to use the precipitate, e.g., as a fertilizer. There are also other methods for phosphate removal, such as adsorption, ion exchange, electro-coagulation, and electro-Fenton treatment [12,13,14]. Nitrogen is typically present in the form of ammonium nitrogen. Ammonium ions are not easy to precipitate and are therefore removed in the biological process by nitrification and denitrification [15].
Our previous studies [16,17] have investigated the removal of phosphate from wastewaters by using batch electrocoagulation (BEC). In this method, the removal efficiencies for phosphate from dairy and mine wastewaters reached up to 93% under optimal conditions. Several studies [18,19,20,21,22,23] have also precipitated struvite (MgNH4PO4·6H2O) through electrocoagulation (EC) and chemical precipitation (CP). These studies have demonstrated that EC can be used in struvite precipitation to remove phosphate from wastewater. Moreover, phosphate can be removed through coagulation, flocculation, adsorption, and biological treatment [22,23,24]. As for the removal of ammonium from water, such methods [18,21,22] as adsorption, air stripping, membrane separation, and ion exchange may be employed. Similar to our earlier work, other studies have investigated struvite formation through electrocoagulation [20,24,25,26] by using BEC systems, wherein struvite nucleation, crystallization, and quality were analyzed. These earlier studies showed that electrochemical struvite precipitation is suitable in slightly alkaline conditions. Moreover, they showed that struvite quality is strongly dependent on pH and current density and that struvite purity is influenced by the P to N ratio.
However, in the literature exist studies related to CP and BEC but the continuous flow electrochemical precipitation has not been studied much. In the present study, BEC, continuous flow electrocoagulation (CEC), and CP were compared with the same kind of conditions and initial nutrient concentrations. Electrocoagulation was performed using magnesium electrodes as anode and cathode. Only magnesium electrodes were used to avoid any contamination of different cathode materials. In the chemical precipitation of struvite, magnesium was dosed as MgO which was the most economic magnesium source, whereas, in electrocoagulation, magnesium was dissolved from the electrode. Song et al. [23] described the anodic dissolution of magnesium, and they established the following reactions (Equations (1)–(3)) involving electrical dissolution:
Mg ↔ Mg+ + e
Mg+ + H2O → Mg2+ + OH + 0.5 H2
2 H2O + 2 e → 2 OH + H2
Equation (1) is assumed to be the rate-determining step, and Mg+ is oxidized into Mg2+ in Equation (2). Equation (3) is the cathode reaction.
The precipitation product, struvite, has the potential to be further used as a slow-release fertilizer [5]. Struvite consists of magnesium, ammonium, and phosphorus (MgNH4PO4·6H2O) at equal molar concentrations [27]. In this study, we aimed to, firstly, prove that the CEC system is as efficient as the BEC or CP systems in forming struvite from synthetic and authentic water solutions. The novelty of this study is the comparison of the purification efficiency and operational costs of the patented CEC system [28] with those of the widely studied BEC and CP systems. Secondly, we aimed to prepare a high-purity struvite from synthetic and authentic waters through electrocoagulation.

2. Materials and Methods

2.1. Water Solutions

Synthetic water was prepared from the following chemicals: (1) commercial NH4Cl (Merck, Darmstadt, Germany, 99.995%) as a source of ammonium and (2) KH2PO4 (Sigma-Aldrich, St. Louis, MO, USA, ≥99%) as a source of phosphate diluted with ultrapure water (Milli-Q, Merck, Germany). The amounts of NH4 and PO4 were 200 and 1053 mg/L, respectively. A commercial humic acid sodium salt (Sigma-Aldrich, technical grade) was added to the nutrient solution (50 mg/L) to model the water coming from the peat industry. Such wastewater contains humic acid at a concentration ranging from 50 mg/L to over 300 mg/L [19]. The initial pH was set to 7.6 ± 0.15 using 8 M NaOH. Different molar ratios (Mg:NH4:PO4) have been studied for struvite precipitation [22]. Pretests of struvite formation showed us that the molar ratio of 1:1:1 (Mg:NH4:PO4) was suitable to be used in this study. Magnesium was dissolved from the magnesium electrode in the BEC and CEC. In the CP, a commercial magnesium oxide (MgO, VWR, Monroeville, PA, USA, ≥98%) was used as a magnesium source. The solution that contained 269 mg/L of magnesium was prepared from MgO. Therefore, the amount of magnesium in CP was the same as in BEC and CEC. The amount of magnesium in BEC and CEC was calculated using Faraday’s law (see Equation (4)). Duplicate experiments for each process were performed.
m m e t a l = I × t s × M z × F
where ts = the treatment time (s), M = the molar mass of electrode material (g/mol), I = the applied current (A), F = Faraday’s constant (96,485 C/mol) and z = the valence of ions of the electrode material.
An authentic water sample was obtained from a peat bog drainage in northern Finland. This sample was spiked to contain an amount of NH4 and PO4 similar to that found in synthetic water containing commercial NH4Cl and KH2PO4. The amounts of NH4 and PO4 were calculated to be 200 and 1053 mg/L, respectively. The initial TOC concentration in the authentic water was 27 mg/L. Molar ratio 1:1:1 (Mg:NH4:PO4) was used. Duplicate experiments for each process were made.
The synthetic waters used for each test was prepared separately, and initial and final samples were taken. The final sample was taken after the 24-h settling time. The Mgtot, Ptot, and NH4 of these samples were analyzed. The amount of ammonium was analyzed using Hach HQ30d equipped with an ammonium ion-selective electrode. Magnesium and phosphorus analyses for the synthetic and authentic water samples was done by using Perkin Elmer Optima 5300 DV ICP-OES (Waltham, MA, USA) and Agilent 5110 VDV ICP-OES (Santa Clara, CA, USA), respectively. Same standard solutions were used in both measurements. TOC analysis was performed using a Skalar Formacs HT TOC Analyzer (Breda, The Netherlands).

2.2. Chemical Equilibrium Calculations

Phosphate precipitation was modeled using the MINEQL+ version 5.0 computer program. MINEQL+ performs mass balance calculations using thermodynamic constants from a database to calculate solution equilibria. The database did not include equilibrium constant for struvite; therefore, it was added. The added value was logK = −13.15 for Equation (5) as experimentally determined by Taylor et al. [29].
MgNH 4 PO 4 · 6 H 2 O ( s ) Mg 2 + ( aq ) + NH 4 + ( aq ) + PO 4 3 ( aq ) + 6 H 2 O ( l )
Magnesium, ammonium, and phosphate concentrations, as well as the temperature, obtained under the experimental precipitation conditions, were used in the calculations.

2.3. Electrochemical Precipitation and Coagulation Experiments

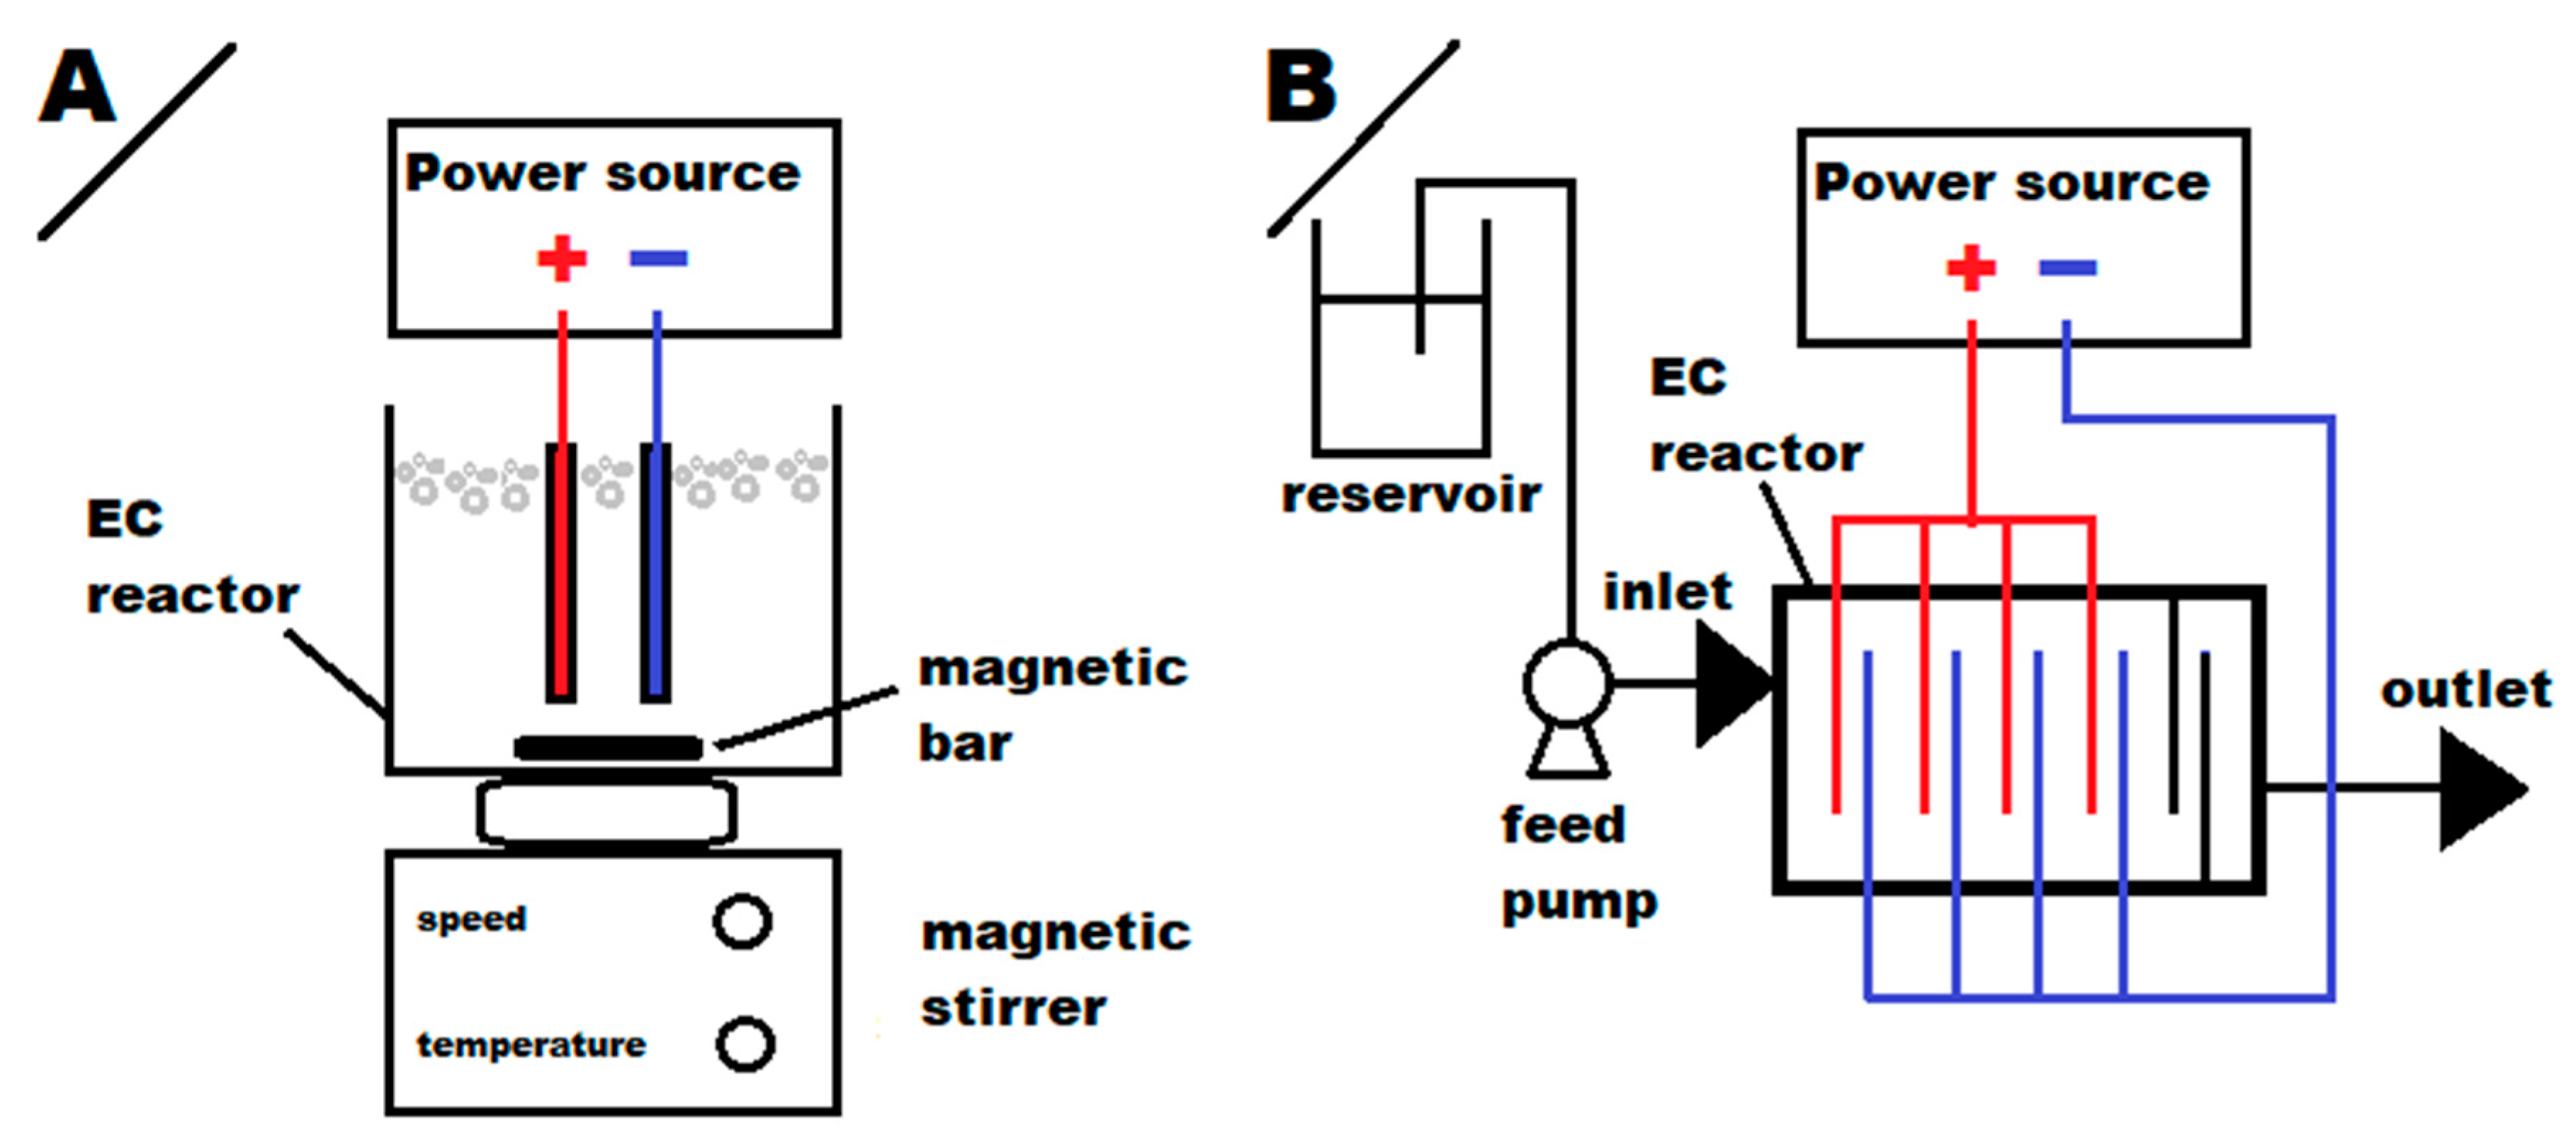
2.3.1. Batch EC Process

In our earlier study [17], we described laboratory-scale batch electrocoagulation (BEC) equipment, and this exact same system was used in the current study, except for the power supply (EA-PS 3065-05 B). A schematic description of the BEC experimental set-up is given in Figure 1A. The current and voltage of this power source can be adjusted current from 0 A to 5 A and from 0 V to 65 V, respectively. The dimensions of the magnesium electrodes were 50 mm × 50 mm × 10 mm with a total area of effect (Aeff,b) of 70 cm2, which was calculated from all the surfaces of the anode material. The current (Ib) used in this experiment was set to 1 A. The electrode cap between electrodes was 5 mm. The cleaning procedures were similar to those described in our earlier study [17]. A magnetic stirrer was used at 125 rpm for 30 min. The starting pH was 7.6 ± 0.15 with 5 M HCl and was adjusted with 8 M NaOH to 7.6–9 during the experiment.
For each test, two samples for both the synthetic and authentic waters were taken; one sample was obtained before the pH adjustment and the other was obtained after the 24-h settling time. The sludge that settled at the bottom was collected after the removal of the water from the container. The removed water was filtered through a 0.45 µm filtration paper, and the sludge was dried at room temperature (20 ± 1 °C). The dried sludge was ground before X-ray diffraction (XRD) analysis.

2.3.2. Continuous EC Process

The principle of the continuous EC process (CEC) is similar to that of a described system with a patent FI 127889 [28]. A schematic description of the CEC experimental set-up is given in Figure 1B. The patent defines how electrodes are located to each other and in the reactor. The test equipment used was similar to those used in our earlier study [30]. The total area of effect (Aeff,c) was 307.2 cm3, and the total current (Ic) was set to 4.7 A. The cleaning procedures were also similar to those described in our earlier study [17]. The water flow was set to 8 L/h. The pH was set to 7.6 ± 0.15 with 8 M NaOH at the beginning of the experiment and then adjusted to 7.6–9 during the experiment.
Sludge formed mostly at the bottom of the container, and only a little sludge formed on top of the water. Sludge formed after each use of an electrode pair, and the amount of sludge that formed progressively decreased in every use of the electrode pair. After the sludge was allowed to settle for 24 h at room temperature (20 ± 1 °C), the sludge was treated as described in Section 2.3.1.

2.3.3. Chemical Precipitation

In this experiment, the chemical precipitation (CP) was performed using 1600 mL water containing synthetic phosphate and ammonium as described above. MgO was added (the calculated mass in solution was 477 mg/L) to the water solution wherein the molar ratio of P04, NH4, and Mg after MgO addition was 1:1:1. The pH was set to 7.6 ± 0.15 with 8 M NaOH. During the experiment, the pH was adjusted to 7.6–9.
The solution was subsequently stirred with a magnetic stirrer at 125 rpm for 30 min at room temperature (20 ± 1 °C). The settling time of the sludge was 210 min. Water samples were taken at the beginning and the end of the test. The sludge was treated as described in Section 2.3.1.

2.4. Characterization of Precipitate Samples

XRD patterns were recorded by a PANalytical X´Pert Pro X-ray diffraction equipment (Malvern Panalytical, Almelo, The Netherlands) using monochromatic CuKα1 radiation (λ = 1.5406 Å) at 45 kV and 40 mA. Diffractograms were collected within the 2θ range of 10–55° at 0.0167° intervals; the scan step time was 70–100 s. The crystalline phases and structures were analyzed by the X’Pert HighScore Plus program. The main peaks were identified by matching with the standard Joint Committee on Powder Diffraction Standards (JCPDS) files. Product purity was determined by the same program through the Rietveld method.

2.5. Economic Analysis

The operational costs (OCs) of the electrocoagulation processes [€/m3 of water] were calculated after the test by using the following parameters and formulas: electrical energy consumption (EEC) [kWh/m3], mass of anodic material dissolved (EMC) [kg/m3], industrial energy price (a) [€/kWh], price of dissolved electrode material (b) [€/kg], power used in the process (P) [W], time used (t) [min], volume of treated water (V) [m3], amount of 5 M HCl used (c) [mL/L], price of 5 M HCl (C) [€/L], amount of 8 M NaOH used (d) [mL/L] and price of 8 M NaOH (D) [€/L]. In this paper, the following equations (Equations (6) and (7)) were used:
OC = a × EEC + b × EMC + c × C + d × D
EEC = P × t 60 × V
The following parameters were used in this study: an industrial energy price of 0.0896 €/kWh (average for November 2019 in Finland, covering energy price, distribution price, and taxes) and an estimated price for magnesium sheet of 4.58 €/kg (range: 4.58–200 €/kg). The time, volume, and power were 30 min, 1.6 L, and 22.5 W, respectively, in the batch process and 60 min, 8 L, and 9.96 W, respectively, in the continuous process. HCl (5 M) and NaOH (8 M) were used to adjust the pH to the suitable level, and c, C, d, and D were 1.25–4.05 mL/L, 0.079 €/L, 1.05–1.25 mL/L, and 0.0848 €/L, respectively.
The CP cost (CPC) [€/m3 of water] was calculated by using the following parameters and formula: amount of 5 M HCl used (c) [mL/L], price of 5 M HCl (C) [€/L], amount of 8 M NaOH used (d) [mL/L], price of 8 M NaOH (D) [€/L], amount of MgO added to the solution (e) [mg/L] and price of MgO (E) [€/g]. The following equation (Equation (8)) was used:
CPC = c × C + d × D + e × E
The amount of Mg added to the solution was 0.447 g/L and the cost of MgO (99% purity) was 0.823 €/kg; the prices of the commercial MgO products (99% purity) ranged from 0.823 € to 164.63 €/kg. The product price depends on the amount of the order made. The pH adjustment chemical prices are the same as above. The amount of 5 M HCl and 8 M NaOH used in the CP were 0.937 and 1.25 mL/L in synthetic and authentic water treatments, respectively, in all tests.

3. Results and Discussion

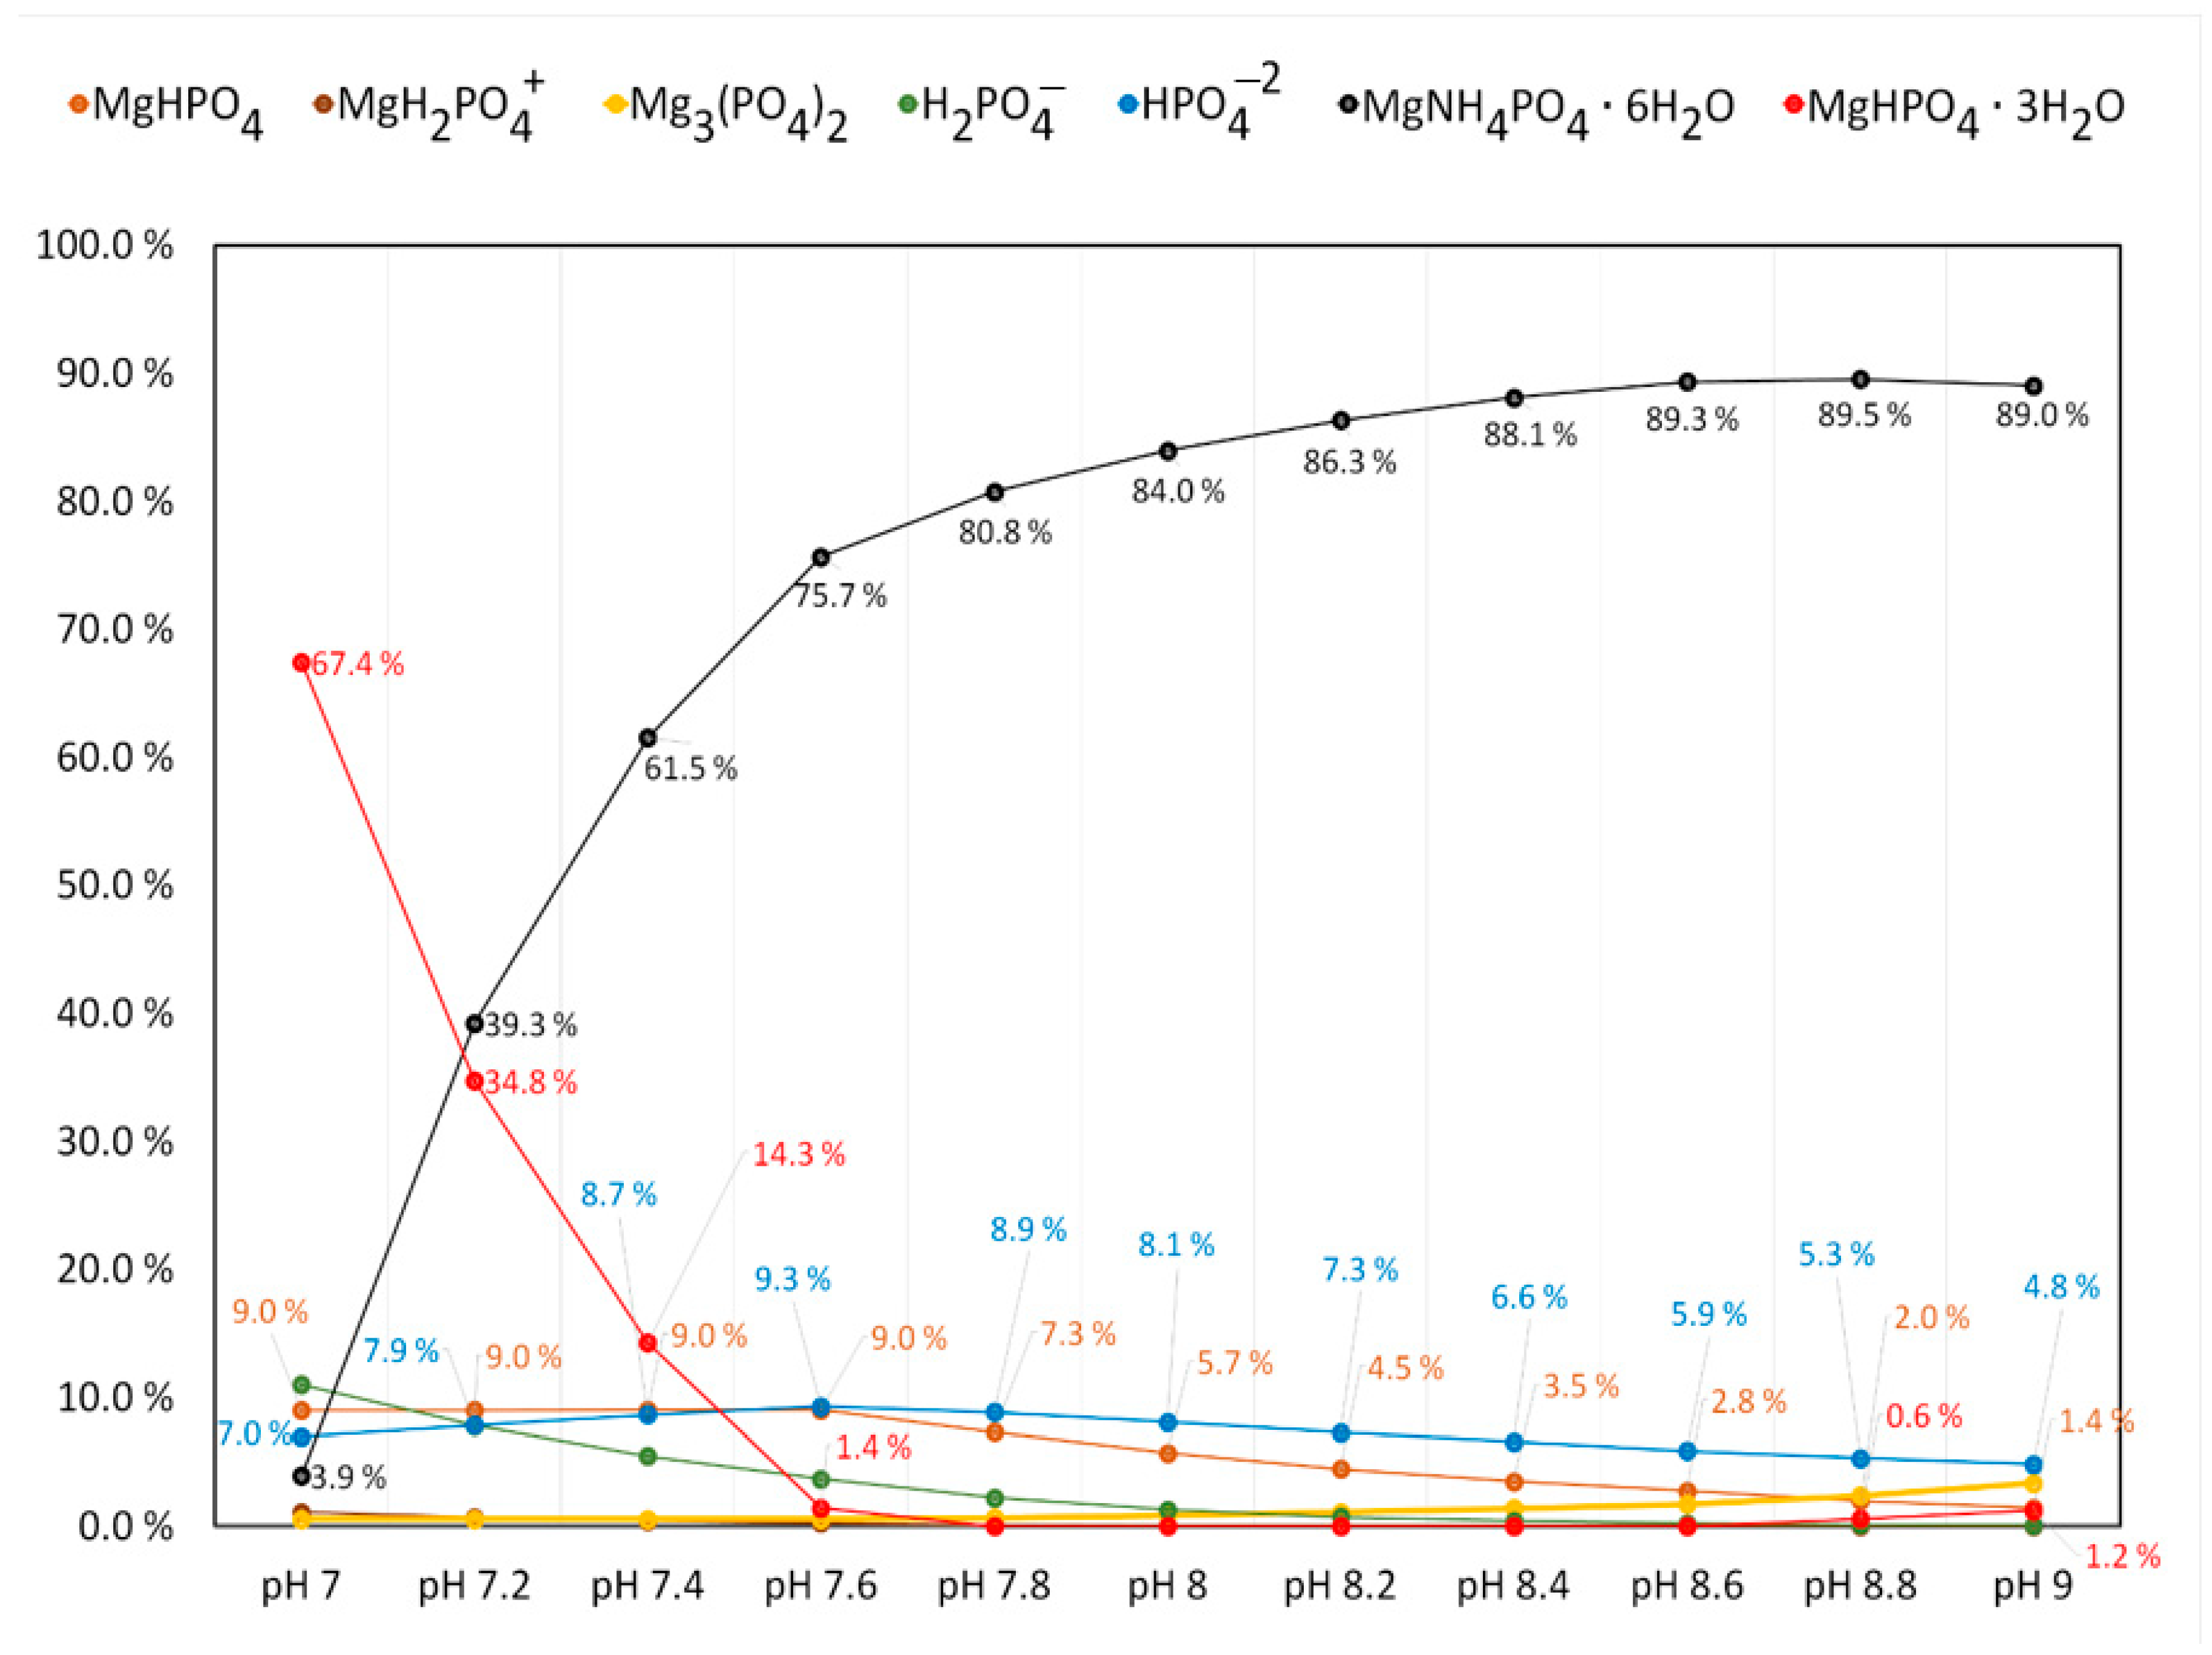
3.1. Effect of pH for Struvite Precipitation

The preliminary experiments showed that pH is increasing during electrocoagulation and that the pH level should be adjusted during the experiment. Optimal pH for coagulation was evaluated based on MINEQL+ calculations. The increasing pH is caused by OH formation during electrocoagulation as shown in Equation (3). In Figure 2, the MINEQL+ calculation showing phosphate speciation as a function of pH is presented. Based on this calculation, the optimal pH area that allows struvite formation was defined to be 7.6–9.0. This pH range was used in the BEC, CEC, and CP experiments.

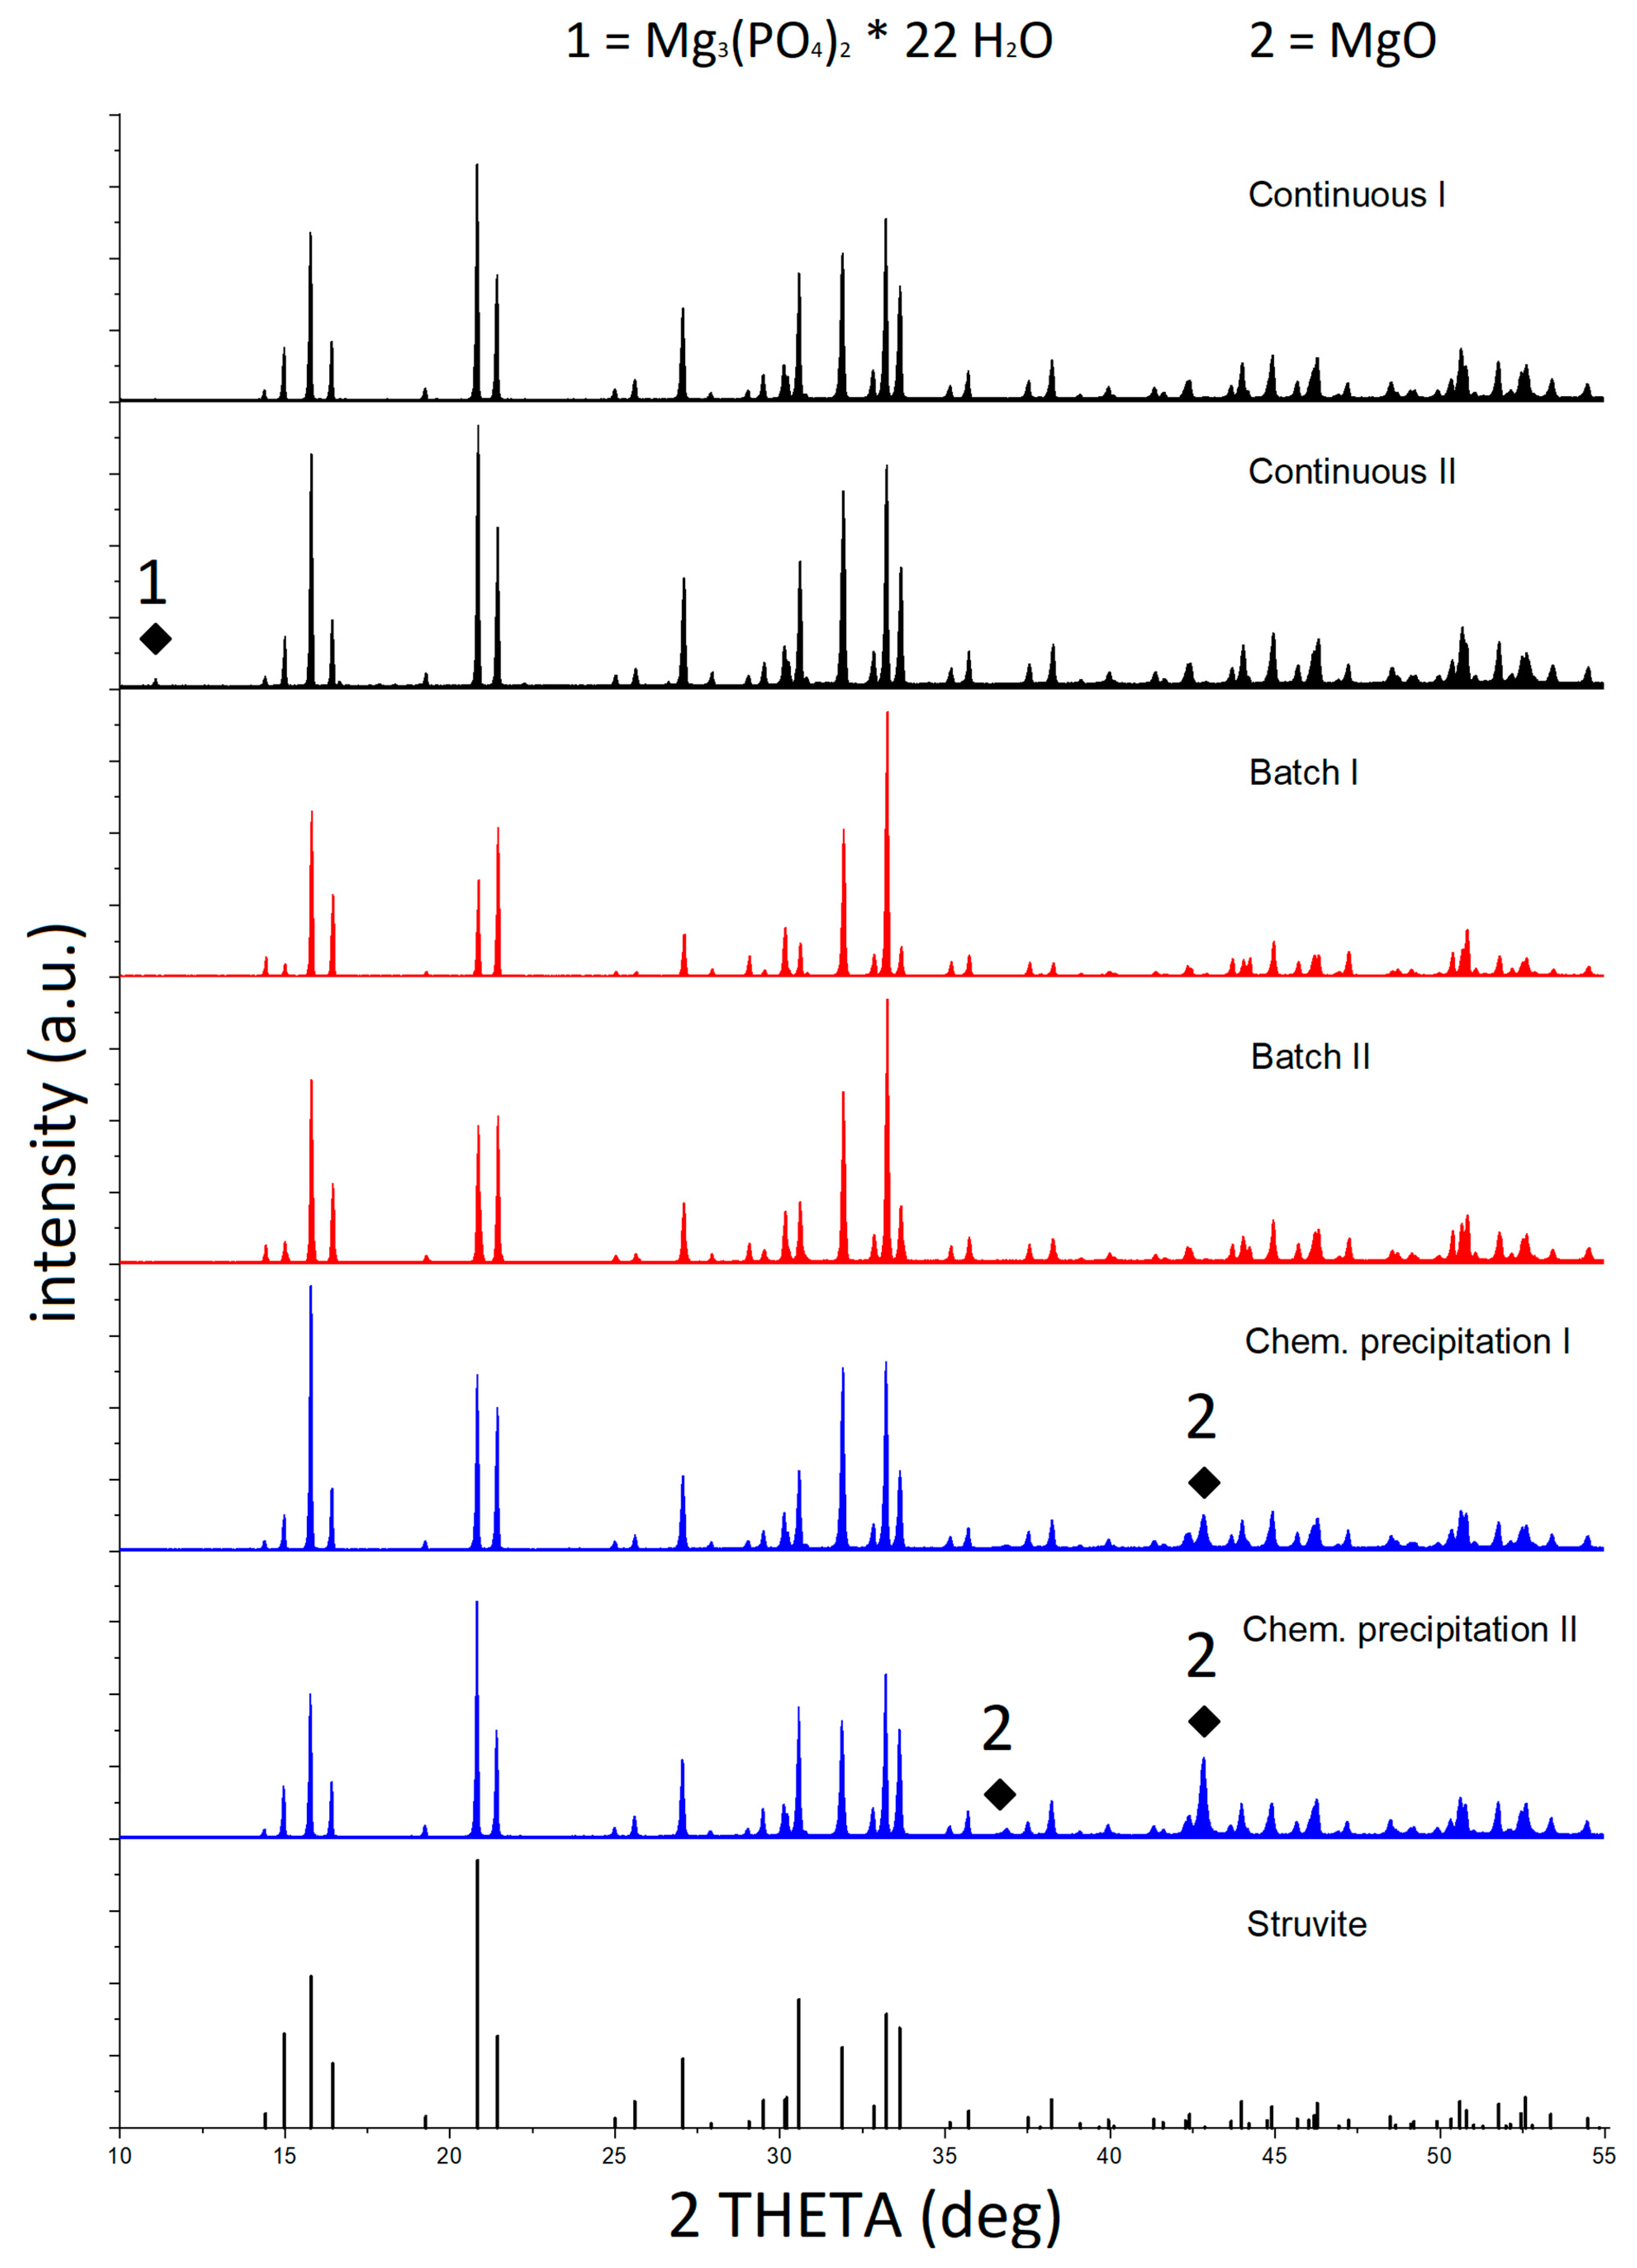
3.2. Purity of Produced Struvite

Struvite was precipitated as shown in Section 2.3. XRD patterns of the dried sludges (precipitates) obtained from the synthetic water samples used in all experiments are shown in Figure 3. The XRD patterns showed that nearly all the peaks matched well with the XRD pattern of struvite (MgNH4PO4·6H2O) (ICDD 04-010-2533). The color of the struvite was almost white in every experiment which indicates that the purity of struvite is high. For the sludge of both samples in the CEC, diffraction peaks for magnesium phosphate hydrate (Mg3(PO4)2·22H2O) (ICDD 00-055-0828) were also detected. For both CP processes, MgO (ICDD 01-071-1176) peaks were identified, indicating that some of the added MgO did not react. Based on the result of the Rietveld analysis, the purity of the struvite ranged from 93.0% (CP) to 98.1% (CEC), which is higher purity than that reported earlier by Kruk et al. [20] (75%).
Similar results were obtained for the authentic water samples (Figure 4). The diffraction peaks for magnesium phosphate hydrate (Mg3(PO4)2·22H2O) were detected in only one CEC sludge. The CP results for both authentic water samples showed some MgO peaks, indicating the presence of unreacted MgO. The struvite purity based on the result of the Rietveld analysis ranged from 98.6% (CP) to 100% (CEC and BEC), which are higher than the corresponding purities for the synthetic water.
Possible impurities KMg(PO4)H2O, KMg(PO4)·6H2O, K3(PO4), Mg(PO4)(H2O), and Mg(OH)2 can be present in the precipitates. Kruk et al. [20] have listed e.g., MgHPO4, Mg3(PO4)2, and Mg(OH)2, and when potassium ions present e.g., MgKPO4 as typical struvite impurities.

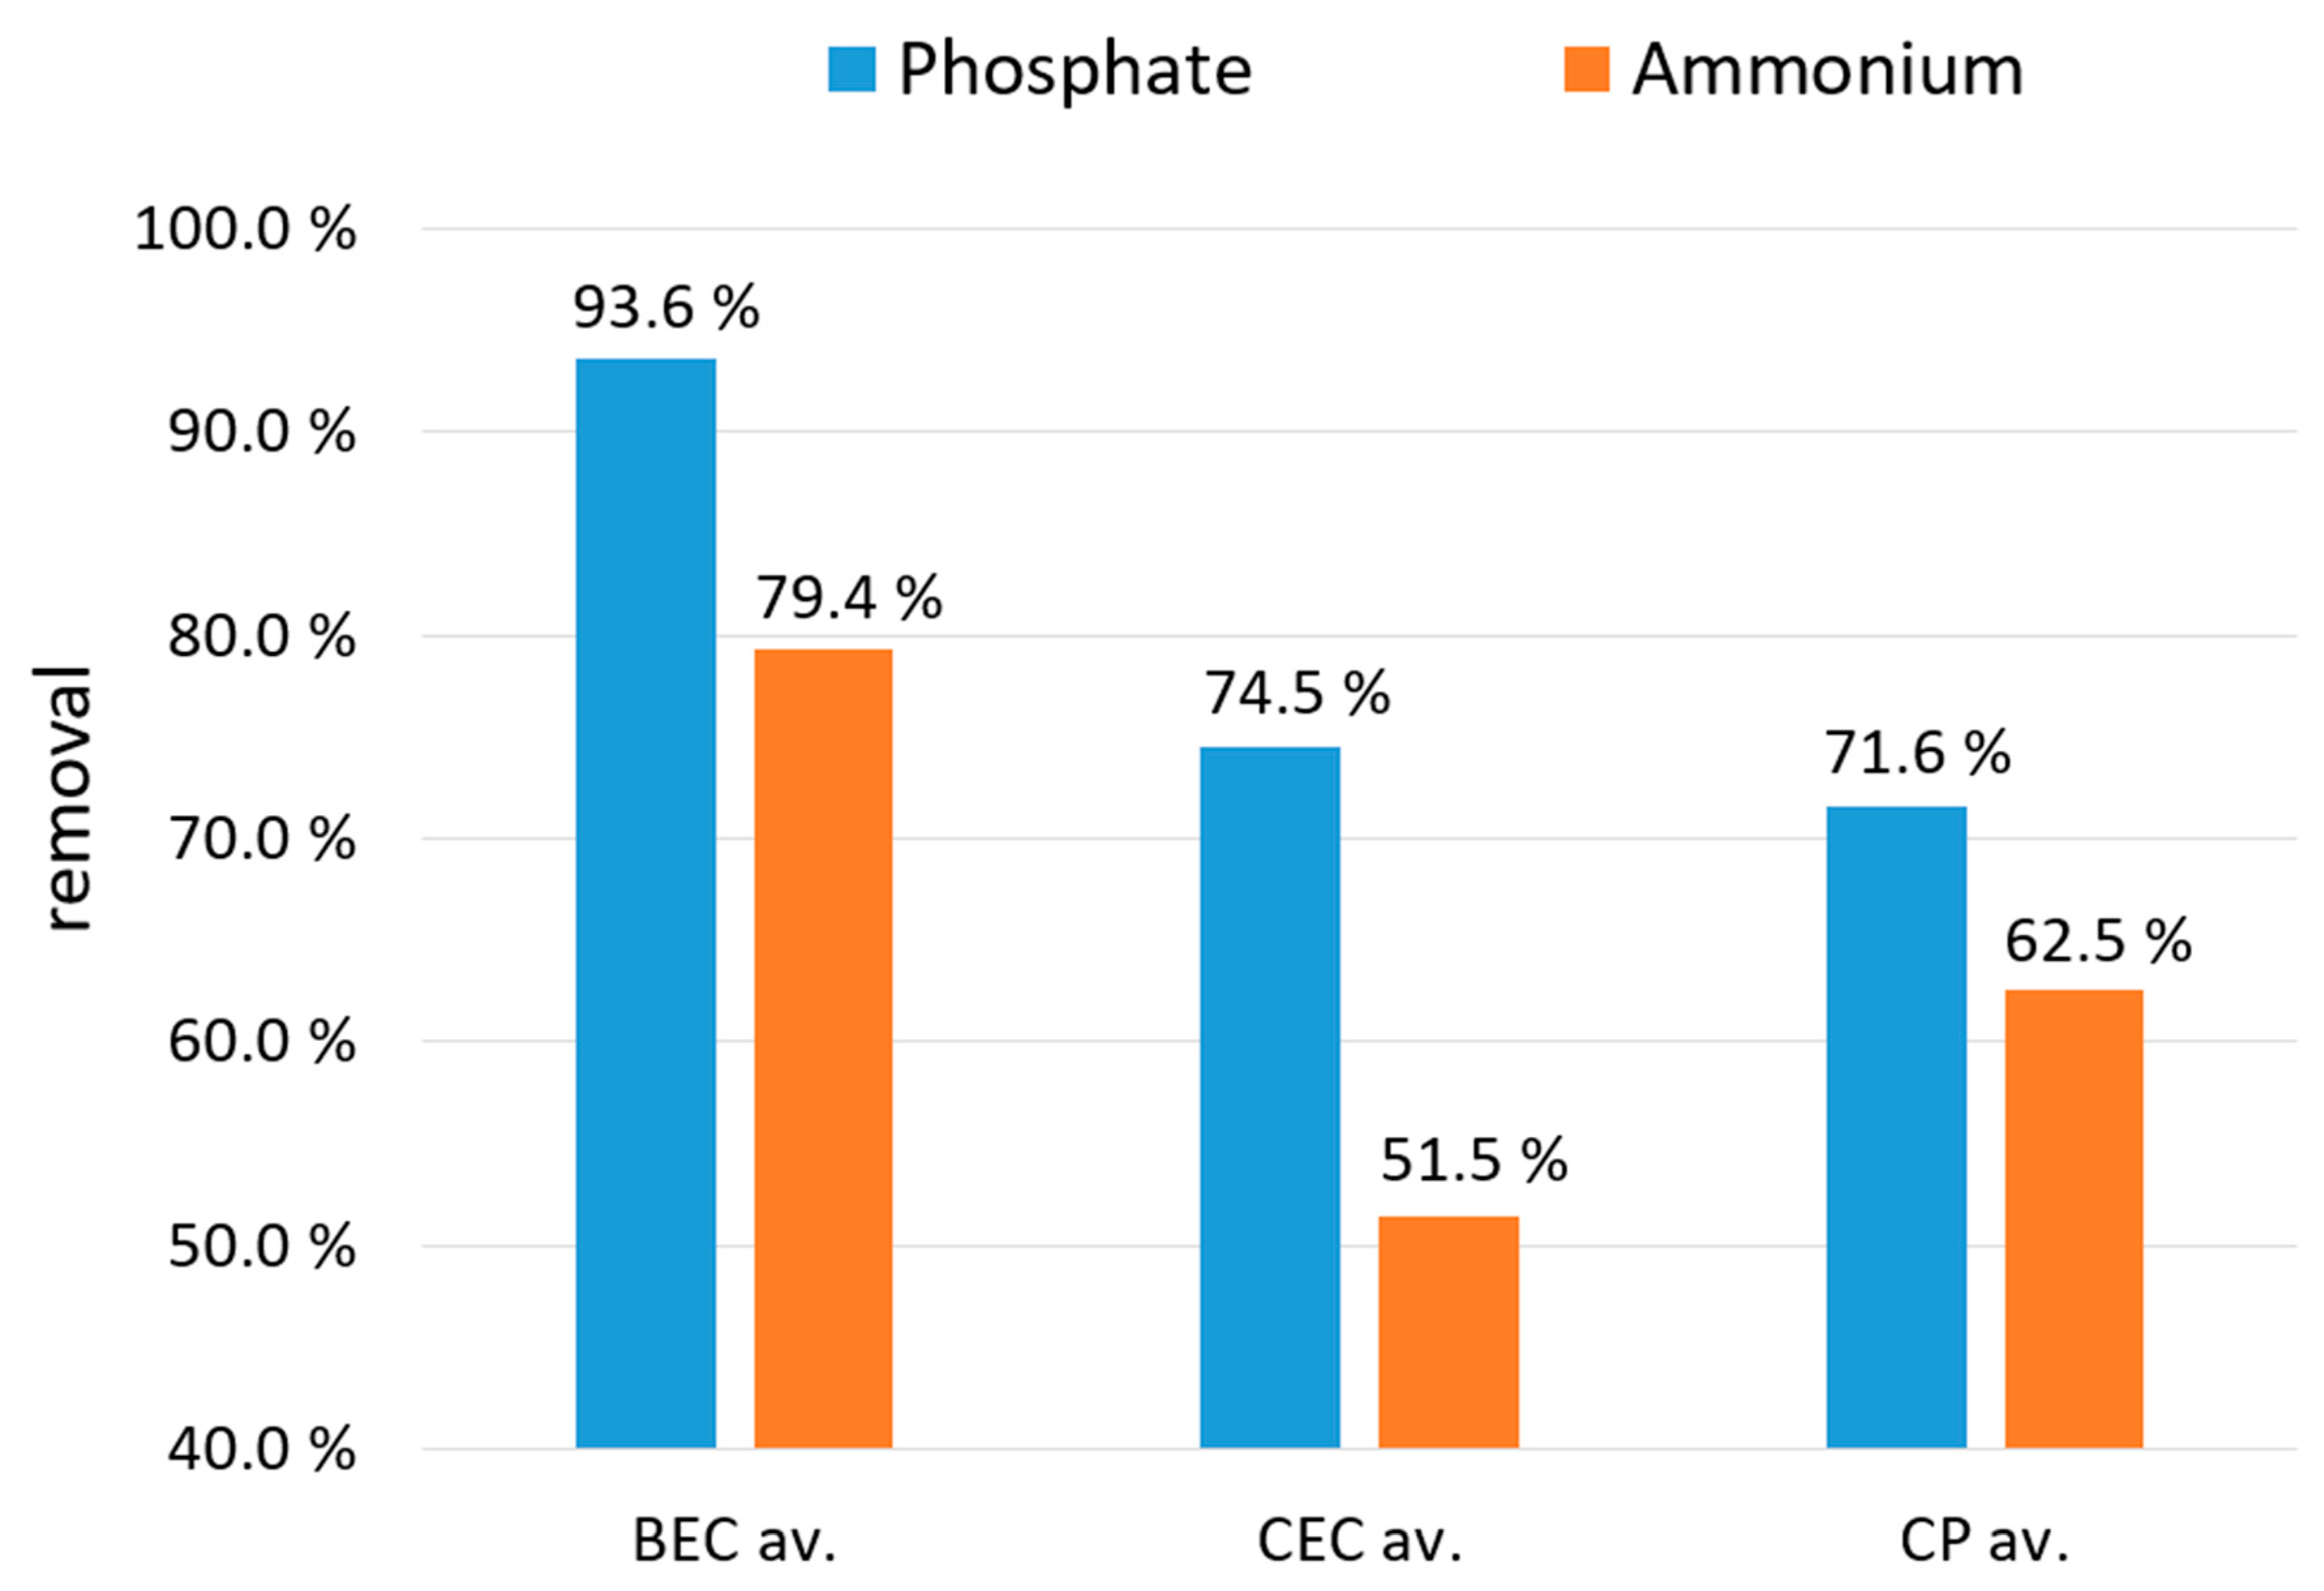
3.3. Phosphate and Ammonium Removal from Water Solutions

The PO4 and NH4 removal efficiencies of the BEC, CEC, and CP experiments were compared. Figure 5 presents the average phosphate and ammonium removal rates under these processes for synthetic water treatment (SWT). In the BEC, the phosphate removal rate was as high as 93.6% compared with the removal rates of 74.5% and 71.6% in CEC and CP, respectively. For comparison, a phosphate removal rate of 59–84% was reported by Hug and Udert [25], a 70–80% removal rate was reported by Doyle and Parsons [27] in their chemical precipitation study, and a phosphate removal rate of 50–98% was reported by Bektas et al. [24] in their electrocoagulation study. Our results are consistent with the findings of other studies. The ammonium removal rate in the BEC, CEC, and CP were 79.4%, 51.5%, and 62.5%, respectively, and are presented in Figure 5. The removal rate was calculated as an average of two separate experiments (Figure 5 and Figure 6). Mohammadi et al. [21] reported an ammonium removal rate of 60.45–75.91%, whereas Ghimire et al. [18] reported a removal rate of 97.6% at a voltage of 5 V, 68% at a voltage of 3 V, and 20% at a voltage of 1.2 V. In the current study, the average voltage in BEC was 11.9 V and that in CEC was 2.2 V in different electrode pairs. This finding on the effect of voltage on ammonium removal is consistent with the earlier observations of Ghimire et al. [18].
Figure 6 presents the average phosphate and ammonium removal rate in the BEC, CEC, and CP in authentic water treatment (AWT). The BEC demonstrated an excellent phosphate removal rate of 89.7% compared with the removal rates of 77.8% and 74.4% in the CEC and CP, respectively. These results are consistent with those of the studies mentioned above. The ammonium removal rates in the BEC, CEC, and CP were 56.1%, 64.1%, and 60.9%, respectively, as shown in Figure 6. The average voltage values in the BEC and CEC in different electrode pairs were 11.9 V and 3.0 V, respectively. These results on the effect of voltage on ammonium removal are consistent with those of Ghimire et al. [18].
Based on the results, both EC systems gave higher removal rates of phosphate than CP in SWT and AWT. Further, the BEC has higher removal efficiency than CEC. These EC systems are suitable to replace or to supplement conventional phosphate removal methods. In the CP, nitrogen removal rates were similar in SWT and AWT. The nitrogen removal rate in SWT was higher in the BEC system compared with CEC while the CEC was better in AWT. Overall, EC systems seem to apply to the simultaneous removal of phosphate and nitrogen from wastewater.

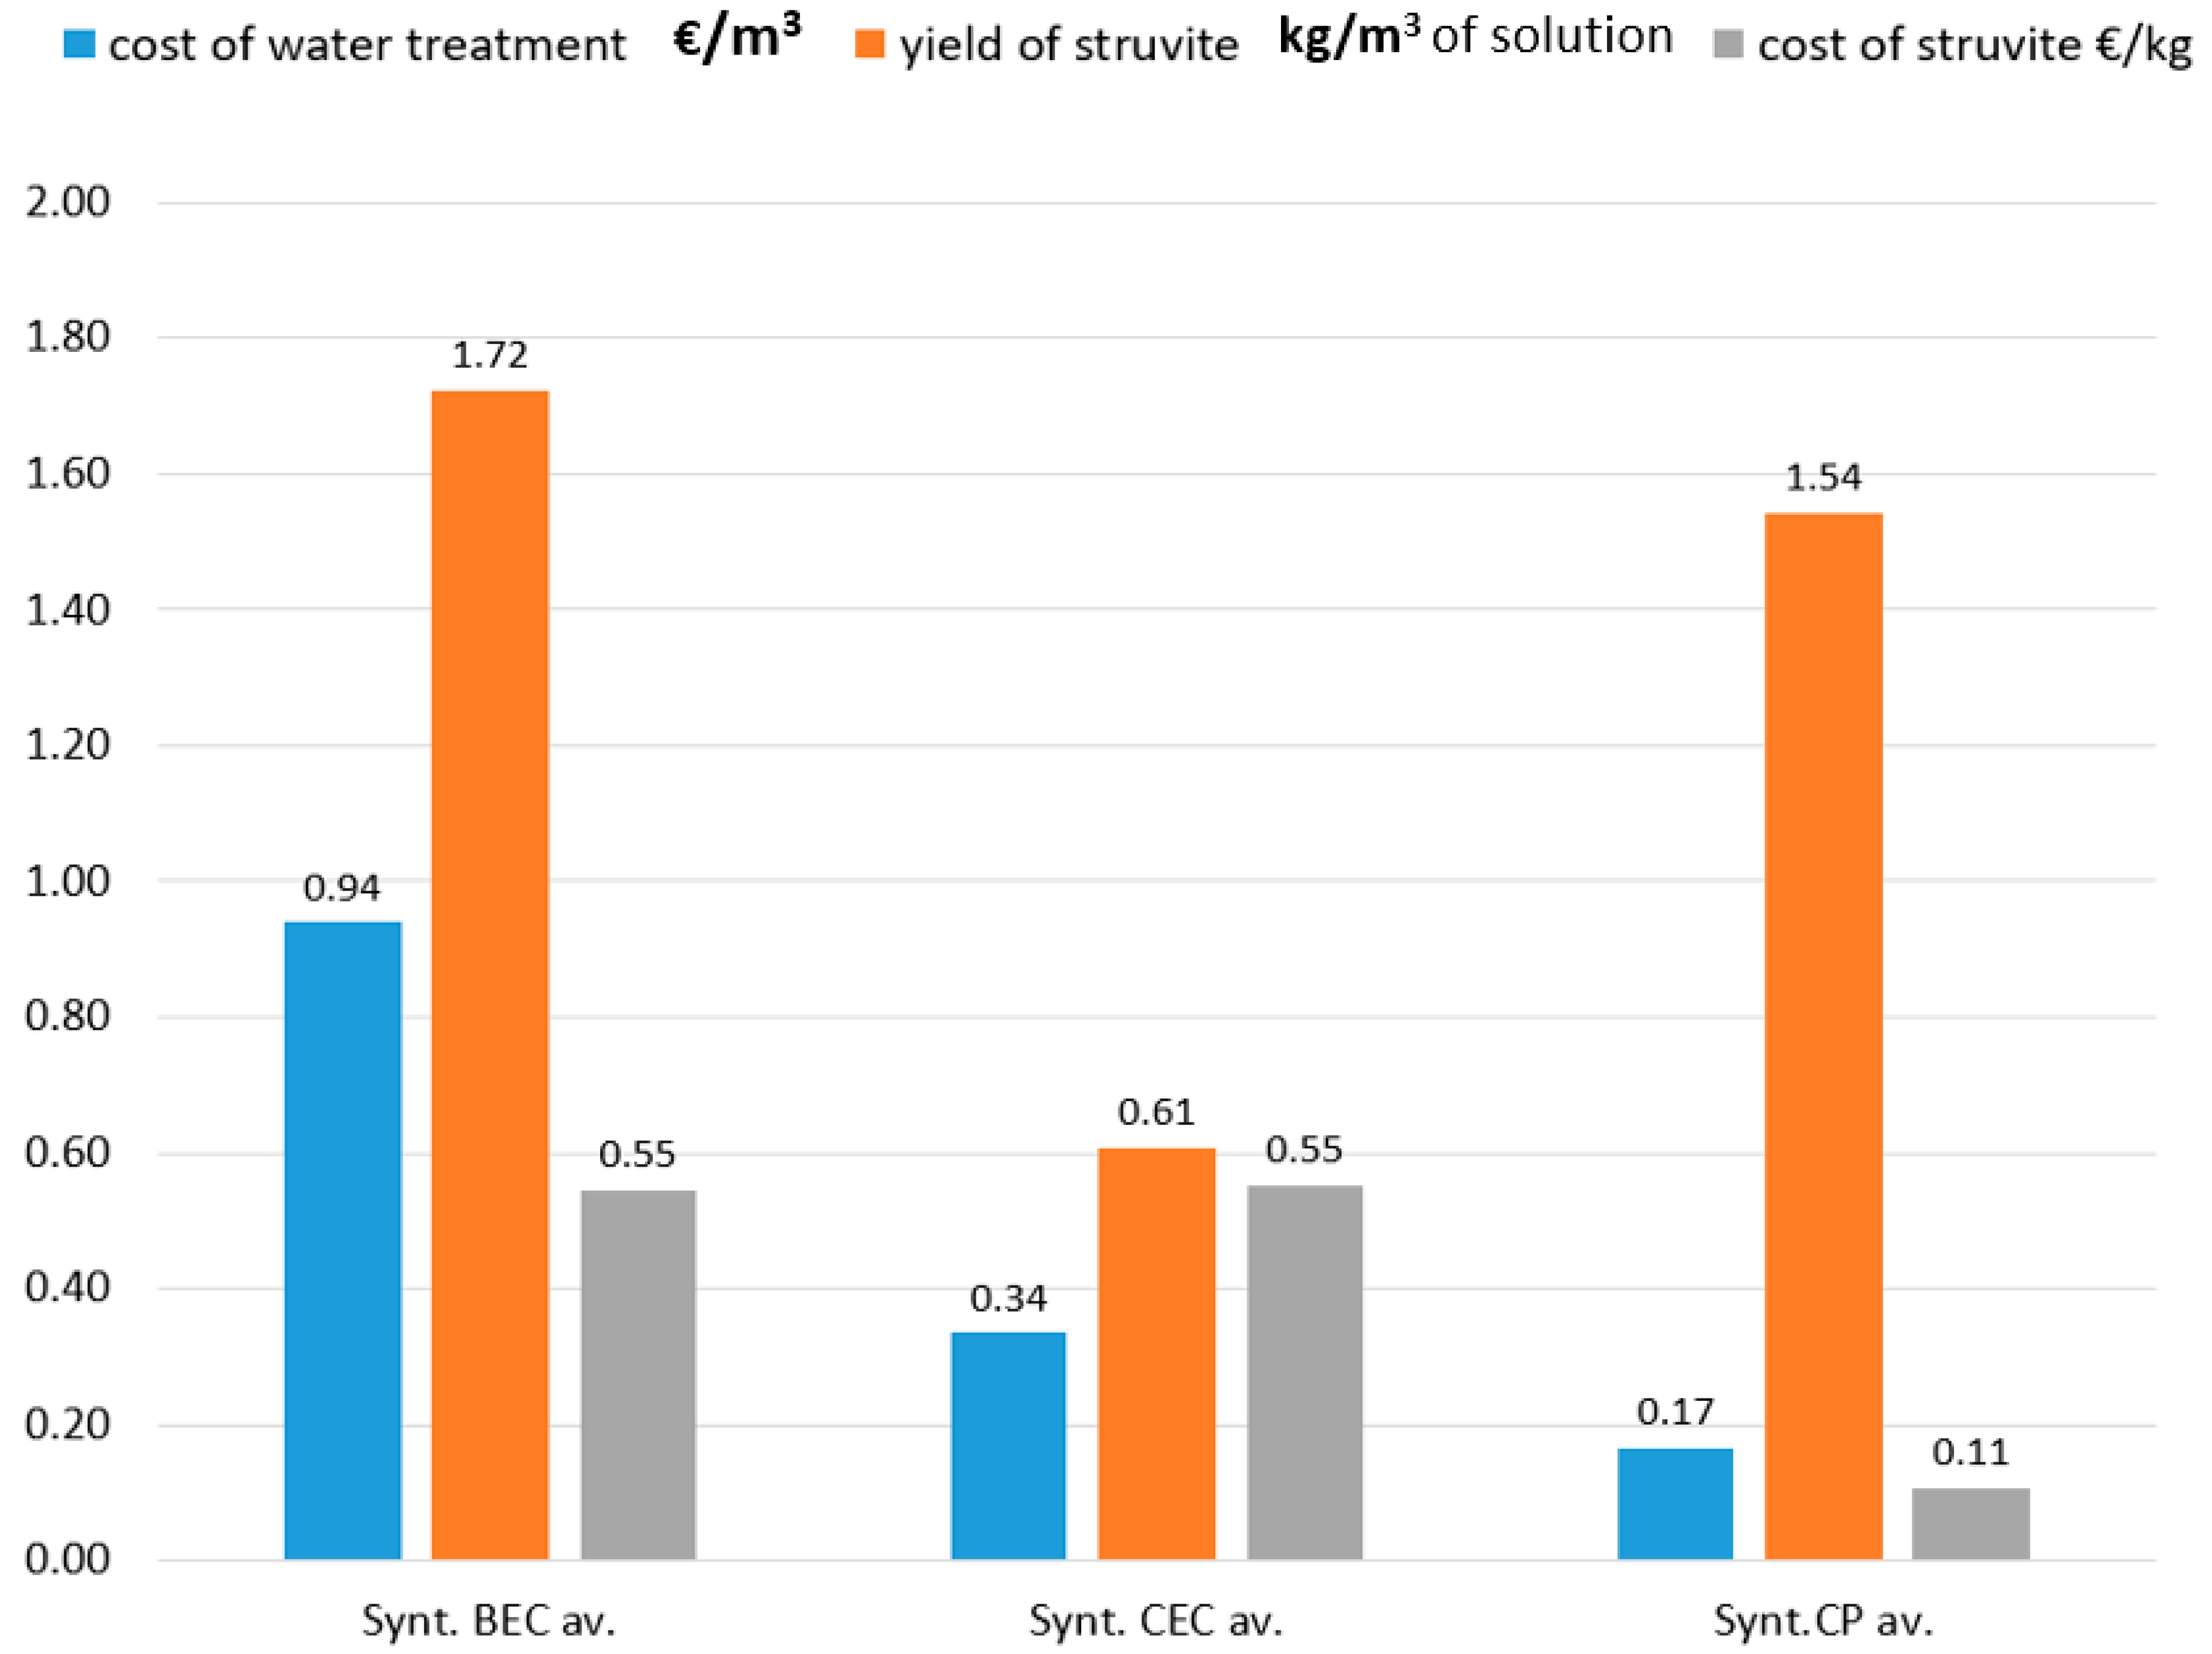
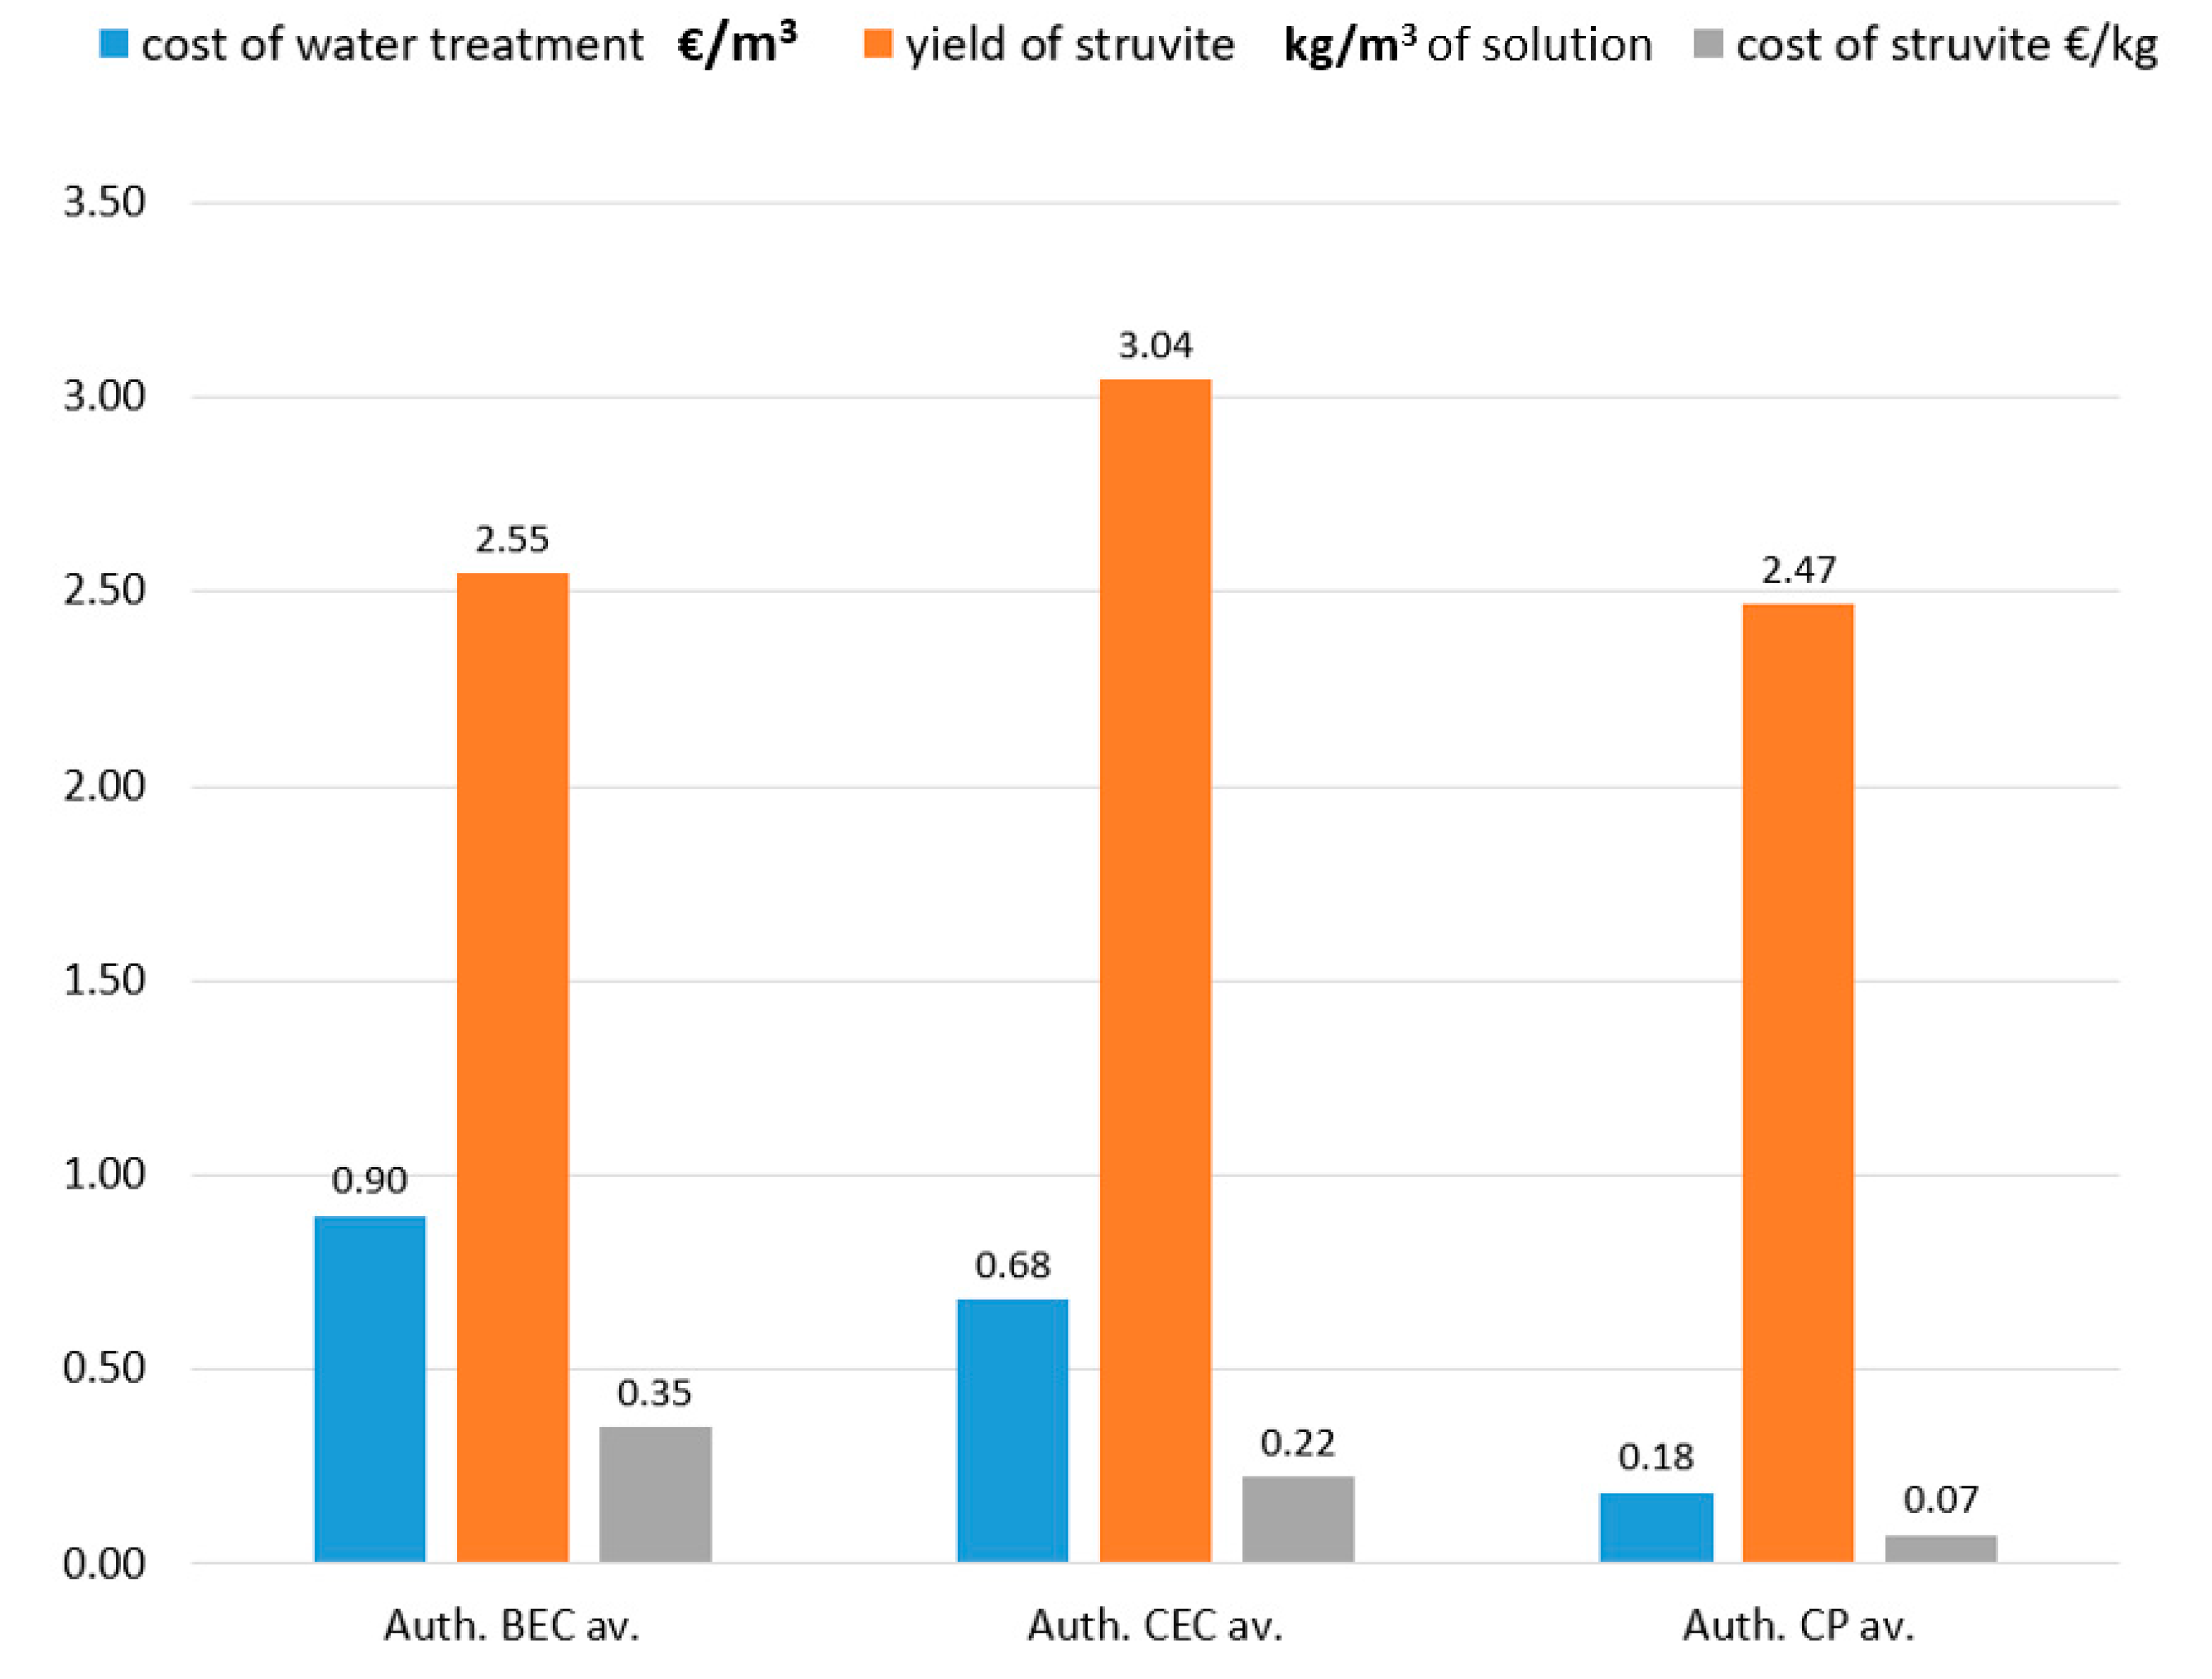
3.4. Economy Aspect of BEC, CEC, and CP

The average costs for the SWT are presented in Figure 7 and AWT in Figure 8 The OC in the BEC was 0.94 € per cubic meter of treated water (€/m3), whereas that in CEC was 0.34 €/m3. The CP was the most economical with an average OC of 0.17 €/m3. The struvite yield in BEC was 1.72 kg of struvite per one cubic meter of treated water (kg/m3), whereas the yields in CEC and CP were 0.61 and 1.54 kg/m3, respectively. The calculated costs of 1 kg of formed struvite were 0.55 €/kg in the BEC, 0.55 €/kg in the CEC, and 0.11 €/kg in the CP.
In the AWT, the OCs for the BEC, CEC, and CP were 0.9, 0.68, and 0.18 €/m3, respectively; the corresponding yields of struvite were 2.55, 3.04, and 2.47 kg/m3, and the corresponding calculated costs of 1 kg of formed struvite were 0.35, 0.22, and 0.07 €/kg.
Hug and Udert [25] determined the costs of MgO and electrocoagulation per 1 kg of formed struvite. Similar to the findings of them, the current results showed that the cost (€) per kilogram of formed struvite was lower in the CP than in the electrocoagulation processes. Moreover, the costs in the CEC and BEC systems were comparable. In the CEC system, a portion of the sludge was not collectible because of the design of the CEC equipment, whereas in the BEC and CP systems the entire sludge could be collected. This uncollected amount of sludge in the CEC might have increased the yield. The calculated electricity costs for BEC and CEC in the SWT accounts for 67% and 33%, respectively, of the total cost. The corresponding values in the AWT were 71% and 36%. These results indicated that the CEC is more energy-efficient than the BEC. In this study, the CEC was the most effective method of precipitating the highest amount of struvite from authentic wastewater. Overall, the CEC system is more economic than the BEC system in the precipitation of struvite and that makes CEC more usable for the struvite precipitation.

4. Conclusions

The BEC demonstrated a high phosphate removal rate (approximately 93.6% in the SWT and 89.7% in the AWT), whereas the CEC and CP demonstrated a removal rate of 74.5% and 71.6% in the SWT and 77.8% and 74.4% in the AWT, respectively. The corresponding removal rates for ammonium were 79.4%, 51.5%, and 62.5% in the SWT and 56.1%, 64.1%, and 60.9% in the AWT.
The electrochemical magnesium dosage is as effective as the chemical magnesium dosage for struvite formation to recover phosphate and ammonium from synthetic and authentic water.
The sludges contained a considerable amount of struvite (purity of 93% or higher according to the results of the Rietveld analysis). Struvite formation is heavily dependent on the pH area during struvite precipitation according to calculations and earlier studies.
The calculated costs per one kilogram of struvite in the electrocoagulation processes (0.54 €/kg in the BEC and 0.55 €/kg in the CEC) were comparable. The CP (0.11 €/kg) was most economical in the SWT. In the AWT, the costs in the BEC, CEC, and CP were 0.35, 0.22, and 0.07 €/kg, respectively. The electrical costs over total costs were approximately 70% in the BEC and approximately 35% in the CEC, indicating that the CEC is more energy-efficient than the BEC.
The CEC is as efficient as the BEC in terms of precipitating struvite; however, this study did not cover all the possible variables that may affect these processes.

Author Contributions

Conceptualization, K.R.; methodology, K.R., E.-T.N., and S.T.; software, E.-T.N., T.H., and K.R.; investigation, K.R.; data curation, K.R.; writing—original draft preparation, K.R.; writing—review and editing, all authors; visualization, K.R. and T.H.; supervision, S.T. and U.L.; project administration, U.L.; funding acquisition, K.R. and U.L. All authors have read and agreed to the published version of the manuscript.

Funding

Kyösti Rajaniemi acknowledges the funding support extended by Erkki Paasikivi Foundation, Kerttu Saalasti Foundation, Maa- ja Vesitekniikan tuki ry and Tauno Tönning Foundation. This work was conducted under the auspices of the Waterpro (ERDF project number: A74635, funded by the European Union, European Regional Development Fund, Leverage from the EU Central and Ostrobothnia Regional Council) and the project “Reaching congenial region through valorization of municipal and industrial wastewaters and sludge” (Waste Recycling, KA4020) funded by the Karelia CBC Program.

Institutional Review Board Statement

Not applicable.

Informed Consent Statement

Not applicable.

Data Availability Statement

The data presented in this study are available within the article (tables and figures).

Conflicts of Interest

The authors declare no conflict of interest.

References

  1. WHO; UNICEF. Progress on Drinking Water, Sanitation and Hygiene: 2017 Update and SDG Baselines; United Nations Children’s Fund (UNICEF): New York, NY, USA; World Health Organization (WHO): Geneva, Switzerland, 2017. [Google Scholar]
  2. UN GENERAL ASSEMBLY. Resolution on the Human Right to Water and Sanitation, A/RES/64/292. 2010. Available online: https://undocs.org/A/RES/64/292 (accessed on 19 April 2020).
  3. FAO. World Fertilizer Trends and Outlook to 2022; FAO: Rome, Italy, 2019. [Google Scholar]
  4. Mekonnen, M.M.; Hoekstra, A.Y. Global Anthropogenic Phosphorus Loads to Freshwater and Associated Grey Water Footprints and Water Pollution Levels: A High-Resolution Global Study. Water Resour. Res. 2018, 54, 345–358. [Google Scholar] [CrossRef] [Green Version]
  5. Talboys, P.J.; Heppell, J.; Roose, T.; Healey, J.R.; Jones, D.L.; Withers, P.J.A. Struvite: A slow-release fertiliser for sustainable phosphorus management? Plant Soil 2016, 401, 109–123. [Google Scholar] [CrossRef] [PubMed] [Green Version]
  6. Yuan, Z.; Jiang, S.; Sheng, H.; Liu, X.; Hua, H.; Liu, X.; Zhang, Y. Human Perturbation of the Global Phosphorus Cycle: Changes and Consequences. Environ. Sci. Technol. 2018, 52, 2438–2450. [Google Scholar] [CrossRef]
  7. Fowler, D.; Coyle, M.; Vitousek, P.; Leach, A.; Bouwman, A.F.; Butterbach-Bahl, K.; Dentener, F.; Stevenson, D.; Amann, M.; Voss, M.; et al. The global nitrogen cycle in the twenty-first century. Philos. Trans. R. Soc. B Biol. Sci. 2013, 368, 20130164. [Google Scholar] [CrossRef]
  8. Scholz, R.W.; Ulrich, A.E.; Eilittä, M.; Roy, A. Sustainable use of phosphorus: A finite resource. Sci. Total Environ. 2013, 461–462, 799–803. [Google Scholar] [CrossRef]
  9. Erisman, J.W.; Galloway, J.; Seitzinger, S.; Bleeker, A.; Butterbach-Bahl, K. Reactive nitrogen in the environment and its effect on climate change. Curr. Opin. Environ. Sustain. 2011, 3, 281–290. [Google Scholar] [CrossRef] [Green Version]
  10. Sutton, M.A.; Oenema, O.; Erisman, J.W.; Leip, A.; Van Grinsven, H.; Winiwarter, W. Too much of a good thing. Nature 2011, 472, 159–161. [Google Scholar] [CrossRef] [Green Version]
  11. UNEP AND WHRC. Reactive Nitrogen in the Environment: Too Much or too Little of a Good Thing; United Nations Environment Programme: Paris, France, 2007; ISBN 978 92 807 2783 8. [Google Scholar]
  12. Bolan, N.; Wong, L.; Adriano, D. Nutrient removal from farm effluents. Bioresour. Technol. 2004, 94, 251–260. [Google Scholar] [CrossRef]
  13. Yin, H.; Kong, M. Simultaneous removal of ammonium and phosphate from eutrophic waters using natural calcium-rich attapulgite-based versatile adsorbent. Desalination 2014, 351, 128–137. [Google Scholar] [CrossRef]
  14. Burgos-Castillo, R.; Sillanpää, M.; Brillas, E.; Sirés, I. Removal of metals and phosphorus recovery from urban anaerobically digested sludge by electro-Fenton treatment. Sci. Total. Environ. 2018, 644, 173–182. [Google Scholar] [CrossRef]
  15. Kilpimaa, S.; Runtti, H.; Kangas, T.; Lassi, U.; Kuokkanen, T. Physical activation of carbon residue from biomass gasification: Novel sorbent for the removal of phosphates and nitrates from aqueous solution. J. Ind. Eng. Chem. 2015, 21, 1354–1364. [Google Scholar] [CrossRef]
  16. Kuokkanen, V.; Rämö, J.; Lassi, U.; Kuokkanen, T. Electrocoagulation treatment of peat bog drainage water containing humic substances. Water Res. 2015, 79, 79–87. [Google Scholar] [CrossRef] [PubMed]
  17. Kuokkanen, V.; Kuokkanen, T.; Ramo, J.; Lassi, U.; Roininen, J. Removal of phosphate from wastewaters for further utilization using electrocoagulation with hybrid electrodes—Techno-economic studies. J. Water Process. Eng. 2015, 8, e50–e57. [Google Scholar] [CrossRef]
  18. Ghimire, U.; Jang, M.; Jung, S.P.; Park, D.; Park, S.J.; Yu, H.; Oh, S.-E. Electrochemical Removal of Ammonium Nitrogen and COD of Domestic Wastewater using Platinum Coated Titanium as an Anode Electrode. Energies 2019, 12, 883. [Google Scholar] [CrossRef] [Green Version]
  19. Huang, H.; Zhang, P.; Zhang, Z.; Liu, J.; Xiao, J.; Gao, F. Simultaneous removal of ammonia nitrogen and recovery of phosphate from swine wastewater by struvite electrochemical precipitation and recycling technology. J. Clean. Prod. 2016, 127, 302–310. [Google Scholar] [CrossRef]
  20. Kruk, D.J.; Elektorowicz, M.; Oleszkiewicz, J.A. Struvite precipitation and phosphorus removal using magnesium sacrificial anode. Chemosphere 2014, 101, 28–33. [Google Scholar] [CrossRef]
  21. Mohammadi, A.; Khadir, A.; A. Tehrani, R.M. Optimization of nitrogen removal from an anaerobic digester effluent by electrocoagulation process. J. Environ. Chem. Eng. 2019, 7. [Google Scholar] [CrossRef]
  22. Rahman, M.; Salleh, M.A.M.; Rashid, U.; Ahsan, A.; Hossain, M.M.; Ra, C.S. Production of slow release crystal fertilizer from wastewaters through struvite crystallization—A review. Arab. J. Chem. 2014, 7, 139–155. [Google Scholar] [CrossRef] [Green Version]
  23. Song, G.; Atrens, A.; John, D.; Wu, X.; Nairn, J. The anodic dissolution of magnesium in chloride and sulphate solutions. Corros. Sci. 1997, 39, 1981–2004. [Google Scholar] [CrossRef]
  24. Bektaş, N. Removal of phosphate from aqueous solutions by electro-coagulation. J. Hazard. Mater. 2004, 106, 101–105. [Google Scholar] [CrossRef]
  25. Hug, A.; Udert, K.M. Struvite precipitation from urine with electrochemical magnesium dosage. Water Res. 2013, 47, 289–299. [Google Scholar] [CrossRef] [PubMed]
  26. Wang, F.; Fu, R.; Lv, H.; Zhu, G.; Lu, B.; Zhou, Z.; Wu, X.; Chen, H. Phosphate Recovery from Swine Wastewater by a Struvite Precipitation Electrolyzer. Sci. Rep. 2019, 9, 8893. [Google Scholar] [CrossRef] [PubMed] [Green Version]
  27. Doyle, J.D.; Parsons, S.A. Struvite formation, control and recovery. Water Res. 2002, 36, 3925–3940. [Google Scholar] [CrossRef]
  28. Rajaniemi, K.; Metsävainio, V.-P.; Kuokkanen, V. Apparatus and Method for Treatment of Various Types of Water and Wastewater Based on Electrocoagulation. Patent FI 127889 2016. [Google Scholar]
  29. Taylor, A.W.; Frazier, A.W.; Gurney, E.L. Solubility products of magnesium ammonium and magnesium potassium phos-phates. Trans. Faraday Soc. 1963, 59, 1580–1584. [Google Scholar] [CrossRef]
  30. Rajaniemi, K.; Raulio, M.; Tuomikoski, S.; Lassi, U. Comparison of batch and novel continuous electrocoagulation processes in the treatment of paint industry wash water. DESALINATION Water Treat. 2019, 170, 394–404. [Google Scholar] [CrossRef] [Green Version]
Figure 1. Reactor set-up for (A) batch electrocoagulation (BEC) and (B) continuous electrocoagulation (CEC) experiments.
Processes 09 00150 g001
Figure 2. Phosphate speciation as a function of pH as determined by the MINEQL+ software.
Processes 09 00150 g002
Figure 3. XRD (X-ray diffraction) patterns for the sludges obtained from the synthetic water samples subjected to BEC, CEC, and CP (chemical precipitation) for struvite precipitation.
Processes 09 00150 g003
Figure 4. XRD patterns for the sludges obtained from the authentic water samples subjected to BEC, CEC, and CP for struvite precipitation.
Processes 09 00150 g004
Figure 5. Average phosphate and ammonium removal (%) by BEC, CEC, and CP in synthetic water treatment. BEC av., Batch electrocoagulation average value; CEC av., continuous electrocoagulation average value; CP av., chemical precipitation average value.
Processes 09 00150 g005
Figure 6. Average phosphate and ammonium removal rates of the BEC, CEC, and CP in authentic water treatment. BEC av., batch electrocoagulation average value; CEC av., continuous electrocoagulation average value; and CP av., chemical precipitation average value.
Processes 09 00150 g006
Figure 7. Average operational cost, struvite yield, and cost of 1 kg of struvite in the BEC, CEC, and CP in the SWT. BEC av., batch electrocoagulation average value; CEC av., continuous electrocoagulation average value; and CP av., chemical precipitation average value.
Processes 09 00150 g007
Figure 8. Average operational cost, struvite yield, and cost of 1 kg of struvite in the AWT. BEC av., batch electrocoagulation average value, CEC av., continuous electrocoagulation average value; and CP av., chemical precipitation average value.
Processes 09 00150 g008
Publisher’s Note: MDPI stays neutral with regard to jurisdictional claims in published maps and institutional affiliations.

