Article

Biodegradation Kinetic Studies of Phenol and p-Cresol in a Batch and Continuous Stirred-Tank Bioreactor with Pseudomonas putida ATCC 17484 Cells

Department of Safety, Health and Environmental Engineering, Central Taiwan University of Science and Technology, 666, Bu-zih Road, Bei-tun District, Taichung 406053, Taiwan
*
Author to whom correspondence should be addressed.
Processes 2021, 9(1), 133; https://doi.org/10.3390/pr9010133
Submission received: 16 December 2020 / Revised: 5 January 2021 / Accepted: 6 January 2021 / Published: 9 January 2021

Abstract

:
The biodegradation of phenol, p-cresol, and phenol plus p-cresol mixtures was evaluated using Pseudomonas putida ATCC 17484 in aerobic batch reactors. Shake-flask experiments were performed separately using growth medium with initial nominal concentrations of phenol (50–600 mg L−1) and p-cresol (50–600 mg L−1) as well as phenol (50–600 mg L−1) plus p-cresol (50–600 mg L−1). The complete degradation of phenol and p-cresol was achieved within 48 h and 48–56 h, respectively, for all initial concentrations of phenol and p-cresol. The maximum cell growth rate using phenol (μmax,P = 0.45 h−1) was much faster than that using p-cresol (μmax,C = 0.185−1 h). The larger Ki value for phenol (310.5 mg L−1) revealed that the P. putida cells had a higher resistance to phenol inhibition compared with p-cresol (243.56 mg L−1). A mixture of phenol and p-cresol in batch experiments resulted in the complete removal of phenol within 52–56 h for initial phenol concentrations of 50–500 mg L−1. The time needed to remove p-cresol completely was 48–56 h for initial p-cresol concentrations of 50–500 mg L−1. In the continuous-flow immobilized cells reactor, the degradation efficiency for phenol and p-cresol was 97.6 and 89.1%, respectively, at a stable condition.

1. Introduction

Phenol and its derivatives are toxic organic components often found in various petroleum and chemical industries [1]. Phenol has been regarded as a toxic pollutant to aquatic living organisms imparted as low as concentrations of 0.005 mg L−1 [2]. There has been serious environmental concern due to the persistent toxicity of phenol and its derivatives [3]. Much industrial wastewater contains the major phenol and its derivatives such as phenol and cresols [4,5]. Thus, the removal of these phenolic contaminants to a satisfactorily low level in wastewater becomes an urgent task.
Conventional treatments to phenol and its derivatives including physical and chemical methods have major disadvantages such as the cost of operation, production of harmful metabolites, incomplete mineralization of the substances, and high cost involved in disposal of chemical waste sludge. In such cases, biological treatment processes seem promising for the complete mineralization of phenol and its derivatives to carbon dioxide and water with innocuous residues [6]. However, the growth of microorganisms suffers from the inhibition of phenol and its derivatives at higher concentration levels. In order to overcome the inhibition of phenol and its derivatives, the cell acclimation [7], the application of genetically engineered microorganisms [8], and cell immobilization [9,10] have been recommended. Increasing phenol concentrations successively to cultivate phenol-degrading bacteria usually requires long lag times. Masque et al. [7] demonstrated that the degradation of phenol with 1000 mg L−1 needed to take 20 days. The use of genetically engineered microorganisms gives the potential for an unanticipated ecological influence and causes controversy in the application of bioremediation. Thus, cell immobilization gains a better alternative to protect cells from the toxicity of phenol and its derivatives.
Biological treatment processes such as activated sludge system, biofilm process, biological contact oxidation, biofilter process, etc. are always environmentally friendly, highly effective, and economic [11]. In those biological systems, Pseudomonas putida as a rod-shaped Gram-negative bacterium has been proved to be effective in removing phenol and its derivatives [12]. A pure culture of P. putida ATCC 17484 with high removal efficiency for phenol and p-cresol biodegradation in a batch system has been demonstrated [13,14]. González et al. [13] used stirred tank and fluidized-bed bioreactors to degrade phenol through immobilized cells of P. putida ATCC 17484. Their experimental results revealed that both bioreactors achieved phenol biodegradation efficiencies higher than 90% even a phenol loading rate in the influent as high as 4 g L−1 d−1. Loh and Ranganath [15] carried out an external-loop fluidized bed airlift bioreactor (EFBAB) by using P. putida ATCC 49451 for the cometabolic biotransformation of 4-chlorophenol (4-CP) in the presence of phenol. Their study found that phenol and 4-CP with feed concentrations of 1600 and 200 mg L−1 had been successfully degraded in EFBAB process. The bacterial strain isolated from the contaminated sites by coke-oven effluent was identified as P. putida that showed a high capacity in degrading phenol concentration up to 1800 mg L−1 and tolerating cyanide up to 340 mg L−1 [16].
The biodegradation of toxic substances using entrapped cells has been utilized since 1975 [9]. The immobilized cells have their potential advantages over free cells for the enhancement of biodegradation efficiency in terms of cell reuse and recovery [17]. The bio-polymeric gel beads used to entrap microbial cells are well-established approaches for cell immobilization [18]. Banerjee et al. [1] successfully presented phenol biodegradation kinetics by immobilized cells in a batch system. However, the kinetic model system based on the simultaneous biodegradation kinetics of phenol and p-cresol in a continuous stirred-tank bioreactor with immobilized cells has never been reported.
The knowledge of dual-substrates biodegradation kinetics by immobilized cells is helpful for the design of process facilities for the simultaneous removal of multiple substrates in wastewater. In this study, P. putida ATCC 17484 was entrapped in Ca-alginate gel beads using immobilization methods to evaluate the phenol and p-cresol biodegradation kinetics simultaneously. Moreover, the immobilized kinetic model system to describe the simultaneous biodegradation kinetics of phenol and p-cresol was developed. The goal of this work was to develop the kinetic model system to describe the biodegradation kinetics of phenol and p-cresol simultaneously. The main purposes of this study were to (1) evaluate phenol and p-cresol degradation by free P. putida cells, respectively; (2) estimate the growth yield and maximum specific growth rate of P. putida cells in batch experiments; (3) determine interaction parameters by a sum kinetic equation fitted by experimental data; (4) develop the kinetic model in the immobilized cells system in the continuous stirred bioreactor; (5) conduct continuous-flow experiments to investigate the synchronous biodegradation of phenol and p-cresol by alginate-immobilized P. putida cells; and (6) compare the experimental data and model prediction for the synchronous biodegradation of phenol and p-cresol by alginate-immobilized cells in a continuous stirred-tank bioreactor.

2. Kinetic Model Development

2.1. Growth Kinetics of Free Cells Batch System

The specific growth rate of cells μ (h−1) obtained from the exponential phase in the batch experiment is expressed as [19,20]
μ = ln ( X t / X 0 ) t t 0
where Xt and X0 are the cell concentration at time t and t0. The value of μ was determined from the slope of a linear plot of ln(Xt/X0) versus time (t) in the log-growth phase of the curve.
P. putida cells used phenol or p-cresol as a sole carbon source, respectively, in a batch culture system. Phenol or p-cresol as a substrate displayed an inhibition to cell growth at much higher initial concentrations of phenol or p-cresol. Haldane kinetics used to model the cell growth using phenol or p-cresol as a substrate, respectively, was represented by the following equation:
μ = μ max · S K s + S + S 2 / K i
where µ is the specific growth rate (h−1), µmax is the maximum specific growth rate (h−1), Ks is the half-saturated constant of substrate (mg L−1), and Ki is the inhibition constant (mg L−1).
The experimental data on the substrate degradation at various combinations of initial concentrations of phenol and p-cresol were utilized for determining the growth yield of P. putida cells according to the following equations [21]:
Y = X X 0 S 0 S
where Y is the growth yield of cells, X and X0 are the cell concentration and initial cell concentration (mg L−1), respectively, and S and S0 are the substrate concentration and initial substrate concentration (mg L−1), respectively.
Yoon et al. [22] proposed the sum kinetic model to evaluate the interaction parameters (IC,P and IP,C) based on the individual specific growth rate.
μ = μ max , P S P K s , P + S P + S P 2 / K i , P + I C , P S C + μ max , C S C K s , C + S C + S C 2 / K i , C + I P , C S P
where P and C indicate phenol and p-cresol, respectively. IC,P indicates the degree to which p-cresol affects the biodegradation of phenol and vice versa. The higher parameter value makes a stronger inhibition on the cells growth [22]. The other bio-kinetic parameters µmax, Ks, and Ki are the same as those obtained from Equation (2) in a single substrate batch system.

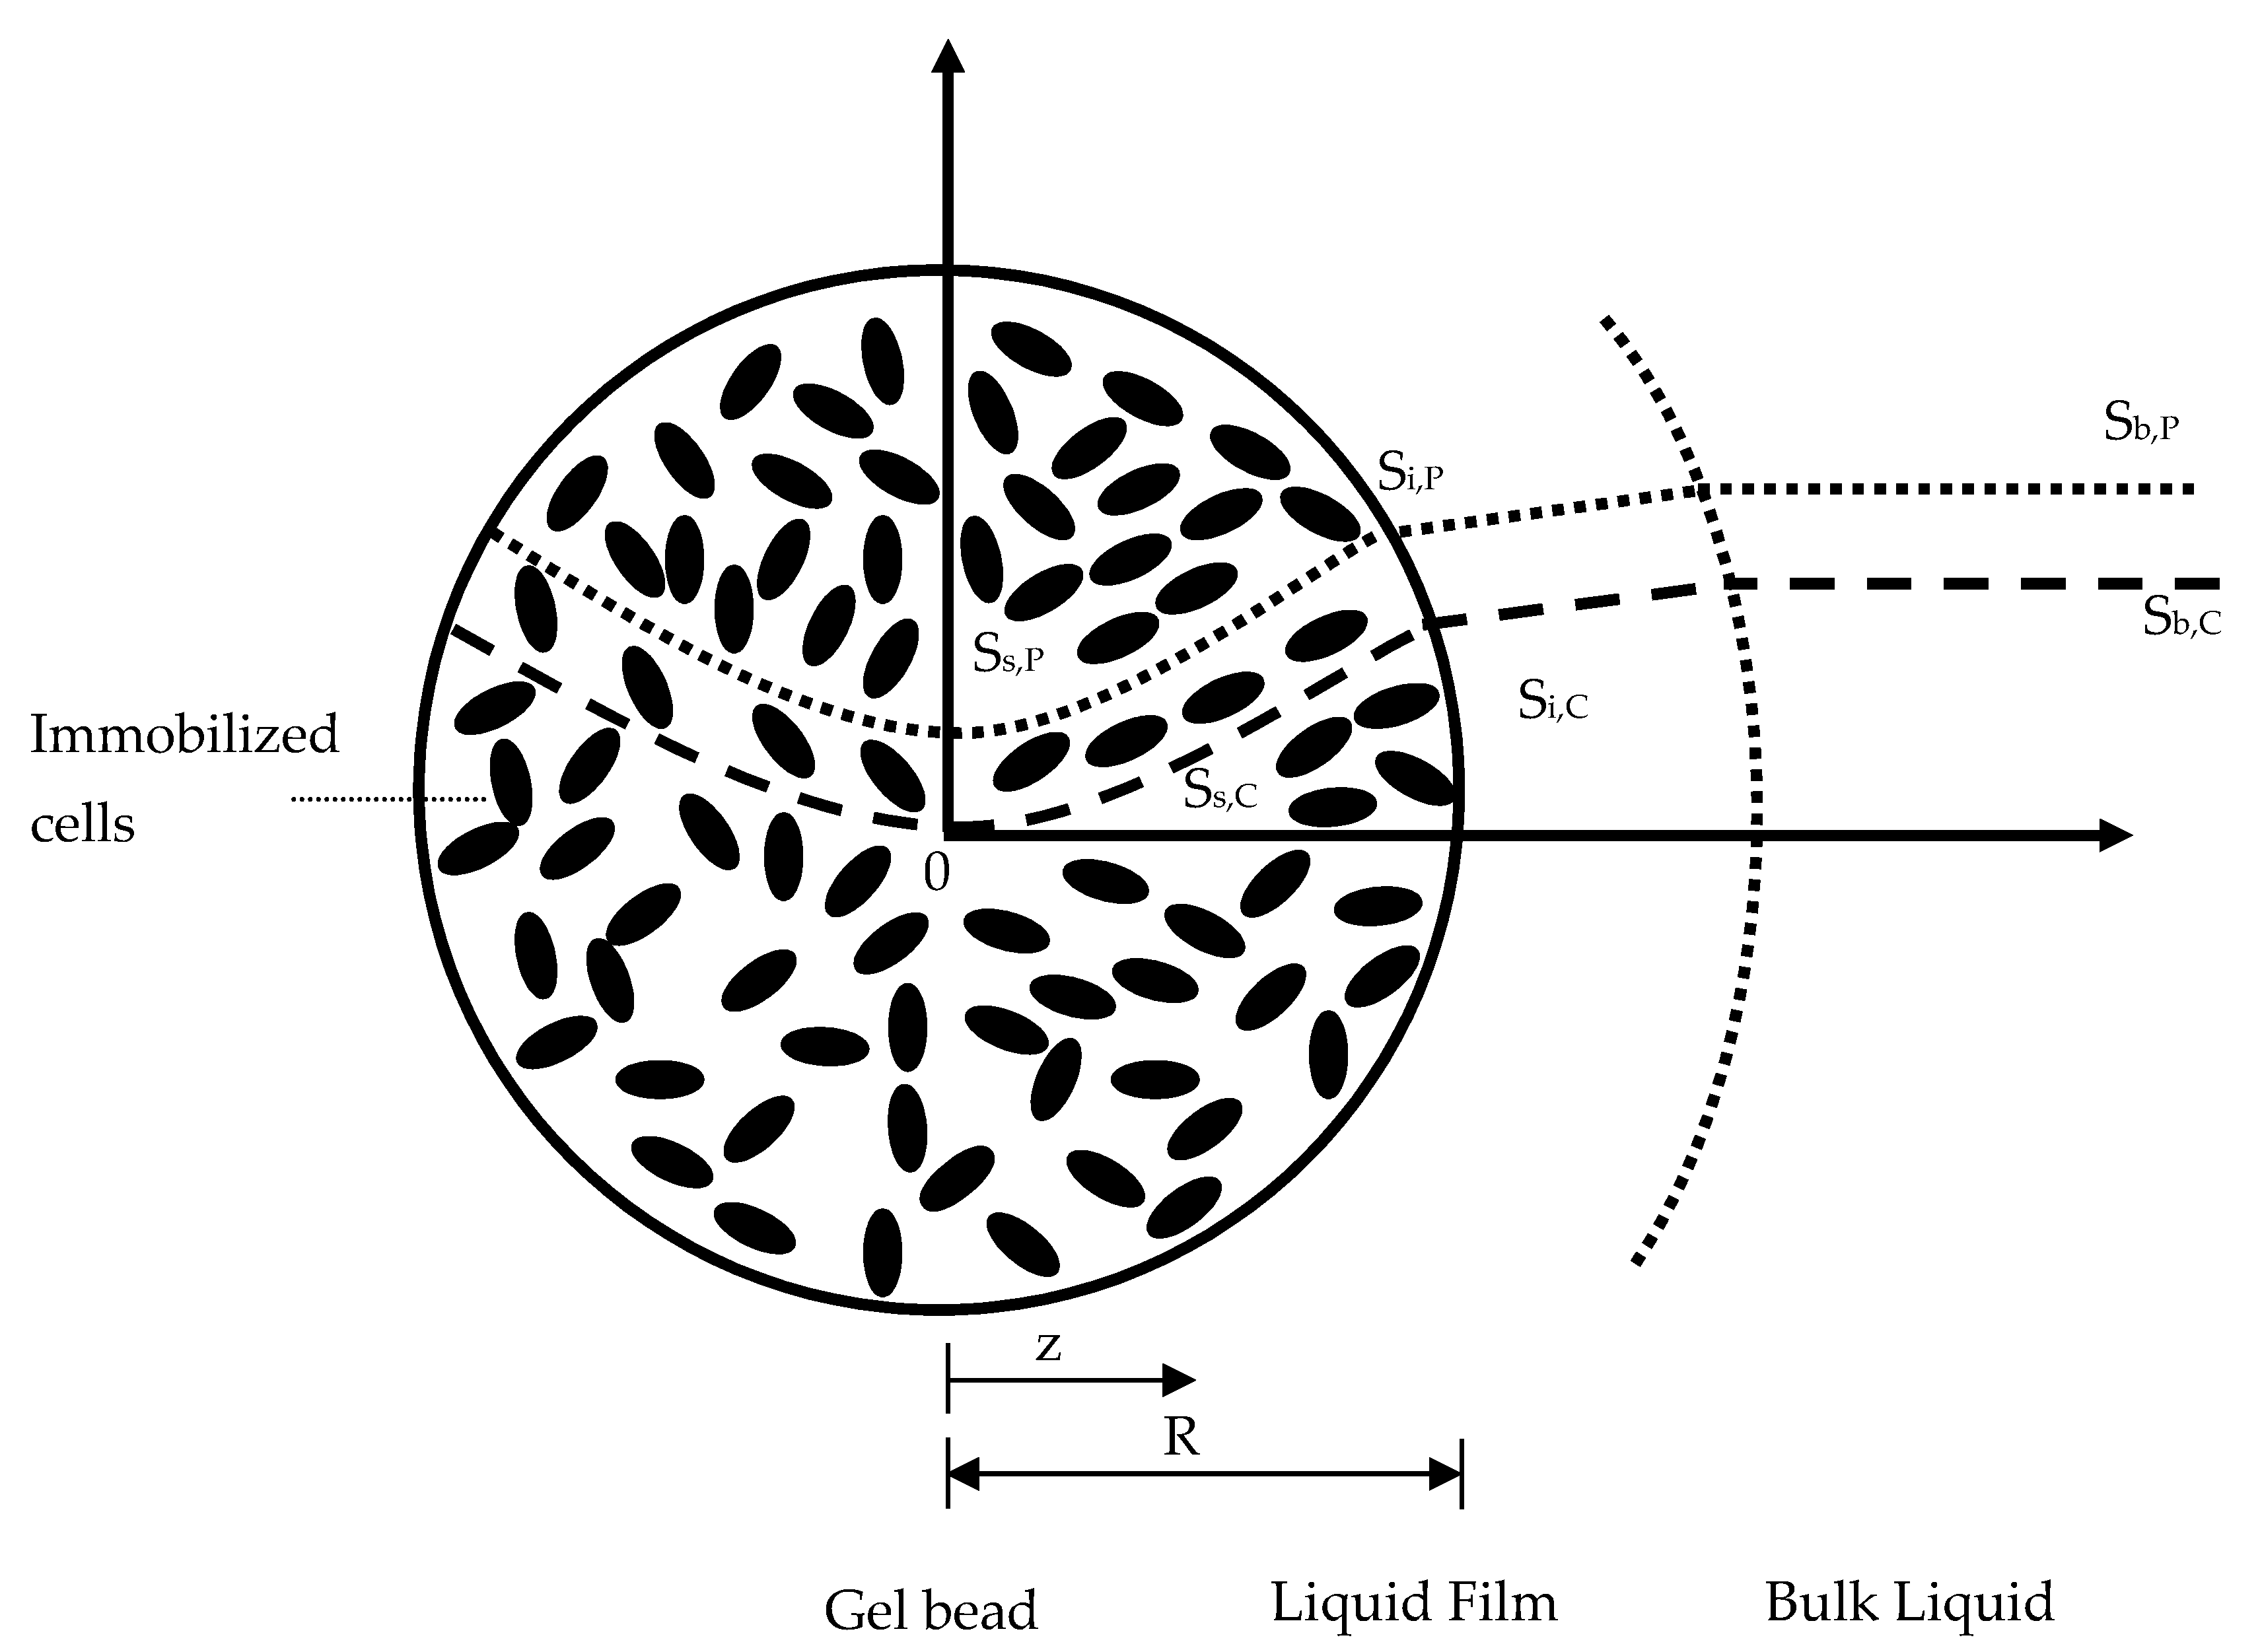
2.2. Conceptual Basis of Immobilized Cells in the Continuous Stirred-Tank Bioreactor

Figure 1 presents the phenol and p-cresol concentration profiles in the bulk liquid, liquid film, and gel bead in the completely-mixed and continuous-flow bioreactors. In the bulk liquid, the phenol and p-cresol concentration profiles are flat lines due to a completely-mixed condition occurred in this phase. Then, the phenol and p-cresol pass through the liquid film and diffuse into the gel bead to constitute the curved profiles of concentration in the gel bead.

2.3. Kinetic Model of the Entrapped Cell in the Continuous Stirred-Tank Bioreactor

The phenol and p-cresol in the bulk liquid diffused into gel beads through the liquid film and were biodegraded by immobilized cells. Diffusion and biodegradation are two fundamental mechanisms occurred simultaneously in this phenomena. According to Fick’s law and Haldane’s kinetics, the utilization rates of phenol and p-cresol in the gel bead with an unsteady-state condition were given as [1,23]:
S s , P t = D e P ( 2 S s , P z 2 + 2 z S s , P z ) μ max , P S P X s Y P ( K s , P + S P + S P 2 / K i , P + I C , P S C )
S s , C t = D e C ( 2 S s , C z 2 + 2 z S s , C z ) μ max , C S C X s Y C ( K s , C + S C + S C 2 / K i , C + I P , C S P )
where Ss,P and Ss,C are the phenol and p-cresol concentrations within the gel bead (mg L−1), DeP and DeC are the effective diffusivity of phenol and p-cresol, respectively, within the porous matrix (cm2 d−1), μmax,P and μmaxC are the maximum specific growth rate of cells on phenol and p-cresol (h−1), respectively, YP and YC are the growth yield of cells on phenol and p-cresol (mg mg−1), respectively, Ks,P and Ks,C are half-saturated constants of phenol and p-cresol (mg L−1), respectively, Ki,P and Ki,C are inhibition constants of phenol and p-cresol (mg L−1), respectively, IC,P and IP,C represent the effect of p-cresol on phenol biodegradation and the effect of phenol on p-cresol biodegradation, respectively, and z is the radial distance within the bead. The fluxes of phenol and p-cresol diffused into the film/bead interface are equivalent to the fluxes diffused out the film/bead interface. The boundary conditions for phenol and p-cresol concentration profiles at the bead center and film/bead interface were described as the following equations:
BC 1 :   S s , P z = 0 ,   z = 0
BC 1 :   S s , C z = 0 ,   z = 0
BC 2 :   D e P S s , P z = k f P ( S b , P S i , P ) ,   z = R
BC 2 :   D e C S s , P z = k f C ( S b , C S i , C ) ,   z = R .
The initial conditions for phenol and p-cresol utilization rates in Equations (6) and (7) were expressed by
IC 1 :   S s , P = 0 ,   0 z R , t = 0
IC 2 :   S s , C = 0 ,   0 z R , t = 0 .
The growth of P. putida cells in the bead was written by the following equation:
X s t = μ X s .
The initial condition for the growth of cells in the bead can be represented by
IC :   X s = X 0 ,   t = 0
where X0 is the initial condition of cells in the bead.
The mass balance of phenol and p-cresol in the bulk liquid phase and initial conditions for phenol and p-cresol were given by:
d S b , P d t = Q V ε ( S b 0 , P S b , P ) k f P ( S b , P S s , P ) 3 X w V ε ρ b R ,   z = R
d S b , C d t = Q V ε ( S b 0 . C S b , C ) k f C ( S b , C S s , C ) 3 X w V ε ρ b R ,   z = R
IC 1 :   S b , P = S b 0 , P
IC 2 :   S b , C = S b 0 , C .
In the above equations, Sb,P and Sb,C are the concentration of phenol and p-cresol in the bulk liquid (mg L−1), respectively, Sb0,P and Sb0,C are the concentrations of phenol and p-cresol in the feed (mg L−1), kfP and kfC are the external mass transfer coefficients of phenol and p-cresol (mg L−1), Ss,P and Ss,C are the concentrations of phenol and p-cresol at the liquid/bead interface (mg L−1), Q is the influent flow rate (cm3 d−1), V is the working volume of the reactor (cm3), ε is the porosity of the reactor, Xw is the weight of beads (g), ρb is the density of the gel beads (g/cm3), and R is the radius of gel beads (cm).

3. Materials and Methods

3.1. Chemicals

Phenol and p-cresol (>99% purity) purchased from Merck, KGaA, Darmstadt, Germany were of analytical grade in this study. One g of phenol and p-cresol, respectively, were dissolved in 1.0 L distilled/deionized water (DIDW) to form the stock solutions. The desired concentration containing phenol or p-cresol or phenol plus p-cresol was prepared by using stock solutions. All stock solutions are stored at 4 °C prior to use.

3.2. Cell Cultivation for Immobilization

Pure culture of P. putida ATCC 17484 with high removal efficiency for phenol and p-cresol biodegradation has been demonstrated [14,24,25]. P. putida ATCC 17484 grown in mineral salt medium (MSM) [2,26] with 20 mg L−1 of phenol as the carbon source was incubated and collected at the stationary phase. Then, the cells were centrifuged at 3000 rpm for 10 min. The phosphate buffer saline with pH 7.4 was used for washing cells. Then, the washed cells were used as inoculum for biodegradation. The flasks contained 100 mL MSM with varying initial concentrations of phenol, p-cresol, and phenol plus p-cresol, respectively, from 50 to 600 mg L−1 were prepared to conduct the batch experiments. The MSM was auto-claved at 121 °C for 15 min, and phenol as well as p-cresol were sterilized by a membrane filter.

3.3. Entrapment of Cells in Ca-Alginate

Ten mL of centrifuged P. putida cells were mixed with 50 mL of sodium alginate of 2% (w/v) to form the cell–alginate mixture [1]. Then, the cell–alginate mixture was dropped into CaCl2 of 1% (w/v) to form gel beads with a diameter of 3 mm. The phosphate buffer saline (PBS) was used to wash gel beads three times. Then, the gel beads were immersed in 3 g/L CaCl2 and stored at 4 °C for overnight to strengthen the gel formation [11].

3.4. Batch Experiments

The varying initial concentration (50–600 mg L−1) of phenol, p-cresol, and phenol plus p-cresol with 200 mL MSM was conducted in batch mode, respectively. The bio-kinetic parameters were estimated from those batch tests. The flasks were placed in the rotary incubator at 30 °C and 150 rpm to observe the biodegradation of phenol, p-cresol, and phenol plus p-cresol. Samples were taken from the flasks with a different time interval to measure the concentrations of cells, phenol, and p-cresol.

3.5. Analysis of P. putida Cells, Phenol and p-Cresol

The optical density (OD) at 600 nm wavelength was used to represent the cell concentration using a UV/vis spectrophotometer. Based on the calibration curve, the linear relationship between cells concentration (X) and OD600 was X (mg cell L−1) = 343.75 × OD600. High-Performance Liquid Chromatograph (HPLC) (Alliance 2695, Waters Corp., Milford, MA, USA) equipped with a UV/vis detector (Waters 2487, Waters Corp., Milford, MA, USA) with an auto-sampler (Waters 2707, Waters Corp., Milford, MA, USA) was setup to analyze the samples. A C18 column with a 150 × 3.9 mm size and packed with 5 µm particle size was applied to analyze the residual phenol and p-cresol concentrations. The wavelength was set at 254 nm in the UV/vis detector. The mobile phase containing potassium phosphate and acetonitrile with a volume ratio of 70/30 was used to elute the samples.

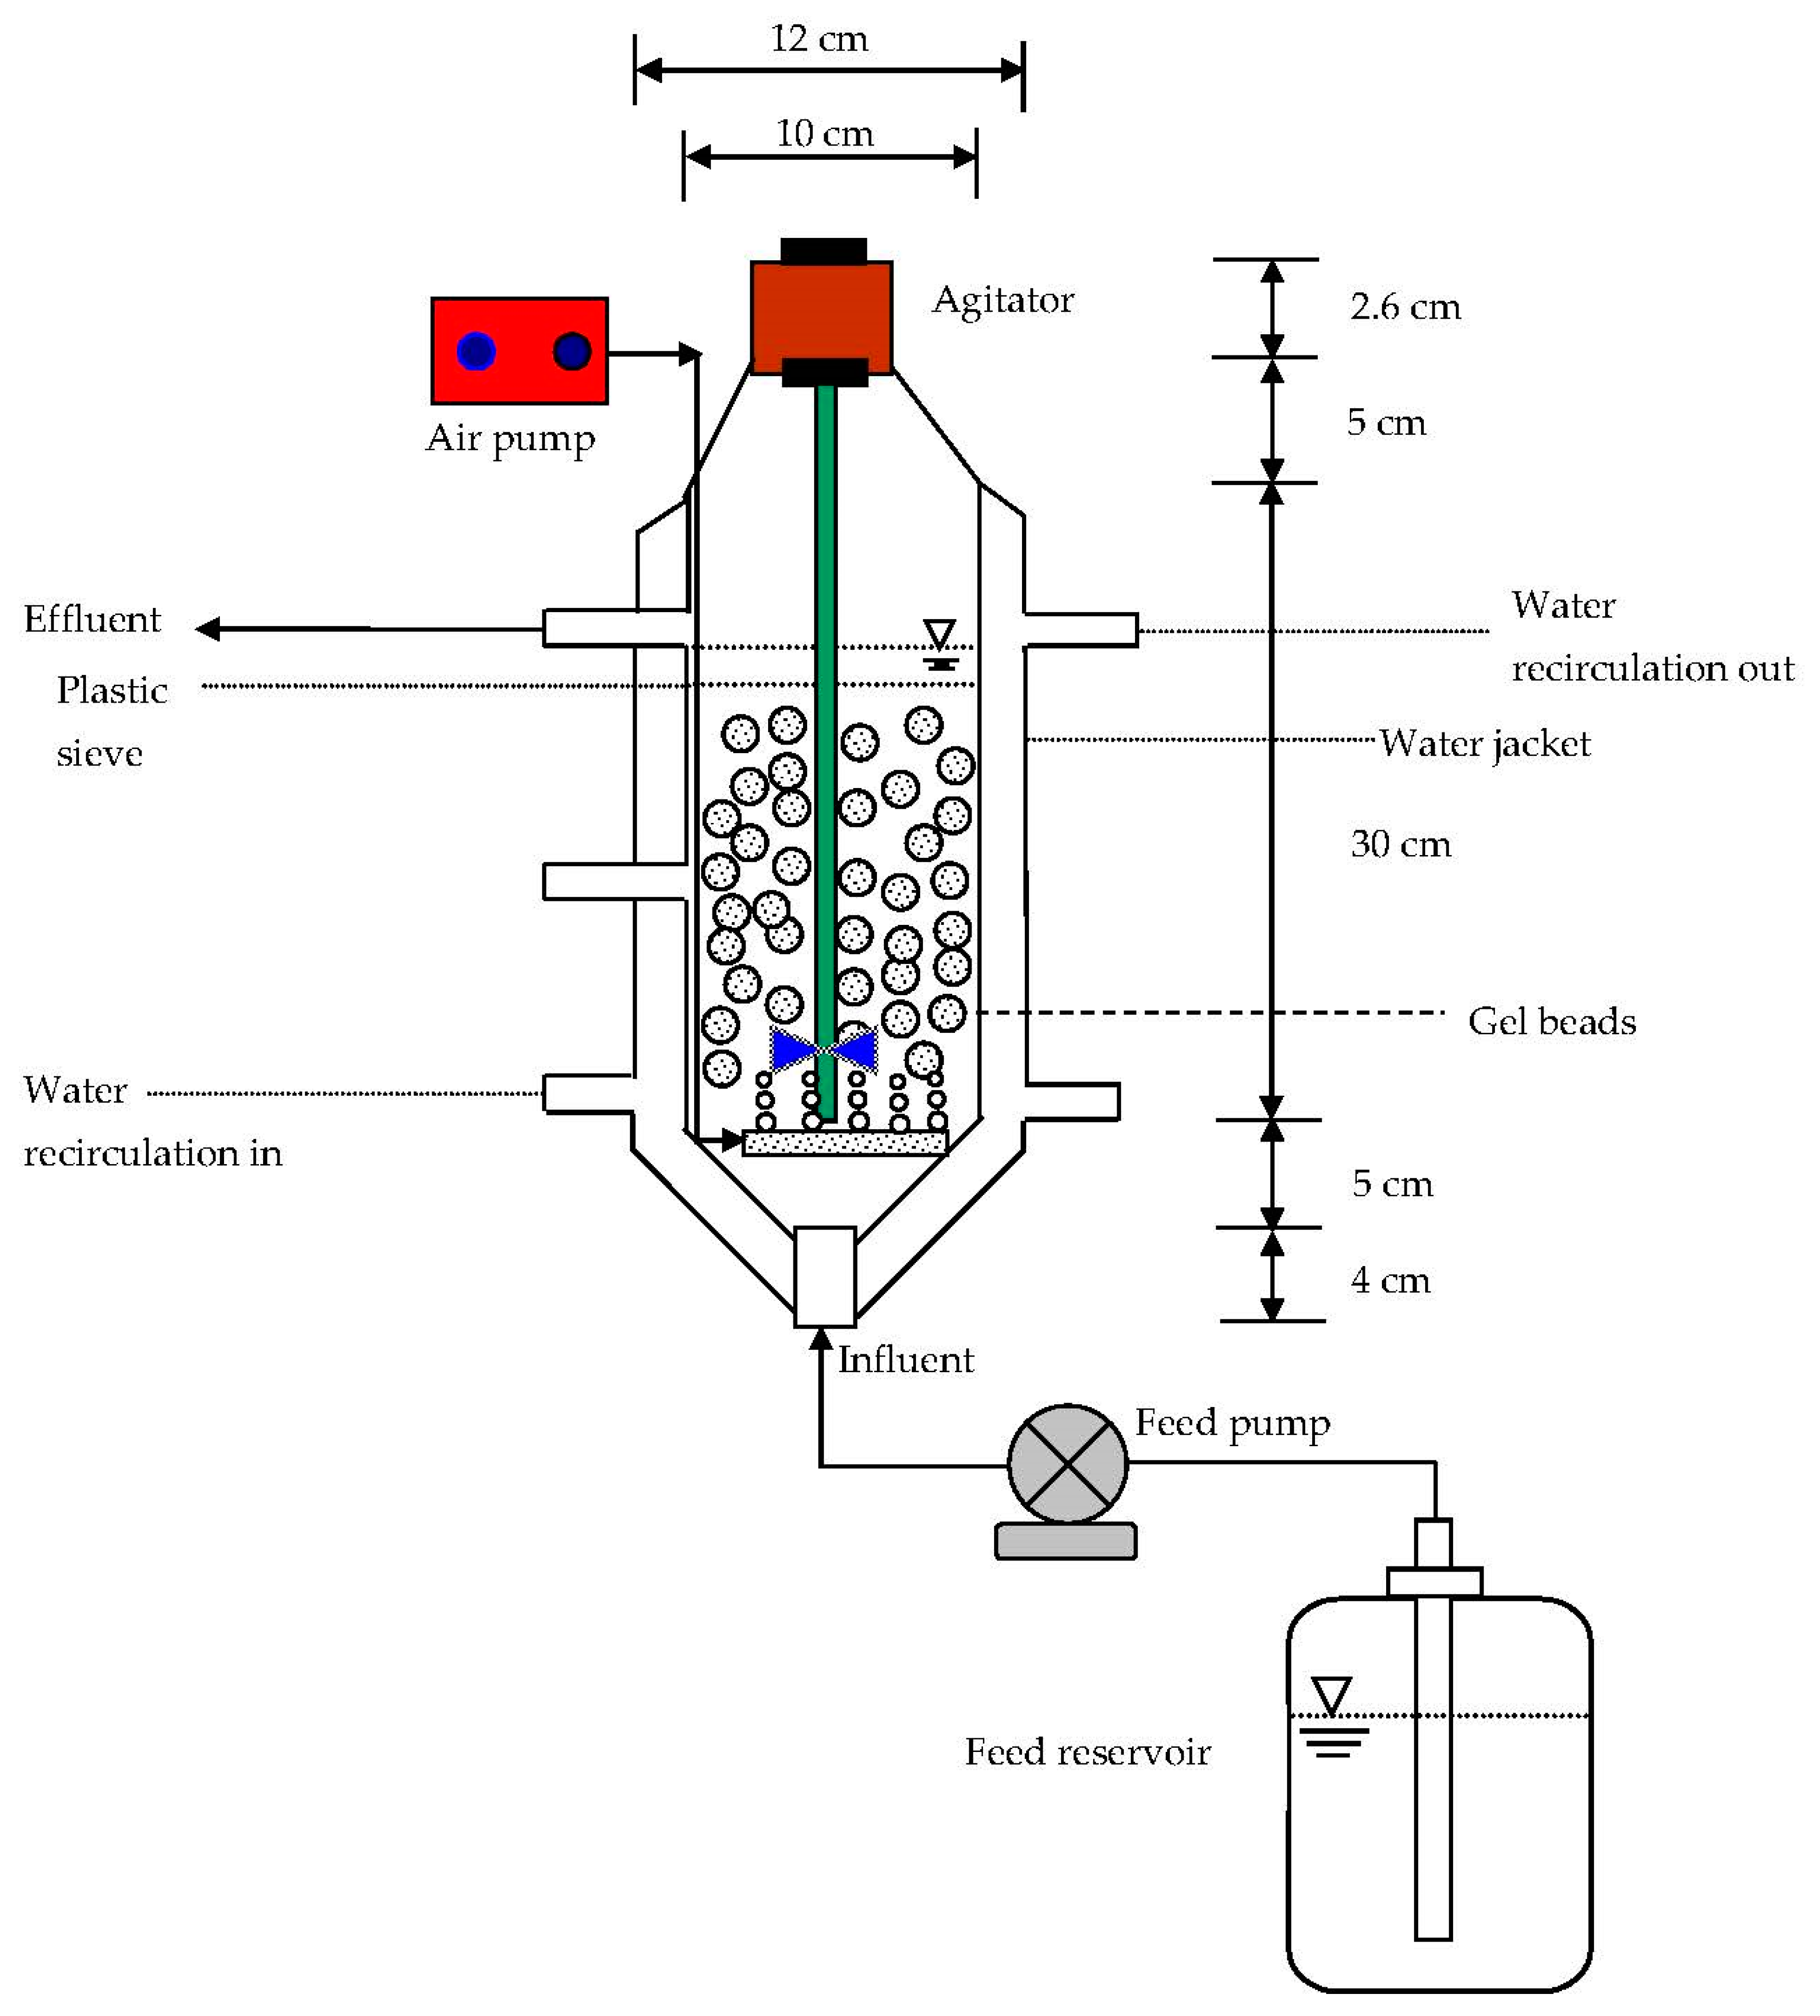
3.6. Continuous-Flow Bioreactor

A schematic laboratory-scale completely mixed and continuous-flow bioreactor is illustrated in Figure 2. The cylinder shape was composed of glass with an acrylic stand. The shape of the system is cylinder made of glass with an acrylic stand. The bioreactor body was 46.6 cm height and 10 cm diameter. The working volume was 1.568 L as the liquid level was 30 cm. A hydraulic residence time (HRT) was 6 h when the influent flow rate was controlled at 6.272 L d−1 in this study. The volume of gel beads was about 0.96 L, which is approximately 40% of the effective volume. The dissolved oxygen was transported by an air compressor with 1 L/min air flow rate. The circulating water bath was employed to control the bioreactor temperature at 30 ± 0.1 °C using the water jacket. The inlet port at the bottom of bioreactor was connected with a digital peristaltic pump using a silicone tubing to provide a flow rate of 11.32 mL min−1. The influent feed contained phenol plus p-cresol as binary substrates with MSM. The pH value was controlled at 7.0 ± 0.1 by adding PBS in the influent feed.

4. Results and Discussion

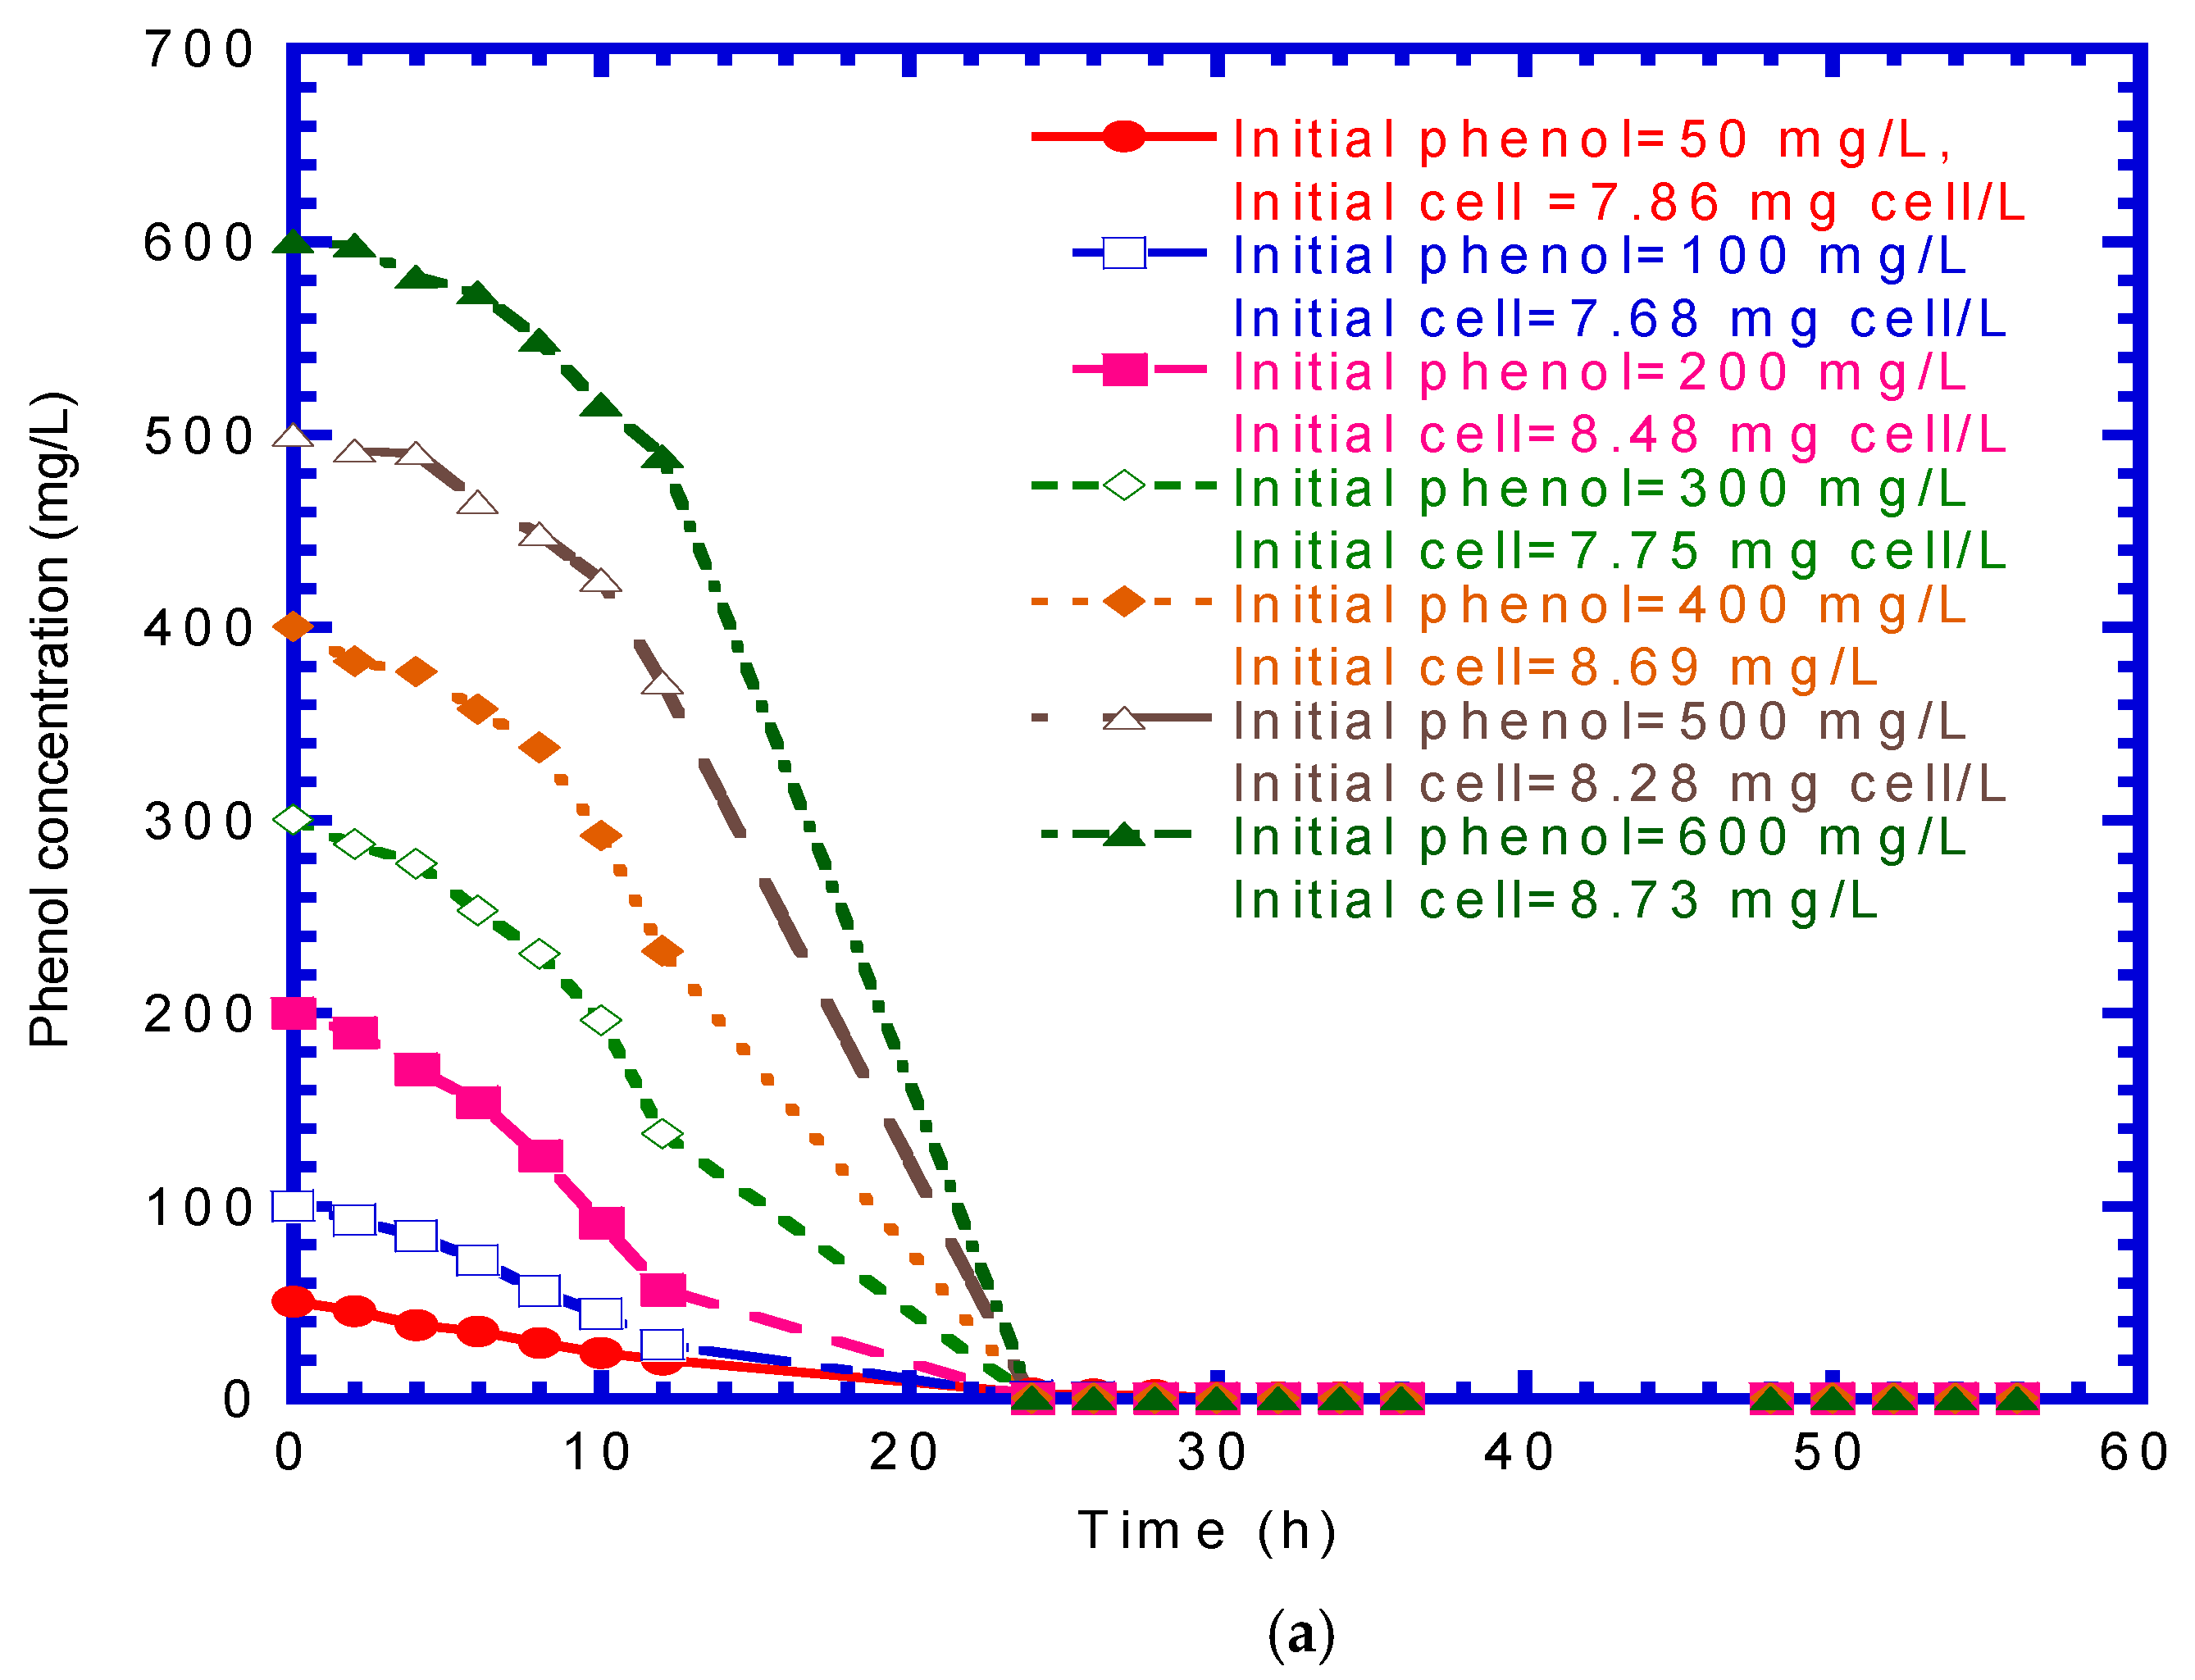
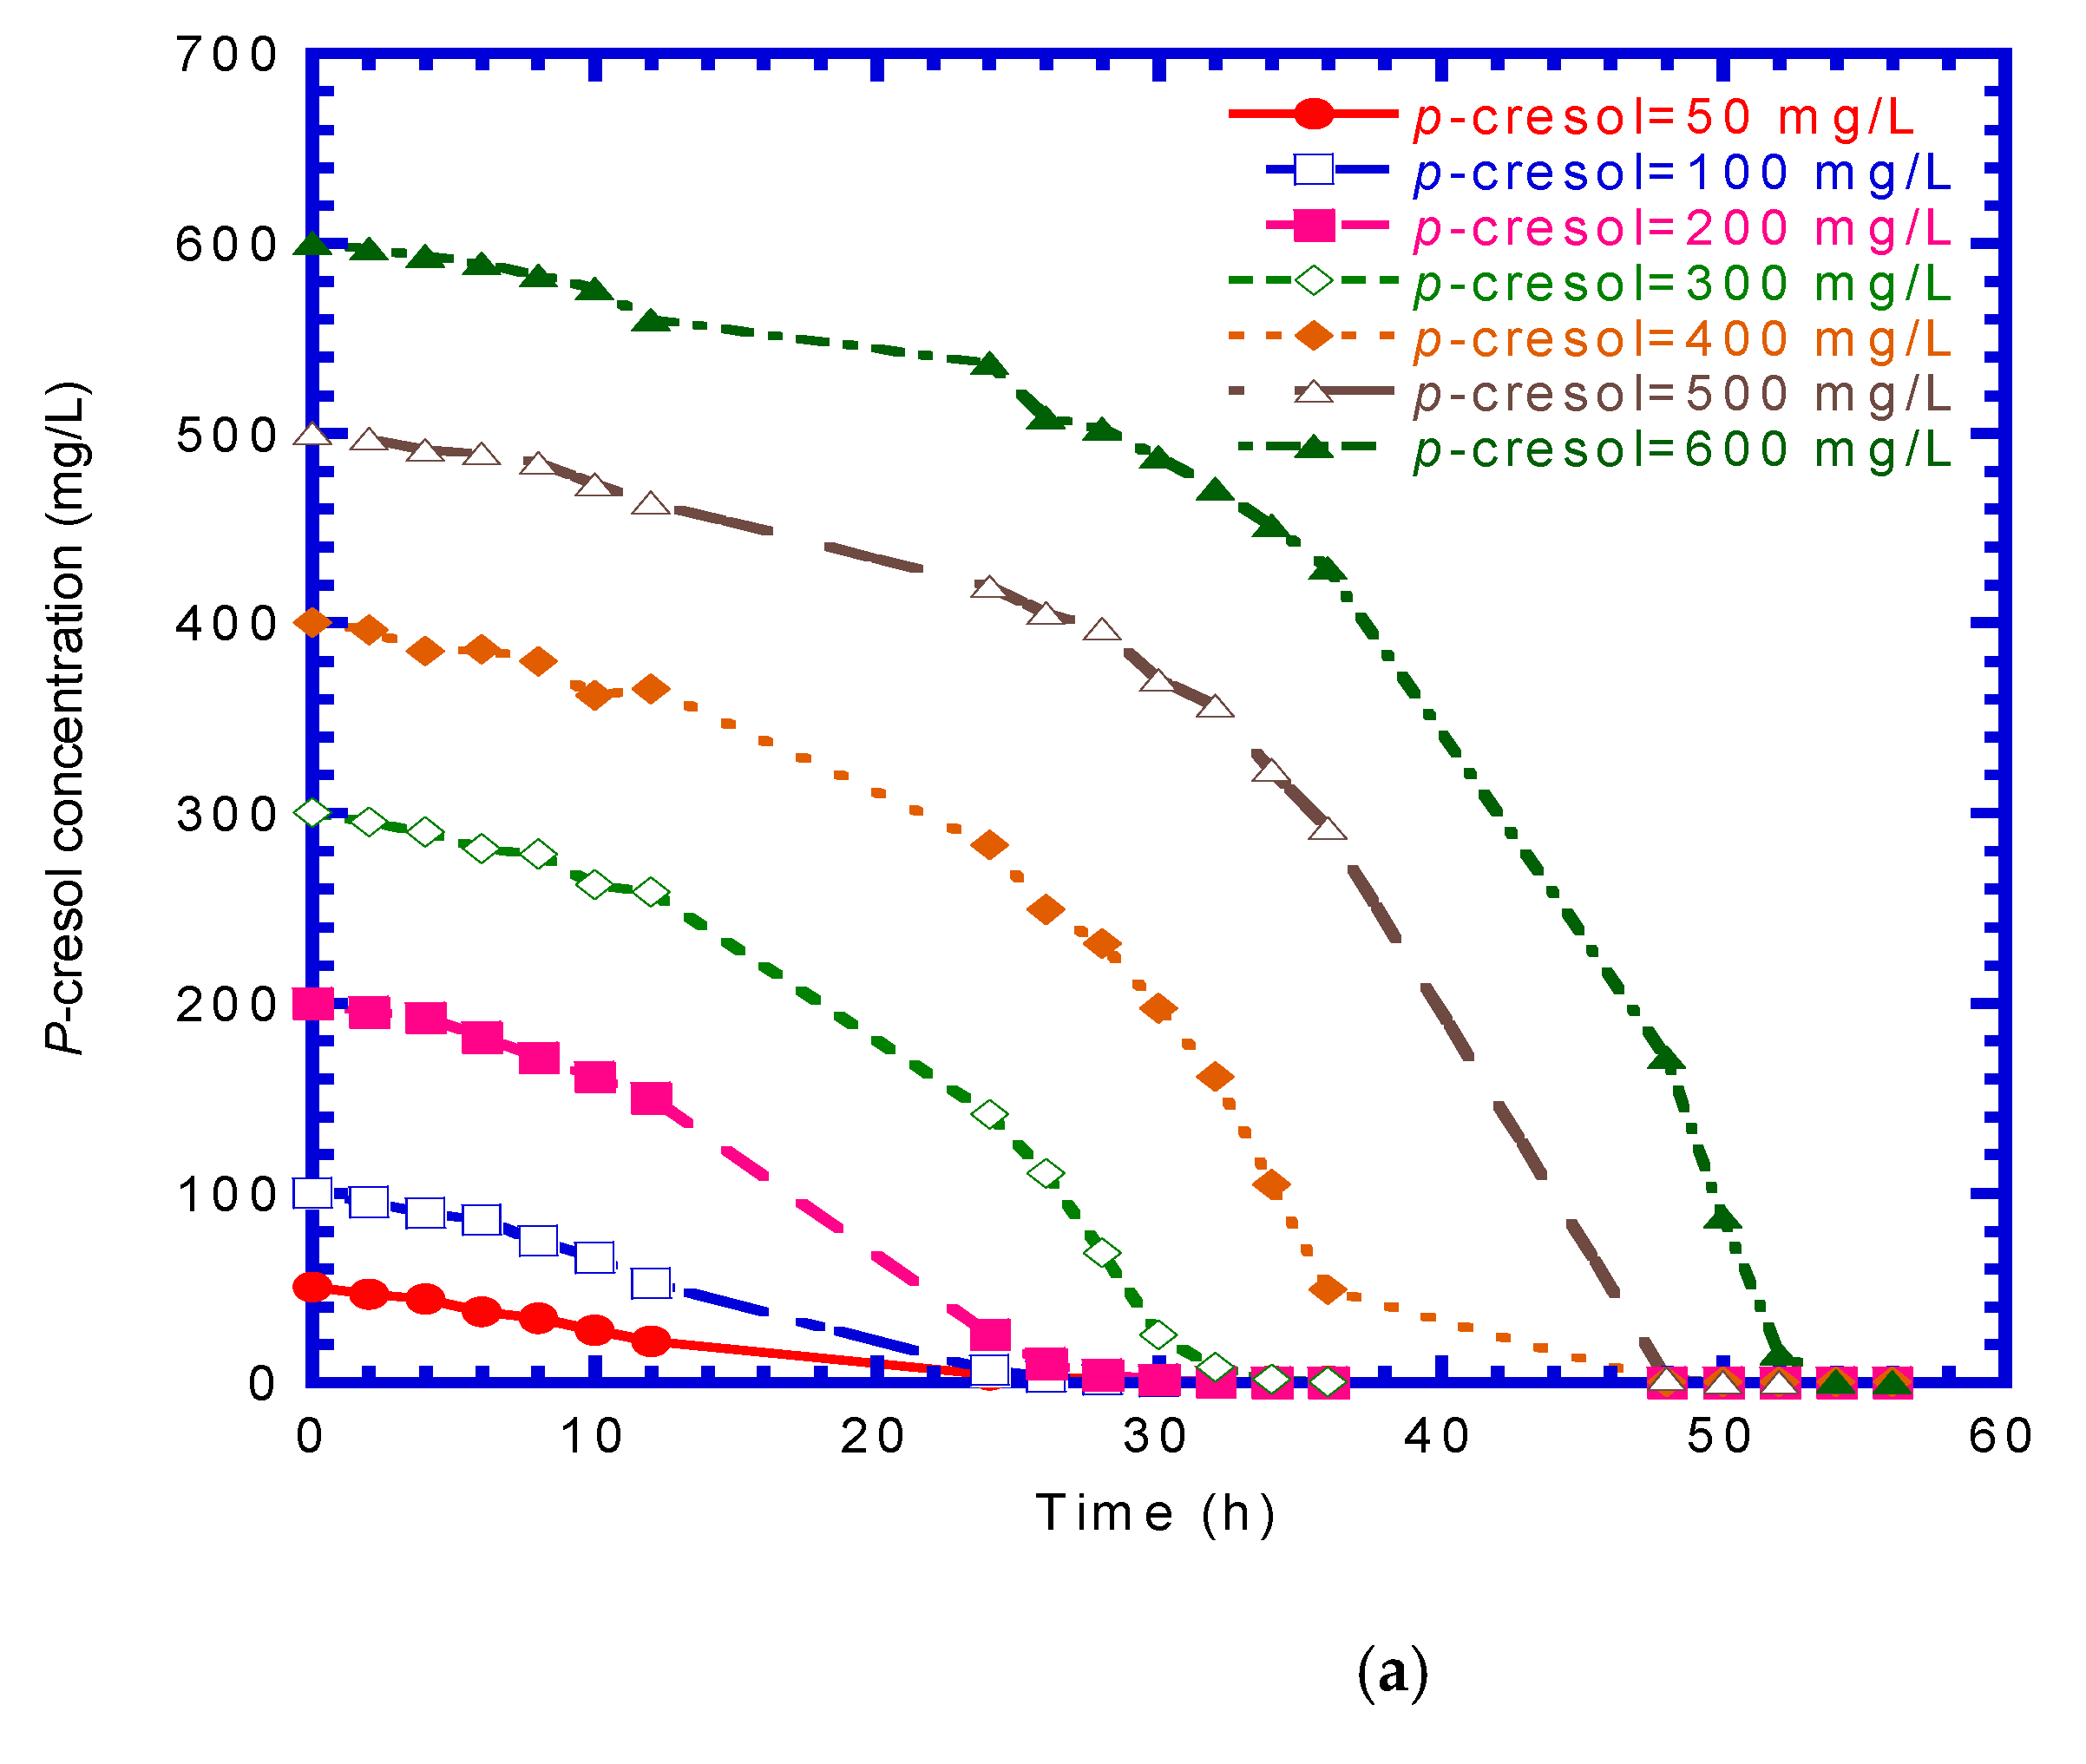
4.1. Biodegradation of Phenol or p-Cresol in Batch Experiments

Figure 3 plots the phenol biodegradation and cell growth with various initial phenol (50–600 mg L−1) and cells concentration (7.68–8.73 mg cell L−1). The required time for phenol complete degradation at all levels was about 24 h (Figure 3a). There was no significant lag phase that occurred from 50 to 600 mg L of initial phenol concentration. After 24 h, the cell growth reached a constant value ranging from 24.7 to 211 mg cell L−1 under different initial phenol concentration (Figure 3b). The time required for complete phenol degradation by P. putida CCRC 14365 was in the range of 6–47 h as the initial phenol concentration increased from 0.27 to 4.25 mM [27]. Kumar et al. [28] conducted a batch reactor to evaluate the phenol degradation by P. putida MTCC 1194. They reported that the cells had the ability to degrade an initial phenol concentration of 1000 mg L−1 completely in 162 h. Figure 4a illustrates the p-cresol degradation varying from 50 to 600 mg L−1. It can be seen that the needed time for the complete biodegradation of p-cresol ranged from 24 to 52 h under varying initial p-cresol concentrations of 50–600 mg L−1. As illustrated in Figure 4b, the lag phase of cells growth was obvious, and the lag time was about 8 h. The time required to achieve a steady-state cell growth ranged from 24 to 52 h. The range of final cell concentration was 21.3 to 176 mg cell L−1.

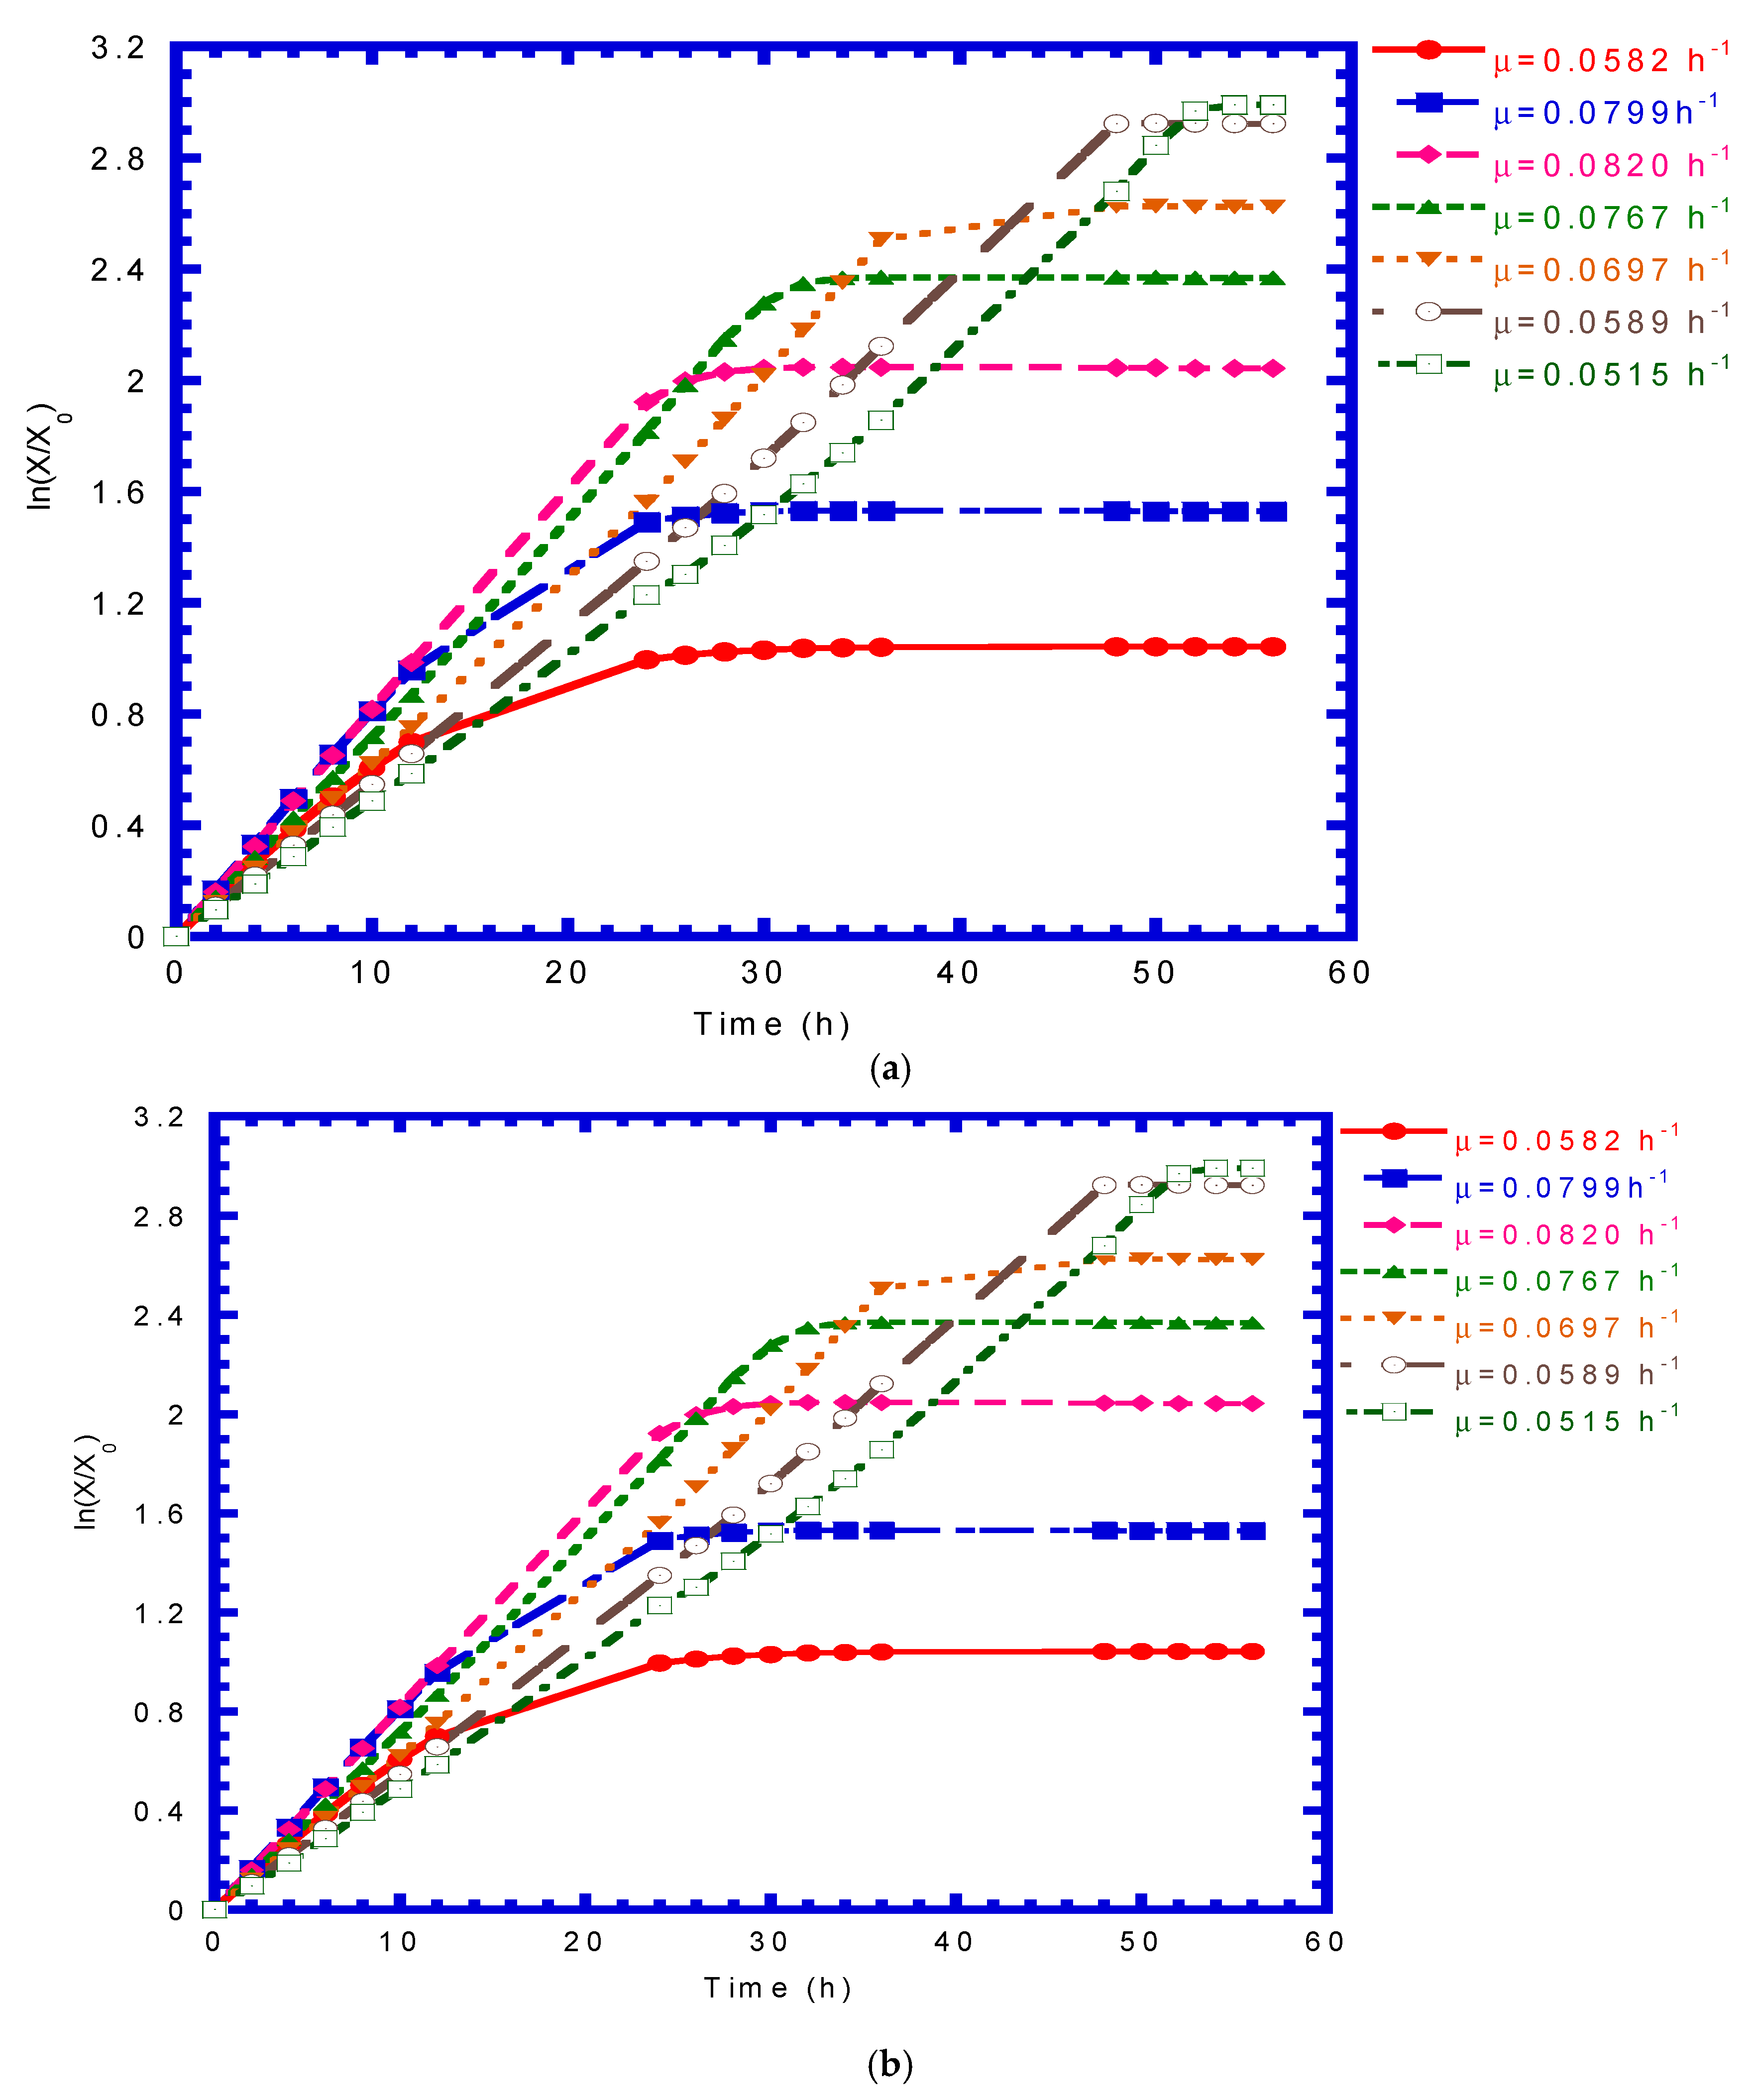
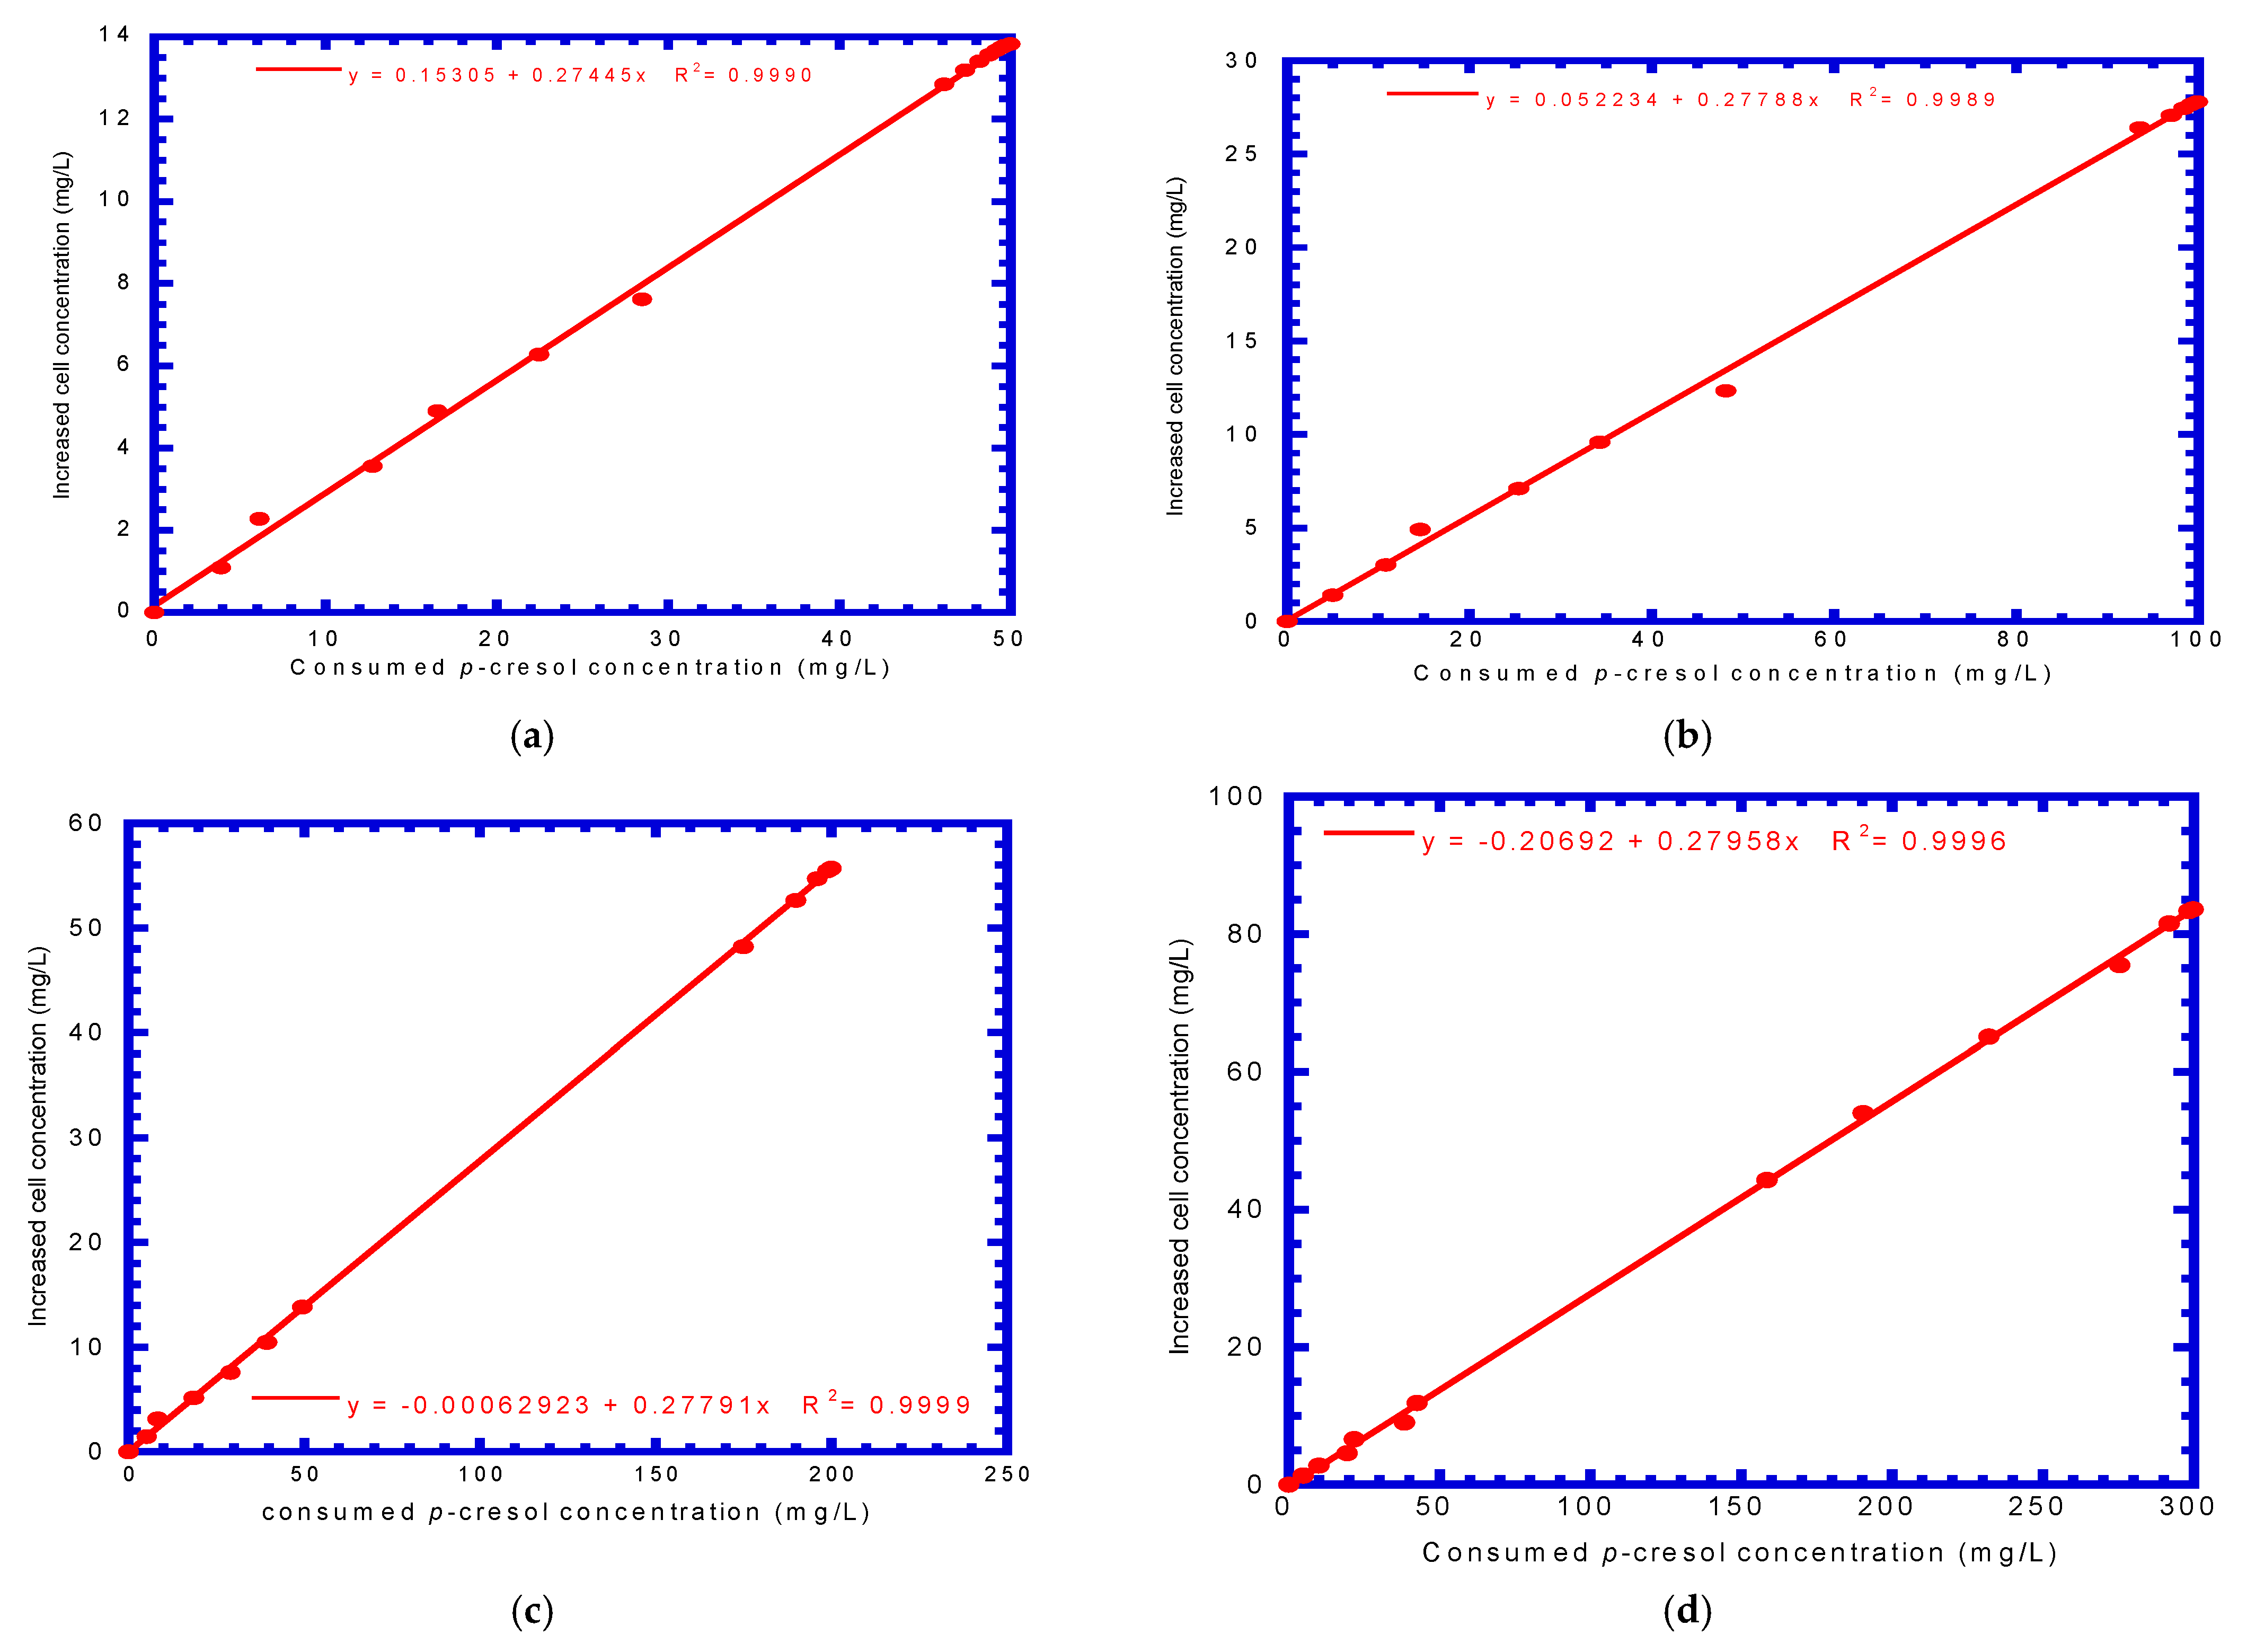
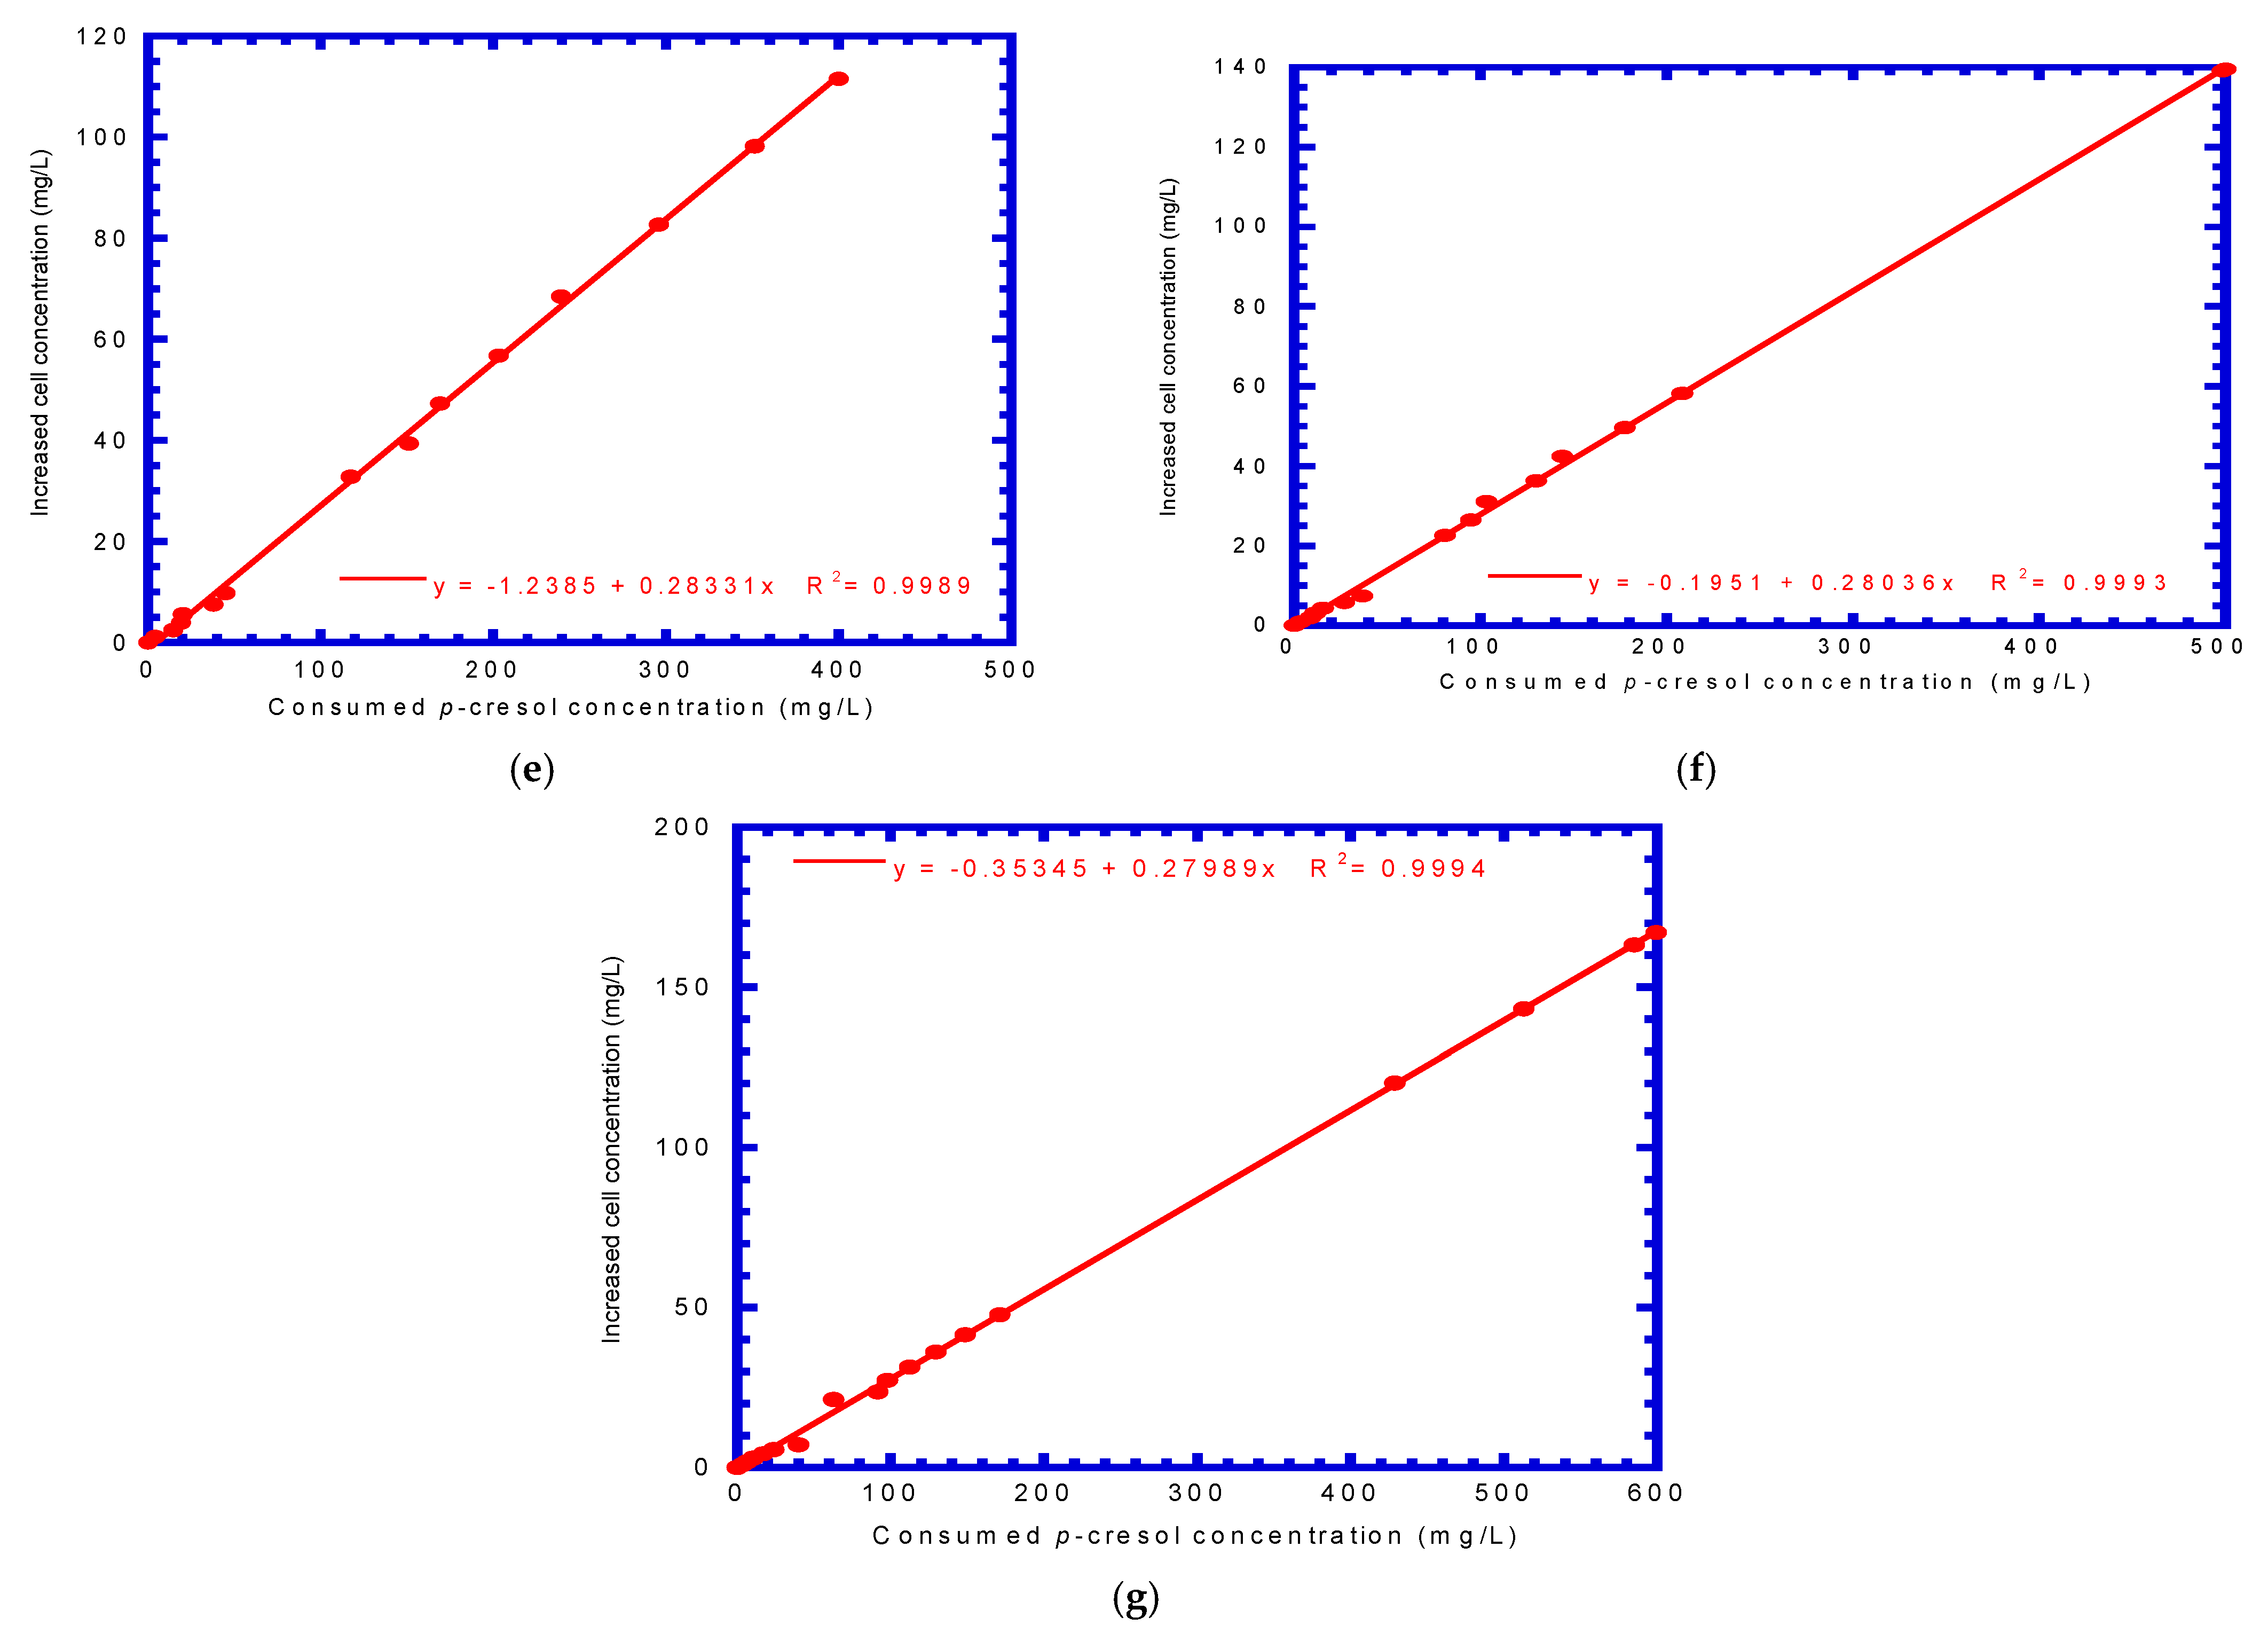
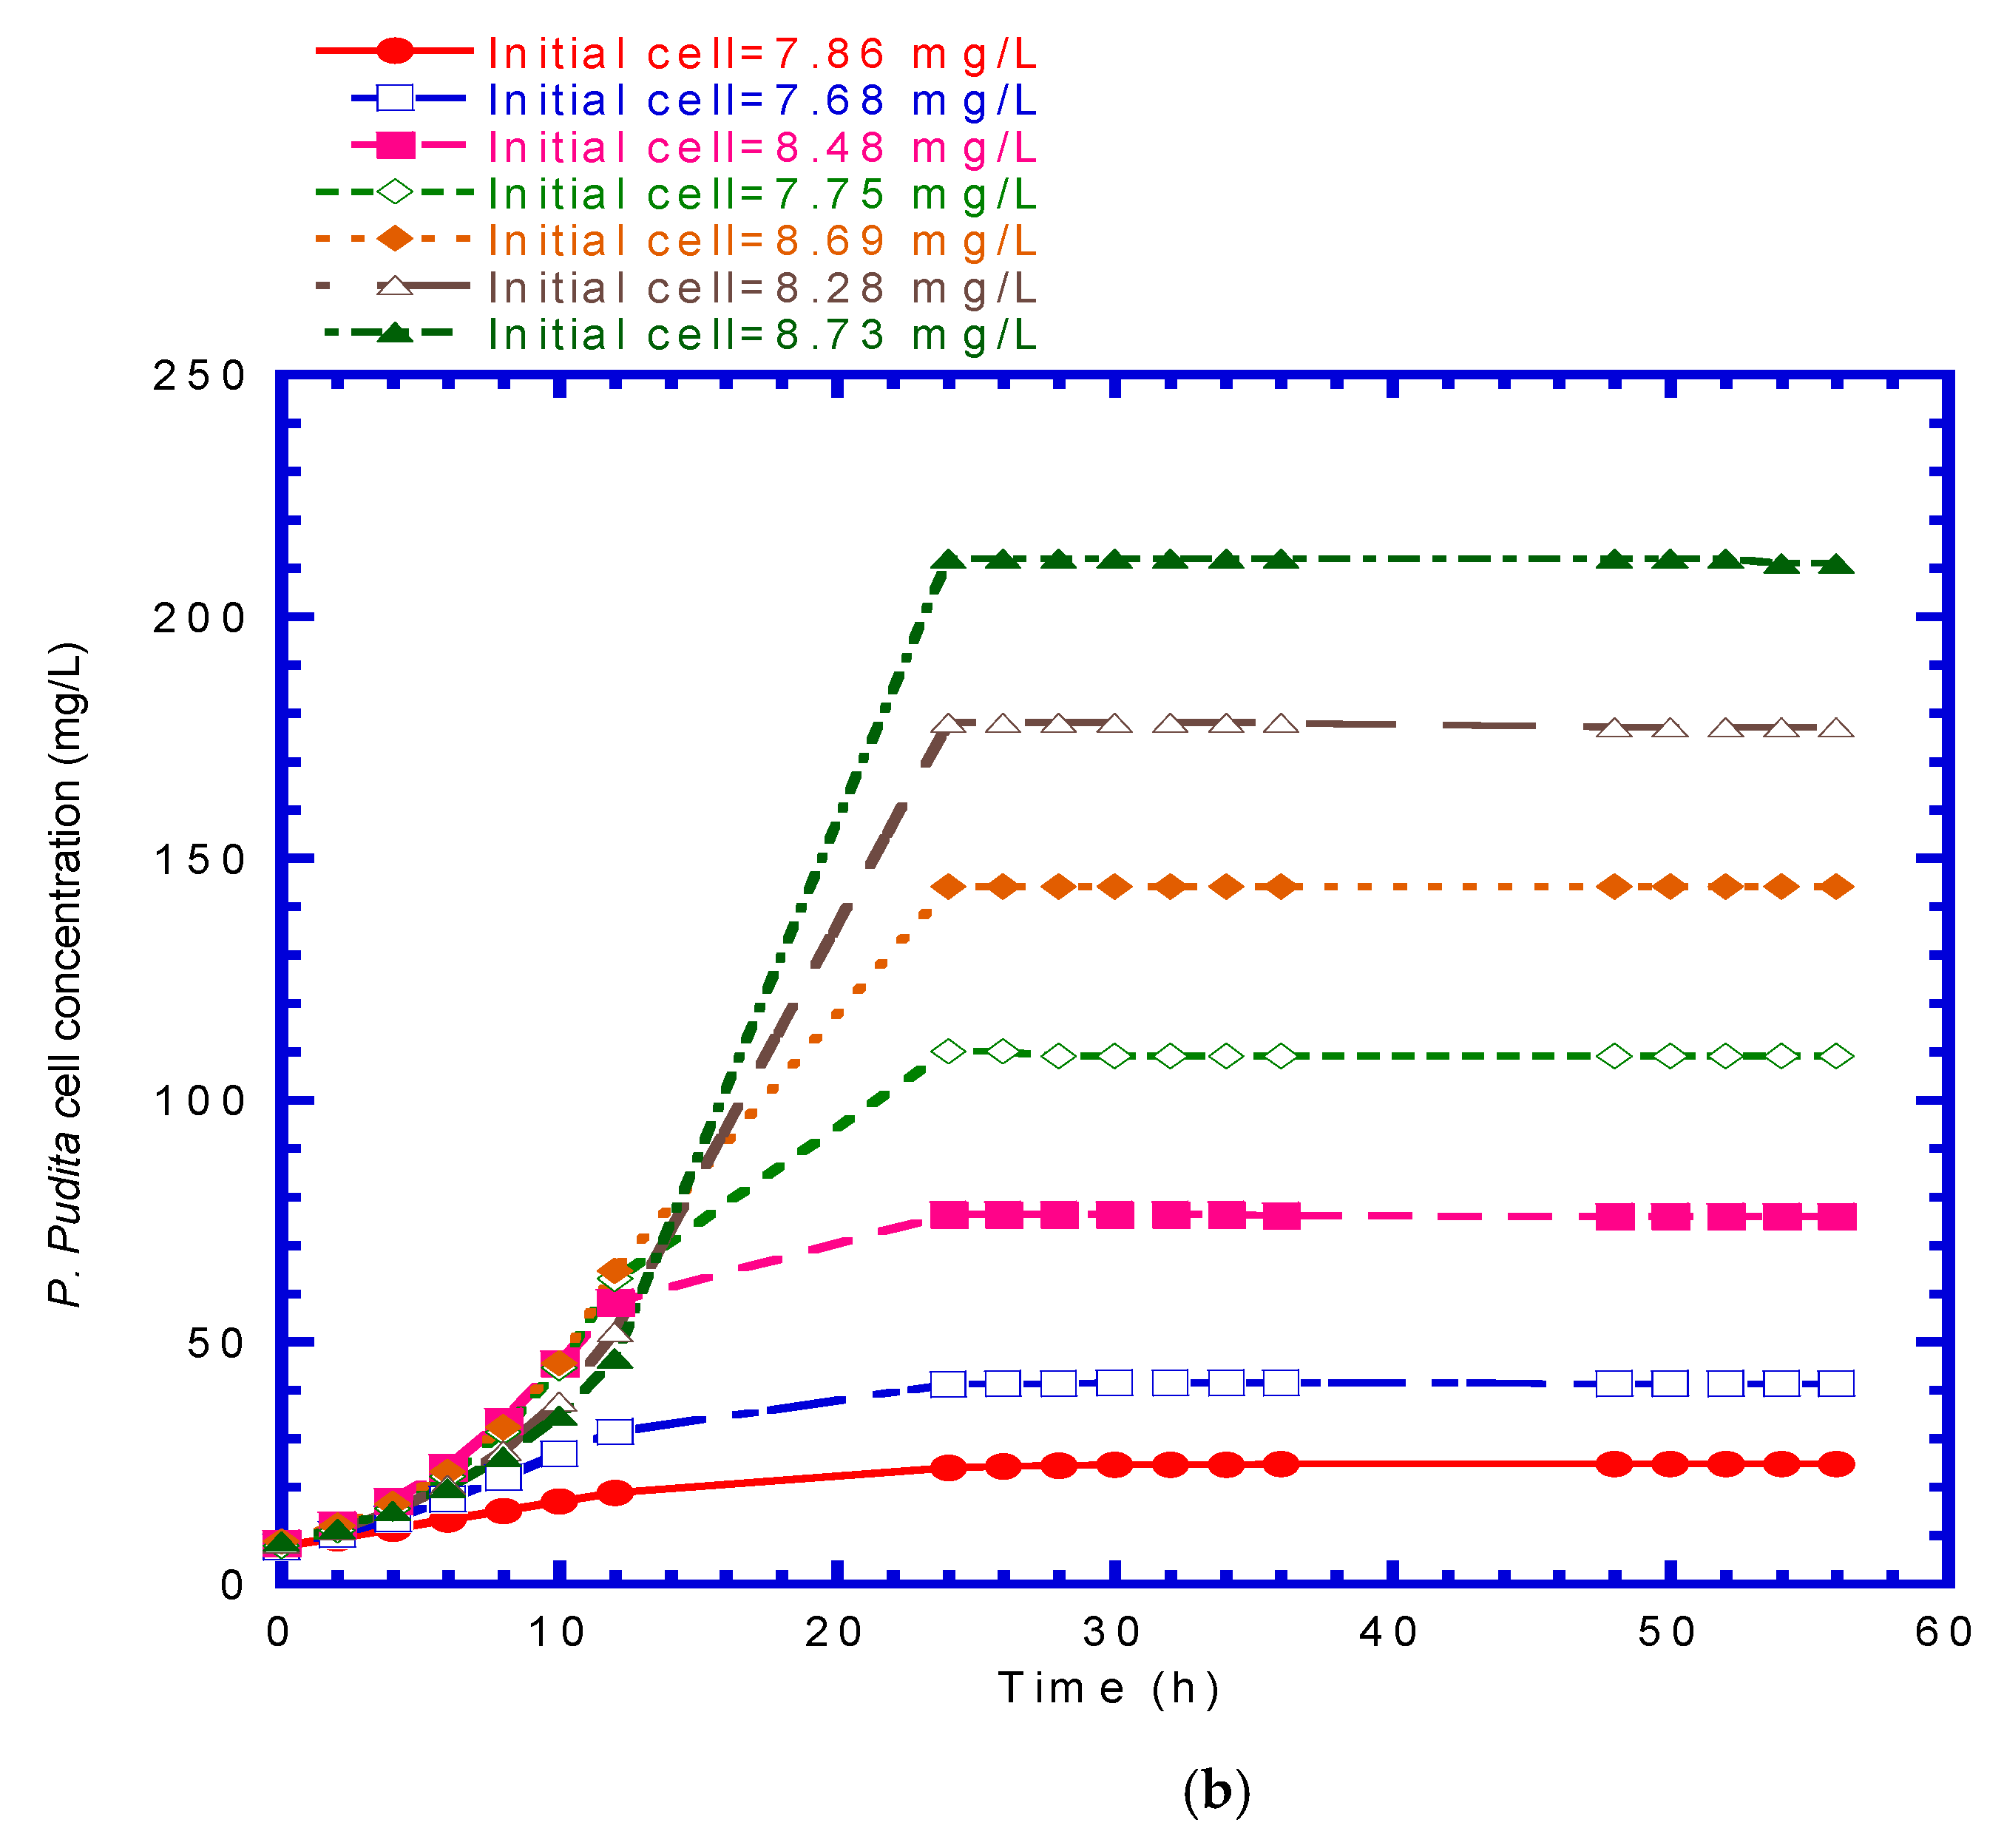
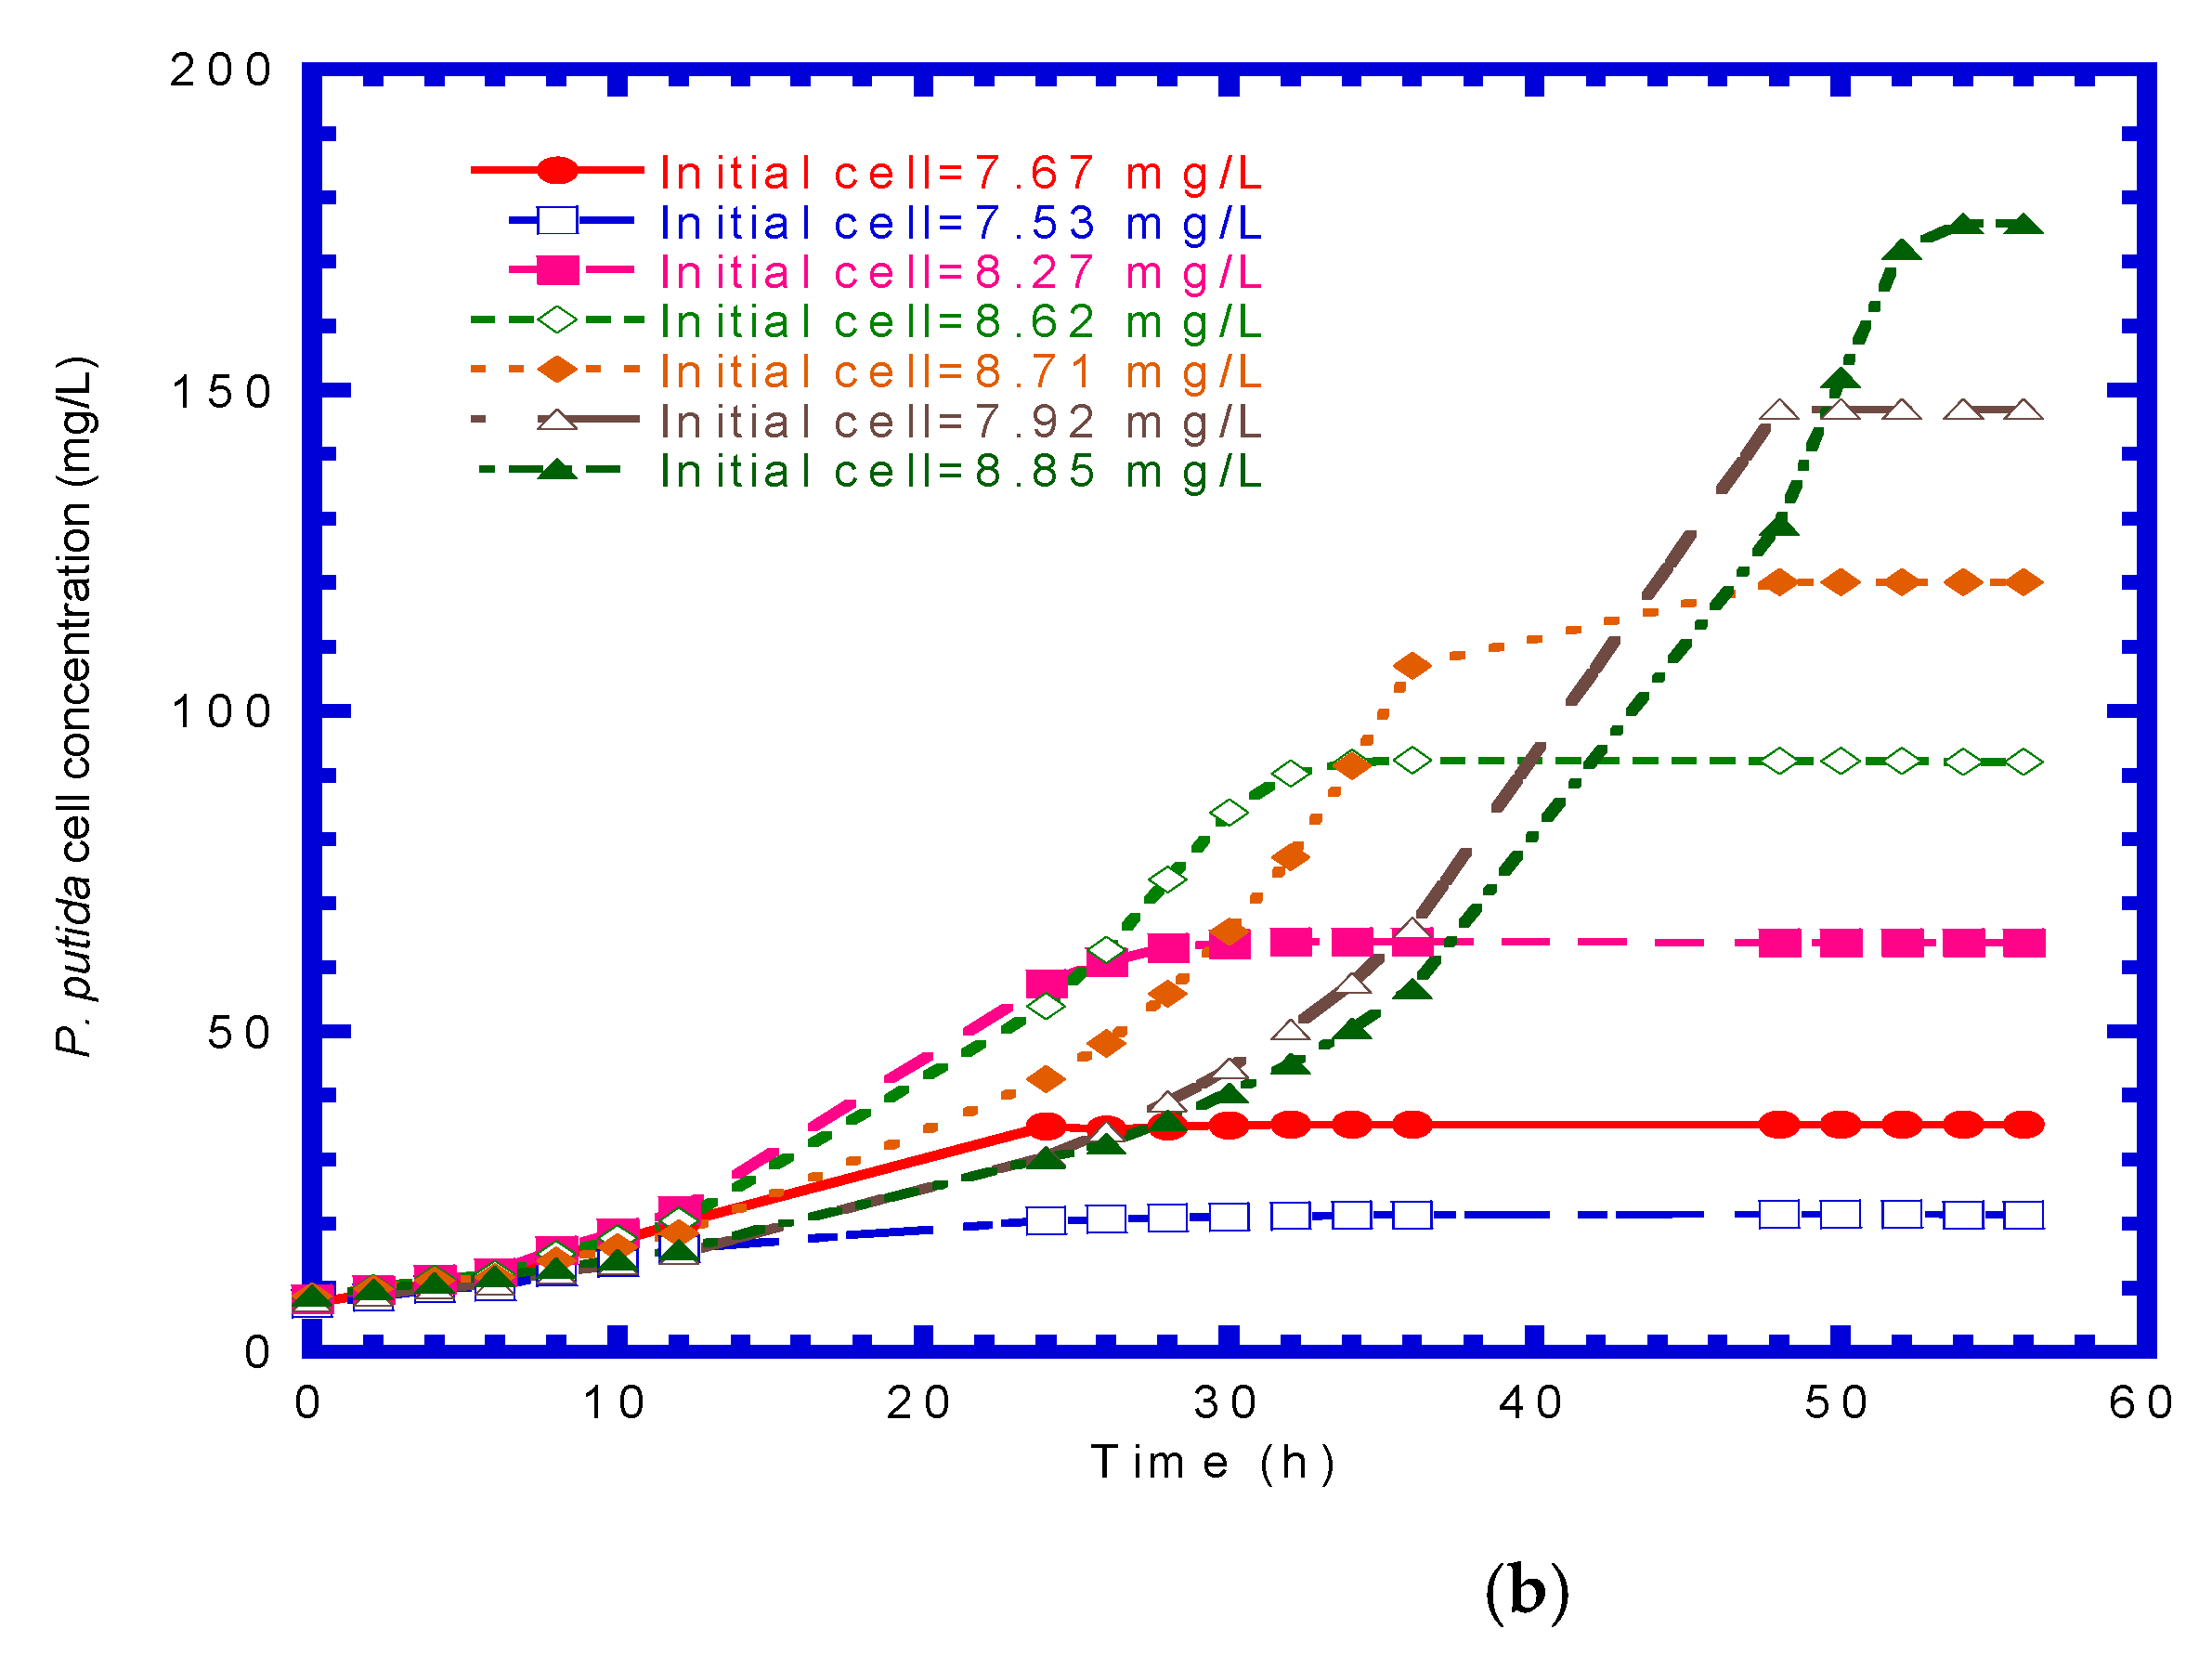
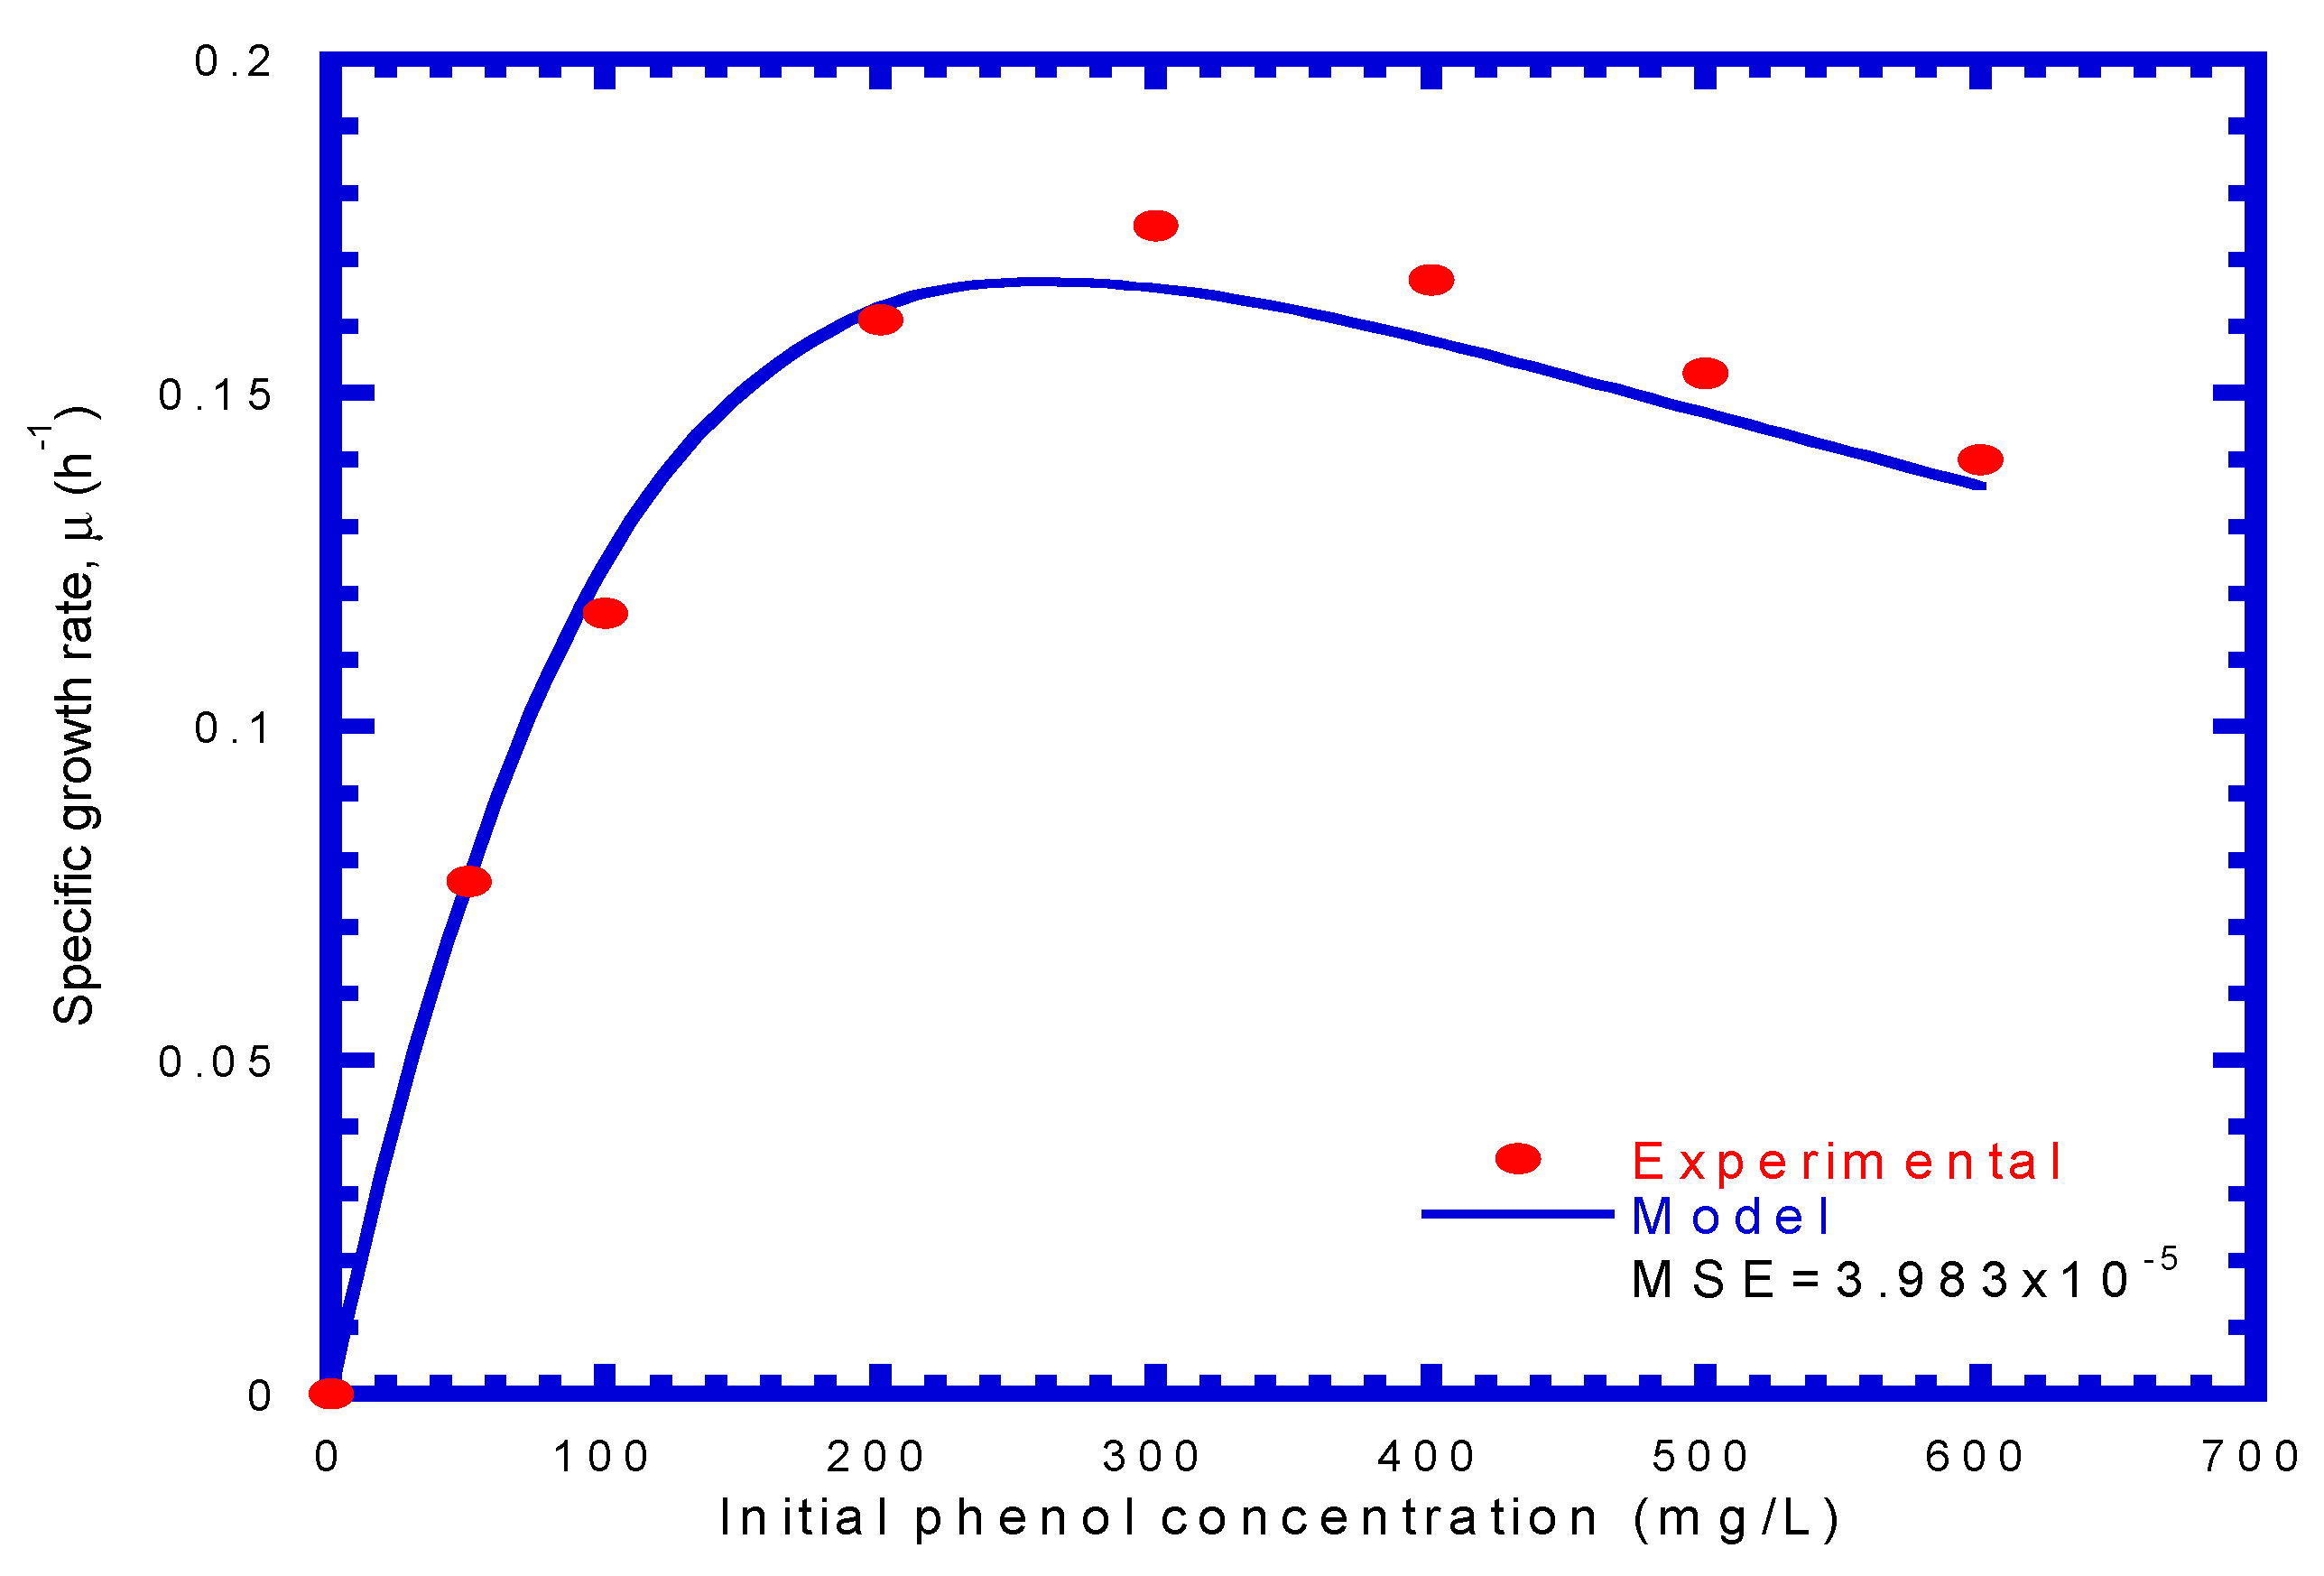
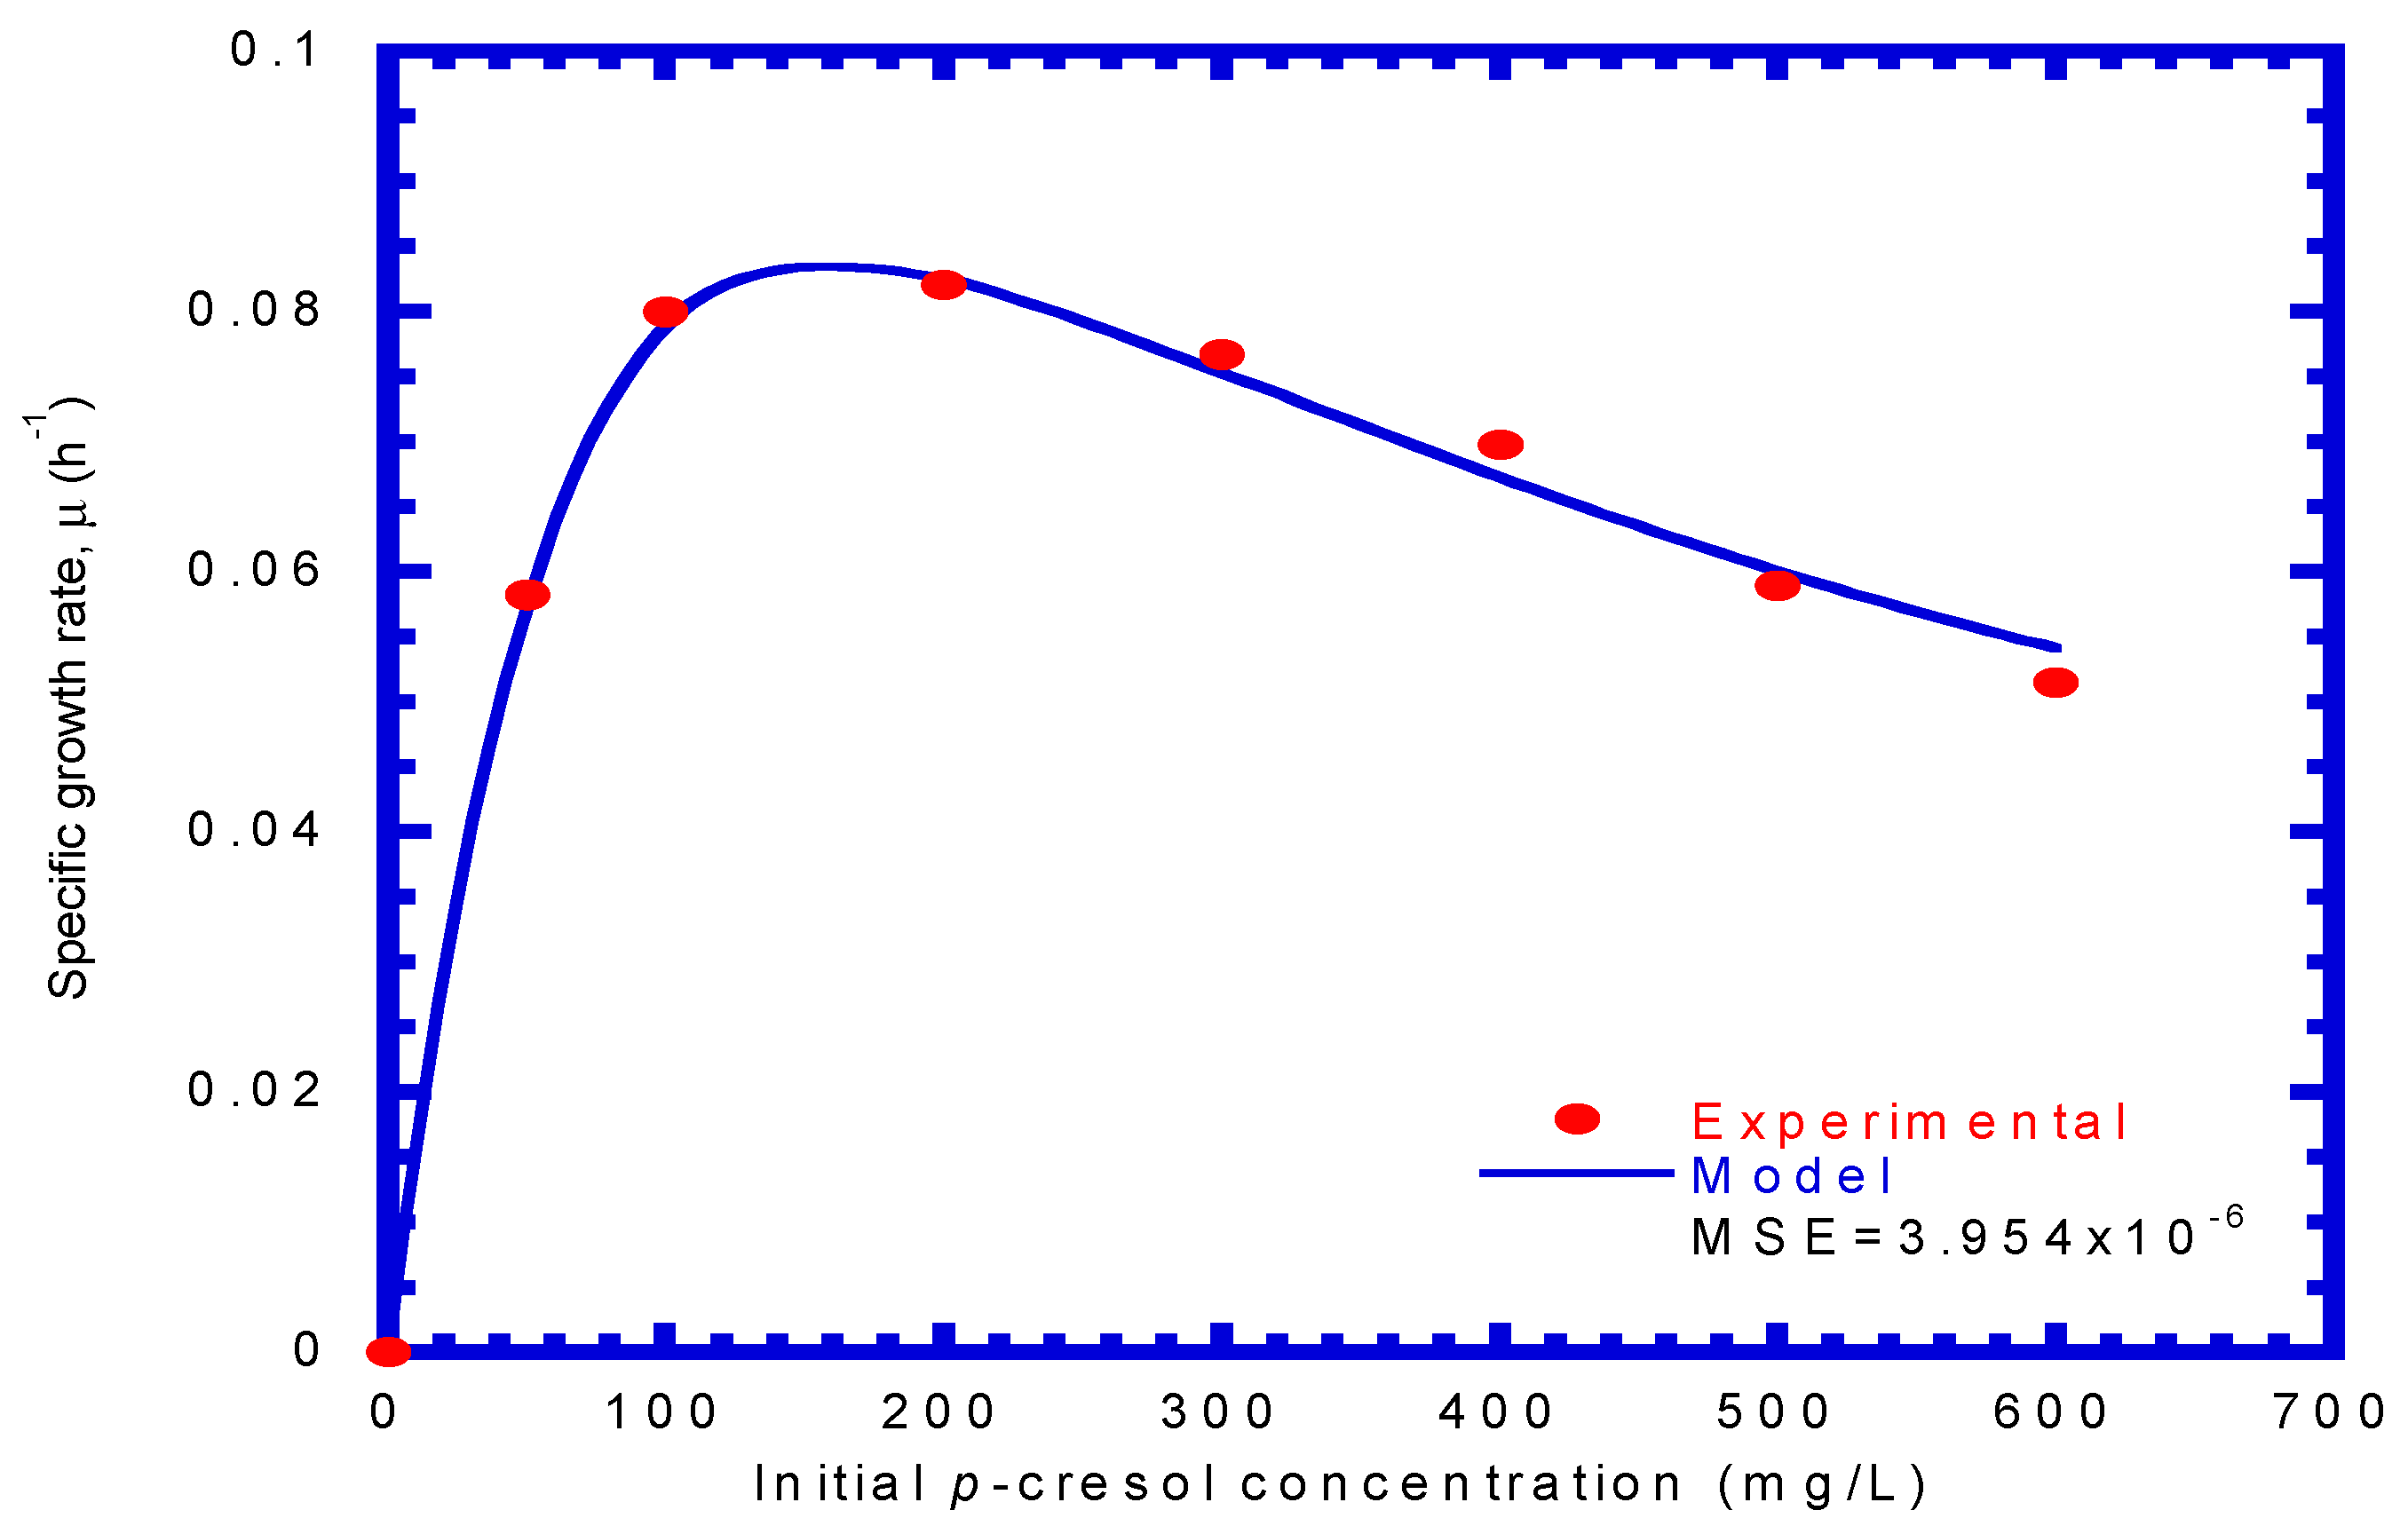
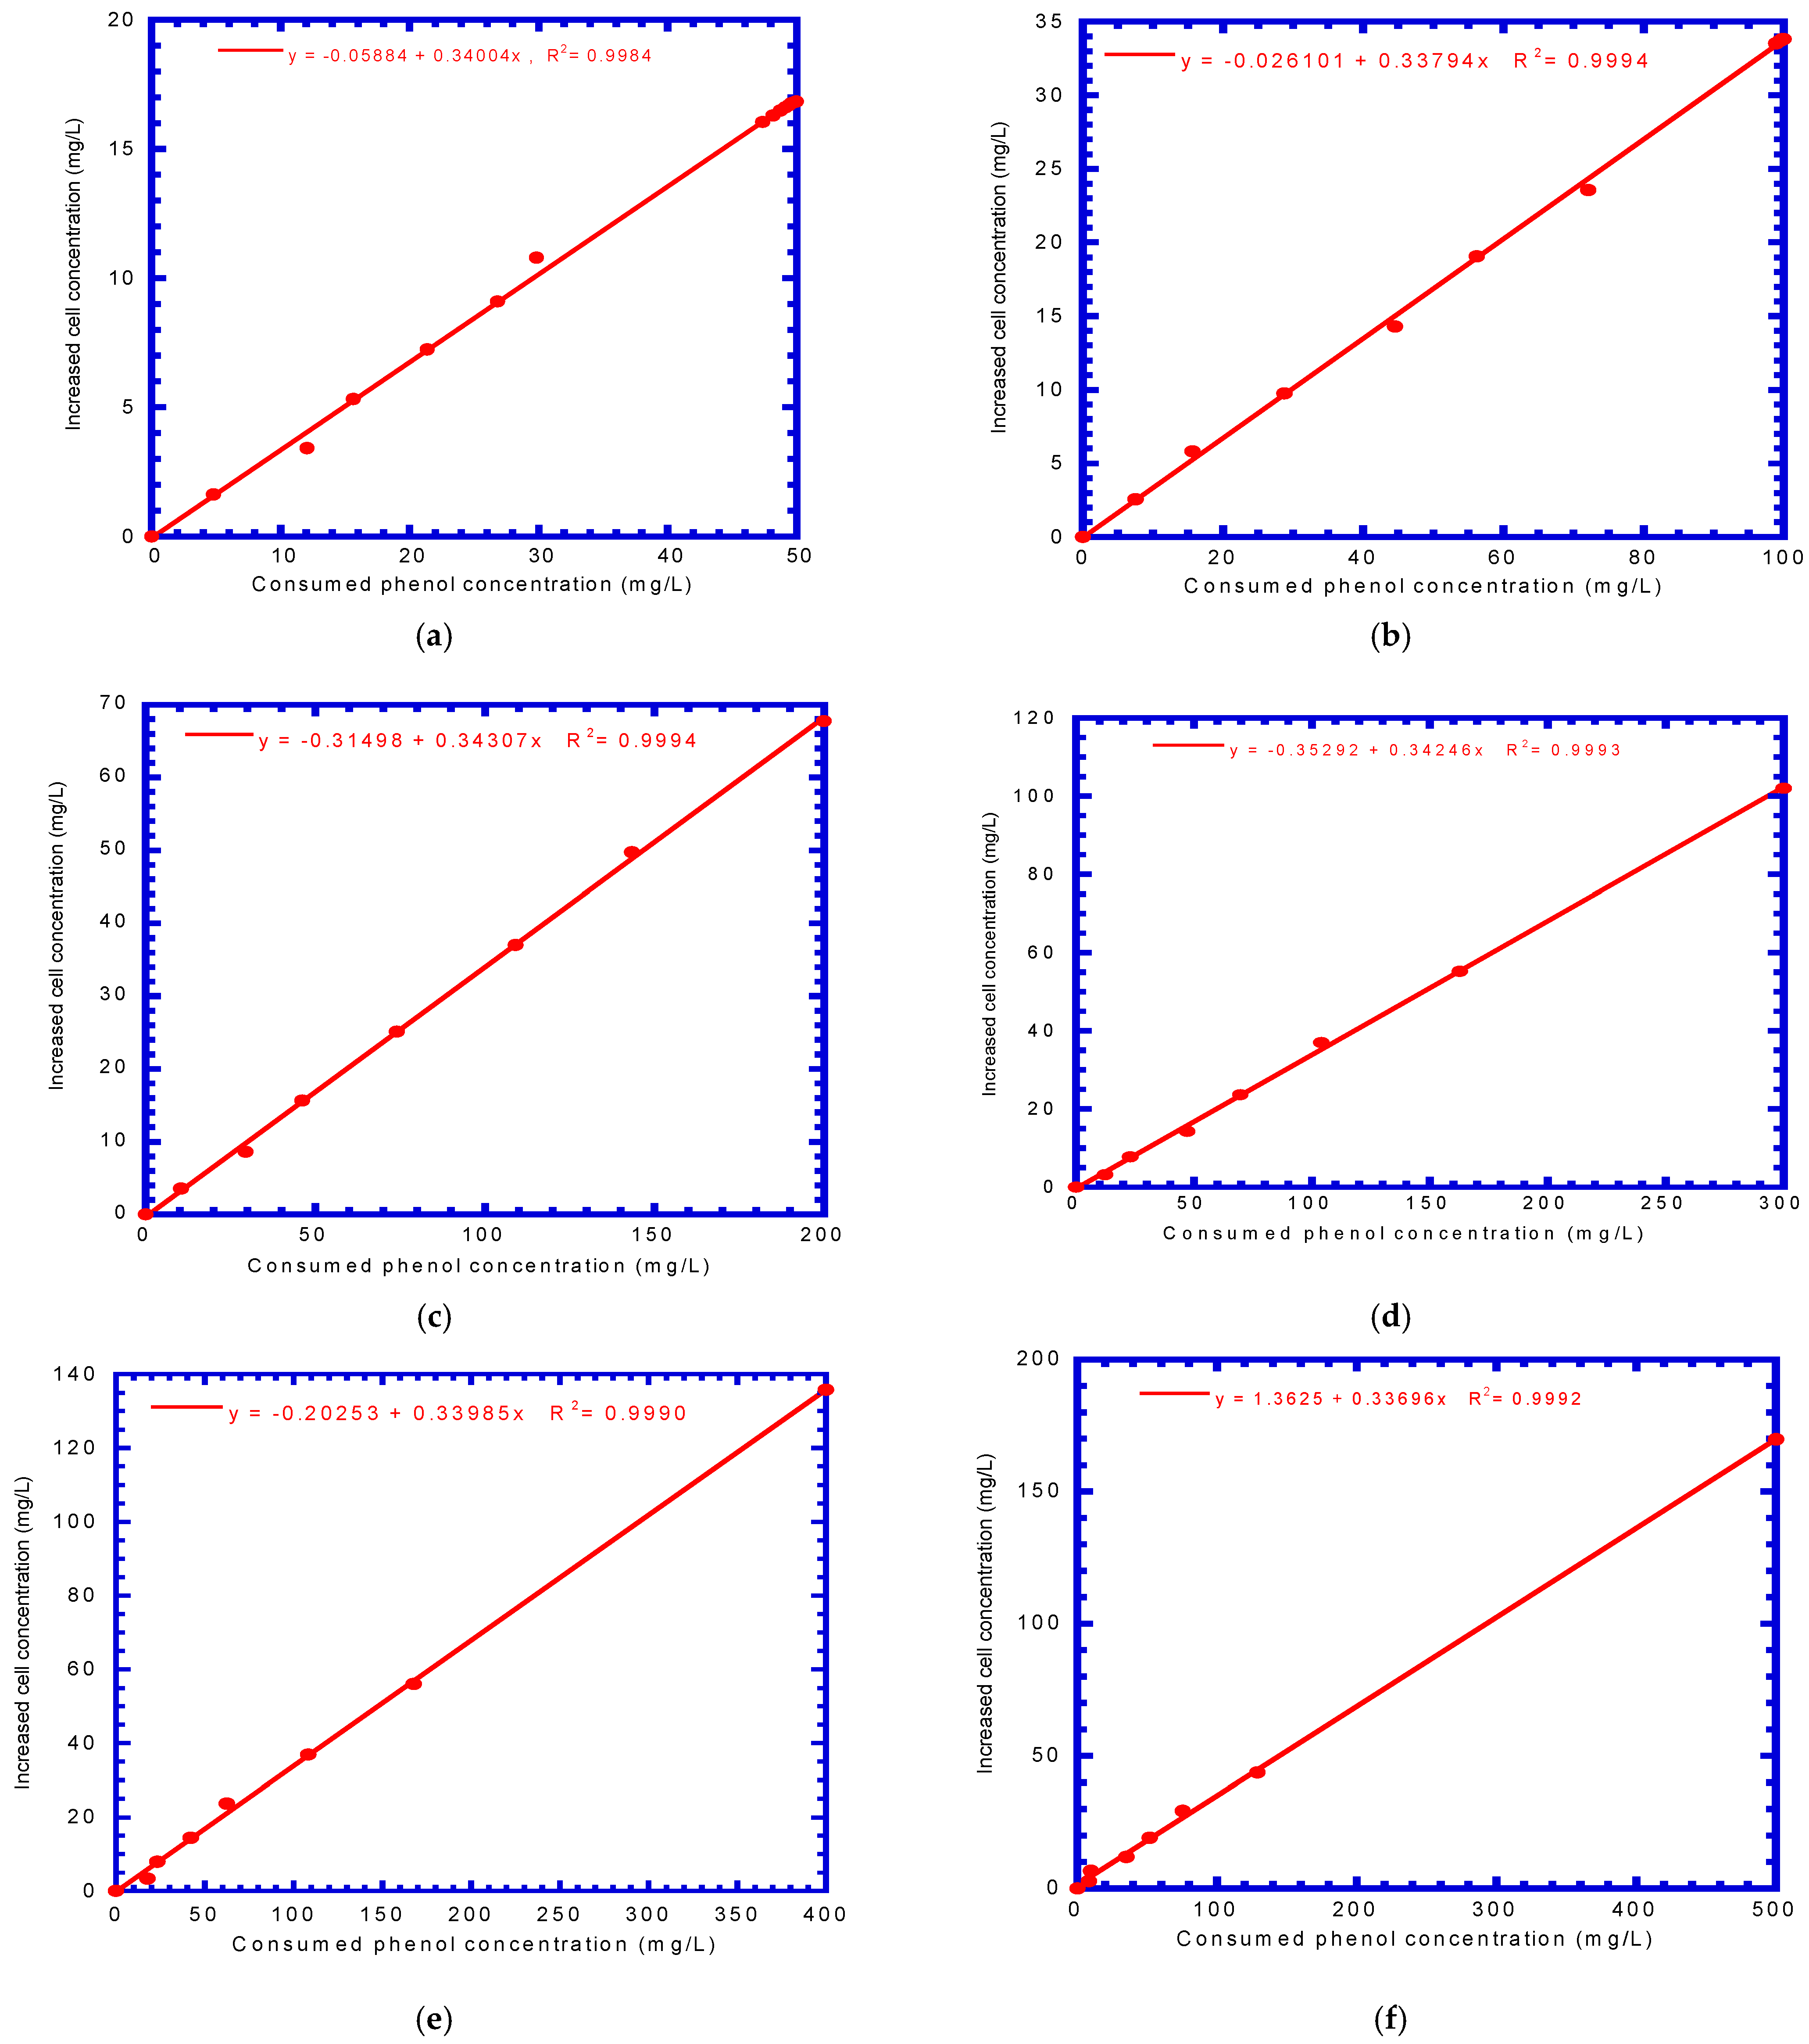
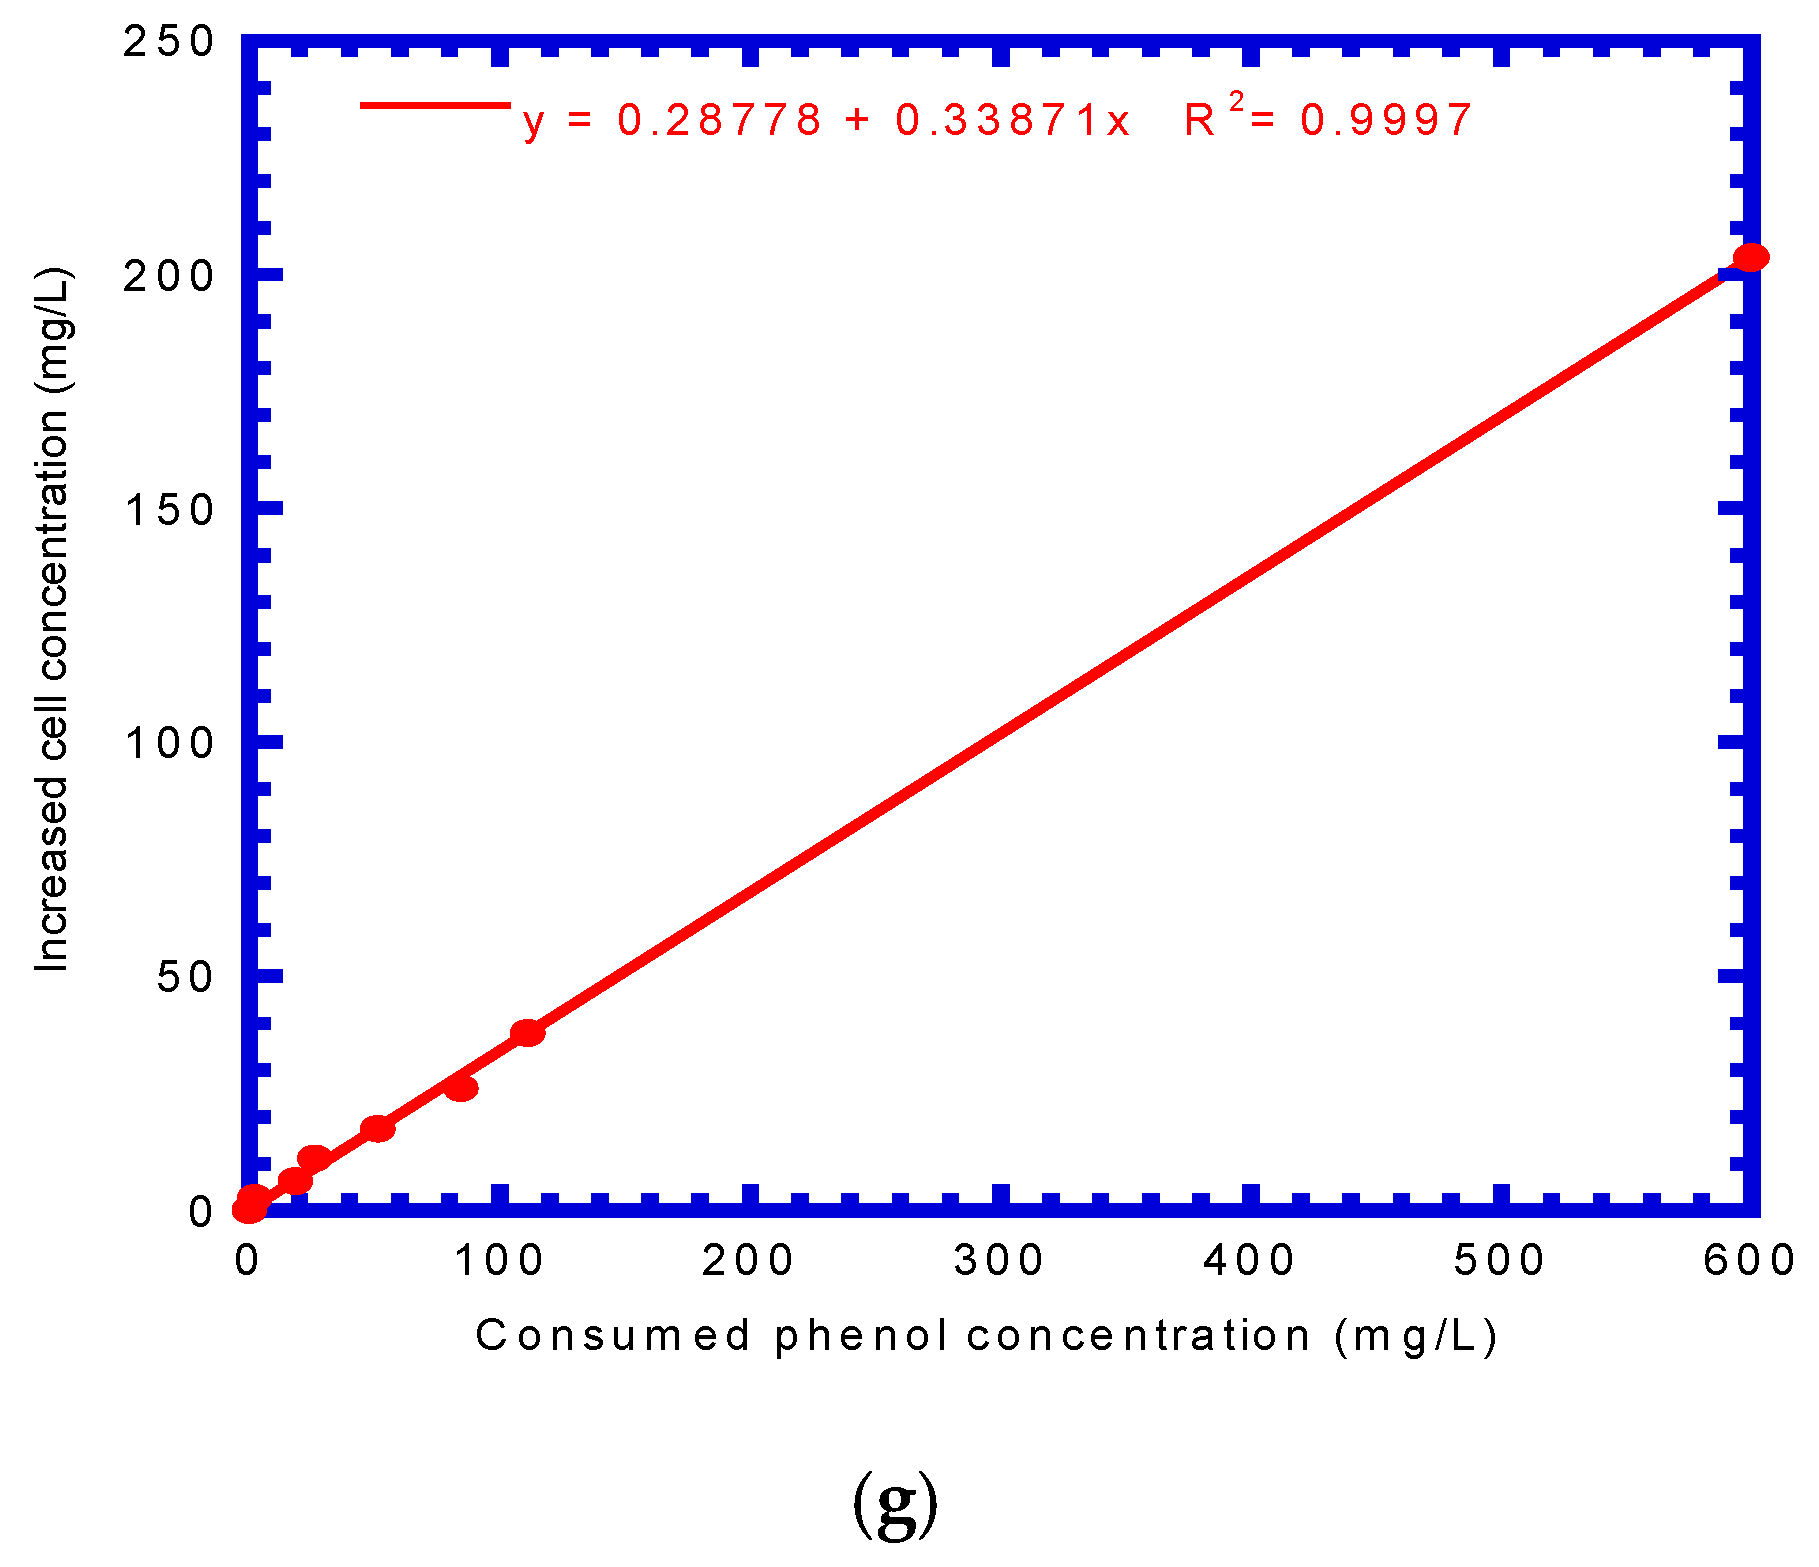
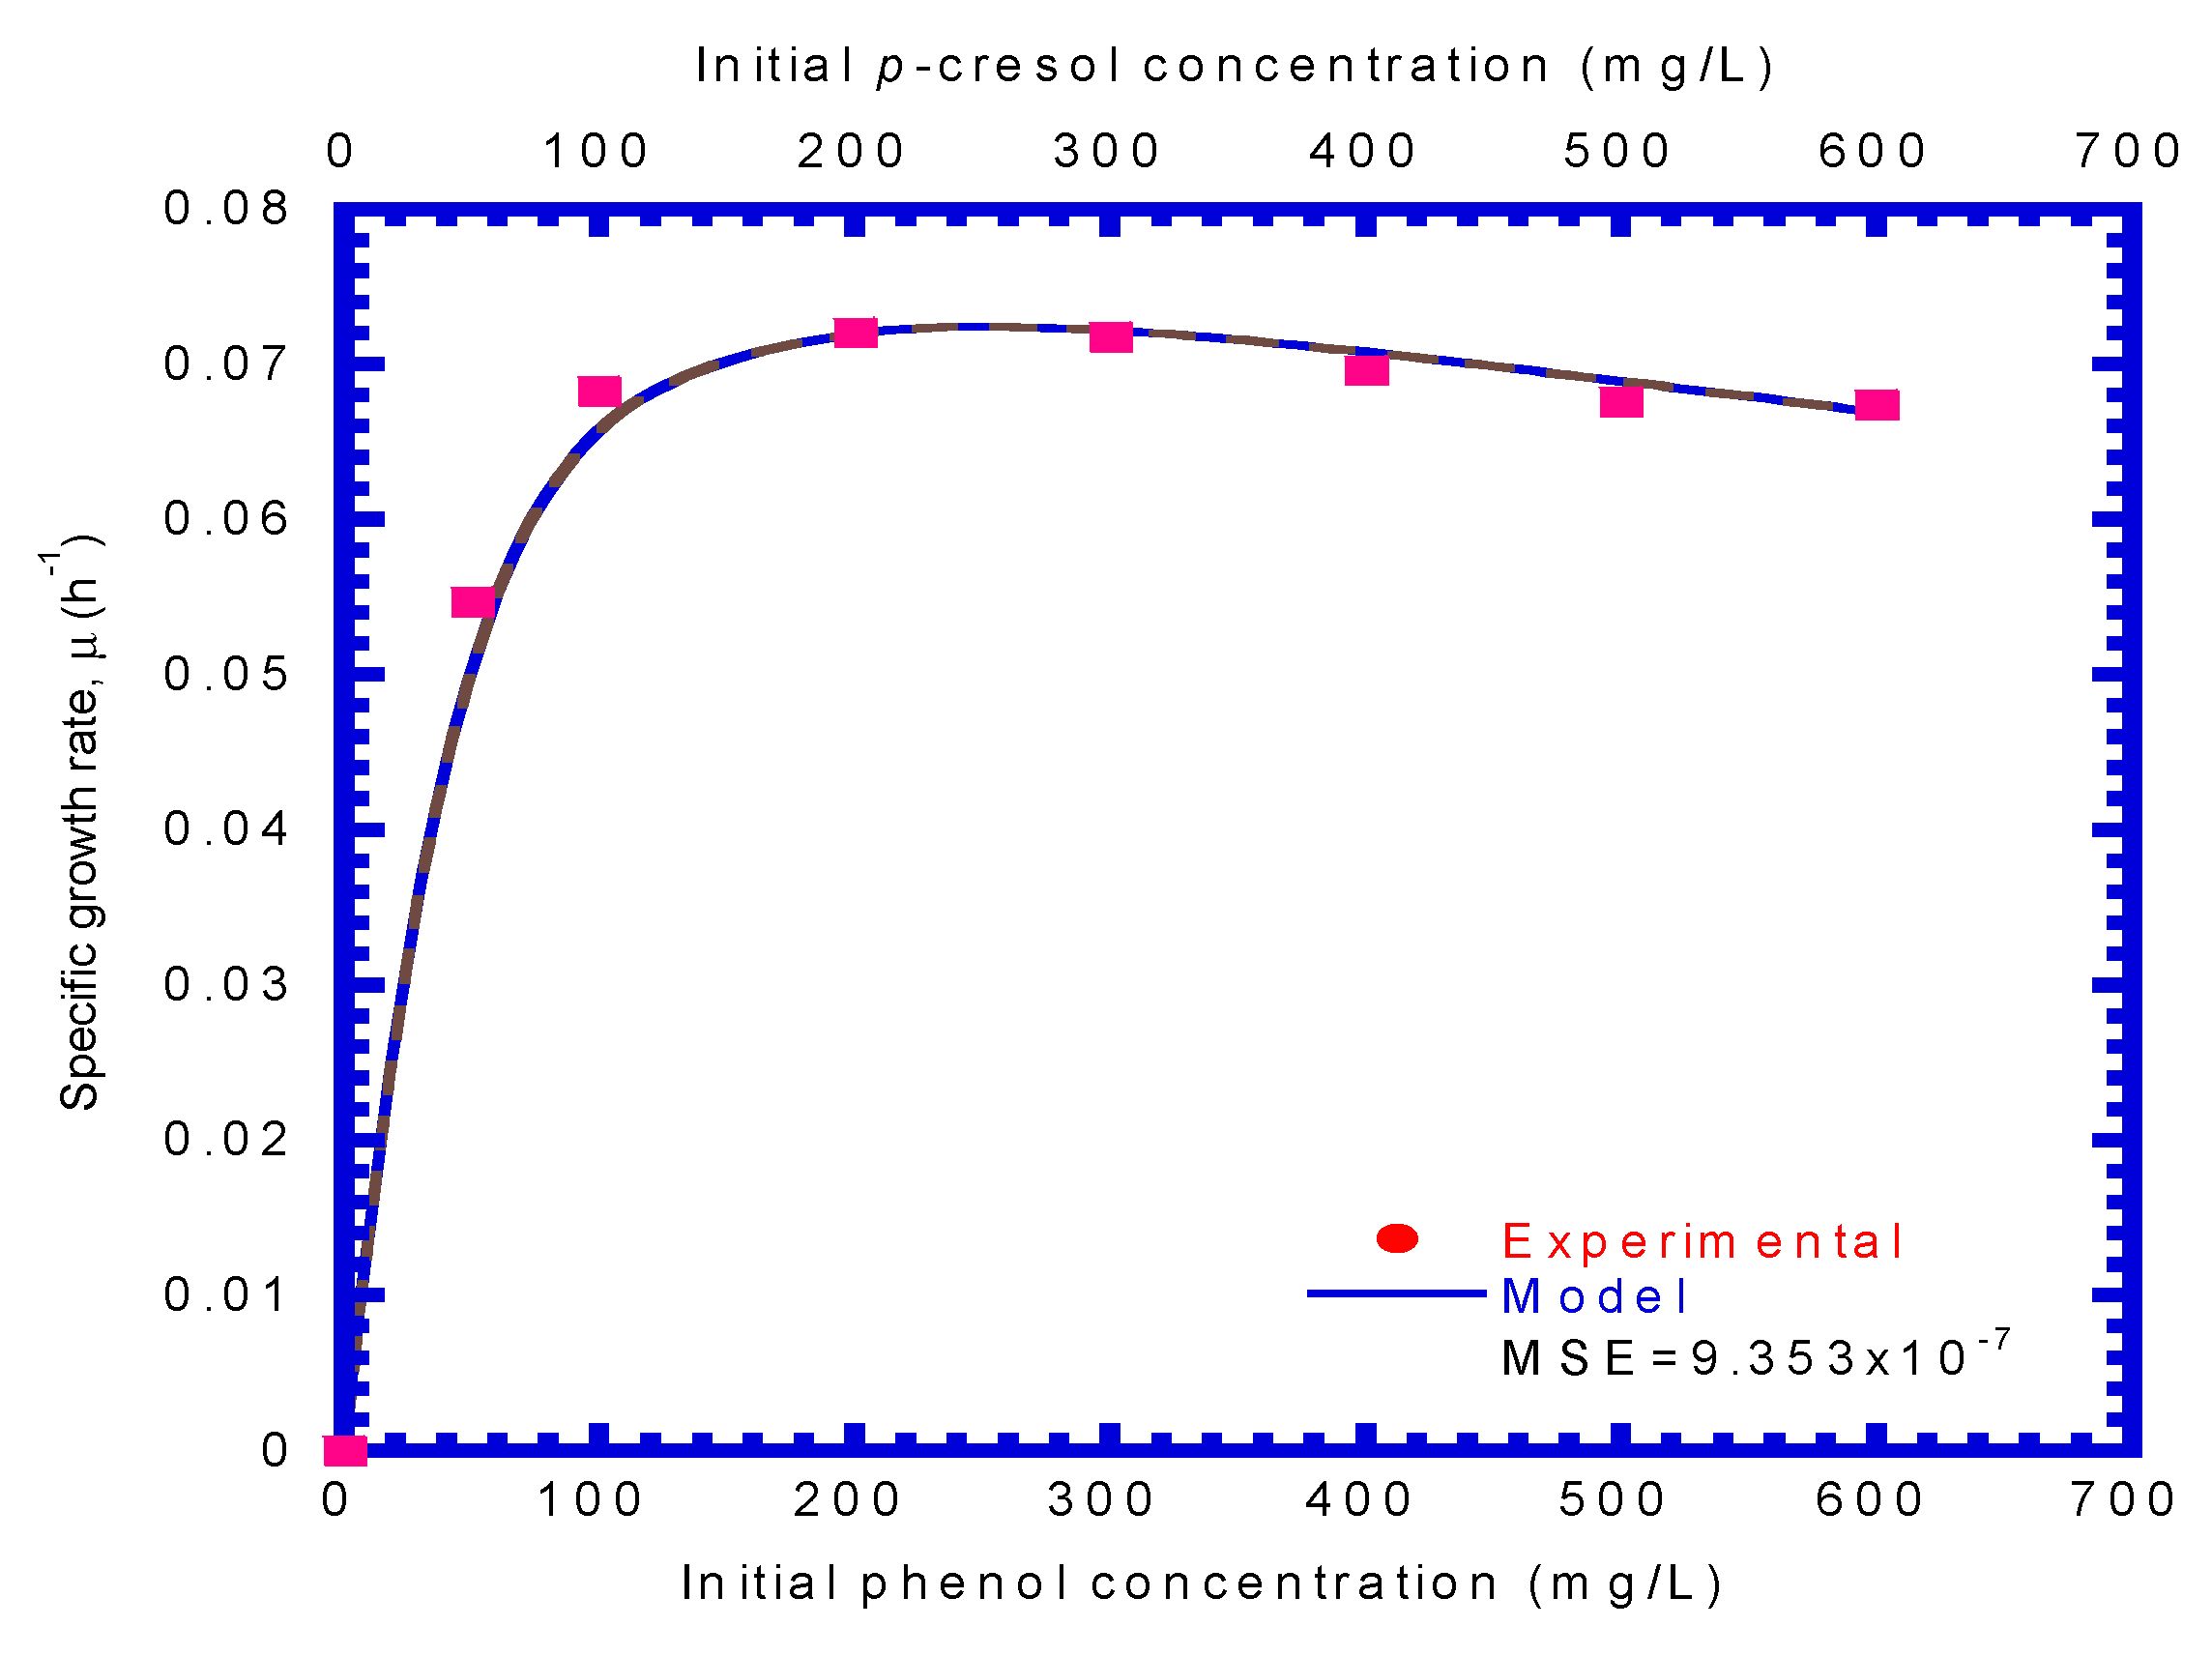
4.2. P. putida Cells Growth on Phenol or p-Cresol

Figure 5a plots ln(X/X0) versus time to determine the specific growth rate of the cell on phenol. The specific growth rate on phenol was ranged from 0.0769 to 0.175 h−1. Figure 5b illustrates the ln(X/X0) plotted with time at varying initial p-cresol concentration and cell concentrations. The range of the specific growth rate on p-cresol was 0.0515–0.082 h−1. As shown in Figure 6 and Figure 7, it is noted that the P. putida cells had the maximum specific growth rate as the initial phenol and p-cresol concentrations were approximately 220 and 140 mg L−1, respectively. The cells growth was inhibited when the initial phenol and p-cresol concentrations were greater than 220 and 140 mg L−1, respectively. The batch experimental data were fitted by Haldane’s kinetics to obtain the bio-kinetic values of μmax Ks and Ki on phenol and p-cresol, respectively, by a non-linear least squares regression method using the Excel software [27]. Haldane’s equations for phenol and p-cresol with the best-fit bio-kinetic parameters were yielded as follows:
Phenol :   μ P = 0.45 S P 221.4 + S P + S P 2 / 310.5
P - cresol :   μ C = 0.185 S C 65.1 + S C + S C 2 / 243.56
where μP and μC are the specific growth rates of P. putida cells on phenol and p-cresol, respectively. The μmax, Ks, and Ki values for phenol were 0.45 h−1, 221.4, and 310.5 mg L−1, respectively. The μmax, Ks, and Ki values for p-cresol were 0.185 h−1, 65.1, and 243.56 mg L−1, respectively. The cells with a higher maximum specific growth rate utilized phenol more faster than p-cresol. In addition, the larger Ks value on phenol resulted in a lower affinity of cells to phenol. The higher Ki value on phenol (310.5 mg L−1) displayed that the cells had a stronger resistance to phenol inhibition than to p-cresol (243.56 mg L−1). A higher inhibition to cells growth by p-cresol than that by phenol was observed, as the initial concentration was over 200 mg L−1. The phenol biodegradation by P. putida shows the μmax value for phenol (0.45 h−1) falling between 0.33 and 0.90 h−1 according to the literature survey [29,30,31]. The Ki value for phenol obtained here (310.5 mg L−1) also falls within the ranges of 54.1–669.0 mg L−1 [29,30,31]. The Ks value (221.4 mg L−1) for phenol obtained in this study was close to that obtained from the study of Banerjee et al. [32]. The Ks value obtained in their study was 190.8 mg L−1.
As plotted in Figure 8 and Figure 9, the growth yield (Y) of cells on phenol and p-cresol was estimated from batch tests data using Equation (3), respectively. The calculated values of Y on phenol and p-cresol are listed in Table 1. The growth yields on phenol were in the range of 0.337–0.343 mg mg−1 under initial phenol concentrations ranging from 50 to 600 mg L−1. The average growth yield on single phenol (YP) was 0.340 mg mg−1 and the standard deviation value was 2.116 × 10⁻³. The growth yield on single p-cresol (YC) varied from 0.274 to 0.283 mg mg−1 to acquire a mean value of 0.279 as well as a standard deviation value of 2.769 × 10⁻³. Abuhamed et al. [33] carried out batch tests with various initial phenol concentrations of 10–200 mg L−1. Their experiment results revealed that the Y value was 0.44 mg mg−1, which is greater than the Y value obtained in this study due to the lower initial phenol concentrations.

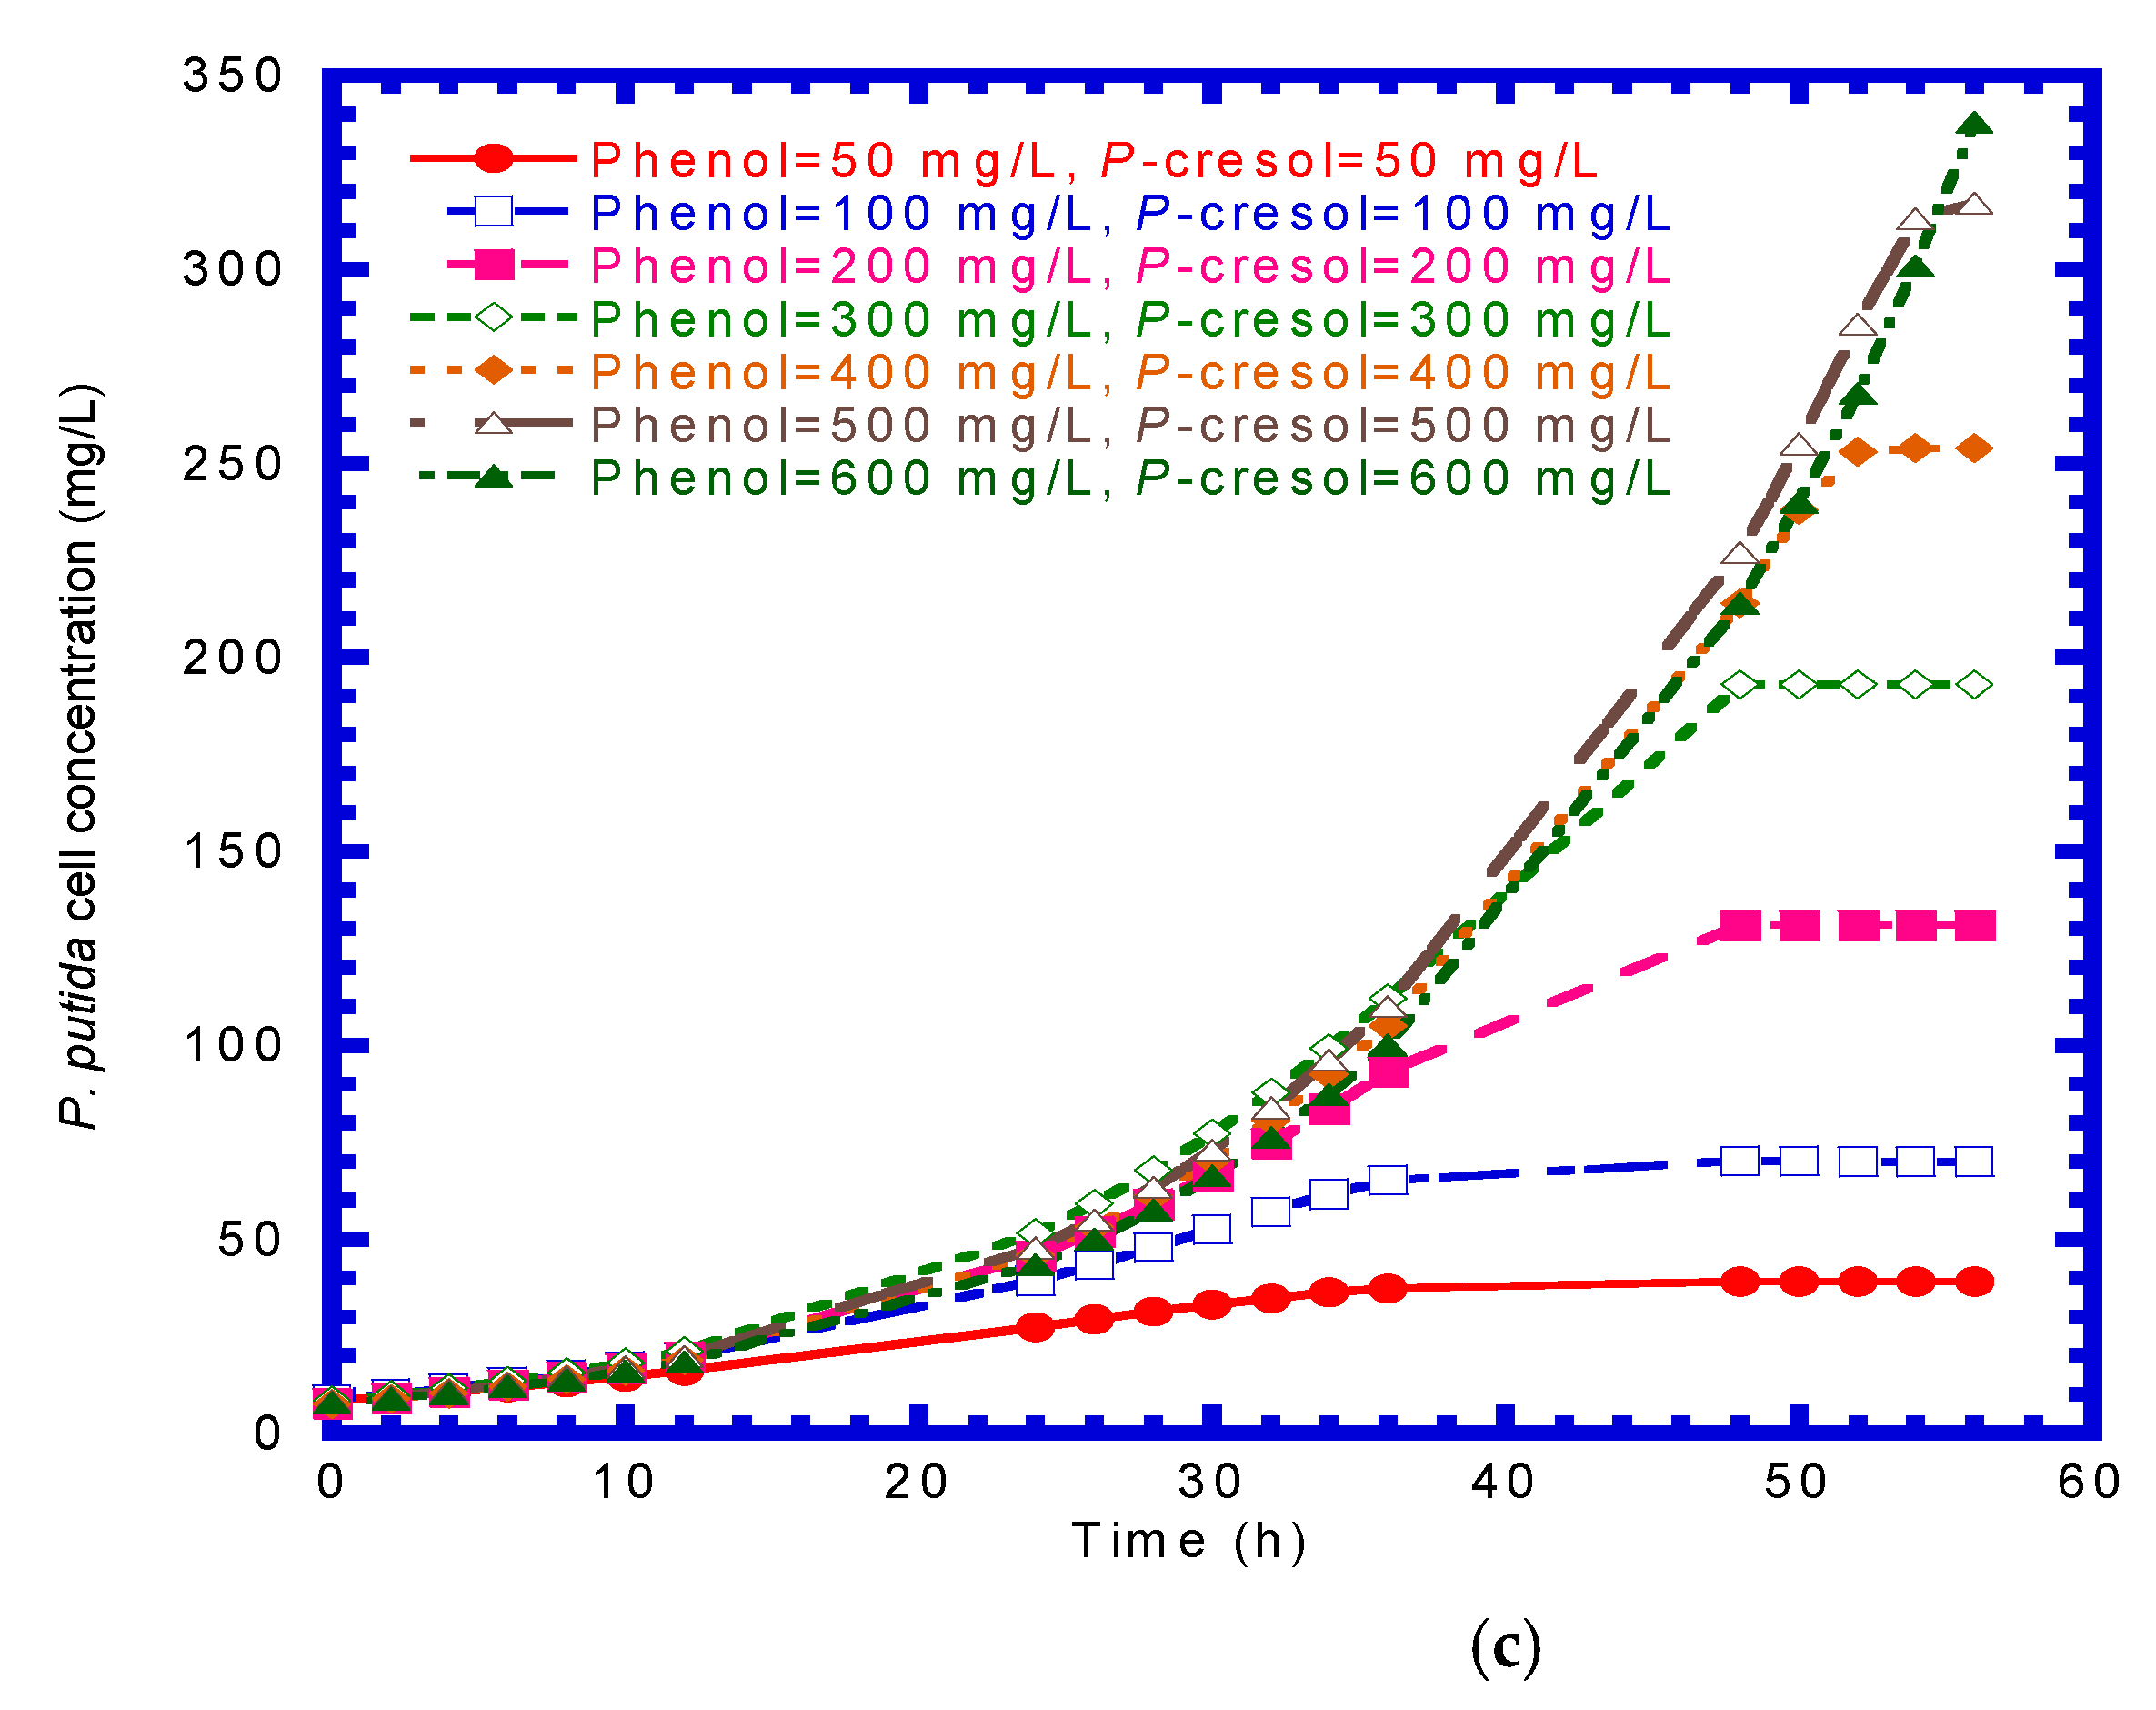
4.3. Phenol Plus p-Cresol in Binary Substrates System

The biodegradation of phenol plus p-cresol and the growth of P. putida cells is illustrated in Figure 10. As plotted in Figure 10a, the time required for the complete removal of phenol was 52–56 h for the initial phenol concentration ranging from 50 to 500 mg L−1. However, the phenol removal was about 96.8% as the operating time was 56 h. As shown in Figure 10b, the time needed to remove p-cresol completely was 48–56 h for the initial p-cresol concentration between 50 and 500 mg L−1. At the operating time of 56 h, only 79.7% removal efficiency for p-cresol was attained.
Seven batch experiments were carried out at 30 °C to determine the interaction parameters of IC,P and IP,C using the non-linear least-squares regression method [27]. The cell growth in the binary system varied with time, which is plotted in Figure 10c. The specific growth rates on binary phenol plus p-cresol ranged from 0.185 to 0.204 d−1 under different initial phenol and p-cresol contents. Figure 11 presents the specific growth rate of the cell on phenol plus p-cresol. The bio-kinetic parameters of IC,P and IP,C were determined by fitting experimental data to sum the model. The kinetic parameters (μm, Ks, and Ki) in the equation are the same as those presented in the Haldane’s equations for phenol and p-cresol biodegradation [34]. The best-fitted sum kinetic Equation (21) was given as:
μ = 0.45 S P 221.4 + S P + S P 2 / 65.1 + 4.8 S C + 0.185 S C 65.1 + S C + S C 2 / 243.56 + 12.7 S P .
The values of IC,P and IP,C were 4.8 and 12.7, respectively, with a correlation coefficient (R2) of 0.989.

4.4. Mass Transfer Coefficients

Wakao and Smith [35] proposed a random pore model to determine the effective diffusivity in gel beads. Furthermore, Korgel et al. [36] used the random pore model to predict the galactose effective diffusivity in the entrapped cell system. Based on the random pore model, the effective diffusivity (De) is described as
D e = D s ( 1 β X ) 2
where Ds is the diffusion coefficient in gel beads (cm2 d−1); X is cell concentration (g L−1); and β is the specific volume of cells (L g−1). The values of X and α are 0.496 g L−1 and 3.842 × 10⁻³ L g−1 using the proposed measurement methods of Ju and Ho [37]. The diffusion coefficient (Ds) of phenol and p-cresol in gel beads employed in a continuous stirred-tank bioreactor is regarded as the same as that in water. The formula derived from Wilke and Chang [38] was used to calculate the values of Ds for phenol and p-cresol, which was 0.949 and 0.856 cm2 d−1, respectively. The effective diffusivity (De) of phenol and p-cresol was 0.945 and 0.853 cm2 d−1, respectively. The following equation was applied to estimate the mass transfer coefficient kf [39]
k f = S h · D s d p
where Sh is Sherwood number = {4 + 1.21(Re)2/3(Sc)2/3}1/2, Re is Reynolds number, and Sc is Schmidt number. The value of Re for both phenol and p-cresol was 38.7. The value of Sc for phenol and p-cresol was 724.7 and 803.4, respectively. The value of Sh for phenol and p-cresol was 33.48 and 34.65, respectively. By substituting these values into Equation (23), the mass transfer coefficient kf for phenol and p-cresol was 105.91 and 98.87 cm d−1, respectively.

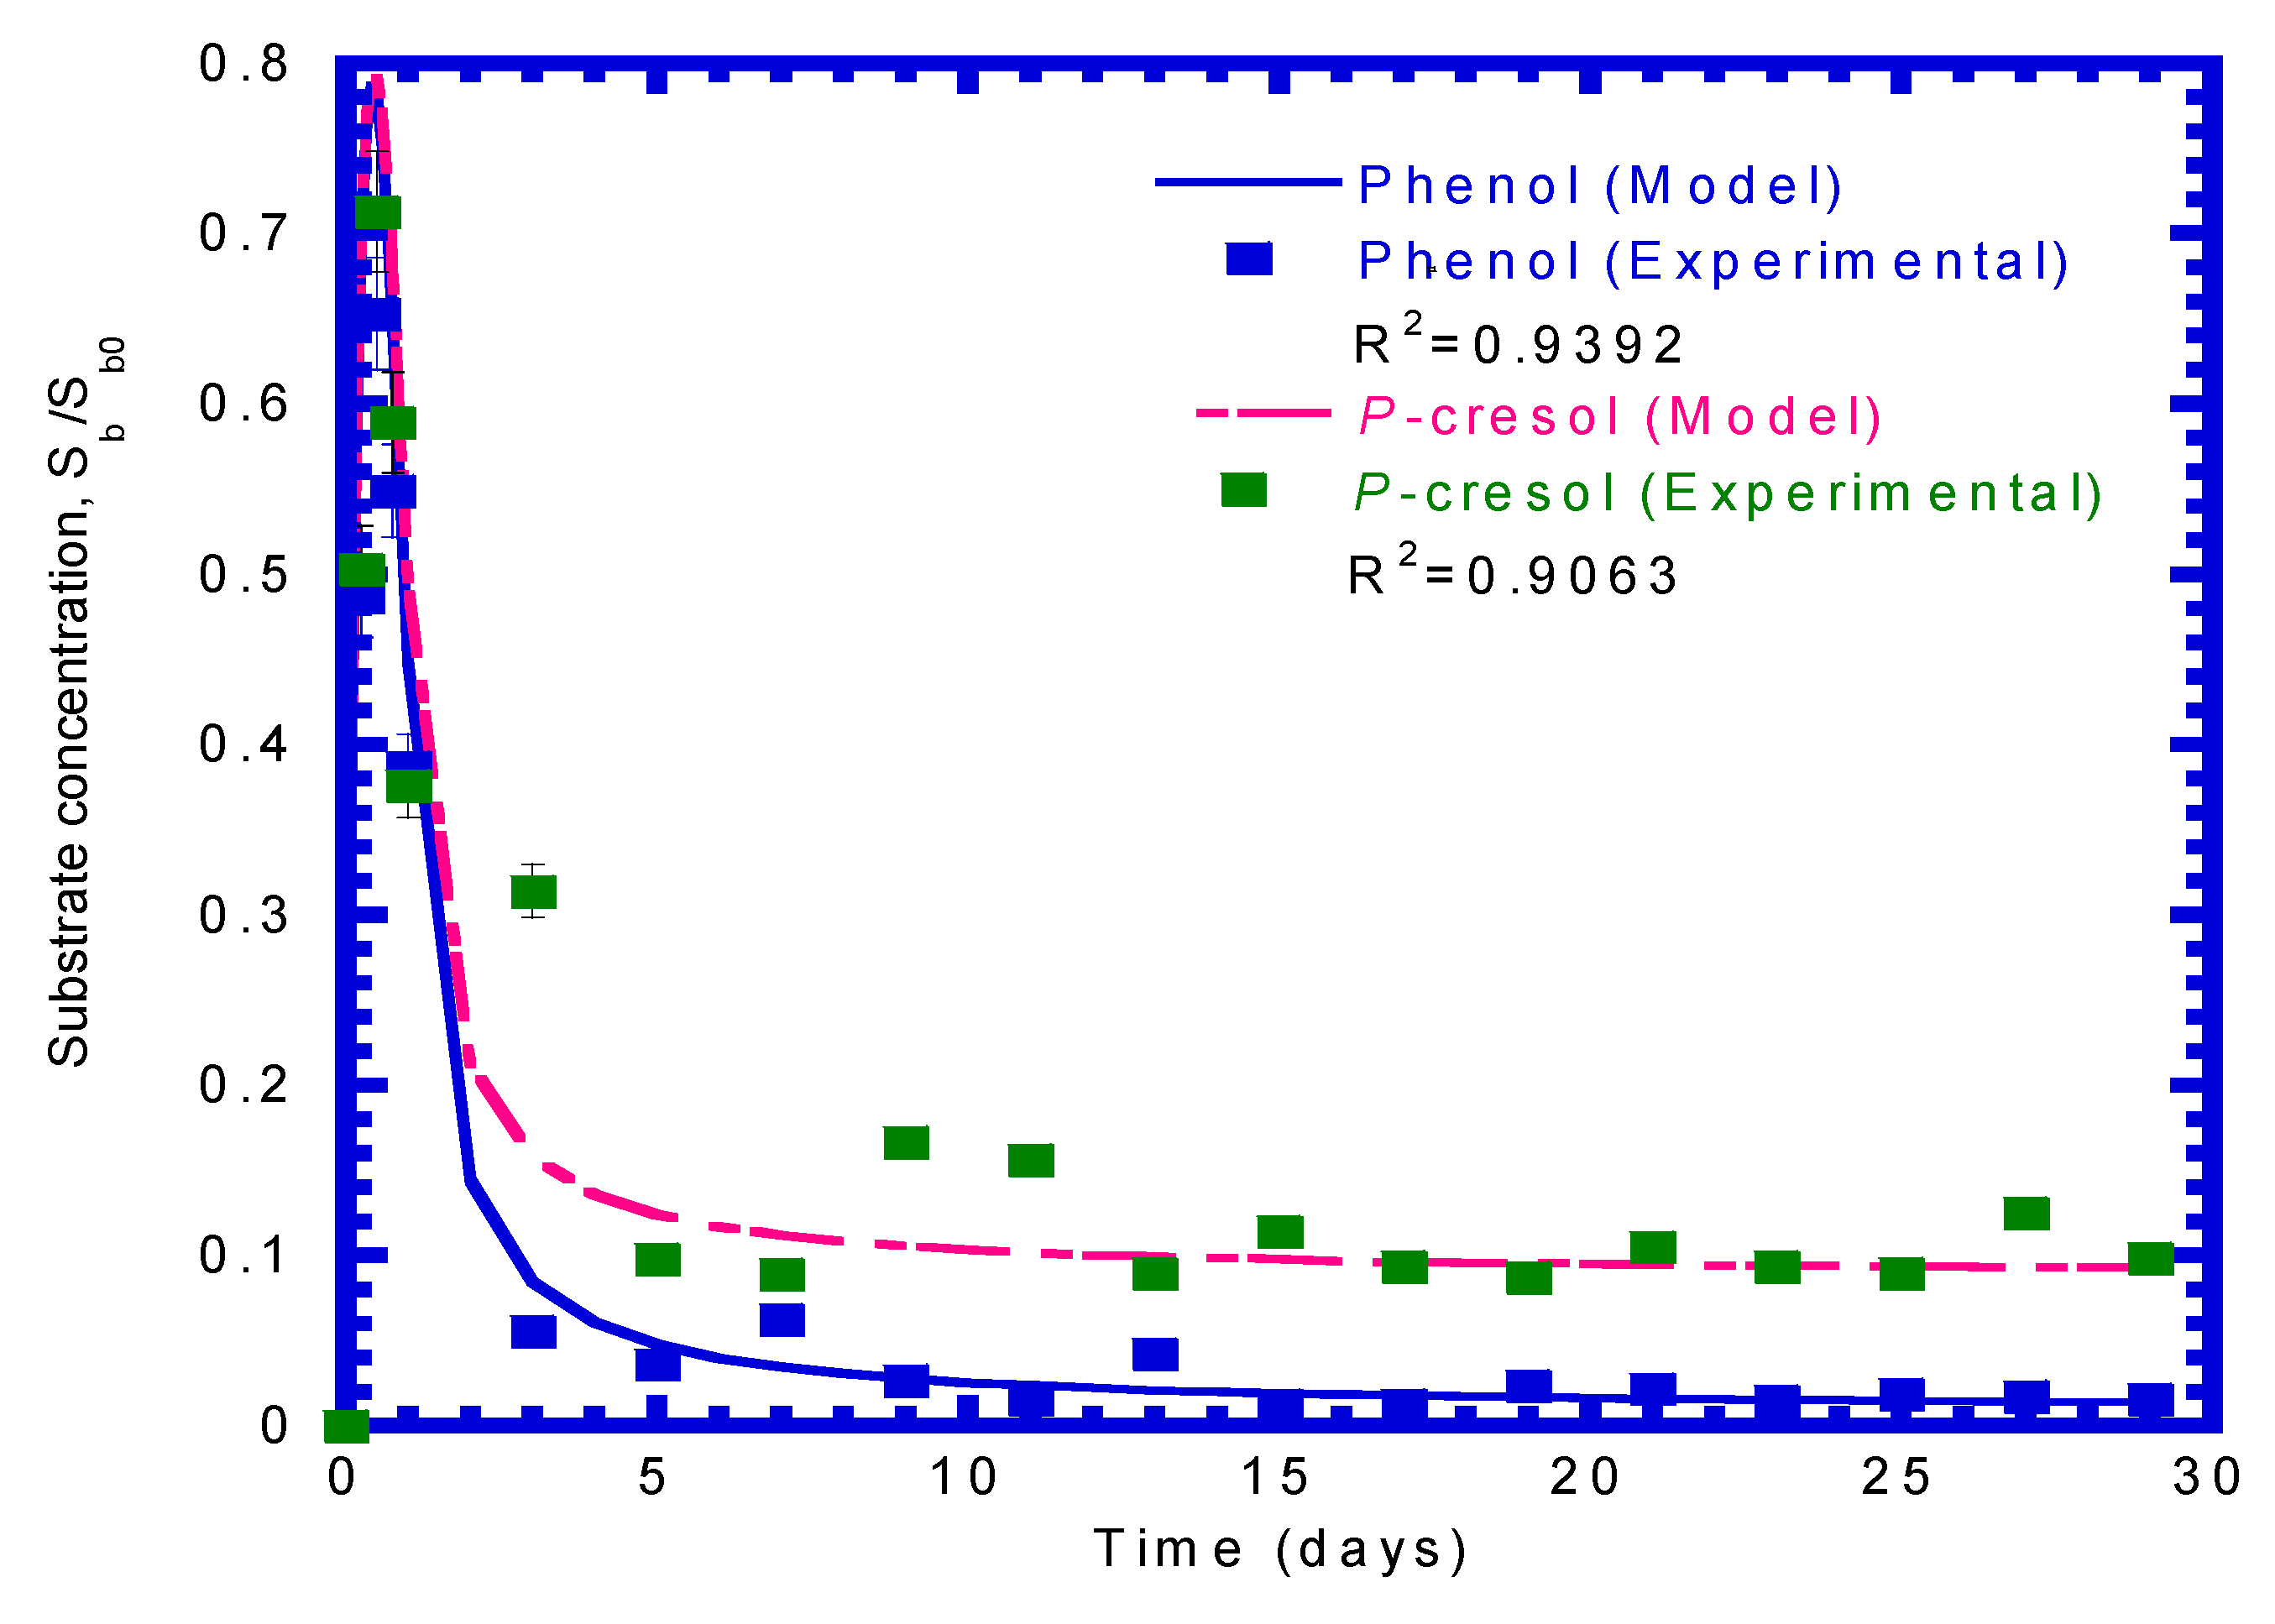
4.5. Biodegradation of Phenol and p-Cresol in Immobilized Cells

In order to validate the kinetic model system described above, phenol and p-cresol concentrations in bulk liquid phase estimated by the kinetic model were compared with the experimental results under 125 mg L−1 initial concentrations of phenol and p-cresol, respectively, in the feed. Table 2 summarized the bio-kinetic and reactor parameters as well as operating conditions applied in kinetic model simulation as reported earlier in the various batch tests.
Figure 12 plots the model-predicted and experimental data of phenol and p-cresol effluent concentrations against time. The effluent curve of phenol concentration consists of three segments. During a half day, the phenol and p-cresol concentrations increased sharply to 81.6 (0.653 Sb0,p) and 89.1 (0.713 Sb0,c) mg L−1. No significant biodegradation of phenol and p-cresol was carried out during the half day. The phenol and p-cresol concentration curves were considered as the typical dilute-in curves, which is characteristic of a continuous stirred-tank bioreactor, while the bioreactor was filled with only nutrient media at the onset of the tests. The second segment of the phenol and p-cresol curves ran from day 0.5 to day 7, when the curves started to deviate from the peak of the dilute-in curves. The effluent concentrations of phenol and p-cresol leveled off and then decreased. Obviously, the immobilized cell markedly degraded phenol and p-cresol during this period, owing to the active growth of cells. The third segment of the phenol and p-cresol concentration curves ran from day 7 day 29. During this period, the immobilized cells system achieved a steady state, and the effluent concentration phenol and p-cresol was approximately 2.95 (0.0236 Sb0,p) and 13.63 (0.109 Sb0,c) mg L−1, respectively. The removal efficiency for phenol and p-cresol was 97.6% and 89.1%, respectively, under a steady-state condition. The model simulations are in satisfactory agreement with the test results with a correlation coefficient (R2) of 0.9392 for phenol and 0.9063 for p-cresol.
The batch bioreactors were performed by Yadzir et al. [40], who found that the encapsulated cells of Acinetobacter baumannii in the Ca-alginate beads had the ability to remove phenol up to 2000 mg L−1 within 12 d. In their study, they also found that there was no loss of Ca-alginate activity during five cycles of batch tests. Basak et al. [41] employed sugarcane bagasse as a low-cost immobilization matrix for cells entrapment in the upflow packed bed reactor to assess phenol degradation under different influent flow rates. The experimental results exhibited that the phenol removal efficiency reached up to 97%, while the feed initial phenol concentration was 2400 mg L−1 and the flow rate was controlled at 4 mL min−1 within the operating times of 54 h. Furthermore, Dong et al. [42] combined a zeolite imidazole framework (ZIF-8) with hydrochloric acid-modified SEP (CESEP) to form a nanocomposite CESEP/ZIF-8 for P. putida immobilization, which provided adsorption and biodegradation mechanisms for phenol removal. The experimental results exhibited that phenol at initial concentrations of 10 and 20 mg L−1 was effectively removed within 13 and 24 h as compared to 21 and 36 h for phenol removal by free P. putida alone.

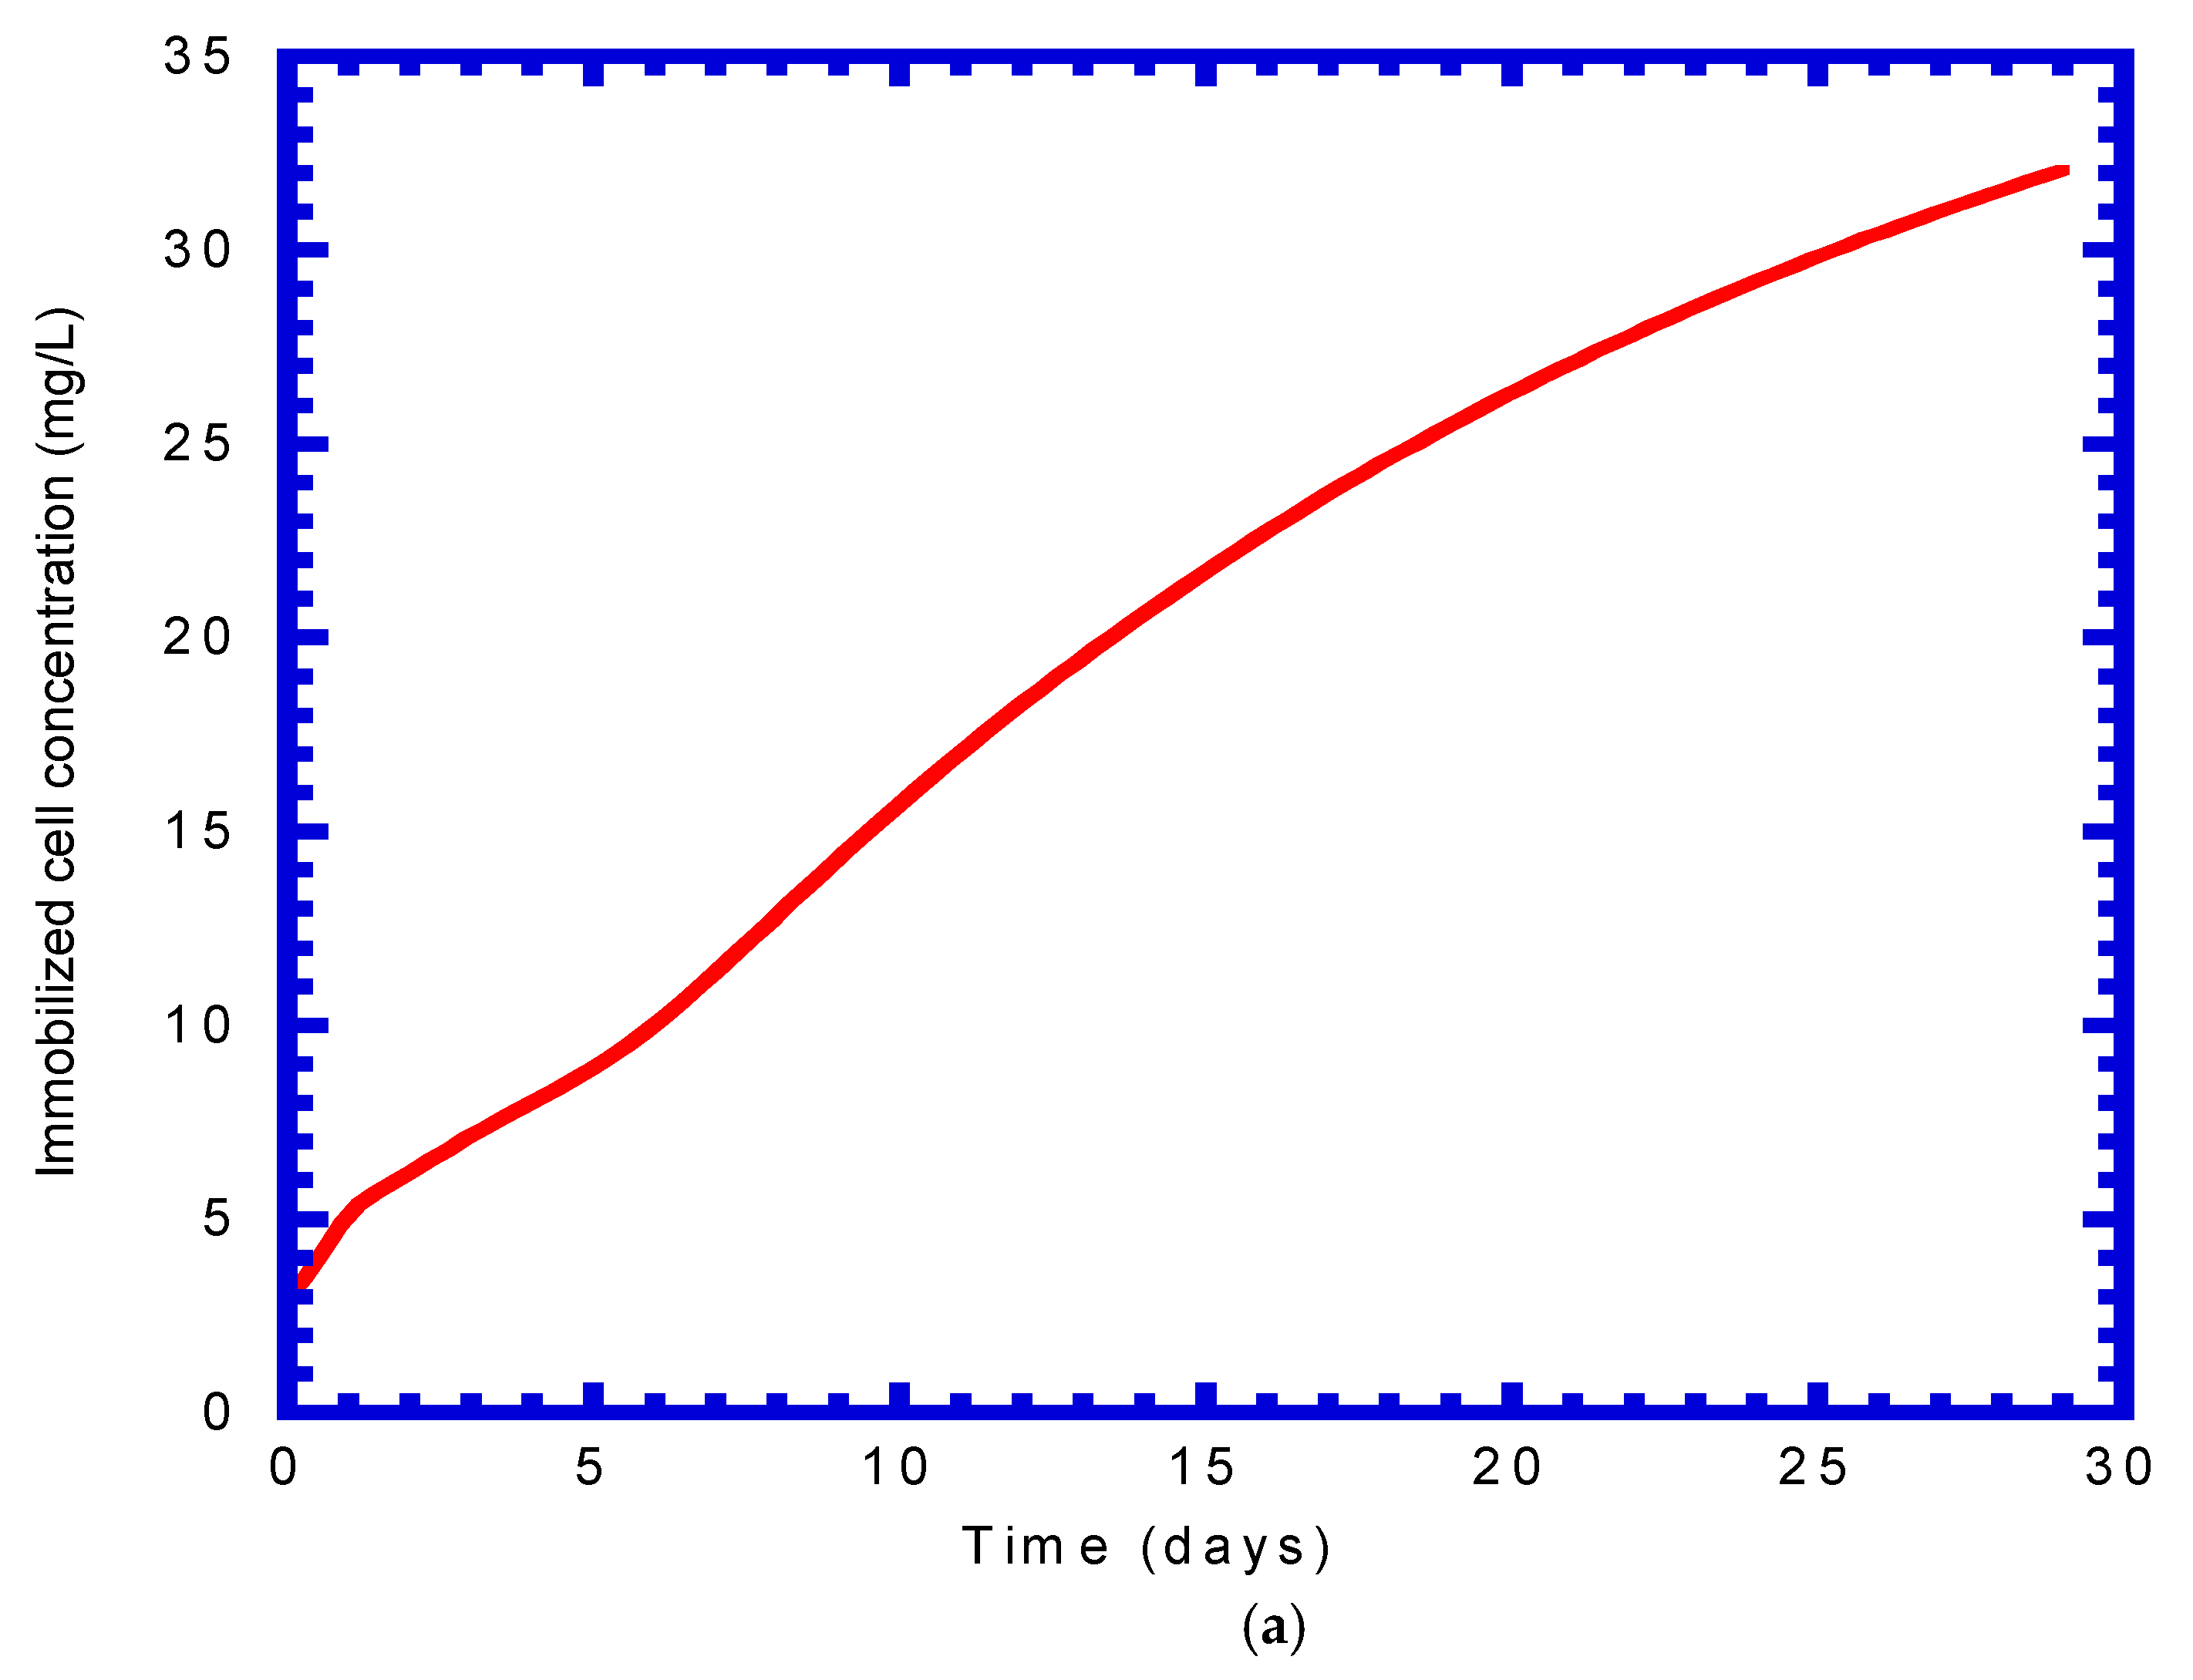
4.6. Immobilized Cells Growth

Figure 13a presents the immobilized cells growth as a function of time by model prediction. As can be seen, there is no the elapsed time required for immobilized cells to start to grow. The model predicted that the immobilized cells vigorously grew to utilized phenol at a transient-state period from 5 to 25 days. The growth of immobilized cells reached up to a maximum value of around 32 mg L−1.

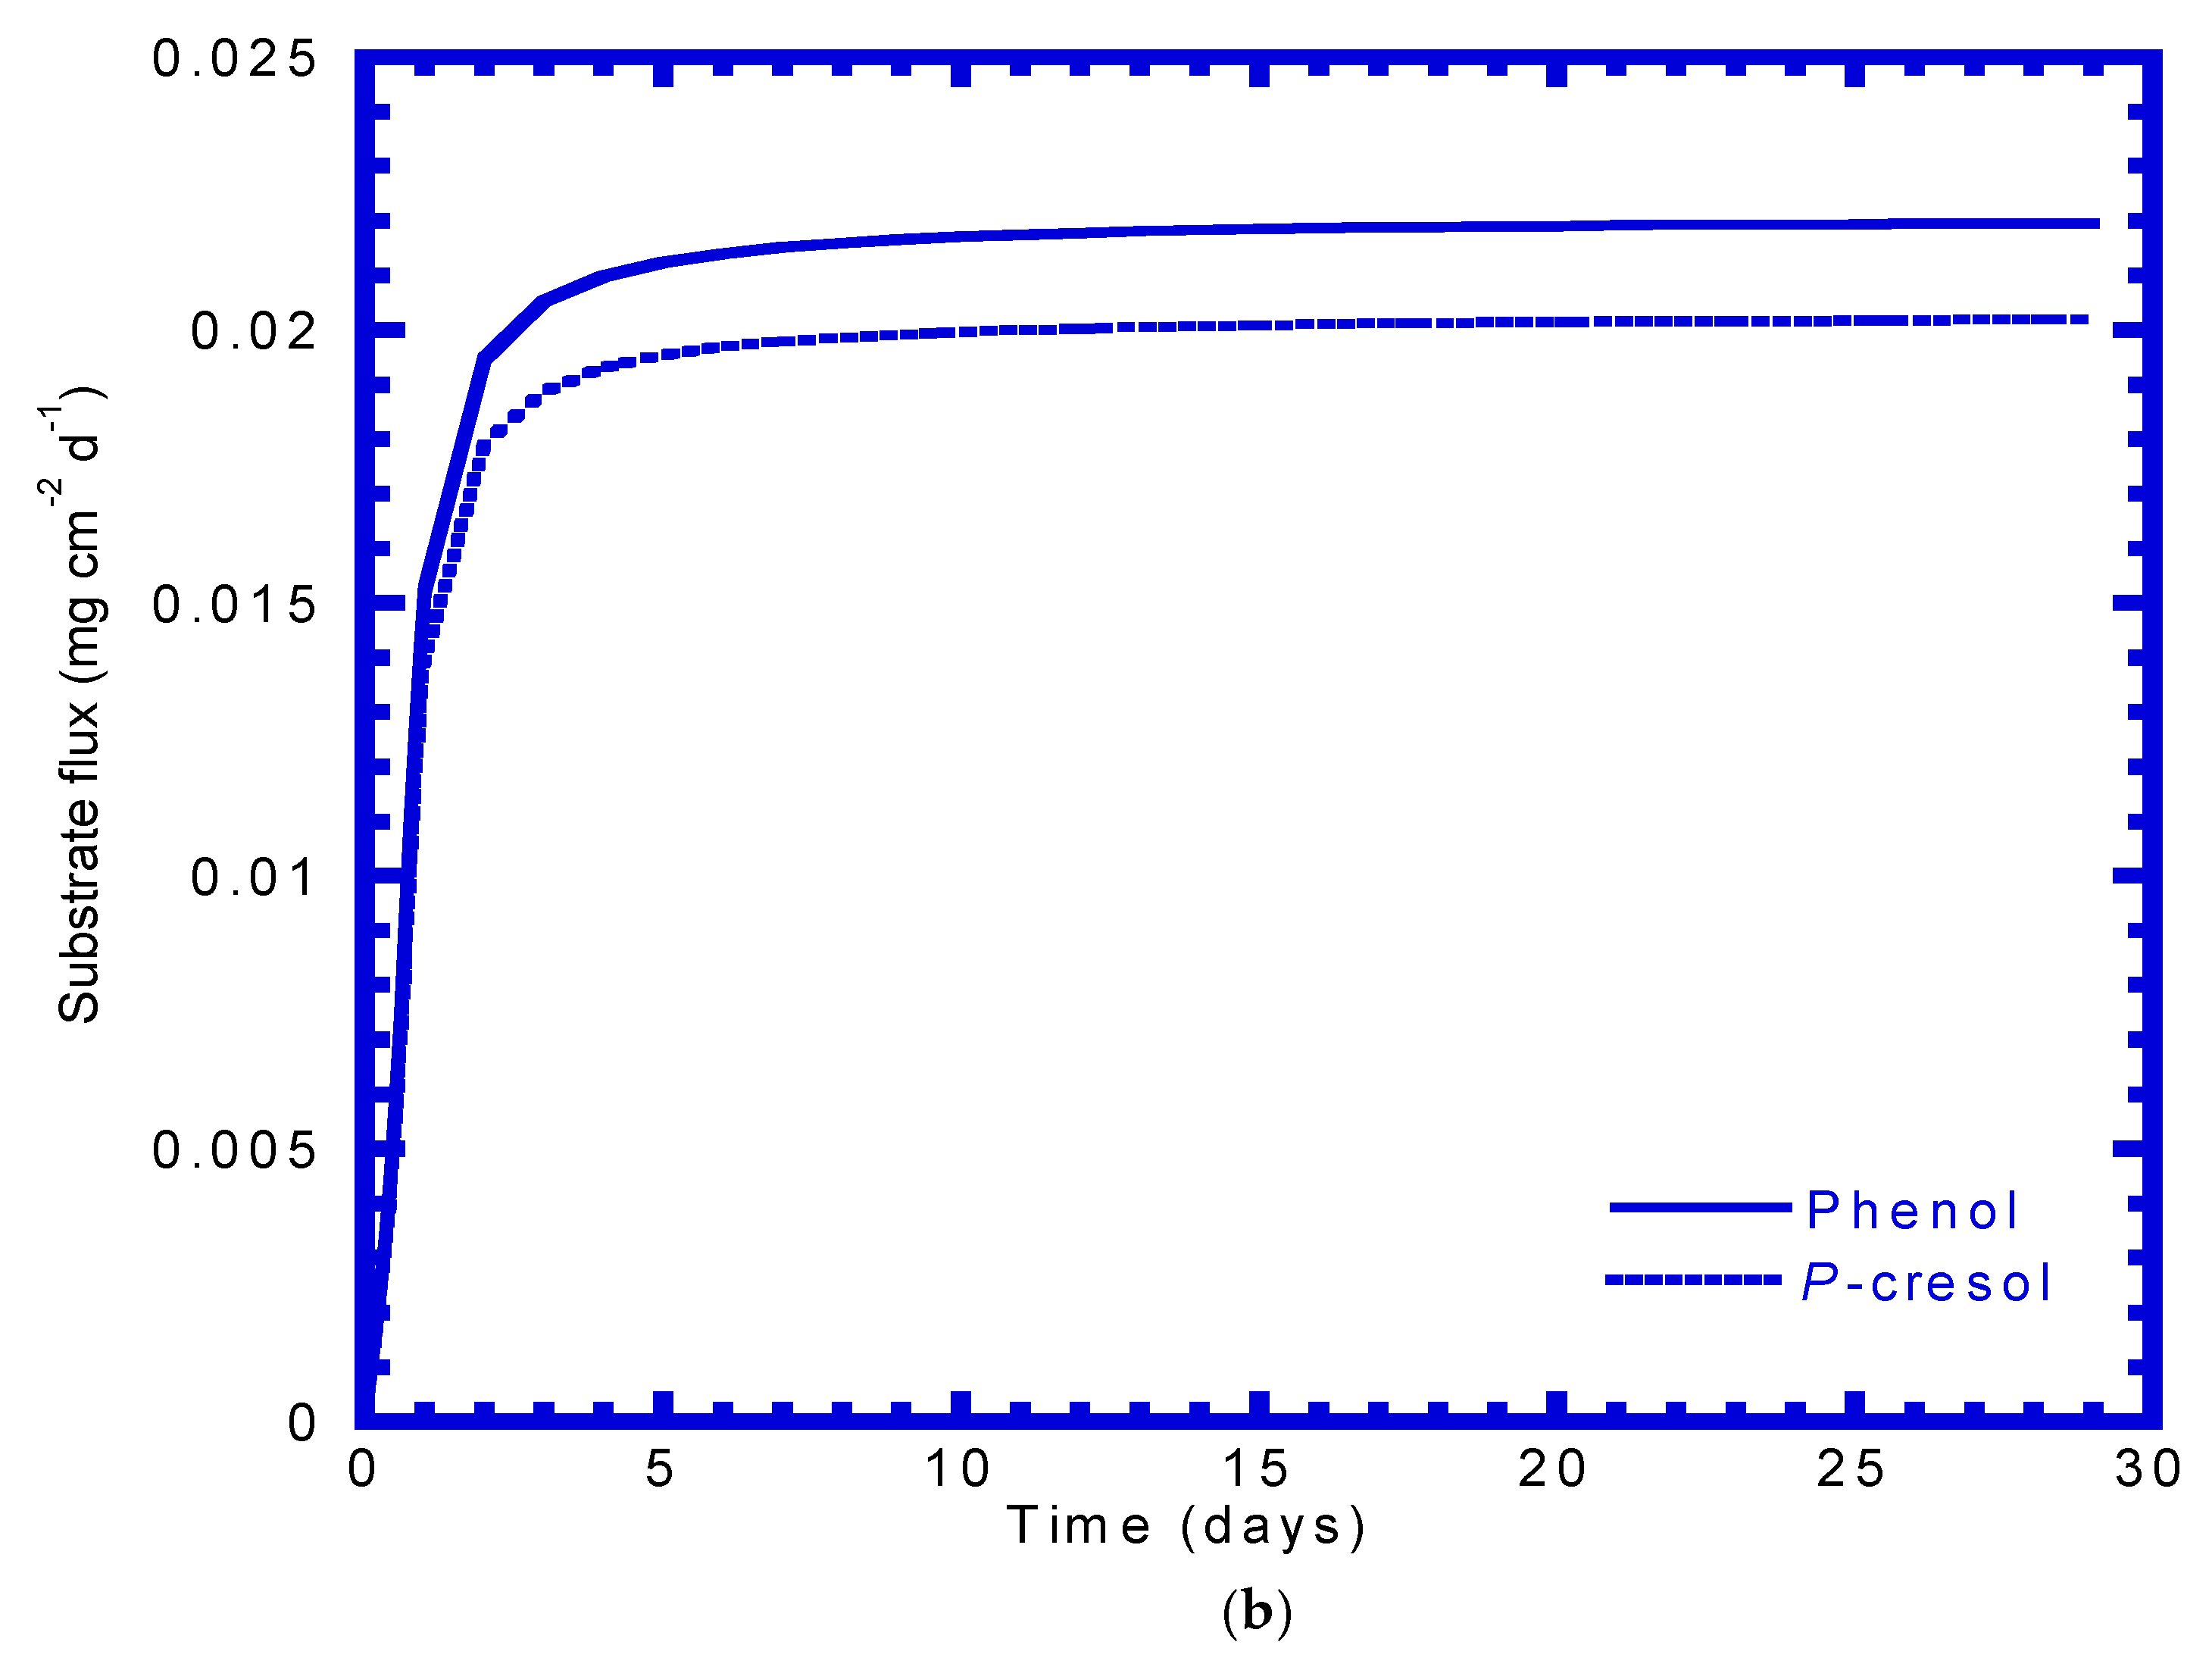
4.7. Flux into Gel Bead

Figure 13b plots the model-predicted fluxes of phenol and p-cresol that diffuses from the bulk liquid into the bead. Flux represents the phenol utilization by immobilized cells. At the beginning of the experiment, the flux started at zero, and the immobilized cell growth was negligible. The flux of the immobilized cells increased abruptly at a logarithmic rate for the first four days. During this period, the immobilized cells vigorously degraded phenol and p-cresol in the bead—thus the difference between the concentrations of phenol and p-cresol in the bulk liquid and that at the bead/liquid interface increased, significantly increasing the fluxes of phenol and p-cresol into the beads due to biological activity. During days 4–29, the phenol and p-cresol concentrations in the effluent reached a constant concentration in a steady-state condition. The fluxes of phenol and p-cresol reached a maximal constant value, respectively, which was approximately 0.0220 and 0.0202 mg cm−2 d−1.

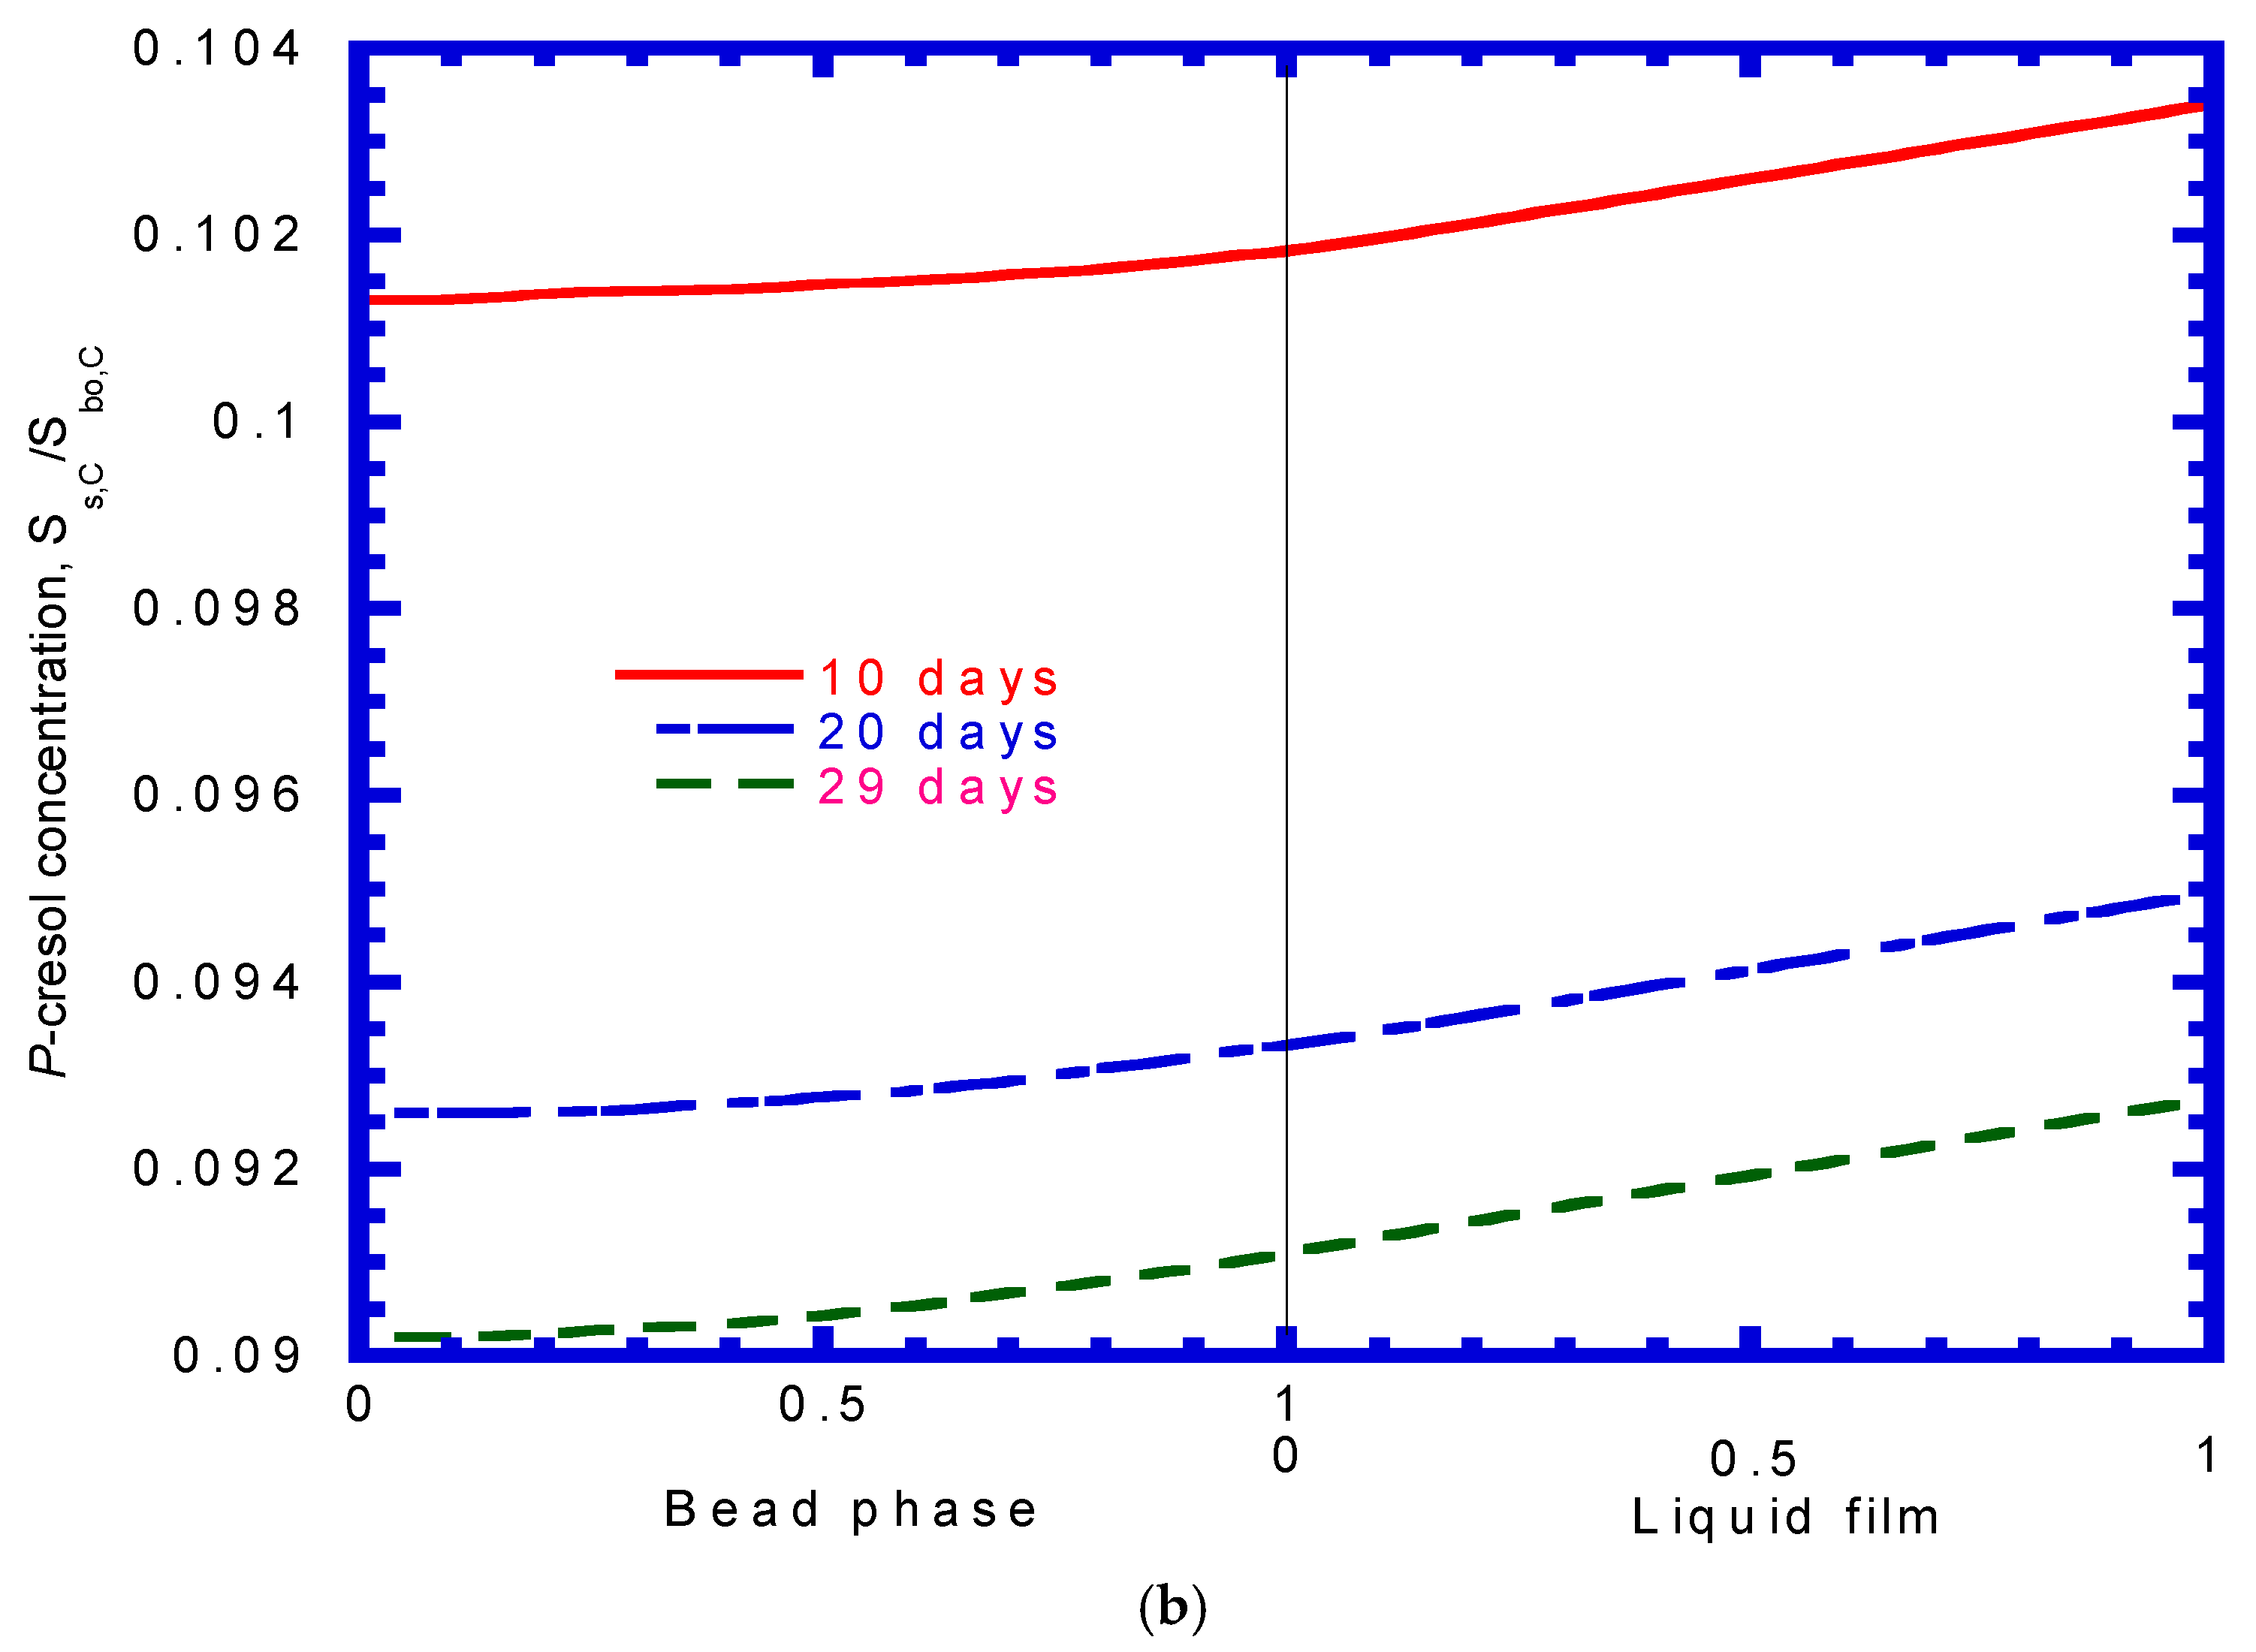
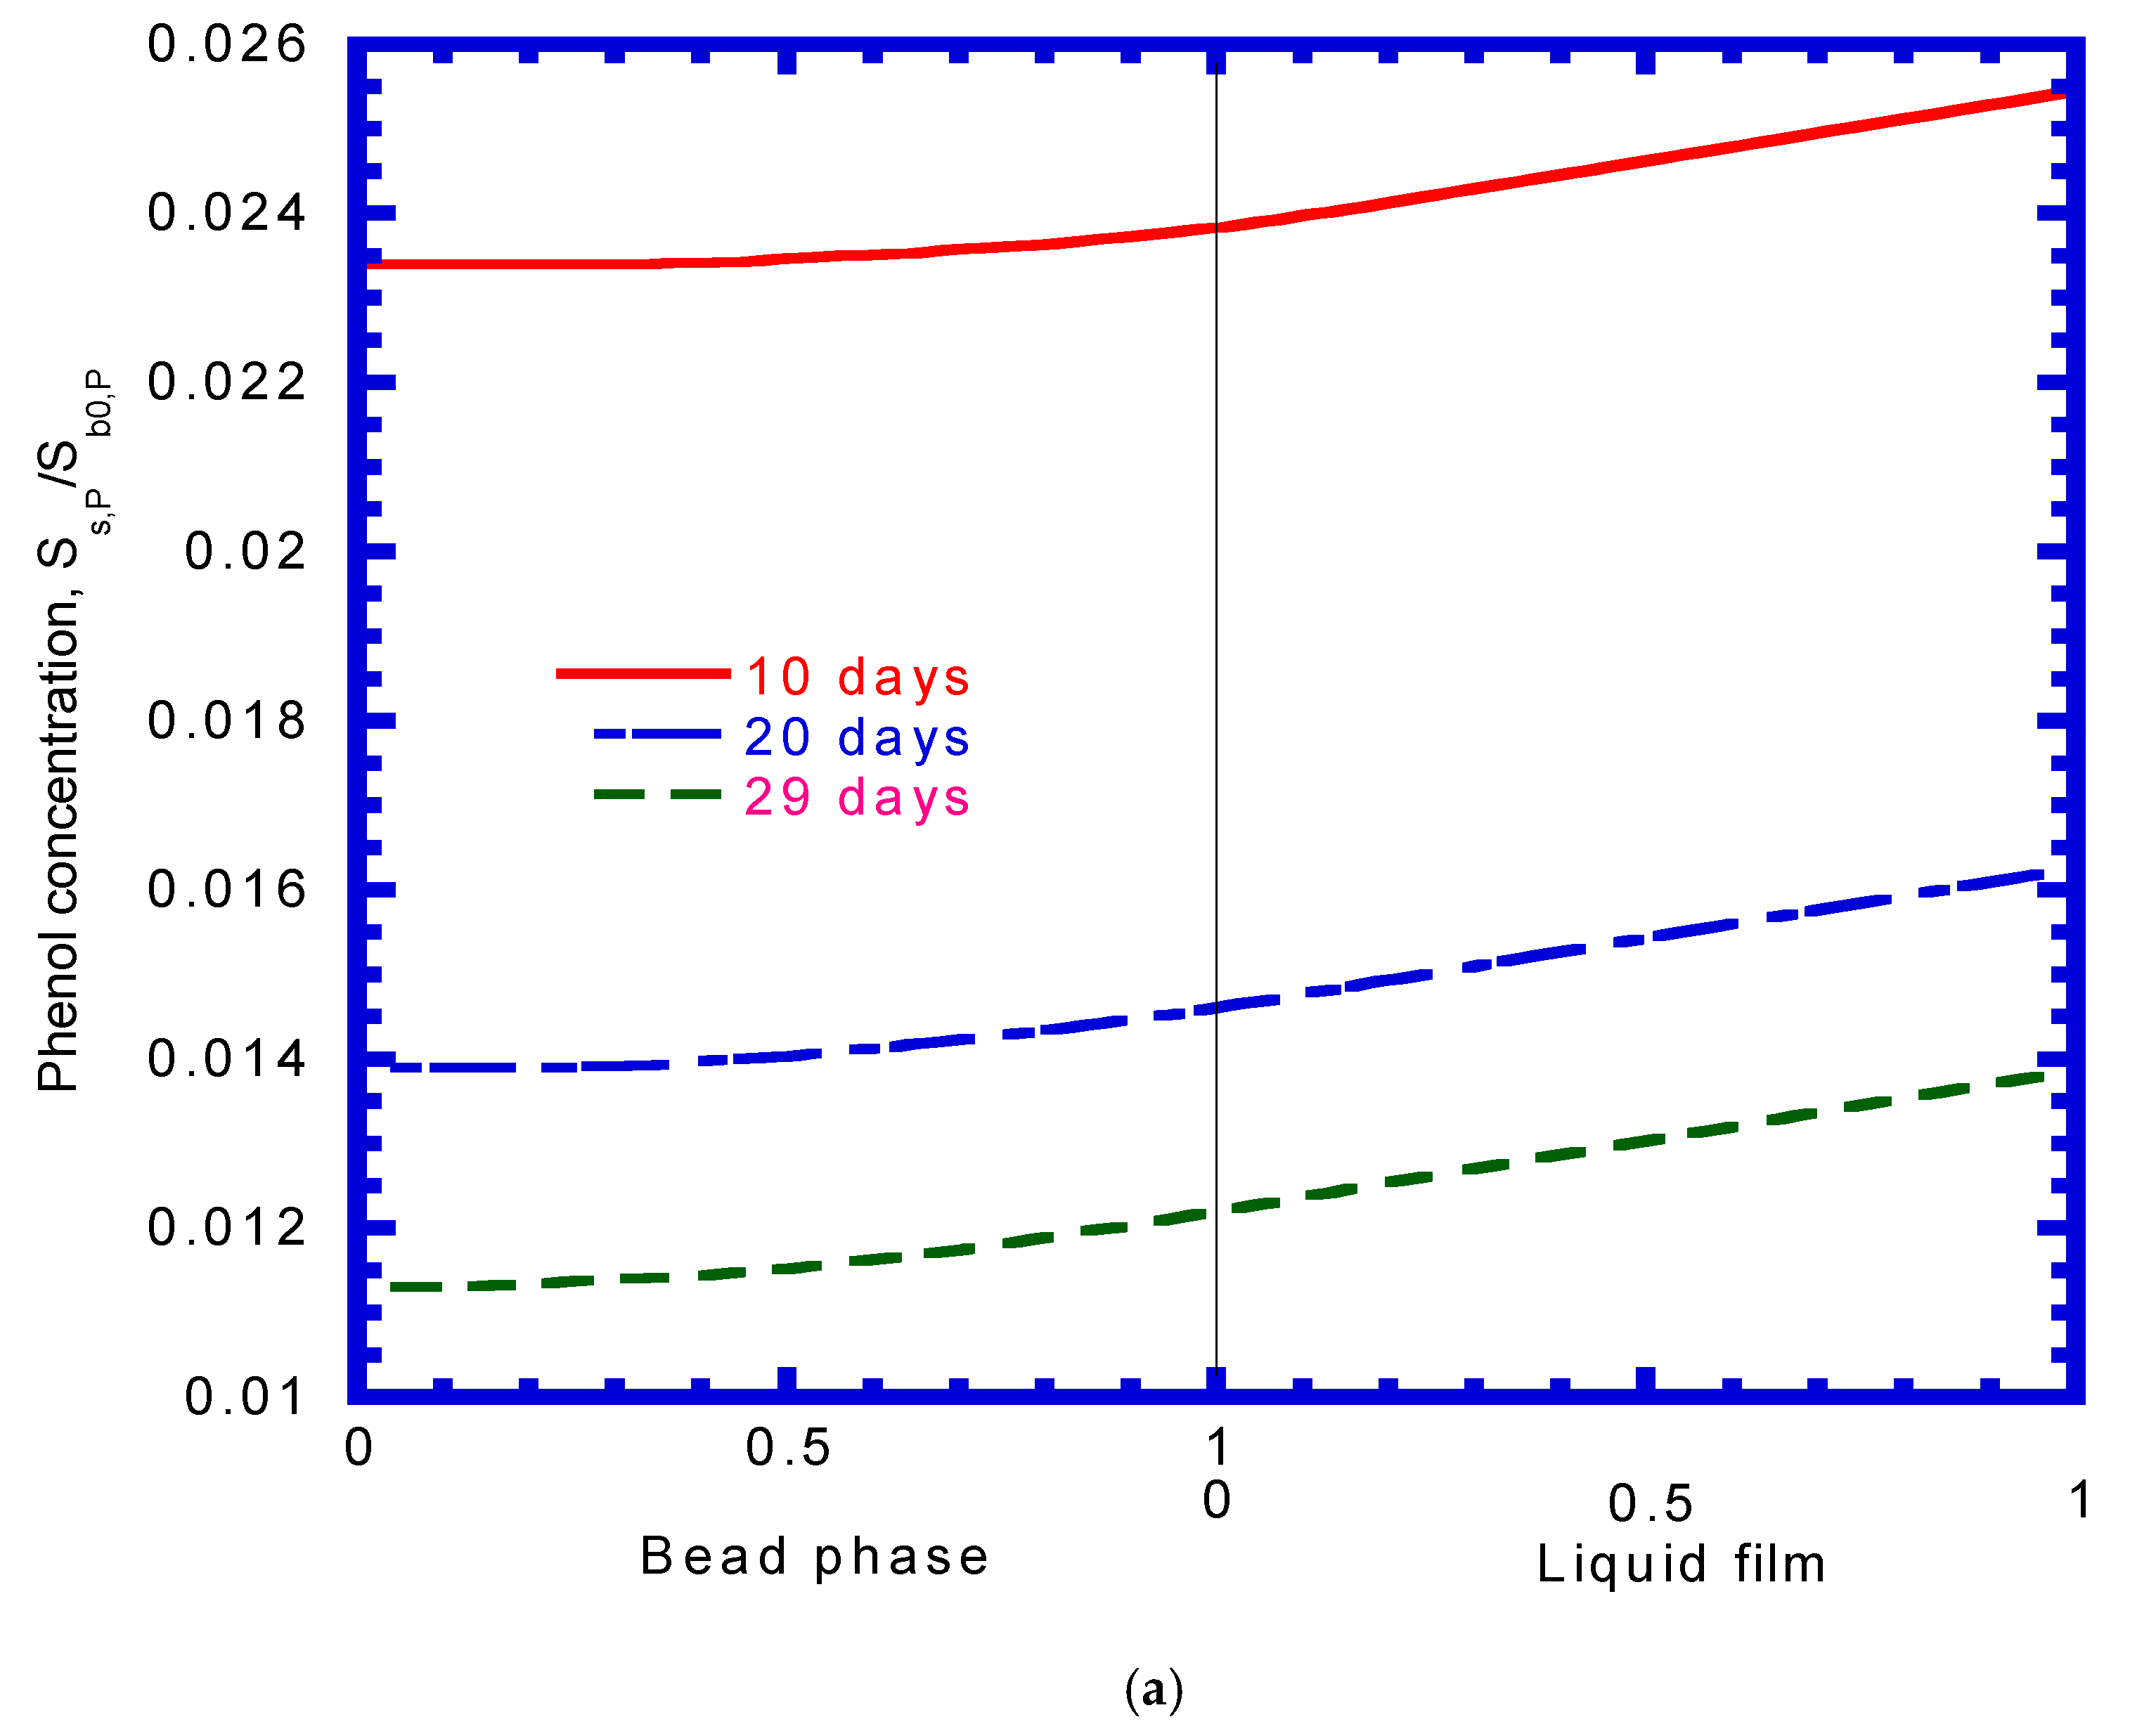
4.8. Phenol Concentration Profiles

The concentration variations of phenol and p-cresol along the liquid film and bead phrase attained at 10, 20, and 29 days are illustrated in Figure 14. The concentration profiles for phenol and p-cresol due to the diffusional resistance in the liquid film and bead phases was determined by model prediction. It can be seen that phenol and p-cresol concentrations decreased in the liquid film and bead phases when the operating time increased. The continuous stirred-tank bioreactor achieved the steady state on day 10. The entrapped cells concentration in the bead was about 16 mg L−1, and the cells actively utilized phenol and p-cresol simultaneously for their growth. The concentrations of phenol and p-cresol reduced promptly at 20 days around the center of bead. The values of phenol and p-cresol concentration approached to around zero on day 29. At this operating time, the fluxes of phenol and p-cresol remained a constant value, while a maximal value of the growth of entrapped cells was achieved.

5. Conclusions

The biodegradation kinetic model for the simultaneous removal of phenol and p-cresol was validated by conducting a continuous stirred-tank bioreactor with immobilized cells in Ca-alginate beads. Diffusion and biodegradation are two major mechanisms considered in the model system. The model agreed with experimental data very well in the continuous-flow reactor. Experimental results demonstrate that the immobilized cells process yields the high biodegradation of phenol and p-cresol, which was 97.6% and 89.1%, respectively. The fluxes of phenol and p-cresol that diffuse from the bulk liquid into the gel beads increased rapidly, while the entrapped cells in beads grew firmly during the unsteady-state period. The approaches of experiments and kinetic model presented in this study can be applied to layout a pilot-scale or full-scale entrapped cells bioreactor for the simultaneous biodegradation of phenol and p-cresol contaminants from various industrial wastewaters.

Author Contributions

Y.-H.L. conceived and designed the experiments as well as developed the kinetic models and analyzed the experimental data; Y.-J.G. conducted the batch and continuous stirred-tank bioreactors and collected the data. All authors have read and agreed to the published version of the manuscript.

Funding

This study was supported by a funding from the Ministry of Science and Technology of Taiwan under Contract No. MOST 108-2221-E-166-002.

Institutional Review Board Statement

Not applicable.

Informed Consent Statement

Not applicable.

Data Availability Statement

Not applicable.

Conflicts of Interest

The authors declare no conflict of interest.

References

  1. Banerjee, A.; Ghoshal, A.K. Phenol degradation performance by isolated Bacillus cereus immobilized in alginate. Int. Biodeterior. Biodegrad. 2011, 65, 1052–1060. [Google Scholar] [CrossRef]
  2. Sahoo, N.K.; Pakshirajan, K.; Ghosh, P.K. Enhancing the biodegradation of 4-chlorophenol by Arthrobacter chlorophenolics A6 via medium development. Int. Biodeterior. Biodegrad. 2010, 64, 474–480. [Google Scholar] [CrossRef]
  3. Mollaei, M.; Abdollahpour, S.; Atashgahi, S.; Abbasi, H.; Masoomi, F.; Rad, I.; Lotfi, A.S.; Zahiri, H.S.; Vali, H.; Noghabi, K.A. Enhanced phenol degradation by pseudomonas sp. SA01: Gaining insight into the novel single and hybrid immobilizations. J. Hazard. Mater. 2010, 175, 284–292. [Google Scholar] [CrossRef] [PubMed]
  4. Kulkarni, M.; Chaudhari, A. Biodegradation of p-nitro phenol by P. putida. Bioresour. Technol. 2006, 97, 982–988. [Google Scholar] [CrossRef] [PubMed]
  5. Pakshirajan, K.; Chugh, D.; Saravanan, P. Feasibility of m-cresol degradation using an indigenous mixed microbial culture with glucose as co-substrate. Clean Technol. Environ. Policy 2007, 10, 303–308. [Google Scholar] [CrossRef]
  6. Bai, J.; Wen, J.P.; Li, H.M.; Jiang, Y. Kinetic modeling of growth and biodegradation of phenol and m-cresol using Alcaligenes faecalis. Process Biochem. 2007, 42, 510–517. [Google Scholar] [CrossRef]
  7. Masque, C.; Nolla, M.; Bordons, A. Selection and adaptation of a phenol degrading strain of Pseudomonas. Biotechnol. Lett. 1987, 9, 655–660. [Google Scholar] [CrossRef]
  8. Soda, S.; Ike, M.; Fujita, M. Effects of inoculation of a sequencing batch activated sludge process treating phenol. J. Ferment. Bioeng. 1998, 86, 90–96. [Google Scholar] [CrossRef]
  9. Aksu, Z.; Bülbül, G. Determination of the effective diffusion coefficient of phenol in Ca-alginate-immobilized P. putida beads. Enzym. Microb. Technol. 1999, 25, 344–348. [Google Scholar] [CrossRef]
  10. Loh, K.C.; Chung, T.S.; Wei-Fern, A. Immobilized-cell membrane bioreactor for high-strength phenol wastewater. J. Environ. Eng. 2000, 126, 75–79. [Google Scholar] [CrossRef]
  11. Jiangliang, X.; Yanan, W.; Shi, K.; Xiao, X.; Gao, Y.; Li, L.; Qiao, Y. Study on the degradation performance and kinetics of immobilized cells in straw-alginate beads in marine environment. Bioresour. Technol. 2019, 280, 88–94. [Google Scholar]
  12. Parvanova-Mancheva, T.; Vasileva, E.; Beschkov, V.; Gerginova, M.; Stoilova-Disheva, M.; Alexieva, Z. Biodegradation potential of Pseudomonas putida to phenol compared to Xanthobacter autotrophicus GJ10 and Pseudomonas denitrificans strains. J. Chem. Technol. Metall. 2020, 55, 23–27. [Google Scholar]
  13. González, G.; Herrera, G.; García, M.T.; Peña, M. Biodegradation of phenolic industrial wastewater in a fluidized bed bioreactor with immobilized cells of Pseudomonas putida. Bioresour. Technol. 2001, 80, 137–142. [Google Scholar] [CrossRef]
  14. Yu, Y.G.; Loh, K.C. Inhibition of p-cresol on aerobic biodegradation of carbazole and sodium salicylate by Pseudomonas putida. Water Res. 2002, 36, 1794–1802. [Google Scholar] [CrossRef]
  15. Loh, K.C.; Ranganath, S. External-loop fluidized bed airlift bioreactor (EFBAB) for the cometabolic biotransformation of 4-chlorophenol (4-cp) in the presence of phenol. Chem. Eng. Sci. 2005, 60, 6313–6319. [Google Scholar] [CrossRef]
  16. Singh, U.; Arora, N.K.; Sachan, P. Simultaneous biodegradation of phenol and cyanide present in coke-oven effluent using immobilized Pseudomonas putida and Pseudomonas stutzeri. Brazil. J. Microbiol. 2018, 49, 38–44. [Google Scholar] [CrossRef]
  17. Ehrhardt, H.M.; Rehm, H.J. Semicontinuous and continuous degradation of phenol by Pseudomonas putida P8 adsorbed on activated carbon. Appl. Environ. Microbiol. 1989, 30, 312–317. [Google Scholar] [CrossRef]
  18. Chen, K.C.; Lin, Y.H.; Chen, W.H.; Liu, Y.C. Degradation of phenol by PAA-immobilized Candida tropicalis. Enzym. Microb. Technol. 2002, 31, 490–497. [Google Scholar] [CrossRef]
  19. Chung, T.P.; Wu, C.Y.; Juang, R.S. Improved dynamic analysis on cell growth with substrate inhibition using two-phase models. Biochem. Eng. J. 2005, 25, 209–217. [Google Scholar] [CrossRef]
  20. Bera, S.; Kauser, H.; Mohanty, K. Optimization of p-cresol biodegradation using novel bacterial strains from petroleum hydrocarbon fallout. J. Water Process Eng. 2019, 31, 1–6. [Google Scholar] [CrossRef]
  21. Arya, D.; Kumar, S.; Kumar, S. Biodegradation dynamics and cell maintenance for the treatment of resorcinol and p-cresol by filamentous fungus Gliomastix indicus. J. Hazard. Mater. 2011, 198, 49–56. [Google Scholar] [CrossRef] [PubMed]
  22. Yoon, H.; Klinzing, G.; Blanch, H.W. Competition for mixed substrates by microbial populations. Biotechnol. Bioeng. 1977, 19, 1193–1210. [Google Scholar] [CrossRef] [PubMed]
  23. Xiao, M.T.; Huang, Y.Y.; Ye, J.; Guo, Y.H. Study on the kinetic characteristics of the asymmetric production of R-(−)-mandelic acid with immobilized Saccharomyces cerevisiae FD11b. Biochem. Eng. J. 2008, 39, 311–318. [Google Scholar] [CrossRef]
  24. González, G.; Herrera, M.G.; García, M.T.; Peña, M.M. Biodegradation of phenol in a continuous process: Comparative study of stirred tank and fluidized-bed bioreactors. Bioresour. Technol. 2001, 76, 245–251. [Google Scholar] [CrossRef]
  25. Wang, S.W.; Loh, K.C.; Chua, S.S. Prediction of critical cell growth behavior of Pseudomonas putida to maximize the cometabolism of 4-chlorophenol with phenol and sodium glutamate as carbon source. Enzym. Microb. Technol. 2003, 32, 422–430. [Google Scholar] [CrossRef]
  26. Panigrahy, N.; Barik, M.; Sahoo, R.K.; Sahoo, N.K. Metabolic profile analysis and kinetics of p-cresol biodegradation by an indigenous Pseudomonas citronellolis NS1 isolated from coke oven wastewater. Int. Biodeterior. Biodegrad. 2020, 147, 1–9. [Google Scholar] [CrossRef]
  27. Juang, R.S.; Tsai, S.Y. Growth kinetics of Pseudomonas putida in the biodegradation of single and mixed phenol and sodium salicylate. Biochem. Eng. J. 2006, 31, 133–140. [Google Scholar] [CrossRef]
  28. Kumar, A.; Kumar, S.; Kumar, S. Biodegradation kinetics of phenol and catechol using Pseudomonas putida MTCC 1194. Biochem. Eng. J. 2005, 22, 151–159. [Google Scholar] [CrossRef]
  29. Wang, S.J.; Loh, K.C. Modeling the role of metabolic intermediates in kinetics of phenol biodegradation. Enzym. Microb. Technol. 1999, 25, 177–184. [Google Scholar] [CrossRef]
  30. Chung, T.P.; Tseng, H.Y.; Juang, R.S. Mass transfer effect and intermediate detection for phenol degradation in immobilized Pseudomonas putida systems. Process Biochem. 2003, 38, 1497–1507. [Google Scholar] [CrossRef]
  31. Monteiro, A.A.; Boaventura, R.A.; Rodrigues, A.E. Phenol biodegradation by Pseudomonas putida DSM 548 in a batch reactor. Biochem. Eng. J. 2000, 6, 45–49. [Google Scholar] [CrossRef]
  32. Banerjee, I.; Modak, J.M.; Bandopadhyay, K.; Das, D.; Maiti, B.R. Mathematical model for evaluation of mass transfer limitations in phenol biodegradation by immobilized Pseudomonas putida. J. Biotechnol. 2001, 87, 211–223. [Google Scholar] [CrossRef]
  33. Abuhamed, T.; Bayraktar, E.; Mehmetoğlu, T.; Mehmetoğlu, Ü. Kinetics model for growth of Pseudomonas putida F1 during benzene, toluene and phenol biodegradation. Process Biochem. 2004, 39, 983–988. [Google Scholar] [CrossRef]
  34. Saravanan, P.; Pakshirajan, K.; Saha, P. Biodegradation of phenol and m-cresol in a batch and fed batch operated internal loop airlift bioreactor by indigenous mixed microbial culture predominantly Pseudomonas sp. Bioresour. Technol. 2008, 99, 8553–8558. [Google Scholar] [CrossRef] [PubMed]
  35. Wakao, N.; Smith, J.M. Diffusion and reaction in porous catalysts. Ind. Eng. Chem. Fund. 1964, 2, 123–127. [Google Scholar] [CrossRef]
  36. Korgel, B.A.; Rotem, A.; Monbonquett, H.G. Effective diffusivity of galactose in calcium alginate gels containing immobilized Zymonmonas mobilis. Biotechnol. Prog. 1992, 8, 111–117. [Google Scholar] [CrossRef] [PubMed]
  37. Ju, L.K.; Ho, C.S. Correlation of cell volume fractions with cell concentrations in fermentation media. Biotechnol. Bioeng. 1988, 32, 95–99. [Google Scholar] [CrossRef]
  38. Wilke, C.E.; Chang, P. Correlation of diffusion coefficients in dilute solutions. AIChE J. 1955, 1, 264–270. [Google Scholar] [CrossRef]
  39. Brian, P.L.T.; Hales, H.B. Effect of transpiration and changing diameter on heat and mass transfer to sphere. AIChE J. 1969, 15, 419–425. [Google Scholar] [CrossRef]
  40. Yadzir, Z.H.M.; Shukor, M.Y.; Ahmad, A.; Nazir, M.S.; Shah, S.M.U.; Abdullah, M.A. Phenol removal by newly isolated Acinetobacter baumannii strain Serdang 1 in a packed-bed column reactor. Desalination Water Treat. 2016, 57, 13307–13317. [Google Scholar] [CrossRef]
  41. Basak, B.; Jeon, B.H.; Kurade, M.B.; Saratale, G.D.; Bhunia, B.; Chatterjee, P.K.; Dey, A. Biodegradation of high concentration phenol using sugarcane bagasse immobilized Candida tropicalis PHB5 in a packed-bed column reactor. Ecotoxicol. Environ. Saf. 2019, 180, 317–325. [Google Scholar] [CrossRef] [PubMed]
  42. Dong, R.; Chen, D.; Li, N.; Xu, Q.; Li, H.; He, J.; Lu, J. Removal of phenol from aqueous solution using acid-modified Pseudomonas putida-sepiolite/ZIF-8 bio-nanocomposites. Chemosphere 2020, 239, 124708. [Google Scholar] [CrossRef] [PubMed]
Figure 1. Conceptual basis of concentration profiles in an immobilized cells system.
Processes 09 00133 g001
Figure 2. A completely mixed and continuous-flow bioreactor.
Processes 09 00133 g002
Figure 3. Time course of the change in concentration for various concentrations of initial phenol and P. putida cells: (a) phenol and (b) P. putida cells.
Processes 09 00133 g003aProcesses 09 00133 g003b
Figure 4. Time course of the change in concentration for various concentrations of initial p-cresol and P. putida cells: (a) p-cresol and (b) P. putida cells.
Processes 09 00133 g004aProcesses 09 00133 g004b
Figure 5. Batch experiments to evaluate the specific growth rate under different initial single-substrate and cells concentrations: (a) phenol (b) p-cresol.
Processes 09 00133 g005
Figure 6. Specific growth rate of cells varied with various initial phenol concentrations. Haldane kinetics was fitted to the experimental data using the least-squares methodology. The maximum specific growth rate (μmax) is 0.45 h−1, the phenol half-saturation constant is 221.4 mg/L, and the phenol inhibition constant is 310.5 mg/L.
Processes 09 00133 g006
Figure 7. The specific growth rate of cells varied with various initial p-cresol concentrations. Haldane kinetics was fitted to the experimental data using the least-squares methodology. The maximum specific growth rate (μmax) is 0.185 h−1, the p-cresol half-saturation constant is 65.1 mg/L, and the phenol inhibition constant is 243.56 mg/L.
Processes 09 00133 g007
Figure 8. Batch kinetic tests to determine growth yield on phenol: (a) 50, (b) 100, (c) 200, (d) 300, (e) 400, (f) 500, and (g) 600 mg/L.
Processes 09 00133 g008aProcesses 09 00133 g008b
Figure 9. Batch kinetic tests to determine growth yield on p-cresol: (a) 50, (b) 100, (c) 200, (d) 300, (e) 400, (f) 500, and (g) 600 mg/L.
Processes 09 00133 g009aProcesses 09 00133 g009b
Figure 10. Batch experiments in the binary substrates system: (a) phenol biodegradation, (b) p-cresol biodegradation, and (c) P. putida cells growth.
Processes 09 00133 g010aProcesses 09 00133 g010b
Figure 11. Kinetic best-fit of the specific growth rate of P. putida cells on the binary substrates of phenol and p-cresol with a correlation coefficient R2 = 0.9894.
Processes 09 00133 g011
Figure 12. Experimental results and model prediction in phenol and p-cresol effluent concentrations.
Processes 09 00133 g012
Figure 13. Model prediction versus time (a) immobilized cells growth (b) phenol and p-cresol fluxes into bead.
Processes 09 00133 g013aProcesses 09 00133 g013b
Figure 14. Model predicted phenol concentration profiles at different operating times: (a) phenol, (b) p-cresol.
Processes 09 00133 g014aProcesses 09 00133 g014b
Table 1. Batch Tests to Evaluate Growth Yield (Y) under Various Initial Concentrations.
Run No.Initial Phenol Concentration (mg L−1)Initial p-Cresol Concentration (mg L−1)Bio-Kinetic Parameters
YP (mg mg−1)YC (mg mg−1)
150500.3400.274
21001000.3380.278
32002000.3430.278
43003000.3420.280
54004000.3400.283
65005000.3370.280
76006000.3390.280
mean--0.3400.279
standard deviation--2.116 × 10−32.769 × 10−3
Table 2. Summary of the Biokinetic and Reactor Parameters, as well as the Operation Conditions for the Model Simulation.
SymbolParameters Description (Unit)ValueRemarks
εreactor porosity (dimensionless)0.72measured
Atotal surface area of gel beads (cm2)3.522 × 10⁴calculated
DePeffective diffusivity of phenol in the gel bead (cm2 d−1)0.945calculated
DeCeffective diffusivity of p-cresol in the gel bead (cm2 d−1)0.853calculated
kfPmass-transfer coefficient of phenol (cm d−1)105.91calculated
kfCmass-transfer coefficient of p-cresol (cm d−1)98.87calculated
Ki,Pinhibition constant of phenol (mg L−1)310.5measured
Ki,Cinhibition constant of p-cresol (mg L−1)243.56measured
Ks,Psaturation constant of phenol (mg L−1)221.4measured
Ks,Csaturation constant of p-cresol (mg L−1)65.1measured
IC,Pinhibition of cell growth on phenol due to the presence of p-cresol (dimensionless)4.8measured
IP,Cinhibition of cell growth on p-cresol due to the presence of phenol (dimensionless)12.7measured
Qinfluent flow rate (mL d−1)6.272 × 10³measured
Sb0,Pconcentration of phenol in feed (mg L−1)125.0measured
Sb0,Cconcentration of p-cresol in feed (mg L−1)125.0measured
Veffective working volume (mL)1.568 × 10³measured
YPgrowth yield of cell on phenol (mg cell [mg phenol]−1)0.340measured
YCgrowth yield of cell on p-cresol (mg cell [mg p-cresol]−1)0.279measured
μmax,Pmaximum specific growth rate of cell on phenol (h−1)0.45measured
μmax,Cmaximum specific growth rate of cell on p-cresol (h−1)0.185measured
Publisher’s Note: MDPI stays neutral with regard to jurisdictional claims in published maps and institutional affiliations.

