Abstract
A surfactant-free method was used to synthesize iron oxyhydroxide (akaganeite, β-FeOOH) nanorods and characterized using Fourier transform infrared spectroscopy (FTIR), X-ray diffraction (XRD), scanning electron microscopy combined with energy-dispersive X-ray spectroscopy (SEM-EDS), and transmission electron microscopy (TEM). The synthesized nanoadsorbent was applied for the adsorptive removal of β-estradiol from aqueous solutions. The parameters affecting the adsorption were optimized using a multivariate approach based on the Box–Behnken design with the desirability function. Under the optimum conditions, the equilibrium data were investigated using two and three parameter isotherms, such as the Langmuir, Freundlich, Dubinin–Radushkevich, Redlich–Peterson, and Sips models. The adsorption data were described as Langmuir and Sips isotherm models and the maximum adsorption capacities in Langmuir and Sips of the β-FeOOH nanorods were 97.0 and 103 mg g−1, respectively. The adjusted non-linear adsorption capacities were 102 and 104 mg g−1 for Langmuir and Sips, respectively. The kinetics data were analyzed by five different kinetic models, such as the pseudo-first order, pseudo-second order, intraparticle, as well as Boyd and Elovich models. The method was applied for the removal β-estradiol in spiked recoveries of wastewater, river, and tap water samples, and the removal efficiency ranged from 93–100%. The adsorbent could be reused up to six times after regeneration with acetonitrile without an obvious loss in the removal efficiency (%RE = 95.4 ± 1.9%). Based on the results obtained, it was concluded that the β-FeOOH nanorods proved to be suitable for the efficient removal of β-estradiol from environmental matrices.
1. Introduction
Water is the most important natural resource for the survival of all organisms [1]. Due to the increase in urbanization, climate change, industrial production, and population growth, the quality of water can be negatively affected. Pollutants entering soil or water pose a variety of threats to the functioning of ecosystems and to human health [2]. Soil is frequently polluted with polycyclic aromatic hydrocarbons (PAHs), petroleum-related compounds, heavy metals, chlorophenols, organic pollutants, and pesticides [2]. There is an overlap of the types of pollutants present in water and soil, because of water run-off from contaminated soils, wastewater, and septic tanks [3]. The United States and the European Union in 2002 and 2009 reported that at least 80% of all collected samples were contaminated with organic pollutants, which frequently have endocrine-disrupting properties [4]. The most widely investigated endocrine disruptors include molecules or metabolites derived from personal care products, pharmaceuticals, polybrominated diphenyl ethers (PBDEs), and hormones [5].
β-estradiol is a natural hormone excreted by mammals and is primarily produced by the reproductive organs [6]. Naturally, β-estradiol plays a role in physiological processes, such as reproduction and sexual function [7]. Estrogens from animal-derived food (for example, but not limited to, eggs, milk, and fish) can be introduced to people via their usage as growth-promoting agents, thus resulting in unnaturally high concentrations [8]. Elevated β-estradiol levels may interfere with the function of the thyroid in birds and fish [9], may reduce fertility, and may lead to sexual disorders. It is also known to generate congenital malformations in children [10]. The contamination route is via animal and human excretions, as well as subsequent transport by sewage effluent into the water systems [11]. Therefore, the decontamination of water systems used for later water consumption is crucial for human and environmental wellbeing.
Numerous decontamination techniques, such as adsorption [12], catalytic degradation [13], oxidation [14], and biodegradation [15], have been used to remove β-estradiol from aqueous systems. Though seldom used because of difficulties in adsorbent removal, adsorption has great potential for decontamination owing to its high efficiency and tunability. Adsorption can be tailored by the wide variety of sorbets available, including carbon nanotubes [7], membranes [16], molecularly imprinted polymers [17], and carbon-based materials [18]. Akaganeite is an iron oxyhydroxide (β-FeOOH) with double chains of octahedral corners forming a tunnel-like framework of mesopores [19,20]. Akaganeite occurs naturally in a variety of soil types. Iron oxyhydroxide has also been prepared in the laboratory and has been shown to remove both anions and cations [21]. It is also paramagnetic at room temperature, which makes it easy to remove from any matrix it has been dispersed in using an external magnet [22]. Consequently, it is useful as both a catalyst and an adsorbent material in adsorption/preconcentration [19].
The main objective of this study was to explore the adsorption properties of β-estradiol onto a synthesized akaganeite nanomaterial serving as the adsorbent material. Multivariate optimization strategies were used to explore the effect of sample pH, adsorbent dosage, and extraction time for the adsorptive removal of β-estradiol as an exemplary yet highly relevant analyte. The adsorption process was studied in detail via adsorption isotherms, while the rate-limiting steps were investigated using adsorption kinetics. Finally, the adsorption performance of the synthesized akaganeite was evaluated using spiked wastewater samples.
2. Materials and Methods
2.1. Materials
The ferric (III) chloride, sodium hydroxide, and ethanol were all of analytical reagent grade and β-estradiol the (98%) purchased from Sigma Aldrich (St. Loius, MO, USA) were used in the study. A stock solution (20 mg L−1) was prepared by dissolving an appropriate amount of the β-estradiol in methanol and refrigerated until required for use. Standard solutions were prepared daily by diluting the stock solution with ultra-pure water (Direct-Q® 3UV-R purifier system, Millipore, Merck, KGaA, Darmstadt, Germany).
2.2. Instrumentation
All pH measurements were done using an OHAUS ST series pen pH meter (Nanikon, Switzerland). The adsorption studies were carried out using the Branson 5800 Ultrasonic Cleaner (Danbury, CT, USA). The FTIR measurements were taken using the KBr pellet technique and recorded in the region 400–4000 cm−1 using a Perkin Elmer Spectrum 100 spectrometer. Scanning electron microscopy (SEM, TESCAN VEGA 3 XMU, LMH instrument, Czech Republic) coupled with energy-dispersive X-ray spectroscopy (EDS) was used to study the morphology and elemental composition of the adsorbent at an accelerating voltage of 20 kV. The transmission electron microscopic image was captured using TEM (JEM-2100, JEOL, Tokyo, Japan). An Agilent high-performance liquid chromatography (HPLC) 1200 Infinity series, equipped with a photodiode array detector (Agilent Technologies, Waldbronn, Germany), was used for all analysis. The separation was done using an Agilent Zorbax Eclipse Plus C18 column (3.5 μm × 150 mm × 4.6 mm) (Agilent, Newport, CA, USA) operated at an oven temperature of 25 °C. The chromatograms were recorded using a 1.00 mL min−1 flow rate, a solvent mixture of 55% mobile phase A (water) and 45% mobile phase B (acetonitrile), and an adsorption wavelength of 260 nm using an isocratic elution system.
2.3. Sampling and Storage
Influent and effluent wastewater samples were collected from a local wastewater treatment plant (WWTP, Gauteng, South Africa) in winter 2019. River water samples were collected from Apies River, which is upstream from the wastewater treatment plant. Tap water samples were collected from the University of Johannesburg Doornforntein campus. All samples were collected in 1 L glass bottles and refrigerated until use.
2.4. Preparation of Akaganeite Nanorods
Akaganeite nanoparticles were prepared according to the method described by [23]. Briefly, a 5 mol L−1 solution of NaOH was prepared in 30 mL deionized water and stirred at room temperature in a beaker equipped with a magnetic stirrer. A 25 mL 2 mol L−1 FeCl3 was rapidly added to the NaOH solution using a syringe; the stirring was continued for an hour. Ethanol was then added, and the resulting precipitate was washed several times with a 1:1 ethanol–water solution. The precipitate was then dried in an oven at 50 °C for 5 h.
2.5. Batch Adsorption of β-Estradiol
The adsorption was done using the batch incubation method described in [24]. The method was optimized using the Box–Behnken design. The levels of independent factors, such as sample pH, contact time (CT), and mass adsorbent (MA), are presented in Table S1. The appropriate amount of adsorbent was then weighed and added to a glass bottle. Aliquots of a 10 mL sample solution containing 6 mg L−1 β-estradiol were added into the sample bottle. The samples were then agitated using an ultrasound water bath; thereafter, the adsorbent and supernatant were separated using an external magnet. Thereafter, 1 mL of sample was filtered via a 0.22 µm PVDF filter before analysis with HPLC. All the experiments were carried out in triplicates, after which the adsorption removal efficiency was calculated using Equation (1):
where C0 and Ce are the initial and equilibrium concentrations, respectively.
An optimization process is a critical stage in analytical chemistry. This is because of regulations due to the high cost of reagents and quantity of variables that affect the development and validation of analytical methods [25]. Multivariate optimization is an important technique because it takes less time, resources, and effort than the univariate approach. The design of experiments is important in analytical applications [25]. Multivariate optimization strategies allow to efficiently minimize the parameter space-saving time and resources when determining the optimum conditions, here for the deployment of an adsorbent material [25]. For the adsorption of β-estradiol onto akaganeite, the (1) pH of the sample, (2) mass of adsorbent (MA), and (3) contact time (CT) were optimized using a multivariate approach, as presented in Table S1.
Under optimum conditions, the equilibrium isotherms and kinetics of adsorption were studied. The β-estradiol solutions had concentrations ranging from 1 to 9 mg L−1. The equilibrium isotherm studies were done in triplicates and the β-estradiol concentration adsorbed onto akaganeite nanorods was calculated using Equation (2):
where C0 and Ce are the initial and equilibrium concentrations (mg. L−1) of β-estradiol, respectively, and m (g) and V (L) represent the mass of the adsorbent and volume of the sample used. The adsorption kinetics was investigated by the addition of 10 mL aliquots (6 mg. L−1) into 7 glass bottles. The bottles were then sonicated for 1–60 min for each sample before magnetic separation and HPLC analysis.
2.6. Method Validation and Real Sample Analysis
The collected wastewater (influent and effluent), river, and tap water samples were analyzed before adsorption and β-estradiol could not be detected in the sample. As a result, the method was validated using spiked sample recoveries; this was due to the absence of certified reference materials for emerging pollutants. To validate the method, wastewater effluent samples were spiked at two levels (4 and 8 mg. L−1) with β-estradiol by appropriate dilution with the effluent water. The validation experiments were carried out by adding 10 mL of the sample (adjusted to pH 5.25) onto 42.5 mg of akaganeite in a capped glass bottle. The mixture was then agitated in an ultrasonic bath for 60 min, after which the supernatant and adsorbent were separated using an external magnet before filtering and HPLC analysis of the supernatant.
3. Results and Discussion
3.1. Characterisation of the Akaganeite Nanoparticles
Figure 1 shows the Fourier transform infrared spectrum of the as-synthesized akaganeite. The peaks at 3437 and 3135 cm−1 were ascribed for OH stretching and the bending at 1620 cm−1 and 1009 cm−1 were assigned to the absorption bands of the iron oxyhydroxides arising from the Fe–OH and Fe–O vibration of the akaganeite [19,26]. The bending peak at 650 cm−1 is reported to be the characteristic vibrations of Fe–O in β-FeOOH [26]. Lastly, the OH bending band around the 1431 cm−1 region corresponded to the β-FeOOH FTIR spectrum reported in the literature [19,26].
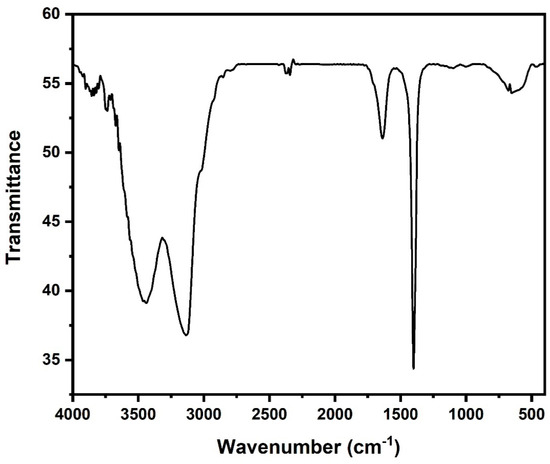
Figure 1.
FTIR spectra of akaganeite.
Akaganeite nanoparticles are known to be low-crystallinity materials, which during XRD characterization are indicated by rather low-intensity peaks [27]. In Figure 2, an exemplary XRD data set for the synthesized akaganeite nanoparticles are presented. From the XRD pattern, the characteristic low-intensity peaks were observed, confirming low crystallinity. According to [26], decreasing the pH of the synthesis media results in more crystalline akageneite, while increasing the pH of the synthesis media results in less crystalline akaganeite nanoparticles, which was a similar case with the present study (i.e., sodium hydroxide was used). According to [27], the diffraction peaks at around 2θ = 20° and 40° are characteristic nano-akaganeite peaks and are evident in Figure 2.
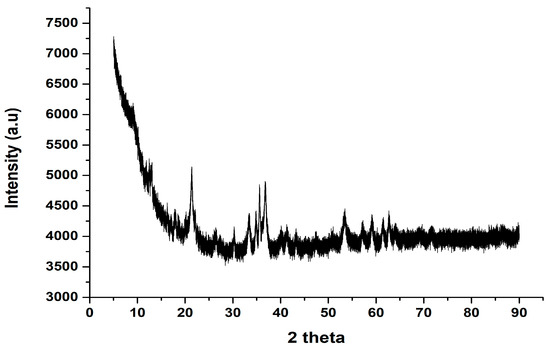
Figure 2.
X-ray diffraction pattern of the akaganeite nanorods.
Scanning electron microscopy (SEM) was used to investigate the surface morphology of the akaganeite nanomaterial combined with energy-dispersive X-ray (EDX) for elemental analysis. The major components of the akaganeite nanomaterial were determined by EDX and given in the spectrum represented in Figure 3B. SEM images (Figure 3A,C) revealed aggregated akaganeite nanoparticles, which resulted from the absence of a surfactant during the synthesis, as was reported in [19]. The yellow frame in Figure 3C indicates the area used for evaluation by EDX.
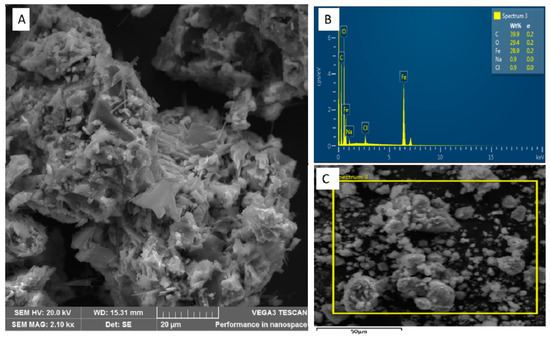
Figure 3.
An exemplary (A) SEM image and (B) EDX spectrum and (C) section analysed using EDX of the akaganeite nanomaterial synthesized in absence of a surfactant.
Transmission electron microscopy (TEM) studies, as shown in Figure 4, indicate the characteristic rod-shaped akaganeite structures next to more spherical/octagonal particles, as described by [19]. While no surfactant was used herein, to better control the shape of the obtained akageneite material, a surfactant is needed, ensuring more ordered mesostructures. However, one aim of the present study was to ensure a straightforward and possibly simple synthesis route. Hence, a more uniform particle shape/size was traded against the simplicity of the synthesis strategy, which in absence of surfactants does not require further processing steps, including autoclaved heating and time-consuming Soxhlet extraction [19].
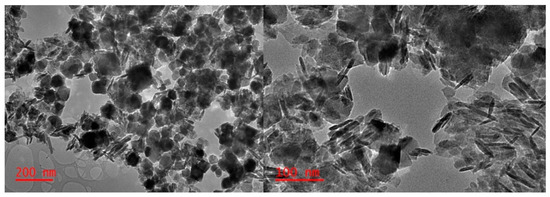
Figure 4.
Exemplary TEM images of the synthesized akaganeite nanomaterial in absence of any surfactant.
3.2. Optimisation of Removal Procedure
A Pareto chart (see Figure S1) was used to identify critical factors during the adsorption process by evaluating the variance within the experimental design matrix [28]. The Pareto chart is based on analysis of variance (ANOVA), which is a linear model. As a result, during the analysis of the Pareto chart, only the linear factors (i.e., factors with the index L) were included, while quadratic factors (with the index Q) were not considered [29]. In the analysis of a Pareto chart, for a factor to be considered statistically significant, its bar should pass the redline that indicates a p-value of 0.05 (95% confidence level) [30,31]. The ultimately dominating factors were determined to include the (1) pH of the sample, (2) the mass of adsorbent (MA), and (3) the contact time (CT). Of these three factors, the only one beyond the 95% confidence line (red line in Figure S1) was the pH.
The response surface methodology (RSM) was used to investigate (a) the interaction and (b) the quadratic effects of the main parameters pH, MA, and CT, respectively, using the data generated via a Box–Behnken experimental design, yielding 3D surface plots (Figure S2) for these three parameters. As it can be seen from Figure S2A, increasing the mass of the adsorbent increases the percentage removal (% RE) with any pH below 7, and at a pH of around 7 the maximum % RE could be observed. The same could be observed from the interaction of pH and contact time. Figure S2C shows the interaction between CT and MA; masses between 25 and 10 together with a CT of 20 min gives a minimum 5 RE while a CT and MA above 30 min and 30 mg results in higher percentage removal (% RE). The plots were used in conjunction with the profiles of desirability to determine the optimum conditions.
Using the desirability function (DF, Figure S3) allows the simultaneous estimation of the optimal values for all the investigated factors. Desirability always takes values within the 0–1 range where 0 indicates the least desired result (33.4% removal), 0.5 being the central point 69.4%, and 1 being the most desirable value assigned a % removal of 105 [32,33]. According to the desirability profiles, the optimal conditions for the adsorption process were a pH of 5.25, MA of 42.5 mg, and CT of 60 min. The DF predicted values were then used to confirm the optimum conditions of the adsorption method. To understand the effect of pH on the adsorption, the point of zero charge of akaganeite was considered. At a pH lower than the point of zero charge, the surface of the material is positively charged, while at a pH higher than the point of zero charge, the surface of the adsorbent is negatively charged [34,35,36]. The point of zero charge for the akaganeite nanorods as described in the literature is around 7–7.5 [21]. The optimum pH for the adsorption was found to be 5.25, which is lower than the point of zero charge of akageneite. This means that the surface of the material was positively charged. β-estradiol also has a pKa of 10.71, meaning that at the optimum pH, the analyte is in its molecular state. This translates to the presence of the OH groups on the analyte to be available for ionic interaction between the β-FeOOH and β-estradiol.
3.3. Adsorption Isotherms
The ratio between the concentration of adsorbed analyte and the amount of analyte remaining in the supernatant solution at equilibrium conditions provides the absolute removal efficiency [24]. The interaction of the analyte species with the adsorbent material reaches a dynamic equilibrium after a certain incubation time, which may be described via so-called isotherm models [37]. In the present study, the isotherms for β-estradiol adsorbing at the surface of β-FeOOH nanorods were studied at a pH of 5.25 with a β-estradiol concentration of 1–10 mgL−1, an adsorbent mass (MA) of 42.5 mg, and contact time (CT) of 60 min at 25 °C. It was observed that the adsorption capacity increased with an increase in initial β-estradiol concentration (Figure 5A). In this study, five isotherm models were used to describe the equilibrium. These include the Langmuir, Freundlich, Dubinin–Radushkevich, Redlich–Peterson, and Sips isotherm models, and the resulting plots are shown in Figure 5B–F. The R2 values for the different models were used to determine which model best fits the adsorption process. The Langmuir and Freundlich models were used to determine the primary adsorption mechanism. As seen in Table 1 the adsorption process fitted the Langmuir model with an R2 of 0.9996, which was higher than the 0.8811 for the Freundlich model.
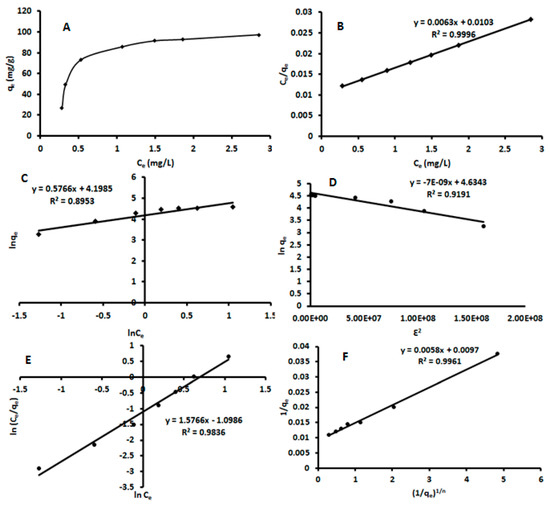
Figure 5.
Adsorption isotherm plots for the sorption of β-estradiol using akaganeite (A)—Langmuir isotherm model; (B)—Langmuir linear model; (C)—Freundlich linear model; (D)—Dubinin–Radushkevich linear model; (E)—Redlich–Peterson linear model; (F)—Sips linear model.

Table 1.
Adsorption models and parameters investigated in the present study.
The β-estradiol adsorption data were fitted with Langmuir, Freundlich, Dubinin–Radushkevich, and Redlich–Peterson isotherms models, as summarized in Table 1. Comparing the obtained goodness-of-fit values in Table 1, the experimental data followed a Langmuir isotherm (R2 = 0.9996), which was higher than for any other isotherm. This implies that adsorption occurs homogeneously at the surface sites of the β-FeOOH nanomaterial and that the adsorption of β-estradiol may be assumed occurring in a monolayer fashion. Thus, a Langmuir constant (KL) of 16 L g−1 and the maximum adsorption capacity of 97.0 mg g−1 was obtained. The calculated separation factor (RL) of 0.10–0.25 for the β-estradiol adsorption on the β-FeOOH nanomaterial, according to the literature, demonstrates a favorable adsorption [38,39].
The Dubinin–Radushkevich isotherm is conventionally used to differentiate between chemical and physical adsorption by evaluating the mean energy (E). It is said that an E value that is lower than 8 kJ mol indicates physisorption dominance while an E value above 8 indicates chemisorption dominance [40,41]. The calculated E value was 8.5 kJ mol−1, which indicates a chemisorption process. The Redlich–Peterson model combines both the Freundlich and Langmuir isotherms, whereby B is the exponent from the linear plot ranging between 0 and 1. If B equals 1, the model reduces to the Langmuir equation, and if B = 0, it reduces to the Freundlich equation [42]. From the obtained results, B has a value of 0.88, which again favors the Langmuir model to describe the interaction between β-estradiol and the β-FeOOH nanorods. To further investigate monolayer adsorption, the Sips model was used. When the Sips model exponent nS = 1, the adsorption process follows a Langmuir isotherm, and when nS >1, the data is considered to fit the Freundlich model [43,44,45]. In this work, the Sips model exponent was equal to 1, further confirming monolayer adsorption.
The adsorption data were also fitted to the nonlinear isotherm models. This because the major problem encountered when using linearized models is the violation of theories behind each model using the modification of the original equation [46,47,48]. In such cases, the linearized model may give best-fitting parameters as opposed to the original nonlinear model [46,47,48]. Therefore, to compare the linearised and nonlinearized regression models, the data were fitted to the original nonlinear isotherm equation (Table 2). The better-fitting kinetic of the nonlinear equations was investigated using residual standard error (RSE) and R2. According to the RSE and R2, the best model is Redlich–Peterson, followed by the Sips, Langmuir, Dubinin–Radushkevich, and Freundlich isotherms. In this study, the isotherm parameters obtained for both linear and nonlinear models were comparable, indicating that the two regression models were not significantly different at the 95% confidence level. Besides, these findings proved that the linearized model did not violate the theory behind the original models.
Table 2.
Non-linear adjusted adsorption isotherms.
3.4. Adsorption Kinetics
Batch experiments were carried out to investigate the adsorption kinetics of β-estradiol (Figure 6A) using 42.5 mg of β-FeOOH nanorods, a concentration of 5 mg L−1 β-estradiol, and a pH of 5.25 at room temperature (25 °C). As seen, the rapid uptake of β-estradiol by the adsorbent happened from 5–20 min and the equilibrium was attained between 20 and 60 min. The kinetics data were fitted into various kinetics equations, as seen in Table 3. The plots for the pseudo-first order (ln (qe-qt) vs. t), pseudo second order (t/qt vs. t), and Elovich (qt vs. ln t) kinetic models are shown in Figure 6B–D. The derived parameters together with the correlation coefficient are summarized in Table 3. As seen in Figure 6B and Table 3, the correlation coefficients for the pseudo-first-order model was 0.6555. The experimental adsorption capacity (97.2 mg g−1) was almost four times higher than the calculated (26.8 mg g−1) adsorption capacity. These finding suggested that the adsorption of β-estradiol onto β-FeOOH nanorods was not an ideal pseudo-first-order reaction. The R2 value for the pseudo-second-order model is higher than that of the first-order model. This suggests that the kinetic equilibrium data were best described by a pseudo-second-order model. The calculated qe value of the pseudo-second-order model is also 100 mg g−1, which is in agreement with the experimentally obtained value of qe at 97.2 mg g−1. This agreement suggested that the adsorption process was driven by chemisorption involving the electrostatic interaction between the positively charged adsorbent and lone pairs of electrons of β-estradiol. The Elovich kinetic model was used to describe the chemisorption process on the surface of the β-FeOOH nanorods. The kinetics data were fitted to the Elovich equation and gave a relatively good R2 value (0.9595), which shows that the uptake of β-estradiol onto the β-FeOOH nanorods involved chemisorption [49].
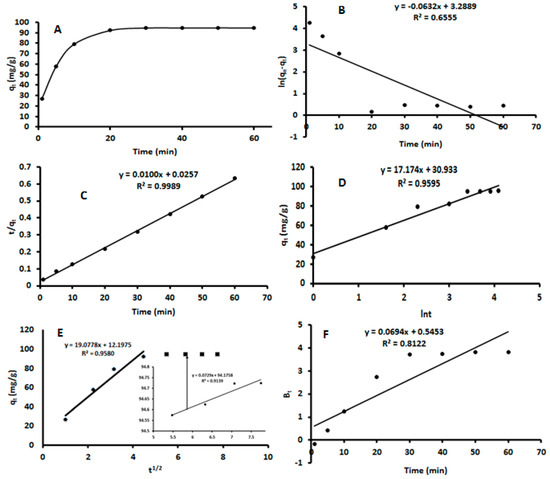
Figure 6.
Adsorption kinetics plots for the sorption of β-estradiol using akaganeite: (A)—adsorption kinetics model; (B)—pseudo-first order linear model; (C)—pseudo-second order linear model; (D)—Elovich linear model; (E)—intraparticle diffusion linear model; (F)—Boyd linear model.
Table 3.
Kinetic models and parameters investigated in the present study.
To understand the rate-determining step, various intraparticle diffusion models were applied, as summarized in Table 3. From the plots of the intraparticle diffusion (Figure 6E), it is evident a two-step adsorption process occurred during the uptake of β-estradiol by the akageneite nanorods. The first step is based on the so-called film diffusion or surface adsorption, i.e., diffusion of β-estradiol from the solution to the external surface of the adsorbent [24]. The plots also do not go through the origin, which indicates that the intraparticle diffusion is not the rate-determining step. The second step suggested that the adsorption process proceeds by intraparticle diffusion and the intraparticle diffusion happened at a higher concentration. Kid1 derived from the film diffusion is exceeding the Kid2 of the intraparticle diffusion, which indicates that the intraparticle diffusion is a slow process. The value of the intercept (C) is also larger for the intraparticle diffusion, thus providing a more relevant contribution to the adsorption process [50]. Because the intraparticle diffusion plot shows a non-linear nature, the Boyd model (Figure 6F) was used to investigate the definite rate-controlling step. According to Hu et al. [49], when the Boyd plot passes through the origin it means that particle diffusion is the dominant mechanism that governs the adsorption process. However, as seen in Figure 6F, the plot did not pass through the origin, suggesting that the adsorption process might be governed by a boundary layer diffusion mechanism [51]. However, the high correlation coefficient of the Elovich model meant that between the two steps of the rate-determining steps, intraparticle diffusion was more prominent when compared to film diffusion [52,53]. This validates the results obtained during the optimization, which essentially results in the fact that electrostatic interactions are driving the β-estradiol adsorption onto akageneite. This is also confirmed in the literature for the adsorption of β-estradiol onto carbon nanotubes [16].
Nonlinear regression of the kinetics data for each model was investigated using the adjusted R2, R2, and residual standard error. The calculated kinetics parameter and the correlation coefficients are illustrated in Table 4. Unlike in the linearized regression model where the trend was pseudo second order > Elovich > pseudo-first order, the data was best fitted by the pseudo-second order, followed by the pseudo-first-order and Elovich models. When comparing the kinetic parameters between the non-linear and linear models, it could be seen that the calculated qe for the linearised pseudo-first order was the only model that violated the theory of the original non-linear model.
Table 4.
Adjusted non-linear adsorption kinetics.
3.5. Adsorption Thermodynamics Studies
Thermodynamic studies were investigated to ascertain the dominant adsorption mechanisms (that is, physisorption or chemisorption). The adsorption process was carried at different temperatures (298, 303, 308, and 313 K) and the thermodynamic parameters, such as enthalpy (ΔH°), entropy (ΔS°), and Gibbs energy (ΔG°), were calculated according to the expressions reported by References [46,48,50,52]. The graph of lnKC against 1/T(K−1) is presented in Figure 7. The values of ΔH° and ΔS° were estimated from the slope and intercept of the plot. The ΔH° and ΔS° were found to be 45.5 kJ mol−1 and 186 J mol−1 K−1 while the Gibbs energies were ranged from −9.86 to −12.6 kJ mol−1. The positive ΔH° reveals that the adsorption process was endothermic in nature and the positive ΔS° suggested an increase in the randomness at the boundary of the solid/liquid phases during the adsorption process [46,48,50,52]. The negative ΔG° indicate the spontaneity of the adsorption process. Moreover, the ΔH° value was higher than 20.9 kJ/mol, confirming that the chemisorption was dominant [52].
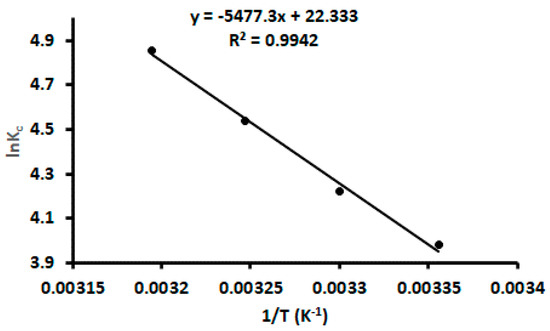
Figure 7.
Van’t Hoff plot calculation of for thermodynamic parameters.
3.6. Adsorption Mechanism
In order to gain further insight into the adsorption process of β-estradiol onto akaganeite, the adsorption was characterized by performing FTIR analysis (Figure 8a–c) on akaganeite before and after adsorption, as well as on the analyte. The adsorption of β-estradiol resulted in peaks in the 1500–1000 cm−1 region, which were ascribed to various C–O, C–H, and C–OH bonds. As evident in Figure 8c, the emergence of the prominent peaks at 2800–2900 cm−1, corresponding to the stretching vibration of the C–H bonds of the β-estradiol, and the broadening of the OH vibration peak at 3135 cm−1 confirmed the presence β-estradiol on the surface of the adsorbent [54]. Figure 8a revealed that akageneite has distinctive vibration peaks of hydroxyl groups and according to the literature the pKa of -OH is around 9.5–13 [55,56]. This implies that at pH values below the pKa values, the hydroxyl groups of the adsorbent are protonated [55,56]. In addition, the pHpzc of the adsorbent was reported to be between 7 and 7.5, suggesting that adsorbent is positively charged below the pHpzc. Moreover, the pKa value of β-estradiol is reported to be 10.71, suggesting the analyte existed as a neutral species. There, the adsorption mechanism was dominated by the electrostatic attraction between the positively charged adsorbent and the lone pair of electrons of the oxygen atoms present in the analyte. Furthermore, the presence of the electron-rich aromatic ring in the structure of the analyte resulted in cation–π interactions between the positively charged adsorbent surface and the π-system of the β-estradiol molecule. These finding are in line with the observation in the optimization data where pH influenced the interactions between the positively charged adsorbent and the electron-rich β-estradiol molecule [6]. Moreover, the enhanced peak intensities, shifting of adsorption bands at 1700–1500 cm−1, and disappearance of some peaks at 650–600 cm−1, as seen in Figure 8b, confirmed that the adsorption mechanism was dominated by the chemisorption process, which is in line with the adsorption isotherms, kinetics data, and thermodynamics studies.
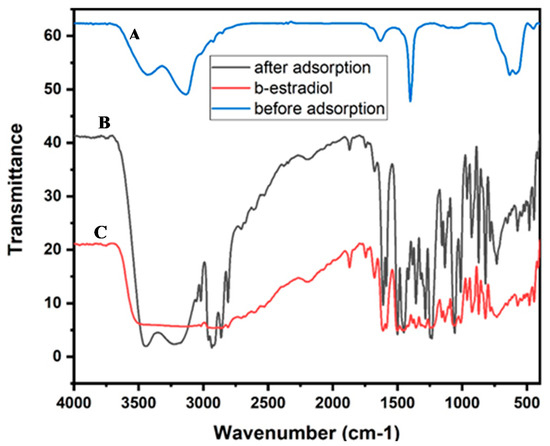
Figure 8.
FTIR spectrum for (a) akageneite before adsorption, (b) akageneite before adsorption, and (c) β-estradiol.
3.7. Analysis of Real Samples
During the experimental studies, the actual removal of β-estradiol from the spiked aqueous samples was investigated. The two-level spiked effluent wastewater samples showed that the adsorption method could remove between 93 and 100%. This proved that no significant interferences on the adsorption properties were experienced due to the presence of other wastewater components. The performance parameters of the method developed in the present study were in fact comparable with other reported β-estradiol removal methods based on adsorption, except for References [18,57], as summarized in Table 5.
Table 5.
Comparison of materials used in previous reports for the removal of β-estradiol from water samples.
3.8. Regeneration Studies
The reusability and regeneration of the prepared akaganeite nanorods were evaluated by performing a series of adsorption–desorption cycles (Figure S4). Desorption of the analyte was achieved using 100% acetonitrile. Thereafter, the adsorbent was washed with an ethanol–water solution and dried in an oven at 50 °C. The removal efficiency of the nanoadsorbent toward β-estradiol slightly decreased after the 6th usage/regeneration cycle; however, it remained at >90%. These findings suggested that the akaganeite nanoadsorbent could be regenerated and subjected to multiple usages with suitable robustness and reusability properties.
4. Conclusions
Akaganeite nanoparticles generated via a facile and simple synthesis route using a precipitation technique are highly useful for the adsorptive removal of β-estradiol. A variety of characterization techniques, including XRD, SEM, EDX, and TEM, confirmed the formation of akaganeite nanoparticles that are predominantly rod-shaped. The method was demonstrated to remove β-estradiol at concentrations up to 8 mg L−1 from a variety of spiked aqueous solutions with removal efficiencies of 93–100%. The adsorption process was characterized using both linear and adjusted non-linear models. The adsorption process followed pseudo-second order kinetics and a Langmuir isotherm model with a maximum adsorption capacity of 97.0 mg g−1 for the linearized isotherm model. The adjusted non-linear Langmuir isotherm resulted in a maximum adsorption capacity of 102 mg g−1, which was comparable to the linear model. The akaganeite nanoparticles also could be reused during up to six adsorption/desorption cycles maintaining an approx. 90% removal efficiency. Hence, a low-cost and environmentally friendly adsorbent was demonstrated, which is a suitable candidate for water treatment via adsorption for hormone-like substances such as β-estradiol.
Supplementary Materials
The following are available online at https://www.mdpi.com/2227-9717/8/9/1197/s1, Figure S1: FTIR of akaganeite after adsorption; Figure S2: Pareto chart of the standardized relevance of the individual variables affecting the adsorbing performance of the synthesized materials. The red line indicates the 95% confidence interval. The linear interactions of these factors are: 1Lby2L (pH–MA interaction), 2Lby3L (MA–CT interaction) and 1Lby3L (pH–CT interaction); Figure S3: Response surface plots showing the interaction effects of the main parameters pH, adsorbent material mass (MA), and contact time (CT); Figure S4: Desirability function for the main parameters pH, adsorbent material mass (MA), and contact time (CT); Figure S5: Regeneration studies.
Author Contributions
A.M., B.M. and P.N.N., conceptualization; A.M. and P.N.N., method development; P.N.N., chemometrics; A.M. and A.N., sampling; A.M. and A.N., investigation; A.M., synthesis and characterization, A.M. and A.N., data collection; A.M., writing—original draft; A.M., A.N. and P.N.N., writing—review and editing; P.N.N., resources; B.M. and P.N.N., supervision. All authors have read and agreed to the published version of the manuscript.
Funding
This research was funded by the National Research Foundation (NRF, South Africa, grant nos. 113010 and 91230).
Acknowledgments
The authors would like to acknowledge the Department of Chemical Sciences, University of Johannesburg (Doornfontein Campus) for providing laboratory space and other resources required in this project
Conflicts of Interest
The authors declare no conflict of interest.
References
- Halder, J.N.; Islam, M.N. Water Pollution and its Impact on the Human Health. J. Environ. Hum. 2015, 2, 36–46. [Google Scholar]
- Chen, M.; Zhang, J. Bioremediation of soils contaminated with polycyclic aromatic hydrocarbons, petroleum, pesticides, chlorophenols and heavy metals by composting: Applications, microbes and future research needs. Biotechnol. Adv. 2015, 33, 745–755. [Google Scholar] [PubMed]
- Jacobsen, C.S.; Hjelmsø, M.H. Agricultural soils, pesticides and microbial diversity. Curr. Opin. Biotechnol. 2014, 27, 15–20. [Google Scholar] [PubMed]
- Kassotis, C.D.; Alvarez, D.A.; Taylor, J.A.; Frederick, S.; Nagel, S.C.; Tillitt, D.E. Characterization of Missouri surface waters near point sources of pollution reveals potential novel atmospheric route of exposure for bisphenol A and wastewater hormonal activity pattern. Sci. Total Environ. 2015, 524–525, 384–393. [Google Scholar]
- Harley, K.G.; Gunier, R.B.; Kogut, K.; Johnson, C.; Bradman, A.; Calafat, A.M.; Eskenazi, B. Prenatal and early childhood bisphenol A concentrations and behavior in school-aged children. Environ. Res. 2013, 126, 43–50. [Google Scholar]
- Jiang, L.H.; Liu, Y.G.; Zeng, G.M.; Xiao, F.Y.; Hu, X.J.; Hu, X.; Wang, H.; Li, T.T.; Zhou, L.; Tan, X.F. Removal of 17β-estradiol by few-layered graphene oxide nanosheets from aqueous solutions: External influence and adsorption mechanism. Chem. Eng. J. 2016, 284, 93–102. [Google Scholar]
- Zaib, Q.; Khan, I.A.; Saleh, N.B.; Flora, J.R.V.; Park, Y.G.; Yoon, Y. Removal of bisphenol a and 17β-estradiol by single-walled carbon nanotubes in aqueous solution: Adsorption and molecular modeling. Water. Air. Soil Pollut. 2012, 223, 3281–3293. [Google Scholar]
- Silva, C.P.; Lima, D.L.D.; Schneider, R.J.; Otero, M.; Esteves, V.I. Development of ELISA methodologies for the direct determination of 17β-estradiol and 17α-ethinylestradiol in complex aqueous matrices. J. Environ. Manag. 2013, 124, 121–127. [Google Scholar]
- Fisher, A.M.; Thornton, B.J. Method for the Detection of 17-B-estradiol in Wastewater Facility Effluents Using HPLC. 2018. Available online: https://knowledge.e.southern.edu/research_bio/8/ (accessed on 15 August 2020).
- Janegitz, B.C.; Dos Santos, F.A.; Faria, R.C.; Zucolotto, V. Electrochemical determination of estradiol using a thin film containing reduced graphene oxide and dihexadecylphosphate. Mater. Sci. Eng. C 2014, 37, 14–19. [Google Scholar]
- Moraes, F.C.; Rossi, B.; Donatoni, M.C.; de Oliveira, K.T.; Pereira, E.C. Sensitive determination of 17β-estradiol in river water using a graphene based electrochemical sensor. Anal. Chim. Acta 2015, 881, 37–43. [Google Scholar]
- Yin, Z.; Liu, Y.; Tan, X.; Jiang, L.; Zeng, G.; Liu, S.; Tian, S.; Liu, S.; Liu, N.; Li, M. Adsorption of 17Β-estradiol by a novel attapulgite/biochar nanocomposite: Characteristics and influencing factors. Process Saf. Environ. Prot. 2019, 121, 155–164. [Google Scholar] [CrossRef]
- Kawasaki, N.; Ogata, F.; Yamaguchi, I.; Tominaga, H. Degradation Characteristics of 17 b -Estradiol by Ozone Treatment with Activated Carbon. J. Oleo Sci. 2009, 266, 261–266. [Google Scholar] [CrossRef] [PubMed]
- Naimi, I.; Bellakhal, N. Removal of 17 β -Estradiol by Electro-Fenton Process. Mater. Sci. Appl. 2012, 3, 880–886. [Google Scholar]
- Hashimoto, T.; Murakami, T. Removal and degradation characteristics of natural and synthetic estrogens by activated sludge in batch experiments. Water Res. 2009, 43, 573–582. [Google Scholar] [CrossRef] [PubMed]
- Heo, J.; Flora, J.R.V.; Her, N.; Park, Y.G.; Cho, J.; Son, A.; Yoon, Y. Removal of bisphenol A and 17β-estradiol in single walled carbon nanotubes-ultrafiltration (SWNTs-UF) membrane systems. Sep. Purif. Technol. 2012, 90, 39–52. [Google Scholar] [CrossRef]
- Saifuddin, N.; Nur, Y.A.; Abdullah, S.F. Microwave enhanced synthesis of chitosan-graft-polyacrylamide molecular imprinting polymer for selective removal of 17 β-estradiol at trace concentration. Asian J. Biochem. 2011, 6, 38–54. [Google Scholar] [CrossRef][Green Version]
- Duan, Q.; Li, X.; Wu, Z.; Alsaedi, A.; Hayat, T.; Chen, C.; Li, J. Adsorption of 17 b -estradiol from aqueous solutions by a novel hierarchically nitrogen-doped porous carbon. J. Colloid Interface Sci. 2019, 533, 700–708. [Google Scholar] [CrossRef]
- Yuan, Z.Y.; Su, B.L. Surfactant-assisted nanoparticle assembly of mesoporous β-FeOOH (akaganeite). Chem. Phys. Lett. 2003, 381, 710–714. [Google Scholar] [CrossRef]
- Pepper, R.A.; Couperthwaite, S.J.; Millar, G.J. A novel akaganeite sorbent synthesised from waste red mud: Application for treatment of arsenate in aqueous solutions. J. Environ. Chem. Eng. 2018, 6, 6308–6316. [Google Scholar] [CrossRef]
- Kyzas, G.Z.; Peleka, E.N.; Deliyanni, E.A. Nanocrystalline akaganeite as adsorbent for surfactant removal from aqueous solutions. Materials 2013, 6, 184–197. [Google Scholar] [CrossRef]
- Kim, J.; Li, W.; Philips, B.L.; Grey, C.P. Phosphate adsorption on the iron oxyhydroxides goethite ([small alpha]-FeOOH), akaganeite ([small beta]-FeOOH), and lepidocrocite ([gamma]-FeOOH): A 31P NMR Study. Energy Environ. Sci. 2011, 4, 4298–4305. [Google Scholar] [CrossRef]
- Chitrakar, R.; Tezuka, S.; Sonoda, A.; Sakane, K.; Ooi, K.; Hirotsu, T. Phosphate adsorption on synthetic goethite and akaganeite. J. Colloid Interface Sci. 2006, 298, 602–608. [Google Scholar] [CrossRef] [PubMed]
- Mashile, P.P.; Mpupa, A.; Nomngongo, P.N. Adsorptive removal of microcystin-LR from surface and wastewater using tyre-based powdered activated carbon: Kinetics and isotherms. Toxicon 2018, 145, 25–31. [Google Scholar] [CrossRef] [PubMed]
- Vera Candioti, L.; De Zan, M.M.; Cámara, M.S.; Goicoechea, H.C. Experimental design and multiple response optimization. Using the desirability function in analytical methods development. Talanta 2014, 124, 123–138. [Google Scholar] [CrossRef]
- Murad, E.; Bishop, J.L. The infrared spectrum of synthetic akaganéite, β-FeOOH. Am. Mineral. 2000, 85, 716–721. [Google Scholar] [CrossRef]
- Tufo, A.E.; Larralde, A.L.; Villarroel-Rocha, J.; Sapag, K.; Sileo, E.E. Synthesis and characterization of pure and Al-substituted akaganeites and evaluation of their performance to adsorb As(V). J. Environ. Chem. Eng. 2018, 6, 7044–7053. [Google Scholar] [CrossRef]
- Wilkinson, L. Revising the Pareto chart. Am. Stat. 2006, 60, 332–334. [Google Scholar] [CrossRef]
- Tabachnick, B.G. Experimental Designs Using ANOVA; Thomson/Brooks/Cole: Belmont, CA, USA, 2007; ISBN 020532178X. [Google Scholar]
- Dunford, R.; Su, Q.; Tamang, E. The pareto principle. Plymouth Stud. Sci. 2014, 7, 140–148. [Google Scholar]
- Nomngongo, P.N.; Ngila, J.C.; Msagati, T.A.M.; Moodley, B. Chemometric optimization of hollow fiber-liquid phase microextraction for preconcentration of trace elements in diesel and gasoline prior to their ICP-OES determination. Microchem. J. 2014, 114, 141–147. [Google Scholar] [CrossRef]
- Mashile, G.P.; Mpupa, A.; Nomngongo, P.N. In-syringe micro solid-phase extraction method for the separation and preconcentration of parabens in environmental water samples. Molecules 2018, 23, 1450. [Google Scholar] [CrossRef]
- Khor, C.P.; bt Jaafar, M.; Ramakrishnan, S. Optimization of Conductive Thin Film Epoxy Composites Properties Using Desirability Optimization Methodology. J. Optim. 2016, 2016, 1–8. [Google Scholar] [CrossRef]
- Nqombolo, A.; Mpupa, A.; Gugushe, A.S.; Moutloali, R.M.; Nomngongo, P.N. Adsorptive removal of lead from acid mine drainage using cobalt-methylimidazolate framework as an adsorbent: Kinetics, isotherm, and regeneration. Environ. Sci. Pollut. Res. 2019, 26, 3330–3339. [Google Scholar] [CrossRef]
- Biata, N.R.; Jakavula, S.; Mashile, G.P.; Nqombolo, A.; Moutloali, R.M.; Nomngongo, P.N. Recovery of gold (III) and iridium (IV) using magnetic layered double hydroxide (Fe3O4/Mg-Al-LDH) nanocomposite: Equilibrium studies and application to real samples. Hydrometallurgy 2020, 197, 105447. [Google Scholar] [CrossRef]
- Gugushe, A.S.; Mpupa, A.; Nomngongo, P.N. Ultrasound-assisted magnetic solid phase extraction of lead and thallium in complex environmental samples using magnetic multi-walled carbon nanotubes/zeolite nanocomposite. Microchem. J. 2019, 149, 103960. [Google Scholar] [CrossRef]
- Ayawei, N.; Ebelegi, A.N.; Wankasi, D. Modelling and Interpretation of Adsorption Isotherms. J. Chem. 2017, 2017, 1–11. [Google Scholar] [CrossRef]
- Gui, W.; Tian, C.; Sun, Q.; Li, S.; Zhang, W.; Tang, J.; Zhu, G. Simultaneous determination of organotin pesticides by HPLC-ICP-MS and their sorption, desorption, and transformation in freshwater sediments. Water Res. 2016, 95, 185–194. [Google Scholar] [CrossRef]
- Riahi, K.; Chaabane, S.; Thayer, B. Ben A kinetic modeling study of phosphate adsorption onto Phoenix dactylifera L. date palm fibers in batch mode. J. Saudi Chem. Soc. 2017, 21, S143–S152. [Google Scholar] [CrossRef]
- Rehman, S.; Adil, A.; Shaikh, A.J.; Shah, J.A.; Arshad, M.; Ali, M.A.; Bilal, M. Role of sorption energy and chemisorption in batch methylene blue and Cu 2+ adsorption by novel thuja cone carbon in binary component system: Linear and nonlinear modeling. Environ. Sci. Pollut. Res. 2018, 25, 31579–31592. [Google Scholar] [CrossRef]
- Sadeghalvad, B.; Khosravi, S.; Azadmehr, A.R. Nonlinear isotherm and kinetics of adsorption of copper from aqueous solutions on bentonite. Russ. J. Phys. Chem. A 2016, 90, 2285–2291. [Google Scholar] [CrossRef]
- Guechi, E.K.; Hamdaoui, O. Sorption of malachite green from aqueous solution by potato peel: Kinetics and equilibrium modeling using non-linear analysis method. Arab. J. Chem. 2016, 9, S416–S424. [Google Scholar] [CrossRef]
- Vieira, R.M.; Vilela, P.B.; Becegato, V.A.; Paulino, A.T. Chitosan-based hydrogel and chitosan/acid-activated montmorillonite composite hydrogel for the adsorption and removal of Pb+ 2 and Ni+ 2 ions accommodated in aqueous solutions. J. Environ. Chem. Eng. 2018, 6, 2713–2723. [Google Scholar] [CrossRef]
- Gugushe, A.S.; Nqombolo, A.; Nomngongo, P.N. Application of Response Surface Methodology and Desirability Function in the Optimization of Adsorptive Remediation of Arsenic from Acid Mine Drainage Using Magnetic Nanocomposite: Equilibrium Studies and Application to Real Samples. Molecules 2019, 24, 1792. [Google Scholar] [CrossRef] [PubMed]
- Vafajoo, L.; Cheraghi, R.; Dabbagh, R.; McKay, G. Removal of cobalt (II) ions from aqueous solutions utilizing the pre-treated 2-Hypnea Valentiae algae: Equilibrium, thermodynamic, and dynamic studies. Chem. Eng. J. 2018, 331, 39–47. [Google Scholar] [CrossRef]
- Nagy, B.; Mânzatu, C.; Măicăneanu, A.; Indolean, C.; Barbu-Tudoran, L.; Majdik, C. Linear and nonlinear regression analysis for heavy metals removal using Agaricus bisporus macrofungus. Arab. J. Chem. 2017, 10, S3569–S3579. [Google Scholar] [CrossRef]
- Jain, S.N.; Shaikh, Z.; Mane, V.S.; Vishnoi, S.; Mawal, V.N.; Patel, O.R.; Bhandari, P.S.; Gaikwad, M.S. Nonlinear regression approach for acid dye remediation using activated adsorbent: Kinetic, isotherm, thermodynamic and reusability studies. Microchem. J. 2019, 148, 605–615. [Google Scholar]
- Aazza, M.; Ahlafi, H.; Moussout, H.; Maghat, H. Adsorption of metha-nitrophenol onto alumina and HDTMA modified alumina: Kinetic, isotherm and mechanism investigations. J. Mol. Liq. 2018, 268, 587–597. [Google Scholar] [CrossRef]
- Hu, X.; Wang, J.; Liu, Y.; Li, X.; Zeng, G.; Bao, Z.; Zeng, X.; Chen, A.; Long, F. Adsorption of chromium (VI) by ethylenediamine-modified cross-linked magnetic chitosan resin: Isotherms, kinetics and thermodynamics. J. Hazard. Mater. 2011, 185, 306–314. [Google Scholar]
- Mashile, G.P.; Mpupa, A.; Nqombolo, A.; Dimpe, K.M.; Nomngongo, P.N. Recyclable magnetic waste tyre activated carbon-chitosan composite as an effective adsorbent rapid and simultaneous removal of methylparaben and propylparaben from aqueous solution and wastewater. J. Water Process Eng. 2020, 33, 101011. [Google Scholar]
- Fu, J.; Chen, Z.; Wang, M.; Liu, S.; Zhang, J.; Zhang, J.; Han, R.; Xu, Q. Adsorption of methylene blue by a high-efficiency adsorbent (polydopamine microspheres): Kinetics, isotherm, thermodynamics and mechanism analysis. Chem. Eng. J. 2015, 259, 53–61. [Google Scholar]
- Liu, Y.; Xiong, Y.; Xu, P.; Pang, Y.; Du, C. Enhancement of Pb (II) adsorption by boron doped ordered mesoporous carbon: Isotherm and kinetics modeling. Sci. Total Environ. 2020, 708, 134918. [Google Scholar]
- Tavlieva, M.P.; Genieva, S.D.; Georgieva, V.G.; Vlaev, L.T. Journal of Colloid and Interface Science Kinetic study of brilliant green adsorption from aqueous solution onto white rice husk ash. J. Colloid Interface Sci. 2013, 409, 112–122. [Google Scholar] [PubMed]
- Minaev, B.F.; Minaeva, V.A. Study of IR spectrum of the 17β-estradiol using quantum-chemical density functional theory. Biopolym. Cell 2006, 22, 363. [Google Scholar]
- Jemutai-Kimosop, S.; Orata, F.; Shikuku, V.O.; Okello, V.A.; Getenga, Z.M. Insights on adsorption of carbamazepine onto iron oxide modified diatomaceous earth: Kinetics, isotherms, thermodynamics, and mechanisms. Environ. Res. 2020, 180, 108898. [Google Scholar] [PubMed]
- Volesky, B. Biosorption and me. Water Res. 2007, 41, 4017–4029. [Google Scholar]
- Tang, P.; Sun, Q.; Zhao, L.; Tang, Y.; Liu, Y.; Pu, H.; Gan, N.; Liu, Y.; Li, H. A simple and green method to construct cyclodextrin polymer for the effective and simultaneous estrogen pollutant and metal removal. Chem. Eng. J. 2019, 366, 598–607. [Google Scholar]
- Sun, W.; Zhang, C.; Xu, N.; Ni, J. Effect of inorganic nanoparticles on 17 b -estradiol and 17 a -ethynylestradiol adsorption by multi-walled carbon nanotubes. Environ. Pollut. 2015, 205, 111–120. [Google Scholar]
- Shi, W.; Li, S.; Chen, B.; Wang, C.; Sun, W. Effects of Fe2O3 and ZnO nanoparticles on 17 b -estradiol adsorption to carbon nanotubes. Chem. Eng. J. 2017, 326, 1134–1144. [Google Scholar]
© 2020 by the authors. Licensee MDPI, Basel, Switzerland. This article is an open access article distributed under the terms and conditions of the Creative Commons Attribution (CC BY) license (http://creativecommons.org/licenses/by/4.0/).