Article

Solar Photo-Assisted Degradation of Bipyridinium Herbicides at Circumneutral pH: A Life Cycle Assessment Approach

by
Alejandra Teutli-Sequeira
1,
Ruben Vasquez-Medrano
2,*,
Dorian Prato-Garcia
3 and
Jorge G. Ibanez
2
1
Catedras CONACYT, Instituto Interamericano de Tecnología y Ciencias del Agua, Universidad Autónoma del Estado de México, Carretera Toluca-Atlacomulco Km. 14.5 Unidad San Cayetano, Toluca de Lerdo 50200, Mexico
2
Departamento de Ingeniería Química, Industrial y de Alimentos, Universidad Iberoamericana Ciudad de México, Prolongación Paseo de la Reforma 880, Lomas de Santa Fe 01219, Mexico
3
Facultad de Ingeniería y Administración, Universidad Nacional de Colombia, Sede Palmira, Carrera 32 No. 12-00, Chapinero, Vía Candelaria, Palmira 76520000, Colombia
*
Author to whom correspondence should be addressed.
Processes 2020, 8(9), 1117; https://doi.org/10.3390/pr8091117
Submission received: 30 July 2020 / Revised: 29 August 2020 / Accepted: 2 September 2020 / Published: 8 September 2020
(This article belongs to the Special Issue Water Purification Technologies: Advanced Oxidation Processes)

Abstract

:
This study investigated the degradation of the herbicides diquat (DQ) and paraquat (PQ) by a solar photo-Fenton process that is mediated by Fe(III)-oxalate complexes at circumneutral pH = 6.5 in compound parabolic collectors (CPC)-type reactors. The photo-Fenton process operates efficiently at acidic pH; however, circumneutral operation was key to overcome drawbacks, such as acidification and neutralization steps, reagent costs, and the environmental footprint of chemical auxiliaries. This work revealed a remarkable reduction of total organic carbon for PQ (87%) and DQ (80%) after 300 min (at ca. 875 kJ L−1). Phytotoxicity assays confirmed that the treatment led to a considerable increase in the germination index for DQ (i.e., from 4.7% to 55.8%) and PQ (i.e., from 16.5% to 59.7%) using Cucumis sativus seeds. Importantly, treatment costs (DQ = USD$8.05 and PQ = USD$7.72) and the carbon footprint of the process (DQ = 7.37 and PQ = 6.29 kg CO2-Eqv/m3) were within the ranges that were reported for the treatment of recalcitrant substances at acidic conditions in CPC-type reactors. Life cycle assessment (LCA) evidenced that H2O2 and electricity consumption are the variables with the highest environmental impact because they contribute with ca. 70% of the carbon footprint of the process. Under the studied conditions, a further reduction in H2O2 use is counterproductive, because it could impact process performance and effluent quality. On the other hand, the main drawback of the process (i.e., energy consumption) can be reduced by using renewable energies. The sensitivity study evidenced that carbon footprint is dependent on the energy share of the local electricity mix; therefore, the use of more renewable electrical energy sources, such as wind-power and photovoltaic, can reduce greenhouse gases emissions of the process an average of 26.4% (DQ = 5.57 and PQ = 4.51 kg CO2-Eqv/m3) and 78.4% (DQ = 3.72 and PQ = 2.65 kg CO2-Eqv/m3), respectively. Finally, from the economic and environmental points of view, the experimental results evidenced that photo-assisted treatment at circumneutral pH is an efficient alternative to deal with quaternary bipyridinium compounds.

1. Introduction

Diquat (DQ: C12H12Br2N2, 6,7-dihydrodipyrido[1,2-a:2′,1′-c]pyrazinediium dibromide) (Figure 1a) and paraquat (PQ: C12H14Cl2N2, 1,1′-dimethyl-4,4′-bipyridinium dichloride) (Figure 1b) are quaternary bipyridinium compounds that are extensively used in agriculture for post-emergence weed application, and as desiccants because of their potent herbicide action [1,2]. The degradation of PQ and DQ in the soil takes place through several mechanisms, such as photodegradation, chemical degradation, and microbial metabolism. Photodegradation reactions take place on the soil surface [3] and they depend on the intensity of UV light in the wavelength range of 285 nm to 310 nm [4,5]. On the other hand, various groups of microorganisms, such as bacteria and actinomycetes, which use paraquat as a source of nitrogen [6]. Microbial degradation can be limited by rapid soil adsorption and slows down when PQ becomes fixed in a clay network [7]. PQ is completely degraded by soil microorganisms within six years into ammonia, carbon dioxide, and water [8]. PQ is not readily degraded by microbes in river water samples, since more than 80% of the initial concentration remained unchanged, even after 56 days of incubation, which suggests its intrinsic recalcitrance [9]. The high polarity of PQ and DQ makes them highly soluble in water (i.e., 620 g L–1 and 700 g L−1 at 20 °C, respectively) and, therefore, highly mobile in some soils and able to pass through some treatment steps in water treatment plants, thus reaching water distribution systems [10,11,12,13]. DQ and PQ application results in the contamination of surface and river waters due to their intensive use in agriculture [1,14].
PQ and DQ removal typically relies on various adsorbent materials, like activated carbons [15], swine manure-derived biochar [16], montmorillonitic and kaolinitic clay minerals [17], diatomaceous earths [18], activated bleaching earths [19], methacrylic acid-modified rice husk [20], and phillipsite-faujacite tuff [21]. A main disadvantage of adsorption methods is their environmentally partial character, because they only perform a phase transference but do not damage pollutants. In this situation, the spent adsorbent converts into a dangerous material itself, requiring further treatment [22]. Because conventional treatments are not effective for PQ and DQ removal, advanced oxidation processes (AOPs) have gained attention as innovative, greatly efficient, and environmentally friendly alternatives for the treatment of refractory organic matter. In AOPs, the generation of hydroxyl radicals (OH), which are among the most powerful oxidants known (E0 = 2.8 V vs. standard hydrogen electrode (SHE)), facilitates the biocompatibilization or mineralization of complex molecules within a short period of time [23,24,25]. Different AOPs have been investigated as environmentally friendly alternatives for the degradation of PQ and DQ in heterogeneous (e.g., immobilized or suspended TiO2, electrochemical methods, and Fe-modified activated carbon combined with H2O2) and homogeneous (e.g., Fenton’s reagent) phases [15,22,26,27,28]. Special interest has been given to photo-Fenton processes and heterogeneous photocatalysis due to the option of using solar radiation, thus decreasing the energetic costs. Zahedi et al. studied the degradation of paraquat by a photocatalytic process while using N, S-codoped TiO2 thin films. UV–Vis results indicated that, at optimum pH = 5.8, a maximum decomposition of 84.39% occurred after a 5 h visible light irradiation for an initial concentration of 10 mg L−1 [5]. Sorolla investigated the photocatalytic degradation of paraquat employing mesoporous-assembled Cu-TiO2/SBA15 under UV and visible light [28]. The study conducted by Zepp et al. demonstrated that the [Fe(OH)]2+ ion, the preeminent form of Fe(III) at pH 2.8–3.5, plays a key role when the dark Fenton process is photoassisted by UV irradiation leading to the photo-Fenton process. This procedure can utilize UVA (λ = 315–400 nm), UVB (λ = 285–315 nm), and UVC (λ < 285 nm) radiations as energy source, although their intensities and wavelengths have significant influence on the destruction rate of organic pollutants. Several works have shown that the alternative use of sunlight (λ > 300 nm) as a free and renewable energy source in the solar photo-Fenton process is also useful for wastewater remediation [29]. Among the different light-driven AOPs, solar-powered processes (such as solar photo-Fenton) are considered to be among the most environmentally friendly and cost-effective processes. This is attributed to the fact that natural solar light (instead of artificial irradiation) is employed to generate hydroxyl radicals, which drive the treatment process [30]. The Fenton reaction (Equation (1)) is a useful supply of hydroxyl radicals liberated by the breakdown of H2O2 in the presence of Fe(II) at an acidic pH (2.8–3.0), which avoids the precipitation of Fe as amorphous ferric oxyhydroxides [23,25]. The combination of the Fenton reaction with light (Equation (2)) improves the efficiency of the process due to the breakdown of the photoactive Fe(OH)2+, leading to a significant increase in the production of OH radicals in solution and easing the cyclic regeneration of Fe2+ [23,25].
Fe2+ + H2O2OH + OH + Fe3+ (k = 63 M-1 s−1)
Fe(OH)2+ + → Fe2+ + OH
The photochemical properties of iron can be significantly improved throughout its complexation with organic moieties, such as oxalate. In reality, oxalate is abundant in nature and it is recognized to strongly complex with iron [25,31,32]. As an option to the conventional photo-Fenton process for the oxidation of organic matter, the ferrioxalate-type system (Equation (3)) permits extending the operational pH range closer to neutrality due to the complexation of iron with oxalate [25,31]. The obliteration of organic pollutants with ferrioxalate as an iron resource in photo-Fenton processes has been effectively applied also under solar radiation, since it can absorb radiation up to 550 nm and, therefore, it utilizes a significant segment of the solar spectrum [31,33,34,35]. The photo-destruction of this complex regenerates Fe2+ that is critical for the catalysis of the Fenton reaction. Additional free radicals and species are also produced (Equations (4) and (6)), including the highly oxidizing CO2•− radical anion (E0 = −1.9 V vs. SHE) [25,32].
Fe(C2O4) + H2O2 → Fe(C2O4)+ + OH + OH
Fe(C2O4)33− + hν → Fe2+ + 2C2O42 + C2O4
Fe(C2O4)33− + C2O4 → Fe2+ + 3C2O42− + 2CO2
C2O4•− → CO2•− + CO2
The present study furthers this approach by applying the experimental central composite design (CCD) and the response surface methodology (RSM) in order to determine the best operational conditions for the mineralization of PQ and DQ solutions at circumneutral pH (i.e., 6.0–6.5) in compound parabolic collectors (CPC)-type solar reactors. The variables studied in this photo-assisted process include sodium oxalate (Na2C2O4), iron (Fe3+), and peroxide (H2O2) concentrations. Bioassays are applied in order to identify the toxicity of samples from many origins, including those that were obtained after AOPs. Phytotoxicity tests were performed using cucumber seeds (Cucumis sativus L.) as bioindicators. The seeds were chosen as suggested by the Ecological Effects Test Guidelines [36]. Although photo-Fenton technologies are considered to be sustainable and promising for dealing with complex effluents, the scientific community and industrial sectors are very interested in the development of greener processes and products, because this issue has gained great relevance worldwide. Nowadays, the society and governmental agencies exert a continuous pressure for the development of sustainable treatment systems as well as the improvement of the existing ones [37,38,39]. Therefore, this study considers the evaluation of the environmental performance at circumneutral operation conditions through life cycle assessment (LCA) to identify, in advance, the environmental hotspots of this technology [39].

2. Materials and Methods

2.1. Reagents

Paraquat dichloride x-hydrate PESTANAL® (standard, 99% pure, Sigma-Aldrich), diquat dibromide monohydrate PESTANAL® (standard, 99% pure, Sigma-Aldrich), sodium oxalate (Baker Analyzed®, A.C.S., 99%), ferric chloride (Baker, Analyzed®, A.C.S., 99%), H2O2 (Meyer 29–32%, A.C.S certified), and ammonium metavanadate (NH4VO3, Sigma-Aldrich, 99.9% trace metals basis) were utilized, as received.

2.2. Analytical Techniques

The residual peroxide concentration in the course of the degradation of organic compounds in the photo-Fenton process was determined while using the spectrophotometric method (Varian Cary® (USA) 50 UV-vis, dual beam, Czerny-Turner monochromator, 190–1100 nm wavelength range) proposed by Nogueira [34]. The mineralization degree of the herbicides was estimated through the total organic carbon (TOC) concentration of each sample (Shimadzu TOC-V CPH Analyzer, Japan). Herbicide concentrations were obtained through UV-visible spectrophotometry with the same UV-Vis instrument (bandwidth = 1 nm; 4800 nm min−1; 10 mm quartz cuvettes). DQ and PQ elimination was evaluated based on variations in the maximum absorbance at λ = 309 nm and 257 nm, respectively. Aqueous solutions of DQ and PQ at different concentrations (0–10 mg L−1) were prepared and used in order to obtain a calibration curve (Figure S1, supplementary material). The samples were diluted as required in order to bring herbicide concentrations within the calibration range.

2.3. Experimental Setup

Photo-Fenton experiments were done in a compound parabolic collector (CPC) constructed for solar photocatalytic enforcement (Figure S2, supplementary material) while using 20 mL borosilicate glass tubes (Pyrex®, VR/VT = 1, being VR/VT the reaction to total volume ratio, concentration factor = 1.0). Reflectors were covered with aluminum foil. The reactor was held on a fixed platform in our facilities with an inclination degree of around 20° (corresponding to the local latitude) and a North-South orientation. The experiments were performed at a schedule from 11:00 a.m. to 3:00 p.m. Because of the solar radiation variability along the day, in the assessment of the developed kinetic models, we used the accumulated energy per unit of volume, QUV, instead of merely using the total irradiation time. The total accumulated radiation received by the tubes was quantified with a calibrated Solar® Light PMA 2100 radiometer (USA) equipped with a PMA 2110 UVA detector (320–400 nm spectral range) positioned over the CPC. The accumulated radiation per unit volume was determined with Equation (7) [40]:
Q U V , n = Q U V , n 1 +   Δ t UV g , n ¯ A C S V E R
where QUV,n is the accumulated energy per unit volume (kJ L−1), Δt is the irradiation time (s), ACS is the area of solar radiation capture (m2), VER is the reaction volume (L), and UVg,n is the incident solar radiation (W m−2).

2.4. Experimental Design

In this study, we used a central composite design (Table S1, supplementary material) to define the effect of Fe3+ (X1) and H2O2 (X2) concentrations on the mineralization of PQ and DQ. For the photo-Fenton process, the CCD consisted of a sequence of 13 experiments. All of the experiments were performed simultaneously in 13 identical CPC-type solar reactors to decrease the effect of solar radiation variability on the mineralization of PQ and DQ. Pareto charts were built for the determination of the most significant process variables, which were modeled by means of the analysis of variance technique (ANOVA). All of the experiments were performed under stationary conditions (i.e., no flow). The relative significance of process variables was determined through Pareto analysis by the full factorial design. For CCD, the equations used to quantitatively explain each system and draw the response surface plots were constructed using Minitab 18 (Minitab Inc. USA) and Design Expert® V10 software (Design Expert, Stat-Ease, Inc. USA).

2.5. Kinetic Experiments

The kinetic experiments were performed under previously selected optimum conditions. The samples were collected at intervals of 30 min for up to 300 min. After sampling and before analysis, an estimated volume of 2.0 M Na2SO3 solution was added to the samples, according to the required stoichiometric ratio between H2O2 and Na2SO3, thus ensuring the removal of the residual H2O2 to stop the Fenton reaction and the interference by H2O2 traces in the toxicity tests [41].

2.6. Phytotoxicity Assays

The method that was used in the phytotoxicity tests was adapted from Gerber [42], Mendes [43], and Zucconi [44]. Bioassays addressed the samples of untreated and treated herbicide solutions using cucumber seeds (Cucumis sativus L.) as bioindicators [36]. Ten cucumber seeds were placed over a qualitative filter paper (Whatman No. 1) inside 55 mm diameter Petri dishes, and then treated by placing them in contact with 1 mL of each of the following solutions: control with distilled water, untreated solution (100 mg L−1 PQ or DQ), and treated herbicide solution. Three repeats were conducted per batch. The Petri dishes were covered with Parafilm in order to favor gas exchange and to reduce humidity losses. Successively, the Petri dishes with the cucumber seeds were incubated in a growth chamber at 20 °C in the dark for 72 h. The germination index (G.I.) was evaluated from the number of germinated seeds in each analyzed sample, GSs, and in the control, GSC, as follows [41]:
G . I . % = G S s G S C × L R S L R C × 100
In Equation (8), LRS and LRC represent the average root lengths observed in each sample compared to the control seeds, respectively.

2.7. Environmental Assessment

The present study considered the four most essential stages described in ISO14040 for the environmental analysis of processes: (1) goal and scope definition, (2) inventory analysis, (3) impact assessment, and (4) interpretation [45,46]. For the life cycle assessment (LCA), we used as functional unit the treatment of 1 m3 of wastewater contaminated with 100 mg L−1 of DQ or 100 mg L−1 of PQ. The useful life of the treatment plant was set at 20 years and the minimal efficiency for the process was the removal of 80% of TOC. It must be pointed out that the post-treatment of the effluents generated in the process will be performed in an urban wastewater treatment plant; hence, the environmental impact that is caused by this process will not be considered in this study (cradle-to-grave approach) [45,46]. All of the information required for the analysis of the stages constituting the ferrioxalate-assisted photo-Fenton treatment process in the CPC-type reactor was obtained from the Ecoinvent (v3.3) database (Switzerland) [47]. Table S2 (supplementary material) depicts the list of materials and reagents that are needed for the operation of the treatment system along its useful life. The treatment system operated in batch conditions and considered the following stages: (1) preparation and storage of reagents, (2) transport of 1 m3 of wastewater contaminated with either PQ or DQ to the reactor, (3) supply of the catalyst (Fe3+-Na2C2O4), (4) agitation, (5) supply of the oxidant (H2O2), (6) reaction, and (7) unloading of the reactor. For the LCA, the following were considered: (a) production and transport of reagents (H2O2, and Fe3+), (b) production and transport of construction materials (ceramic, steel, bricks, cement, sand, gravel, polyethylene, polypropylene, borosilicate glass, anodized aluminum), and (c) electricity production and voltage transformation. In Mexico, most of the electricity is generated in thermal stations from petroleum derivatives (natural gas = 58%, coal = 14%, petroleum = 11%) and renewable sources (hydroelectrical = 15%, wind-power = 2%). Evaluation of the environmental impact of the process was performed with the LCA open software v. 1.6.3, Green Delta® (Germany) using the IPPC-2013 (Intergovernmental Panel on Climate Change) method. The IPPC-2013 method is particularly attractive for this type of analysis, because it uses the CO2 equivalent emissions (CO2-Eqv.) to rate the environmental performance of a process [37,48].

2.8. Cost Analysis

The cost analysis took, as reference, the treatment of 10 m3 of wastewater contaminated with 100 mg L−1 of DQ or 100 mg L−1 of PQ. The wastewater treatment plant will perform one cycle per day and will operate 330 days of the year. Fixed costs were considered (i.e., design, construction, and start-up, contingency, system engineering and assembly, and spare parts) and the operational costs (personnel, maintenance, electricity, and chemical supplies) in order to determine the annual average cost of the treatment. A detailed discussion about estimating the costs that are associated with an advanced oxidation system in a CPC-type reactor can be found in the corresponding specialized literature [40]. Table S3 details the procedure for the estimation of costs (supplementary material).

3. Results and Discussion

3.1. Multivariate Analysis of the Photo-Fenton Process

This part of the investigation focused on evaluating the diminished effectiveness of the TOC concentration according to a series of factors to influence the yield of the photo-Fenton process mediated with Fe(III) oxalate, such as oxalate doses, ferric ion, hydrogen peroxide, the initial concentration of the herbicide, and pH. Importantly, the Fe3+ to oxalate ratio was kept constant at C2O42−/Fe3+ = 20 in order to ensure oxalate excess; this condition significantly widens the pH range for the Fenton reaction due to its strong complexation with iron [32]. The studied parameters were the initial ferric ion concentration and hydrogen peroxide, when considering the TOC reduction efficiency as the response variable. (Table S1, supplementary material). Preliminary tests were performed with PQ solutions at natural pH (i.e., pH = 6.5) with solar radiation and without iron during 5 h to evaluate the degradation percentage related with the PQ photolysis. The experiments with 50 mg L−1 of PQ indicated that the contaminant concentration stayed basically constant during treatment (data not shown). According to the experimental design, the following regression models (Equations (9) and (10)) were developed in order to correlate pollutant mineralization (i.e., TOC removal) with the independent factors. Figure 2 illustrates the response and contour plots of PQ and DQ mineralization under the selected operational conditions.
PQ = 33 + 7.8 Fe 3 + + 0.26 H 2 O 2 0.14 Fe 3 + 2 4.3 × 10 4 H 2 O 2 2 5.4 × 10 3 Fe 3 + H 2 O 2
DQ = 40 + 2.7 Fe 3 + 0.28 H 2 O 2 0.06 Fe 3 + 2 + 5.5 × 10 4 H 2 O 2 2 + 7.4 × 10 3 Fe 3 + H 2 O 2
From Equations (9) and (10), it can be seen that the initial Fe3+ concentration had a positive effect on the herbicide removal percentage. A positive value depicts an effect that benefits the mineralization of the herbicides, whereas a negative value shows an inverse relationship between the factor and the response. With further increases in iron, from 20 mg L−1 to 30 mg L−1, concentration becomes negative for the process because it reduces the mineralization degree of the sample (Figure 2). As mentioned in the literature [23,49,50,51], the most possible explanation is related to the scavenging of hydroxyl radicals by Fe3+ and consequent formation of less powerful oxidant species (Equations (11)–(13)). In addition, Fenton reactions at high concentrations of iron can be considered counterproductive, because they limit light penetration due to a higher absorption of the reaction media, as well as requiring a very strict pH control to reduce the precipitation of the catalyst as iron hydroxides [35,51]. From the economic and environmental perspective, higher doses of reagents are also considered to be counterproductive for the process, because they lead to an increase in operating cost and use of resources coming from the technosphere.
Fe2+ + OH → Fe3+ + OH
Fe3+ + H2O2 → Fe2+ + HO2 + H+
Fe2+ + HO2/O2−• + H+/2H+ → Fe3+ + H2O2
From Equation (9), though negative quadratic coefficients were found for [Fe3+] and [H2O2], their highly positive linear coefficients and the negative coefficient obtained for the interaction between [Fe3+] and [H2O2], benefits their mineralization when rising their concentrations. The effect can be observed in Figure 2a, where the diagram corresponds to the polynomials linked to the photo-Fenton reaction for the degradation of PQ and was made based on the results that are shown in Table S1. An analysis of the response surface (Figure 2a) reveals that an 87% of TOC removal can be obtained with 26.14 mg L−1 Fe3+ and 138.6 mg L−1 H2O2 for the degradation of 100 mg L−1 of PQ, after 300 min of treatment with 883.87 kJ L−1 of accumulated solar energy per unit volume. Trovo [12] showed experiments with a solar photo-Fenton process (pH = 2.5–2.8, PQ = 50 mg L1, H2O2 = 565 mg L1, irradiation time = 120 min, QUN,n = 1284 kJ L1 UVA radiation) that were also efficient for the removal and mineralization of PQ (TOC removal = 89%). Although this value is very similar to that observed in this work, H2O2 consumption was four-fold higher. In the case of DQ, the analysis of the response surface (Figure 2b) indicates that 80% of TOC removal can be obtained with 25.42 mg L−1 Fe3+ and 478 mg L−1 H2O2, for the degradation of 100 mg L−1 of DQ after 300 min of treatment with a total collected solar energy = 867.24 kJ L−1. The solution’s pH generally increased slightly during the process (i.e., from 6.5 to 7.5).

3.2. Kinetic Model for Paraquat and Diquat Removal

The kinetic study explains the removal rate of DQ and PQ while using a solar photo-assisted process that is mediated by Fe(III)-oxalate complexes with hydrogen peroxide (FeOx–H2O2) at circumneutral pH. Zero-, first-, and second-order models were tested, but the kinetic model that best fitted the data was the Behnajady–Modirshahla–Ghanbary (BMG) equation (Equation (14)) [50,51,52].
P Q ,     D Q Q U V   P Q ,     D Q 0   = 1 Q U V m + bQ U V
where P Q ,   D Q Q U V   is the concentration of PQ or DQ (mg L−1) at an accumulated energy per unit of volume, Q U V (kJ L−1), P Q ,   D Q 0   is the initial concentration of PQ or DQ (mg L−1), and m and b are two kinetic constants. As observed, 1/m is proportional to the initial decline rate of the herbicide (in a homogeneous liquid phase batch reactor), thus the greater 1/m, the quicker the initial decline rate of the herbicide. On the other hand, when t→∞, the 1/b value represents the maximum substrate removal; this means that the 1/b parameter is associated with the highest oxidation degree reached [51].
The nonlinear plots in Figure 3a,b show that the degradation of DQ and PQ follows the second-order kinetics and BMG models. Table 1 depicts the kinetic parameters and corresponding correlation coefficients (r2) for these models. In view of the relatively low regression coefficients (< 0.96), the first- and second-order kinetic models do not fit well the data for the entire photo-Fenton reaction. The high correlations (r2) obtained for the BMG model would propose that this model is appropriate for describing the DQ and PQ removal rate during the photo-Fenton oxidation. It is clear that the photo-Fenton reaction for DQ has a higher reaction rate than for PQ. Rapid decay was observed during the first 30 min and it was enough to reach the equilibrium state. The value of the correlation coefficient (r2) is greater than 0.98 and best describes the reaction following the BMG model. The BMG model has an empirical origin; nevertheless, it results are appropriate for representing the transformation or mineralization of the original compound by advanced oxidation processes because the degradation curves led to two well differentiated stages: A fast stage and a stagnant stage [50,51]. In ferrioxalate-type processes, the behavior of the fast stage is attributed to the temporal abundance of oxalate, iron, and peroxide that are required for the generation of radicals, such as OH, C2O4•−, and CO2•− (Equations (3)–(6)) [32,33,35]. On the other hand, the stagnant stage marks the exhaustion of the oxidant and deactivation of the catalyst due to the formation of iron hydroxides. It should be noted that the decrease of peroxide concentration led to important changes in the removal rate of the pollutants, because the generation of radicals is entirely linked to ferrioxalate photochemistry.

3.3. Phytotoxicity Assay

The tests were also performed with iron(III) and oxalate as blanks in order to verify their effect on the germination index, but there was no significant difference with distilled water. The untreated DQ and PQ solutions (100 mg L−1 PQ or DQ) showed high phytotoxicity towards the cucumber seeds (Table 2), since their germination in contact with untreated pesticide solutions was significantly lower than in the control experiments (i.e., distilled water). The phytotoxicity of the pesticide solutions significantly decreased after their photo-assisted treatment (residual concentration of 36 mg L−1 PQ and 29 mg L−1 DQ). Throughout the process, byproducts that were less harmful to cucumber seeds could have formed. This indicates either a decrease in toxicity or else that some components of the sample, such as nitrogen and iron, among others, may be acting as micronutrients. This toxicity decrease may be related to the reduction of aromatic complexes [53]. Degradation is initiated by opening the pyridine ring at the nitrogen-adjacent carbon bonds; then, an unsaturated amino aldehyde is produced through ring cleavage, since it is known that, when paraquat reacts with a strong oxidant, monopyridone and monoquat are formed as oxidation and demethylation products. Intermediate products do not always completely degrade, and some ring disintegration products have been identified as malate, succinate, N-formylglycine, picolinic acid, oxalate, formic, and methylamine [8,22]. The photo-assisted treatment led to an important growth in the G.I. which may be due to the existence of nitrates that promote protein synthesis [30,54]. Several studies also indicate that there is no specific limit value for G.I. and a non-phytotoxic effluent with a G.I. in the interval of 60% and 100% is possible [30,54]. The non-germination or unsatisfactory germination of the seeds is related to the formation of byproducts that have characteristics that can damage the seeds.

3.4. Environmental Analysis of the Treatment Process

Most of the studies on the treatment of complex substances by advanced oxidation processes have focused on technical and economic aspects, which have been used to assess their robustness and feasibility. When compared to conventional treatment processes (e.g., coagulation-flocculation, adsorption, and chemical oxidation), photo-Fenton processes offer the following advantages: They can operate at environmental temperature and pressure, use non-toxic or hazardous reagents, and take advantage of solar energy to catalyze the process [30,37,55]. Notwithstanding, pH adjustment, H2O2 consumption, and the intensive use of electricity are the most reported drawbacks for Fenton-type processes [56,57,58,59]. The use of oxalate as intensifier becomes attractive, because it eliminates the consumption of sulfuric acid (H2SO4) and sodium hydroxide (NaOH) to adjust the pH and reduces the treatment time considerably by increasing the rate constant for the regeneration of the catalyst [56,57].
The carbon footprints determined for PQ and DQ were of 6.3 and 7.4 kg, respectively (CO2-Eqv/m3 wastewater, Figure 4). The carbon footprint of the advanced oxidation processes in CPC-type reactors usually varies between 2 and 15 kg (CO2-Eqv/m3 wastewater) [38,58,59,60,61]. The lowest values have been reported frequently for homogeneous phase processes that are aimed at biocompatibilization or at removing one contaminant present in synthetic wastewaters [58]. On the other hand, the highest values are frequently observed in heterogeneous phase processes during the treatment of more complex effluents (e.g., landfill leachates, textile effluents, agroindustrial effluents), or in processes that are aimed at mineralizing a contaminant.
The H2O2 and iron reagents represented 20.9% (DQ = 1.54 kg CO2-Eqv/m3 wastewater) and 7.3% (PQ = 0.46 kg CO2-Eqv/m3 wastewater) of the total carbon footprint; the factors that contributed the most to their reduction were the lack of chemical auxiliaries to adjust the pH (NaOH and H2SO4). H2O2 gains environmental interest, because it represents 96%–99% (PQ = 0.44 and DQ = 1.52 kg CO2-Eqv/m3) of the carbon footprint corresponding to the reagents; the aforementioned is consistent with observations of other studies for the treatment of recalcitrant substances in CPC-type solar reactors and in treatment systems that are open to the atmosphere [30,58,59]. It must be emphasized that H2O2 synthesis requires large amounts of organic substances of complex nature and a large number of transformation stages that are energy-intensive (1200 kWh/kg of H2O2) and employs fuels, like petroleum, charcoal, and natural gas [60]. The transport of materials for the process (reagents and construction materials) by ship or roads contributes with approximately 1% of the carbon footprint of the process (Figure 4). Different studies indicate that activities, like transportation, account for 2–10% of the carbon footprint [58,59,61]. From the environmental point of view, transport was not determinant, because of the closeness of the production centers and the amounts of reagents and construction materials required for the treatment process.
Construction materials contribute with 1.83 kg CO2-Eqv/m3; in this item, aluminum, cement, and brick production represent 74% of the carbon footprint. In aluminum production, alumina smelting is one of the most significant contributors to environmental impacts due to the enormous amount of electricity required [62]. Furthermore, the production of 1 ton of Portland cement consumes 1.5 ton of raw materials, fossil fuels, like charcoal, petroleum, diesel, natural gas (2.9–6.8 GJ), and electricity (65–141 kWh) [63,64]. The fabrication of bricks requires large amounts of energy, which are satisfied by fuels of high environmental burden, like charcoal and natural gas. In this type of industry, consumption of energy and gas emissions (CO, CO2, SO2, NH3, NO, Cl2, F2, HCN) depend on the type of technology (type of furnace), time used for the manufacture (batch vs. continuous), and type of fuel [65]. In the case of the solar reactor, aluminum and PVC are the materials of environmental interest, because they represent approximately 1.0 kg CO2-Eqv/m3. In general, aluminum and polymer materials industries use energy intensively during their synthesis (refining) and the transformation process of the material [62]. PVC presents additional aspects to be considered, like the emission of environmentally relevant substances, such as chlorine, polychlorinated biphenyls, phthalates, and dioxins along their useful life and during their disposal [66].
In advanced oxidation processes, energy (generation and voltage transformation) is considered to be the activity or the element of the treatment process with the highest environmental impact [37,40,48,66]. In this study, electricity contributes with 3.9 kg CO2-Eqv/m3; being voltage transformation (from high to medium) responsible for 53% (2.1 kg CO2-Eqv/m3) of the equivalent carbon dioxide emissions. The remainder 47% (1.84 kg CO2-Eqv/m3) corresponds to electricity generation from natural gas (0.92 kg CO2-Eqv/m3), coal (0.51 kg CO2-Eqv/m3), petroleum (0.38 kg CO2-Eqv/m3), hydropower (0.025 kg CO2-Eqv/m3), and geothermal (0.007 kg CO2-Eqv/m3). The carbon footprint that is associated with voltage transformation is due to the voltage losses occurring during the process (they can represent up to 70% of the CO2 emissions) and to the emission of sulfur hexafluoride (SF6, GWP = 22,000). The use of large amounts of steel (structural and electrical), as well as copper, aluminum, isolating materials (ceramics and oils), and the generation of ozone (O3) and nitrogenated compounds (NOX), affected the environmental performance of the voltage transformation process [67].
It becomes evident that one of the environmental drawbacks of the studied process is related to the raw materials used in Mexico in order to generate electricity. This drawback can be reduced or eliminated by using renewable energies (e.g., wind-power, geothermal) or by diminishing the participation of natural coal and oil in the generation of electricity. The use of natural gas to power electricity generation plants led to a marginal reduction in emissions (DQ = 3.7% and PQ = 4.3%), whereas the use of wind power made carbon dioxide emissions fall 24.4% (DQ = 5.57 kg CO2-Eqv/m3) and 28.3% (PQ = 4.51 kg CO2-Eqv/m3). Although, in Mexico, energy comes from fossil fuels, the country has an average solar insolation of 5–6 kWh/m2/day; this shows an enormous potential to produce renewable energy. The use of photovoltaic systems to supply the energy demand decreases the emissions in 49.4% (DQ = 3.72 kg CO2-Eqv/m3) and 57.9% (PQ = 2.65 kg CO2-Eqv/m3). In this regard, Ioannou-Ttofa [48] stated that it is feasible to reduce up to 83% the carbon footprint of an advanced oxidation process by reducing the participation of highly contaminated sources, like coal and petroleum. Likewise, Foteinis [30] pointed out that it is possible to obtain carbon footprints close to zero when using photovoltaic panels to satisfy the energetic needs of the process. That study also mentions that the use of solar panels is a very attractive alternative, because of its low carbon footprint (i.e., < 2% of the total footprint of the process).

3.5. Costs Analysis

The cost analysis presented above considered, as reference, the treatment of 10 m3 of wastewater contaminated with 100 mg L−1 of DQ or PQ herbicides. The procedure for the calculation of a photo-Fenton-type treatment in a CPC-type solar collector has been reported in detail in the literature [39]. The costs analysis (reagents, personnel, construction, and electricity) considered the average information reported for Mexico in 2018; therefore, there might be noticeable differences in the average cost of treatment due to the costs of electricity and salaries assigned in each country. The total installation costs are depicted in The costs of DQ (USD$8.05) and PQ (USD$7.72) removal treatments that are within the ranges (USD$2–USD$15) reported in the literature for the treatment of recalcitrant substances in CPC-type reactors [68,69,70]. The reported cost is quite variable because of the type of treated substance, the presence of free radical inhibitors, the objective established for the treatment process, the variability in solar radiation, and the treatment capacity [68,70]. The cost of the solar collector array is critical for the annual average cost, as it represents at least 60% (USD$67.200) of the total installation costs, whereas, on the average, the cost of reagents and electricity reaches 30% (USD$2014.00) and 36% (USD$2400.00), respectively, of the total operational costs (USD$6761.00). The CPC treatment systems are costlier, but they lead to effluents with a higher degree of mineralization and reduce up to 30 to 40% the treatment time [68,71,72,73,74,75]. The use of coupled hybrid systems, the optimized selection of reagent doses, and the application of dosing strategies have proven effective in reducing the operational costs (from 30 to 50%), treatment time, and the area required for solar uptake [70]. The aforementioned issues evidence that it is possible to reduce the costs of the annual treatment to a range between USD$2.00 and USD$5.00 per m3.

4. Conclusions

For the degradation of diquat (DQ) and paraquat (PQ), the concentration of Fe3+ is significant in influencing the final degradation. Based on the response surface analysis, optimum conditions of 26.14 mg L−1 Fe3+ and 138.6 mg L−1 H2O2 for PQ degradation yielded 87% of TOC removal; for DQ, with the most favorable conditions of 25.42 mg L−1 Fe3+ and 478 mg L−1 H2O2, 80% of TOC removal was obtained. Phytotoxicity tests confirmed that the solutions that were obtained after these treatments contained fewer toxic byproducts, which allowed further growth of cucumber seeds.
The carbon footprint of the solar photo-assisted degradation of bipyridinium compounds (PQ = 6.29 and DQ = 7.37 kg CO2-Eqv/m3 wastewater) is mainly affected by the following variables: Electricity consumption, H2O2 consumption, and construction materials. The transportation of reagents and construction materials played a minor role from an environmental point of view because of the closeness of the production centers. The carbon footprint depends on the energy share of the local electricity matrix; using more renewable electrical energy sources, such as wind-power and solar, can reduce the greenhouse gases emissions of the process an average of 26.4% (DQ = 5.57 and PQ = 4.51 kg CO2-Eqv/m3) and 78.4% (DQ = 3.72 and PQ = 2.65 kg CO2-Eqv/m3), respectively. The estimated costs of DQ (USD$8.05) and PQ (USD$7.72) removal treatments are within the ranges (USD$2–USD$15) reported in the literature for the treatment of recalcitrant substances in CPC-type reactors. Photo-assisted processes at circumneutral pH represent an important alternative for the treatment of complex substances, because they overcome some drawbacks, such as acidification and neutralization steps, reagent cost, and the environmental footprint of chemicals.

Supplementary Materials

The following are available online at https://www.mdpi.com/2227-9717/8/9/1117/s1, Figure S1: Paraquat (a) and diquat (b) absorbances at different concentrations. Insert: Calibration curve, Figure S2: Schematic representation of a two-slot compound parabolic collector (CPC). θ is the geographic latitude, Table S1: Coded levels and actual values for central composite design and response surface methodology analysis of photo-Fenton treatments of 100 mg L−1 PQ and DQ solutions, Table S2: General inventory of the Fenton treatment process during its useful lifetime (Diquat), Table S3: Cost analysis for the Fenton treatment process.

Author Contributions

A.T.-S. performed most of the experimental work as well as the multivariate analysis of the photo-Fenton process and the kinetic removal model. R.V.-M. was the project leader and supervised the entire development, including equipment construction. D.P.-G. performed most of the environmental assessment and cost analysis. J.G.I. supervised part of the experimental work, contributed to the literature search, analysis and interpretation of results, and to homogenizing results and their presentation. All authors have read and agreed to the published version of the manuscript.

Funding

This research received no external funding.

Acknowledgments

We acknowledge financial assistance from the Universidad Iberoamericana and CONACyT.

Conflicts of Interest

The authors declare no conflict of interest.

References

  1. Gao, L.; Liu, J.; Yuan, H.; Deng, X. Solid phase microextraction combined with GC-MS for determination of diquat and paraquat residues in water. Chromatographia 2015, 125–130. [Google Scholar] [CrossRef]
  2. Nakajima, M.; Nagao, M.; Iwasa, M.; Monma-Ohtaki, J.; Maeno, Y.; Koyama, H.; Seko-Nakamura, Y.; Isobe, I.; Takatori, T. Purification and characterization of diquat (1,1%-ethylene-2,2%-dipyridylium)-metabolizing enzyme from paraquat-resistant rat liver cytosol. Toxicology 2000, 154, 55–66. [Google Scholar] [CrossRef]
  3. Jaiswal, D.K.; Verma, J.P.; Yadav, J. Microbe induced degradation of pesticides in agricultural soils. Microbe Induc. Degrad. Pestic. 2016, 167–189. [Google Scholar] [CrossRef]
  4. Jafarinejad, S. Recent advances in determination of herbicide paraquat in environmental waters and its removal from aqueous solutions: A review. Int. Res. J. Appl. Basic Sci. 2015, 9, 1758–1774. [Google Scholar]
  5. Zahedi, F.; Behpour, M.; Ghoreishi, S.M.; Khalilian, H. Photocatalytic degradation of paraquat herbicide in the presence TiO2 nanostructure thin films under visible and sun light irradiation using continuous flow photoreactor. Sol. Energy 2015, 120, 287–295. [Google Scholar] [CrossRef]
  6. Camacho-Morales, R.L.; Guillén-Navarro, K.; Sánchez, J.E. Degradation of the herbicide paraquat by macromycetes isolated from southeastern Mexico. 3 Biotech. 2017, 7, 324. [Google Scholar] [CrossRef]
  7. Amondham, W.; Parkpian, P.; Polprasert, C.; Delaune, R.D.; Jugsujinda, A. Paraquat adsorption, degradation, and remobilization in tropical soils of Thailand. J. Environ. Sci. Health Part B Pestic. Food Contam. Agric. Wastes 2006, 41, 485–507. [Google Scholar] [CrossRef]
  8. Huang, Y.; Zhan, H.; Bhatt, P.; Chen, S. Paraquat degradation from contaminated environments: Current achievements and perspectives. Front. Microbiol. 2019, 10, 1754. [Google Scholar] [CrossRef] [PubMed] [Green Version]
  9. Wang, Y.; Yen, J.; Hsieh, Y.; Chen, Y. Dissipation of 2, 4-d glyphosate and paraquat in river water. Water Air Soil Poll. 1994, 72, 1–7. [Google Scholar] [CrossRef]
  10. Cartaxo, M.; Borges, C.; Pereira, M.; Mendonça, M. Electrochemical oxidation of paraquat in neutral medium. Electrochim. Acta 2015, 176, 1010–1018. [Google Scholar] [CrossRef]
  11. Santos, M.; Schaule, G.; Alves, A.; Madeira, L. Adsorption of paraquat herbicide on deposits from drinking water networks. Chem. Eng. J. 2013, 229, 324–333. [Google Scholar] [CrossRef]
  12. Trovó, A.; Gomes-Junior, O.; Machado, A.; Borges-Neto, W.; Silva, J. Degradation of the herbicide paraquat by photo-Fenton process: Optimization by experimental design and toxicity assessment. J. Braz. Chem. Soc. 2013, 24, 76–84. [Google Scholar] [CrossRef]
  13. Klamerth, N.; Malato, S.; Maldonado, M.; Agüera, A.; Fernández-Alba, A. Application of photo-Fenton as a tertiary treatment of emerging contaminants in municipal wastewater. Environ. Sci. Technol. 2010, 44, 1792–1798. [Google Scholar] [CrossRef] [PubMed]
  14. Santos, M.; Alves, A.; Madeira, L. Paraquat removal from water by oxidation with Fenton’s reagent. Chem. Eng. J. 2011, 175, 279–290. [Google Scholar] [CrossRef]
  15. Nakamura, T.; Kawasaki, N.; Ogawa, H.; Tanada, S.; Kogirima, M.; Imaki, M. Adsorption removal of paraquat and diquat onto activated carbon at different adsorption temperature. Toxicol. Environ. Chem. 1999, 70, 275–280. [Google Scholar] [CrossRef]
  16. Tsai, W.; Chen, H. Adsorption kinetics of herbicide paraquat in aqueous solution onto a low-cost adsorbent, swine-manure-derived biochar. Int. J. Environ. Sci. Technol. 2013, 10, 1349–1356. [Google Scholar] [CrossRef] [Green Version]
  17. Rytwo, G.; Nir, S.; Margulies, L. Adsorption and interactions of diquat and paraquat with montmorillonite. Soil Sci. Soc. Am. J. 1996, 60, 601–610. [Google Scholar] [CrossRef]
  18. Tsai, W.; Hsien, K.; Chang, Y.L.C. Removal of herbicide paraquat from an aqueous solution by adsorption onto spent and treated diatomaceous earth. Bioresour. Technol. 2005, 96, 657–663. [Google Scholar] [CrossRef]
  19. Tsai, W.; Lai, C.; Hsien, K. Adsorption kinetics of herbicide paraquat from aqueous solution onto activated bleaching earth. Chemosphere 2004, 55, 829–837. [Google Scholar] [CrossRef]
  20. Hsu, S.; Pan, T. Adsorption of paraquat using methacrylic acid-modified rice husk. Bioresour. Technol. 2007, 98, 3617–3621. [Google Scholar] [CrossRef]
  21. Ibrahim, K.; Jbara, H. Removal of paraquat from synthetic wastewater using phillipsite–faujasite tuff from Jordan. J. Hazard. Mater. 2009, 163, 82–86. [Google Scholar] [CrossRef] [PubMed]
  22. Dhaouadi, A.; Adhoum, N. Degradation of paraquat herbicide by electrochemical advanced oxidation methods. J. Electroanal. Ehem. 2009, 637, 33–42. [Google Scholar] [CrossRef]
  23. Pouran, S.R.; Abdul Aziz, A.R.; Wan Daud, W.A. Review on the advances in photo-Fenton oxidation system for recalcitrant wastewaters. J. Ind. Eng. Chem. 2015, 21, 53–69. [Google Scholar] [CrossRef]
  24. Zapata, A.; Oller, I.; Sirtori, C.; Rodríguez, A.; Sánchez-Pérez, J.A.; López, A.; Mezcua, M.; Malato, S. Decontamination of industrial wastewater containing pesticides by combining large-scale homogeneous solar photocatalysis and biological treatment. Chem. Eng. J. 2010, 160, 447–456. [Google Scholar] [CrossRef]
  25. Pignatello, J.J.; Oliveros, E.; MacKay, A. Advanced oxidation processes for organic contaminant destruction based on the Fenton reaction and related chemistry. Crit. Rev. Env. Sci. Technol. 2006, 36, 1–84. [Google Scholar] [CrossRef]
  26. Dhaouadi, A.; Adhoum, N. Heterogeneous catalytic wet peroxide oxidation of paraquat in the presence of modified activated carbon. Appl. Catal. B Environ. 2010, 97, 227–235. [Google Scholar] [CrossRef]
  27. Florencio, M.H.; Pires, E.; Castro, A.L.; Nunes, M.R.; Borges, C.; Costa, F.M. Photodegradation of Diquat and Paraquat in aqueous solutions by titanium dioxide: Evolution of degradation reactions and characterization of intermediates. Chemosphere 2004, 55, 345–355. [Google Scholar] [CrossRef]
  28. Sorolla, M.G.; Dalida, M.L.; Khemthong, P.; Grisdanurak, N. Photocatalytic degradation of paraquat using nano-sized Cu-TiO2/SBA-15 under UV and visible light. Int. J. Environ. Sci. 2012, 24, 1125–1132. [Google Scholar] [CrossRef]
  29. Brillas, E.; Sirés, I.; Oturan, M.A. Electro-Fenton process and related electrochemical technologies based on Fenton’s reaction chemistry. Chem. Rev. 2009, 109, 6570–6631. [Google Scholar] [CrossRef]
  30. Foteinis, S.; Durán, A.; Chatzisymeon, E. Environmental sustainability of the solar photo-Fenton process for wastewater treatment and pharmaceuticals mineralization at semi-industrial scale. Sci. Total Environ. 2018, 612, 605–612. [Google Scholar] [CrossRef] [Green Version]
  31. Vasquez-Medrano, R.; Prato-Garcia, D.; Vedrenne, M. Chapter 4. Ferrioxalate-mediated processes, advanced oxidation processes for waste. In Water Treatment Emerging Green Chemical Technology; Academic Press: New York, NY, USA, 2018; pp. 89–113. [Google Scholar] [CrossRef]
  32. Jeong, J.; Yoon, J. pH effect on OH radical production in photo/ferrioxalate system. Water. Res. 2005, 39, 2893–2900. [Google Scholar] [CrossRef] [PubMed]
  33. Selvam, K.; Muruganandham, M.; Swaminathan, M. Enhanced heterogeneous ferrioxalate photo-Fenton degradation of reactive orange 4 by solar light. Sol. Energy. Mater. Sol. Cells 2005, 89, 61–74. [Google Scholar] [CrossRef]
  34. Nogueira, R.F.P.; Oliveira, M.C.; Paterlini, W.C. Simple and fast spectrophotometric determination of H2O2 in photo-Fenton reactions using metavanadate. Talanta 2005, 66, 86–91. [Google Scholar] [CrossRef] [PubMed]
  35. Nogueira, R.F.P.; Guimaräes, J.R. Photodegradation of dichloroacetic acid and 2, 4-dichlorophenol by ferrioxalate/H2O2 system. Water. Res. 2000, 34, 895–901. [Google Scholar] [CrossRef]
  36. EPA, Ecological Effects Test Guidelines. OCSPP 850.4100: Seedling Emergence and Seedling Growth; Environmental Protection Agency: Washington, DC, USA, 2012. [Google Scholar]
  37. Ioannou, L.A.; Fatta-Kassinos, D. Solar photo-Fenton oxidation against the bioresistant fractions of winery wastewater. J. Environ. Chem. Eng. 2013, 1, 703–712. [Google Scholar] [CrossRef]
  38. Chatzisymeon, E.; Foteinis, S.; Mantzavinos, D.; Tsoutsos, T. Life cycle assessment of advanced oxidation processes for olive mill wastewater treatment. J. Clean. Prod. 2013, 54, 229–234. [Google Scholar] [CrossRef] [Green Version]
  39. Hauschild, M.Z.; Rosenbaum, R.K.; Olsen, S.I. Life Cycle Assessment. Theory and Practice; Springer: Berlin/Heidelberg, Germany, 2018. [Google Scholar]
  40. Blanco, J.; Malato, S. Solar Detoxification; UNESCO: Paris, France, 2003. [Google Scholar]
  41. Liu, W.; Andrews, S.A.; Stefan, M.I.; Bolton, J.R. Optimal methods for quenching H2O2 residuals prior to UFC testing. Water Res. 2003, 37, 3697–3703. [Google Scholar] [CrossRef]
  42. Gerber, M.D.; Thomaz, L.J.; Correa, L.; Pereira-Neto, J.E.; Correa, É.K. Phytotoxicity of effluents from swine slaughterhouses using lettuce and cucumber seeds as bioindicators. Sci. Total Environ. 2017, 592, 86–90. [Google Scholar] [CrossRef]
  43. Mendes, P.M.; Becker, R.; Corrêa, L.B.; Bianchi, I.; Dai-Prá, M.A.; Lucia, T.; Corrêa, E.K. Phytotoxicity as an indicator of stability of broiler production residues. J. Environ. Manag. 2016, 167, 156–159. [Google Scholar] [CrossRef]
  44. Zucconi, F.; Pera, A.; Forte, M.; Bertoldi, M. Evaluating toxicity in immature compost. Biocycle 1981, 22, 54–57. [Google Scholar]
  45. Klöpffer, W.; Grahl, B. Life Cycle Assessment (LCA): A Guide to Best Practice; Wiley-VCH: Weinheim, Germany, 2014. [Google Scholar]
  46. Goedkoop, M.J.; Heijungs, R.; Huijbregts, M.; De Schryver, A.; Struijs, J.; Van Zelm, R. ReCiPe 2008, a Life Cycle Impact Assessment Method which Comprises Harmonised Category Indicators at the Midpoint and the Endpoint Level, 1st ed.; Report I: Characterization; Ministerie van Volkshuisvesting, Ruimtelijke Ordening en Milieubeheer (VROM): The Hague, The Netherlands, 2009.
  47. Wernet, G.; Bauer, C.; Steubing, B.; Reinhard, J.; Moreno-Ruiz, E.; Weidema, B. The ecoinvent database version 3 (part I): Overview and methodology. Int. J. Life Cycle. Assess. 2016, 21, 1218–1230. [Google Scholar] [CrossRef]
  48. Ioannou-Ttofa, L.; Foteinis, S.; Chatzisymeon, E.; Michael-Kordatou, I.; Fatta-Kassinos, D. Life cycle assessment of solar-driven oxidation as a polishing step of secondary-treated urban effluents. J. Chem. Technol. Biotechnol. 2017, 92, 1315–1327. [Google Scholar] [CrossRef]
  49. Paterlini, W.C.; Nogueira, R.F.P. Multivariate analysis of photo-Fenton degradation of the herbicides tebuthiuron, diuron and 2, 4-D. Chemosphere 2005, 58, 1107–1116. [Google Scholar] [CrossRef] [PubMed]
  50. Brink, A.; Sheridan, C.M.; Harding, K.G. The Fenton oxidation of biologically treated paper and pulp mill effluents: A performance and kinetic study. Process. Saf. Environ. 2017, 107, 206–215. [Google Scholar] [CrossRef]
  51. Behnajady, M.A.; Modirshahla, N.; Ghanbary, F. A kinetic model for the decolorization of C.I. Acid Yellow 23 by Fenton process. J. Hazard. Mater. 2007, 148, 98–102. [Google Scholar] [CrossRef]
  52. Ravindran, B.; Sheena-Kumari, S.K.; Stenstrom, T.A.; Bux, F. Evaluation of phytotoxicity effect on selected crops using treated and untreated wastewater from different configurative domestic wastewater plants. Environ. Technol. 2016, 37, 1782–1789. [Google Scholar] [CrossRef] [PubMed]
  53. Welter, J.B.; Soares, E.V.; Rotta, E.H.; Seibert, D. Bioassays and Zahn-Wellens test assessment on landfill leachate treated by photo-Fenton process. J. Environ. Chem. Eng. 2018, 6, 1390–1395. [Google Scholar] [CrossRef]
  54. Hanafi, F.; Belaoufi, A.; Mountadar, M.; Assobhei, O. Augmentation of biodegradability of olive mill wastewater by electrochemical pre-treatment: Effect on phytotoxicity and operating cost. J. Hazard. Mater. 2011, 190, 94–99. [Google Scholar] [CrossRef]
  55. Expósito, A.J.; Monteagudo, J.M.; Durán, A.; Martín, I.S.; González, L. Study of the intensification of solar photo-Fenton degradation of carbamazepine with ferrioxalate complexes and ultrasound. J. Hazard. Mater. 2018, 342, 597–605. [Google Scholar] [CrossRef]
  56. Garcia-Herrero, I.; Margallo, M.; Onandía, R.; Aldaco, R.; Irabien, A. Life cycle assessment model for the chlor-alkali process: A comprehensive review of resources and available technologies. Sustain. Prod. Consum. 2017, 12, 44–58. [Google Scholar] [CrossRef] [Green Version]
  57. Hong, J.; Chen, W.; Wang, Y.; Xu, C.; Xu, X. Life cycle assessment of caustic soda production: A case study in China. J. Clean. Prod. 2014, 66, 113–120. [Google Scholar] [CrossRef]
  58. Muñoz, I.; Rieradevall, J.; Torrades, F.; Peral, J.; Domènech, X. Environmental assessment of different solar driven advanced oxidation processes. Sol. Energy 2005, 79, 369–375. [Google Scholar] [CrossRef]
  59. Serra, A.; Domenech, X.; Brillas, E.; Peral, J. Life cycle assessment of solar photo-Fenton and solar photoelectro-Fenton processes used for the degradation of aqueous a-methylphenylglycine. J. Environ. Monitor. 2011, 13, 167–174. [Google Scholar] [CrossRef] [PubMed]
  60. Samanta, C. Direct synthesis of hydrogen peroxide from hydrogen and oxygen: An overview of recent developments in the process. Appl. Catal. A Gen. 2008, 350, 133–149. [Google Scholar] [CrossRef]
  61. García-Montaño, J.; Ruiz, N.; Muñoz, I.; Domènech, X.; García-Hortal, J.A.; Torrades, F.; Peral, J. Environmental assessment of different photo-Fenton approaches for commercial reactive dye removal. J. Hazard. Mater. 2006, 138, 218–225. [Google Scholar] [CrossRef]
  62. Liu, G.; Müller, D.B. Addressing sustainability in the aluminum industry: A critical review of life cycle assessments. J. Clean. Prod. 2012, 35, 108–117. [Google Scholar] [CrossRef]
  63. Salas, D.A.; Ramirez, D.A.; Rodriguez, C.R.; Petroche, D.M.; Boero, A.J.; Duque, J. Environmental impacts, life cycle assessment and potential improvement measures for cement production: A literature review. J. Clean. Prod. 2016, 113, 114–122. [Google Scholar] [CrossRef]
  64. Stafford, F.N.; Raupp-Pereira, F.; Labrincha, J.A.; Hotza, D. Life cycle assessment of the production of cement: A Brazilian case study. J. Clean. Prod. 2016, 137, 1293–1299. [Google Scholar] [CrossRef]
  65. Ukwatta, A.; Mohajerani, A.; Setunge, S.; Eshtiaghi, N. A study of gas emissions during the firing process from bricks incorporating biosolids. Waste Manage. 2018, 74, 413–426. [Google Scholar] [CrossRef]
  66. GmbH, P. Final Report-Life Cycle Assessment (LCA) of PVC and of Principal Competing Materials; European Commission: Brussels, Belgium, 2004. [Google Scholar]
  67. Arvesen, A.; Hauan, I.B.; Bolsøy, B.M.; Hertwich, E.G. Life cycle assessment of transport of electricity via different voltage levels: A case study for Nord-Trøndelag County in Norway. Appl. Energy 2015, 157, 144–151. [Google Scholar] [CrossRef]
  68. Rodrigues, C.S.D.; Madeira, L.M.; Boaventura, R.A.R. Optimization and economic analysis of textile wastewater treatment by photo-Fenton process under artificial and simulated solar radiation. Ind. Eng. Chem. Res. 2013, 52, 13313–13324. [Google Scholar] [CrossRef]
  69. Trapido, M.; Tenno, T.; Goi, A.; Dulova, N.; Kattel, E.; Klauson, D.; Klein, K.; Tenno, T.; Viisimaa, M. Bio-recalcitrant pollutants removal from wastewater with combination of the Fenton treatment and biological oxidation. J. Water. Process Eng. 2017, 16, 277–282. [Google Scholar] [CrossRef]
  70. Wang, N.; Zheng, T.; Zhang, G.; Wang, P. A review on Fenton-like processes for organic wastewater treatment. J. Environ. Chem. Eng. 2016, 4, 762–787. [Google Scholar] [CrossRef] [Green Version]
  71. Silva, T.F.C.V.; Fonseca, A.; Saraiva, I.; Boaventura, R.A.R.; Vilar, V.J.P. Scale-up and cost analysis of a photo-Fenton system for sanitary landfill leachate treatment. Chem. Eng. J. 2016, 283, 76–88. [Google Scholar] [CrossRef]
  72. Gar, M.; Taw, A.; Ookawara, S. Degradation of four pharmaceuticals by solar photo-Fenton process: Kinetics and costs estimation. J. Environ. Chem. Eng. 2015, 3, 46–51. [Google Scholar] [CrossRef]
  73. Santos-Juanes, L.; Ballesteros, M.M.; Ortega, E.; Cabrera, A.; Román, I.M.; Casas, J.L.; Sánchez, J.A. Economic evaluation of the photo- Fenton process. Mineralization level and reaction time: The keys for increasing plant efficiency. J. Hazard. Mater. 2011, 186, 1924–1929. [Google Scholar] [CrossRef]
  74. Soares, P.; Souza, R.; Soler, J.; Silva, T.F.C.V.; Guelli, S.M.A.; Souza, U.; Boaventura, R.A.R.; Vilar, V.J.P. Remediation of a synthetic textile wastewater from polyester-cotton dyeing combining biological and photochemical oxidation processes. Sep. Purif. Technol. 2017, 172, 450–462. [Google Scholar] [CrossRef]
  75. Spasiano, D.; Marotta, R.; Malato, S.; Fernandez, P.; Di Somma, I. Solar photocatalysis: Materials, reactors, some commercial, and pre-industrialized applications. A comprehensive approach. Appl. Catal. B Environ. 2015, 170–171, 90–123. [Google Scholar] [CrossRef]
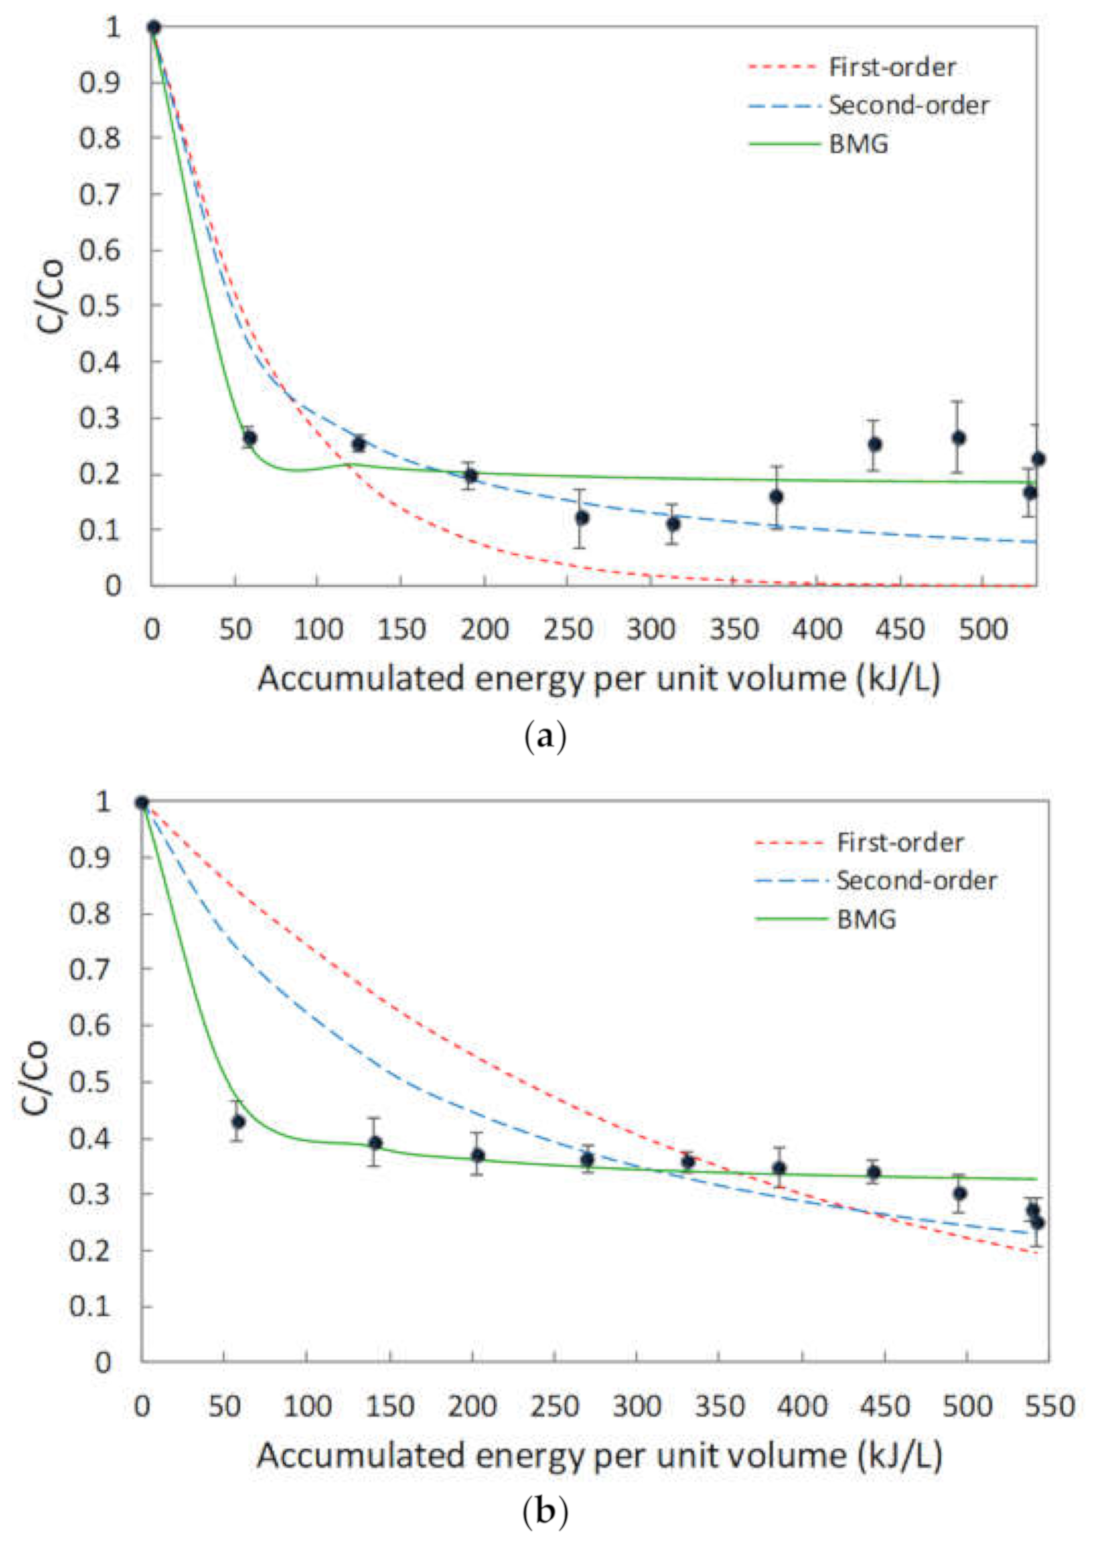
Figure 1. Chemical structure of: (a) diquat dibromide and (b) paraquat dichloride.
Processes 08 01117 g001
Figure 2. Response surface plots of the effect of H2O2 and Fe3+ concentrations on total organic carbon (TOC) removal efficiency. (a) Paraquat (PQ) and (b) diquat (DQ).
Processes 08 01117 g002
Figure 3. Comparison of models applied to the degradation kinetics of (a) DQ and (b) PQ.
Processes 08 01117 g003
Figure 4. Environmental performance of the photo-assisted process at circumneutral pH expressed as carbon footprint. (a) Diquat, (b) Paraquat.
Processes 08 01117 g004
Table 1. Kinetic parameters for the solar photo-assisted degradation of DQ and PQ.
ModelsEquationParameterr2
Diquat (DQ)
First-order C = 127.13 e 0.013 Q k = 0.013 L kJ−10.71
Second-order C = 127.13 1 + 0.175 × 10 3 127.13   Q k = 0.175e−3 L2 mg−1 kJ−10.90
BMG C = 127.13 1 Q 7.96 + 1.2 Q m = 7.96 kJ L−1, b = 1.210.98
Paraquat (PQ)
First-order C = 131.8 e 0.003 Q k = 0.003 L kJ−10.57
Second-order C = 131.8 1 + 0.47 × 10 4 131.8   Q k = 0.47e−4L2 mg−1 kJ−10.83
BMG C = 131.8 1 Q 26.18 + 1.44 Q m = 26.18 kJ L−1, b = 1.440.99
Q is the accumulated energy per unit of volume (kJ L−1).
Table 2. Phytotoxicity of DQ and PQ pesticide solutions towards cucumber seeds relative to a distilled water control solution.
TreatmentGermination index (%) (RSD)
Diquat (DQ)
Control (distilled water)100 (0)
Untreated DQ solution4.7 (0.68)
Treated DQ solution55.8 (3.39)
Paraquat (PQ)
Control (distilled water)100 (0)
Untreated PQ solution16.5 (2.79)
Treated PQ solution59.7 (0.87)
RSD: Relative standard deviation, in percentage.

