Effect of Bio-Oil Species on Rheological Behaviors and Gasification Characteristics of Coal Bio-Oil Slurry Fuels


Abstract
1. Introduction
2. Materials and Methods
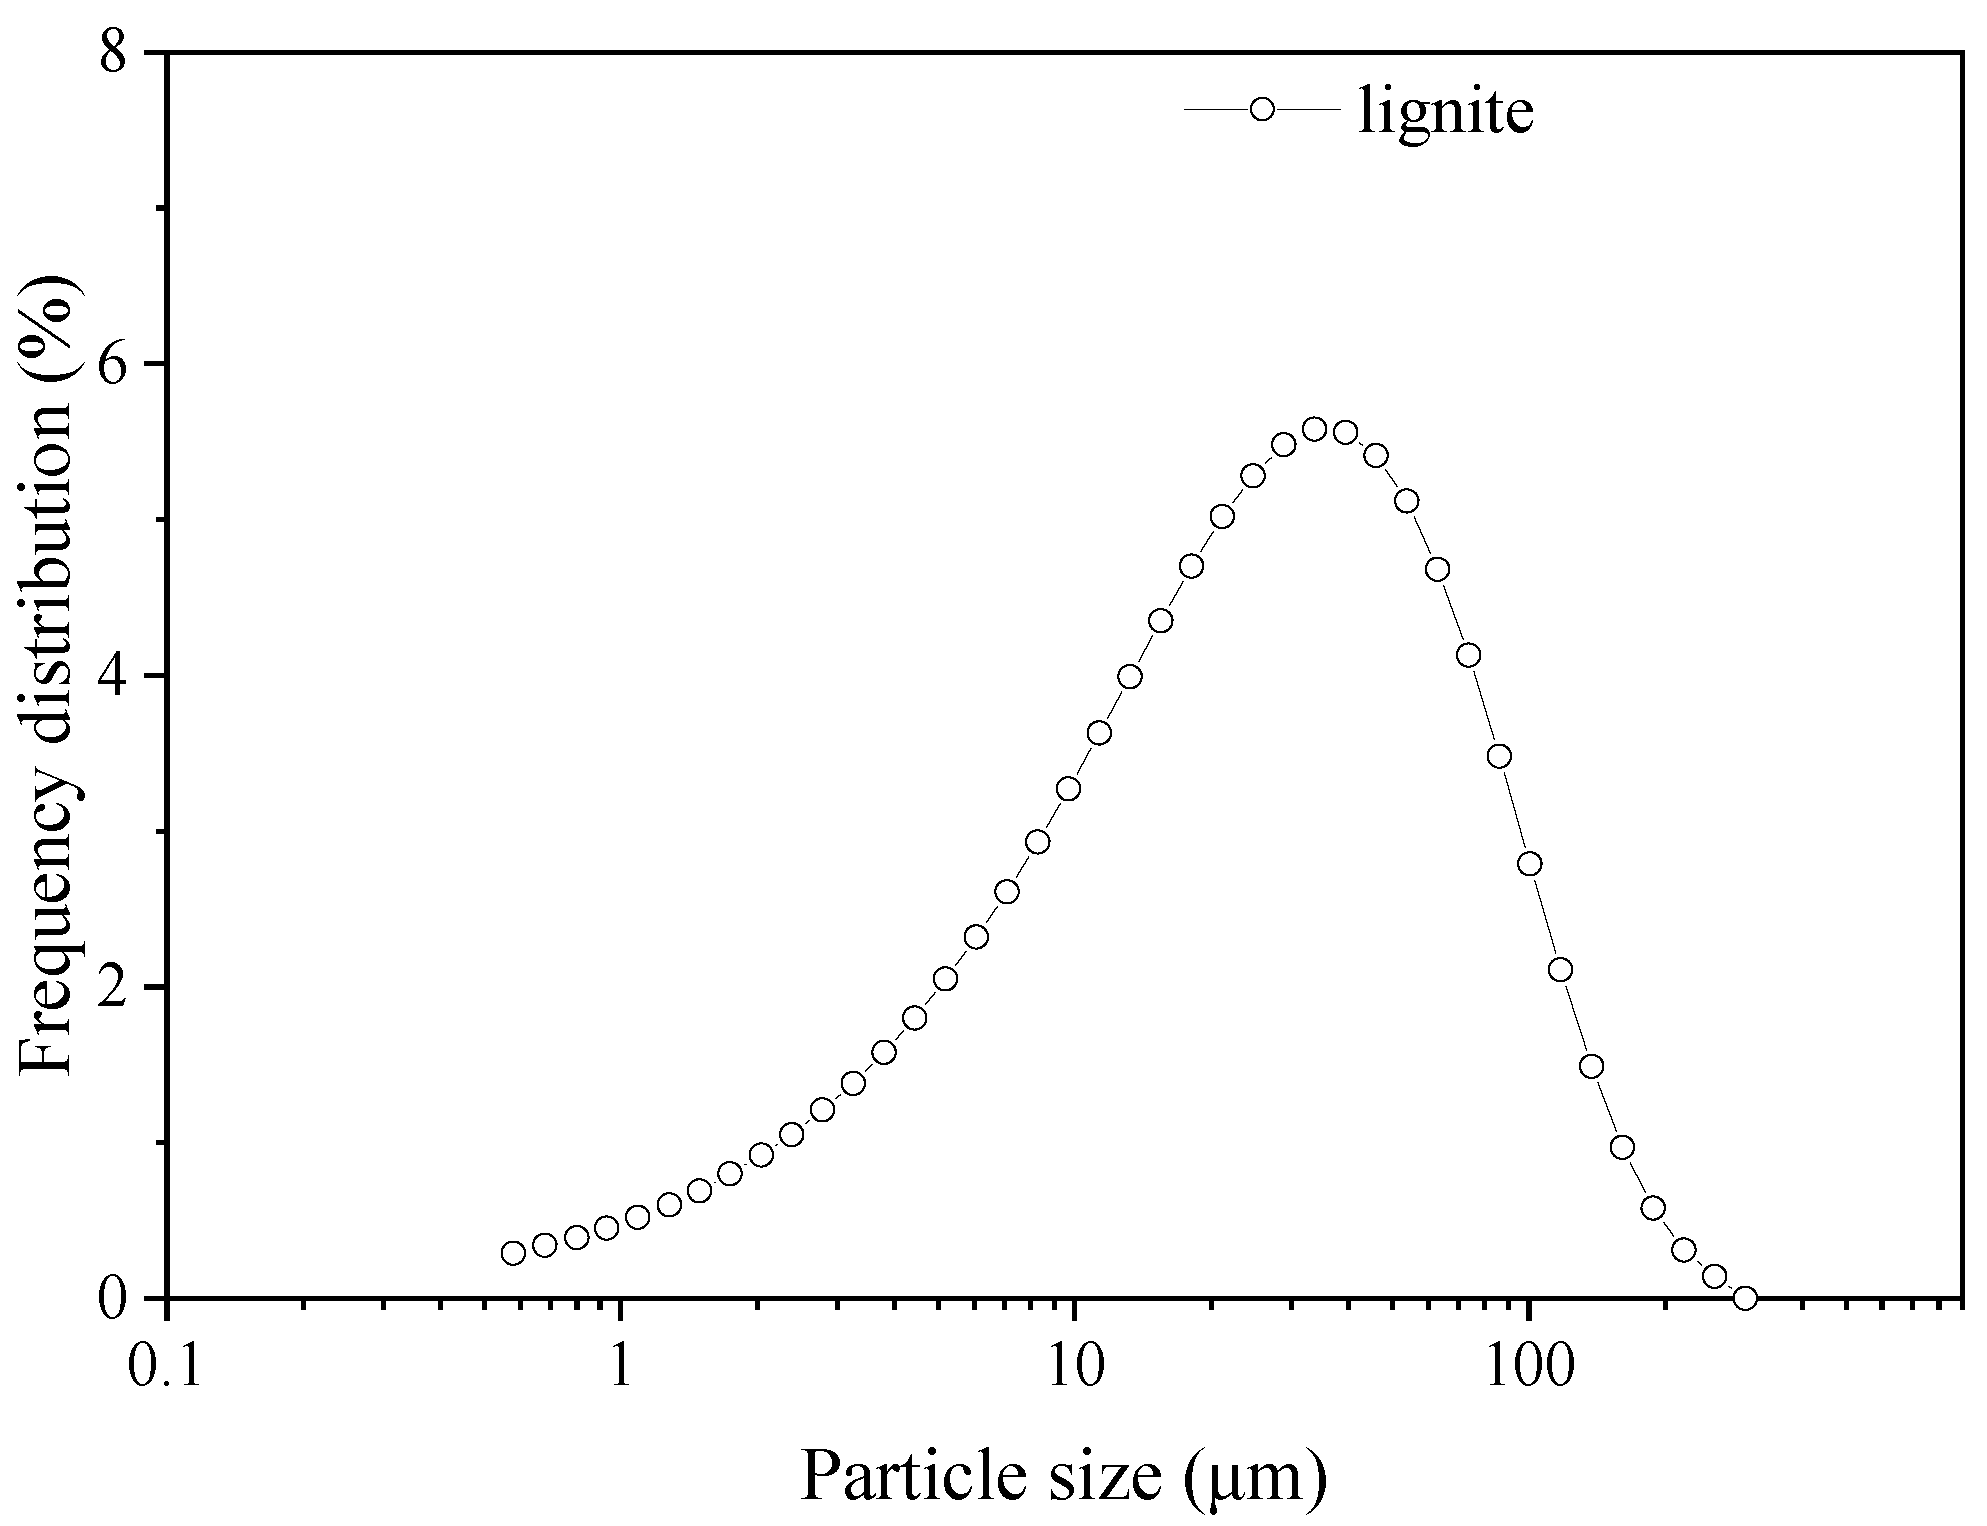
2.1. Coal and Bio-Oil Samples
2.2. Bioslurry Preparation
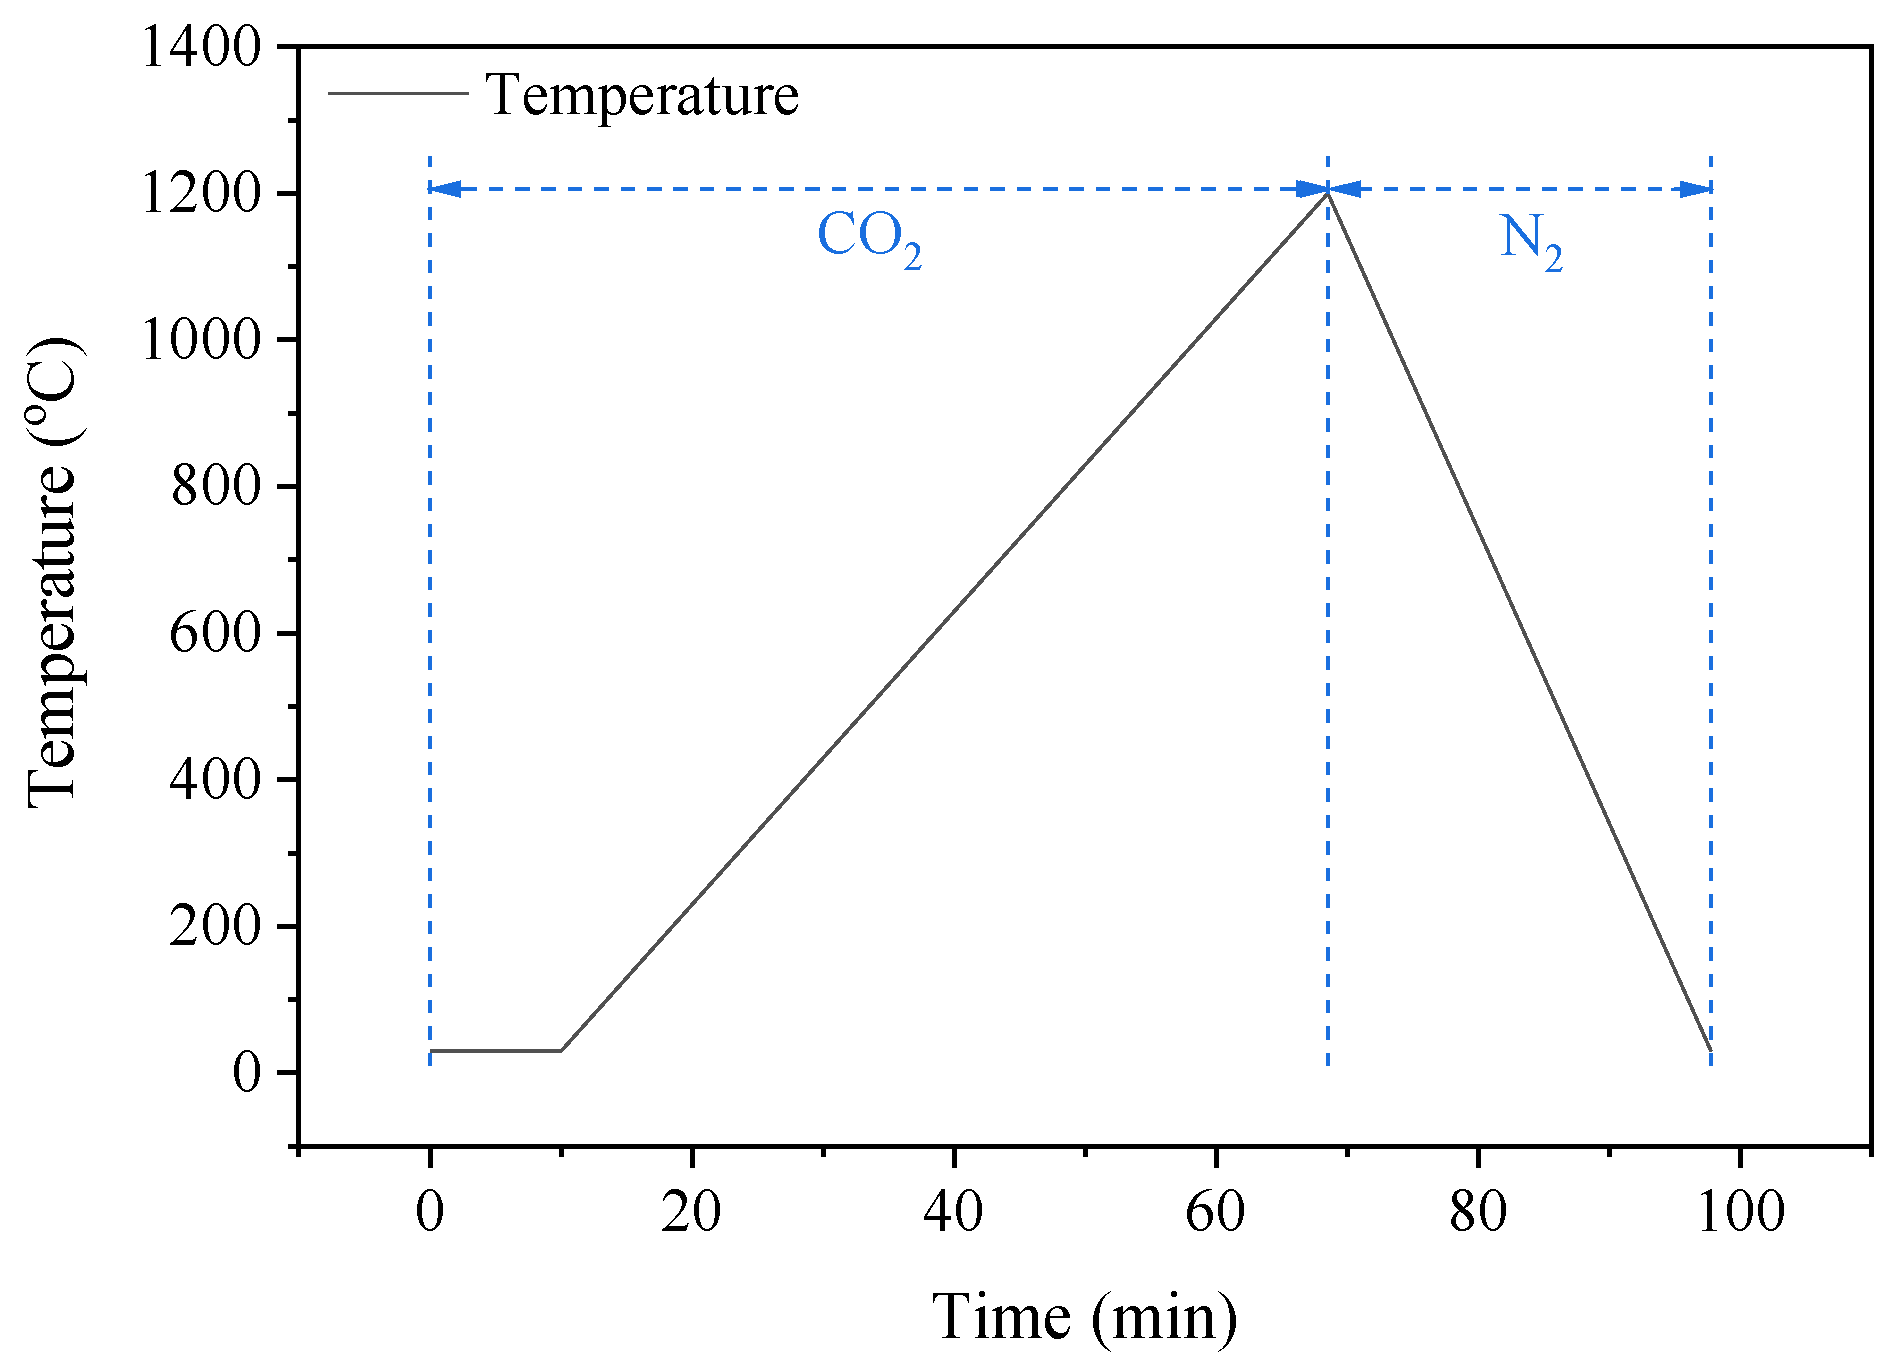
2.3. CO2 Gasification Experiments
3. Results and Discussion
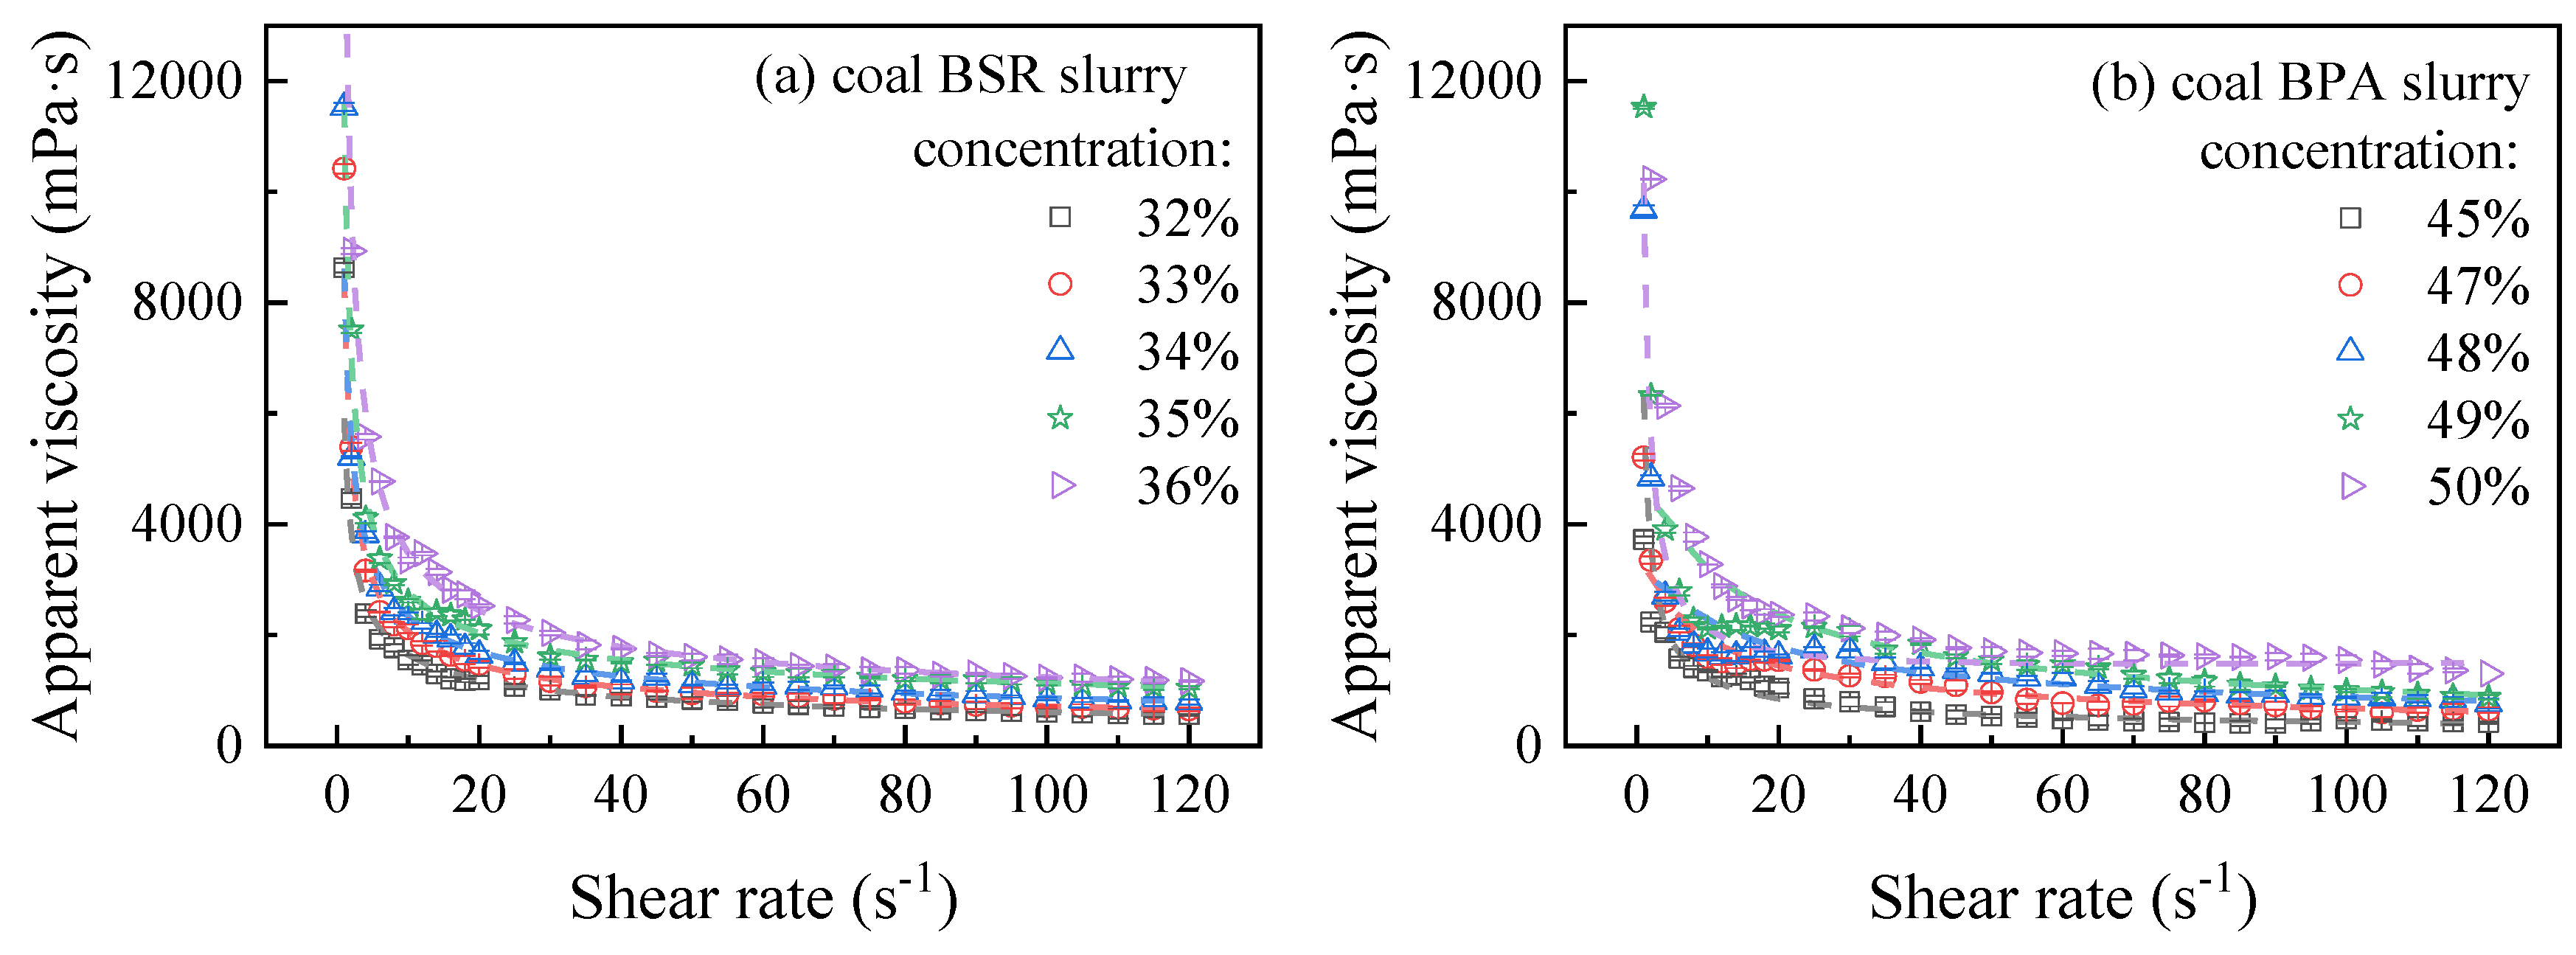
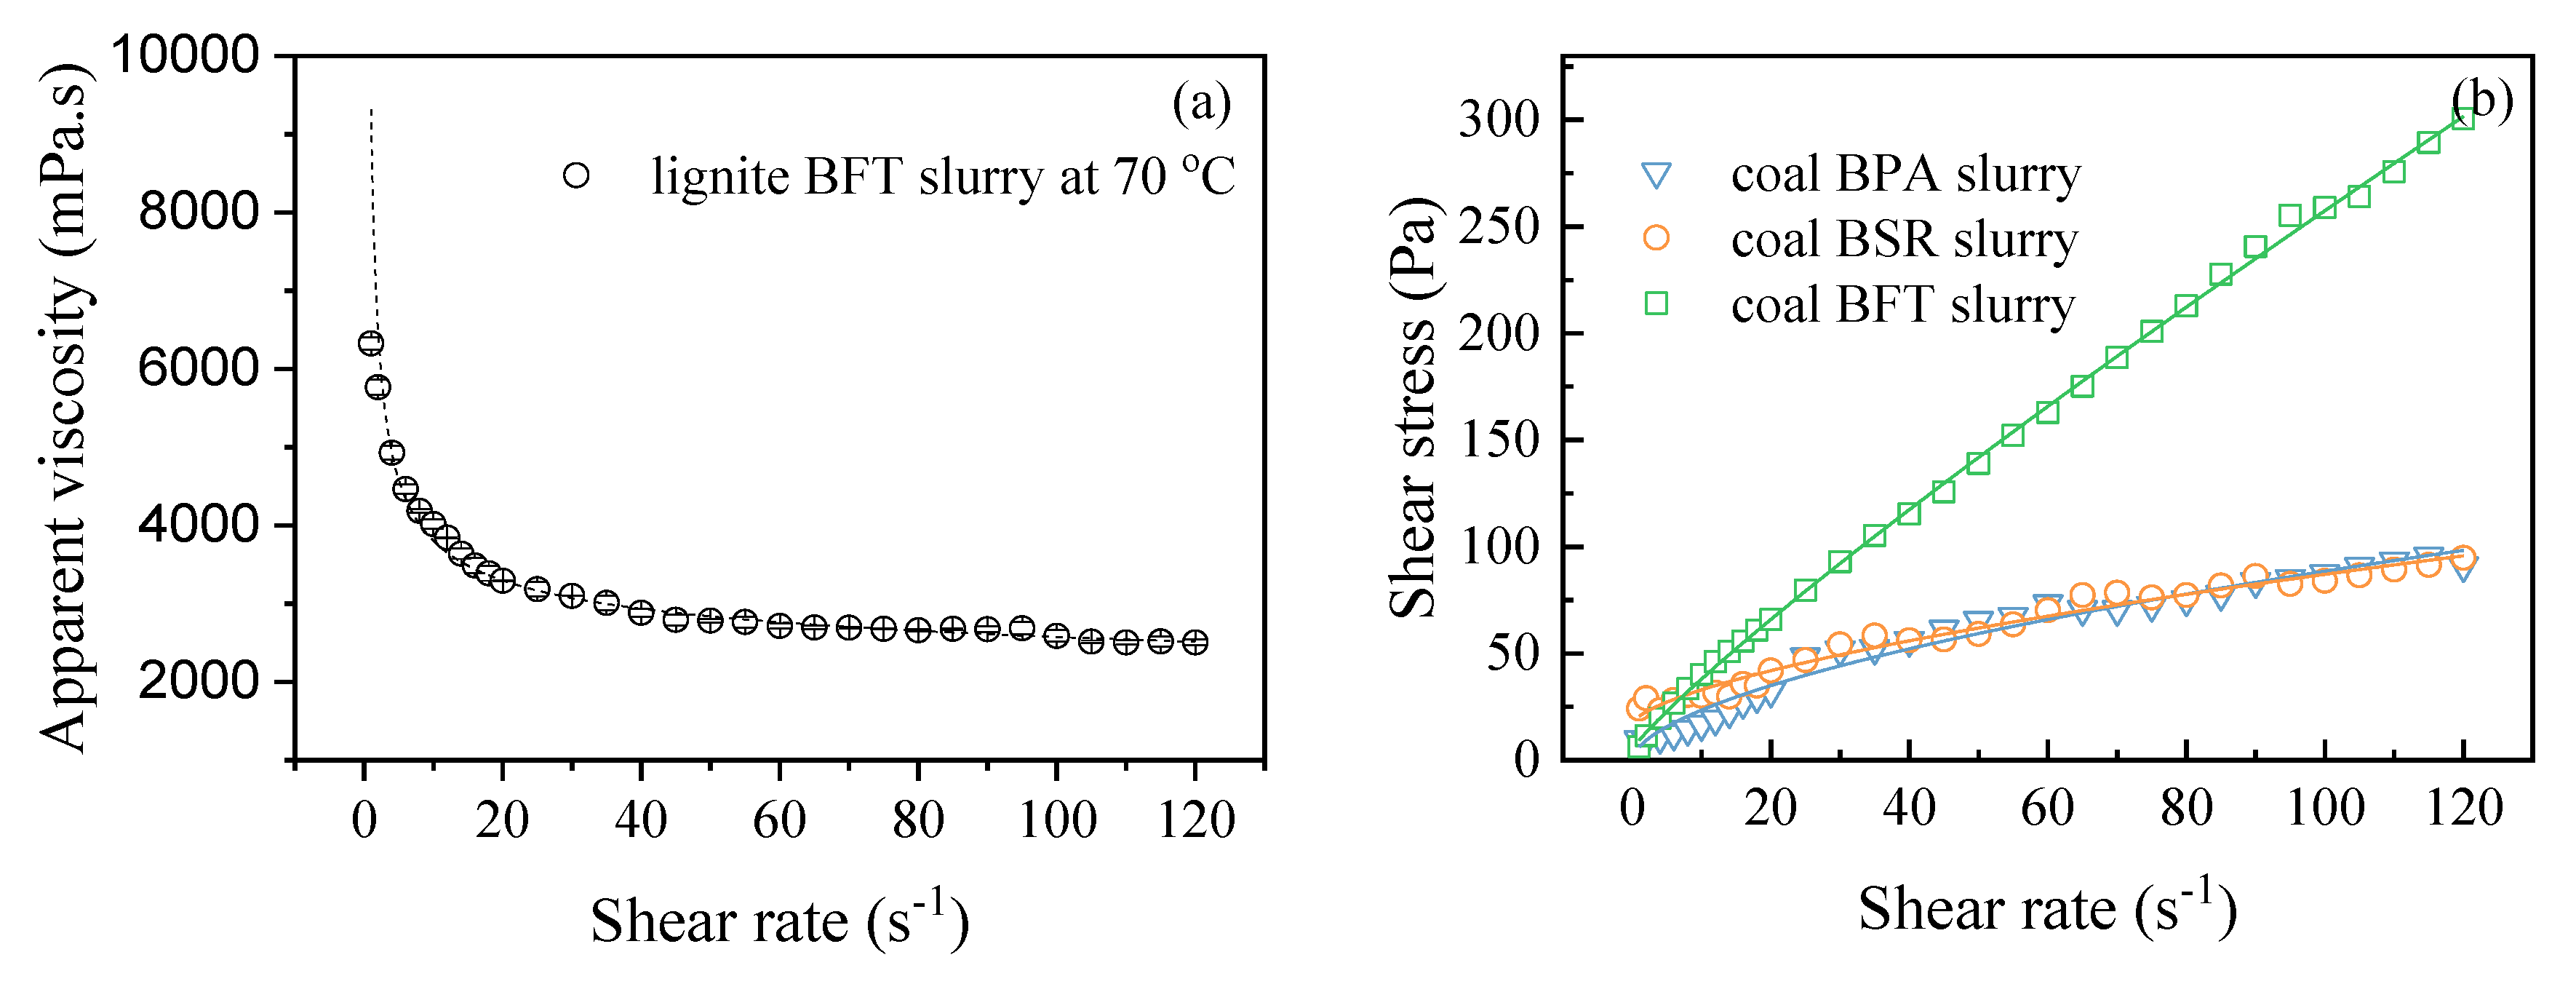
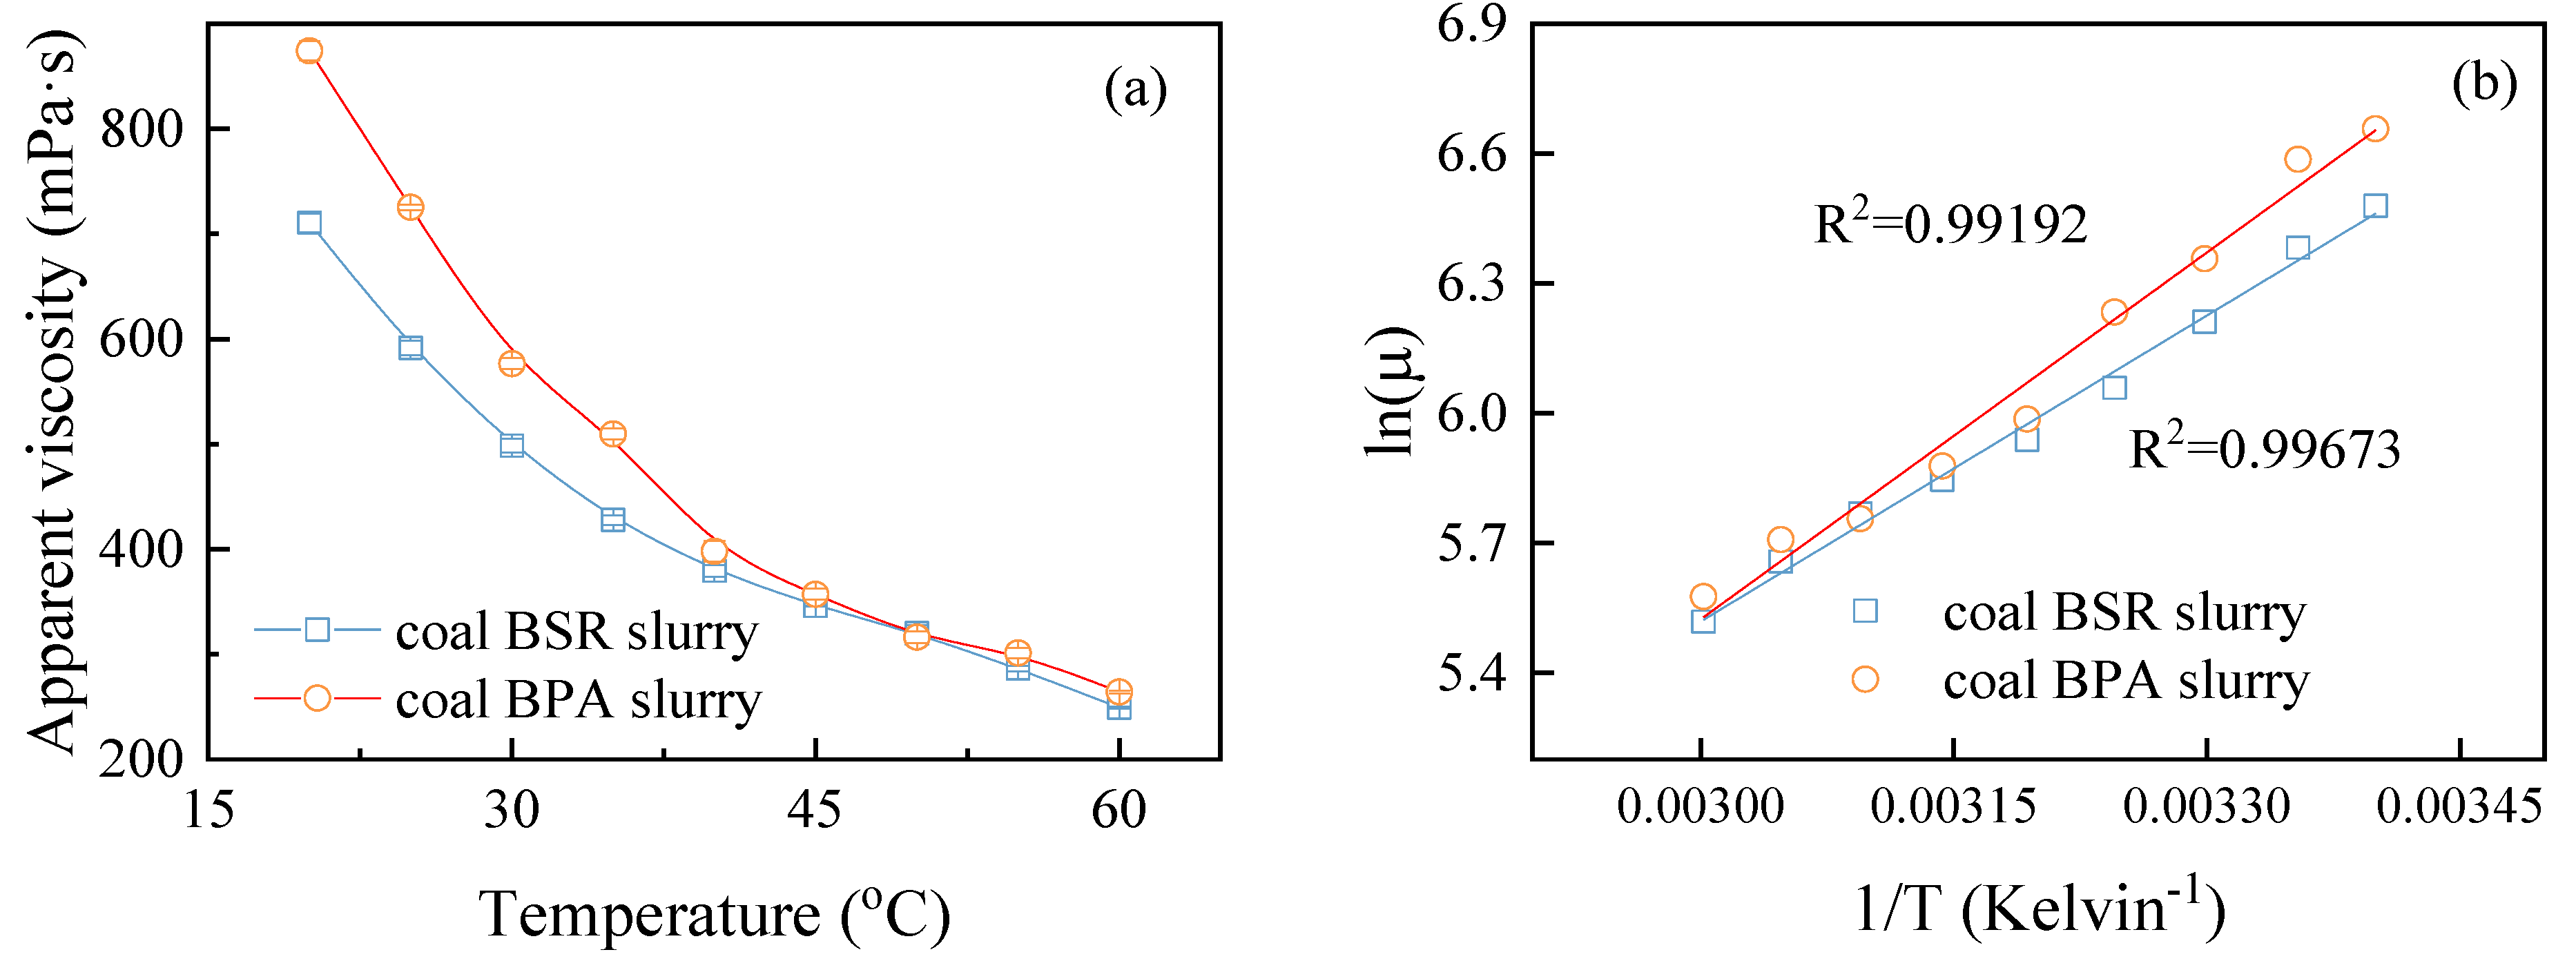
3.1. Rheological Behaviors
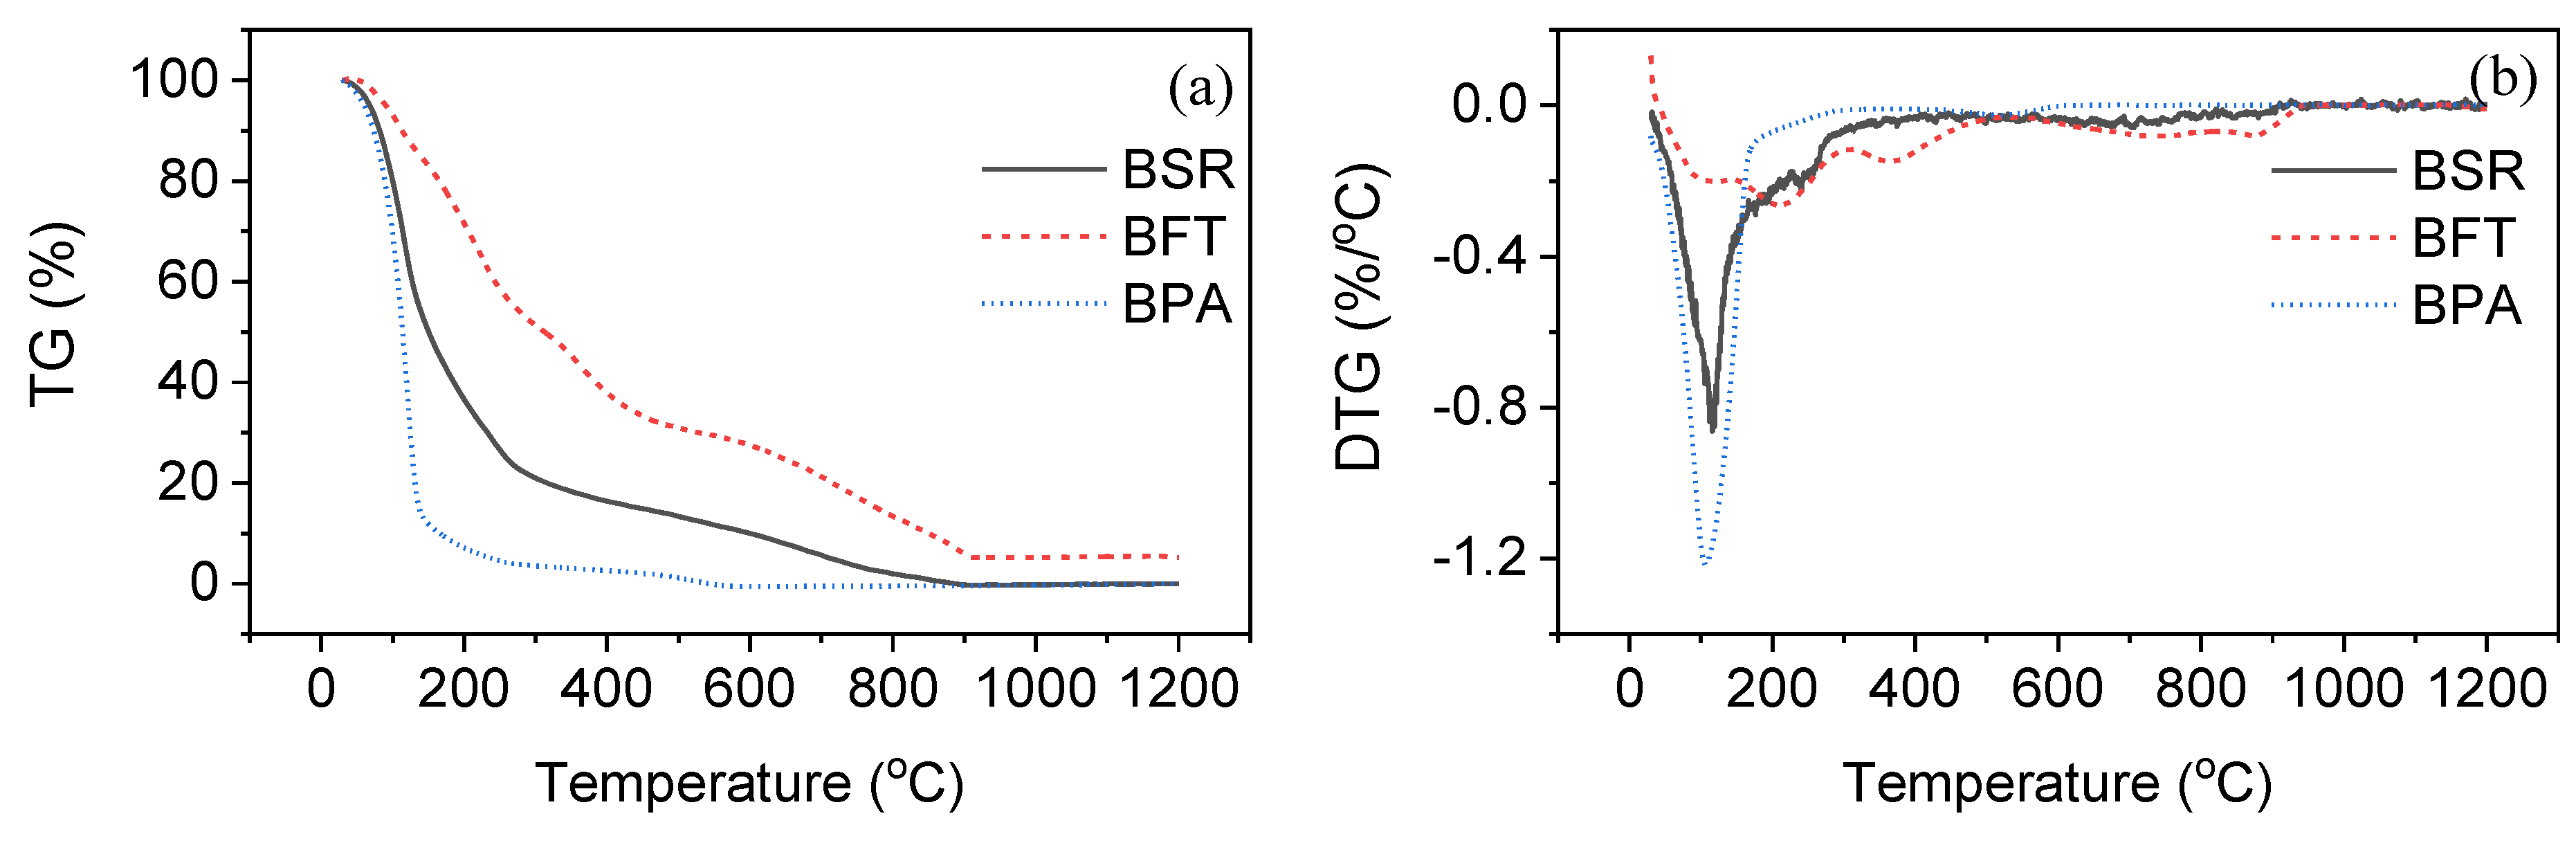
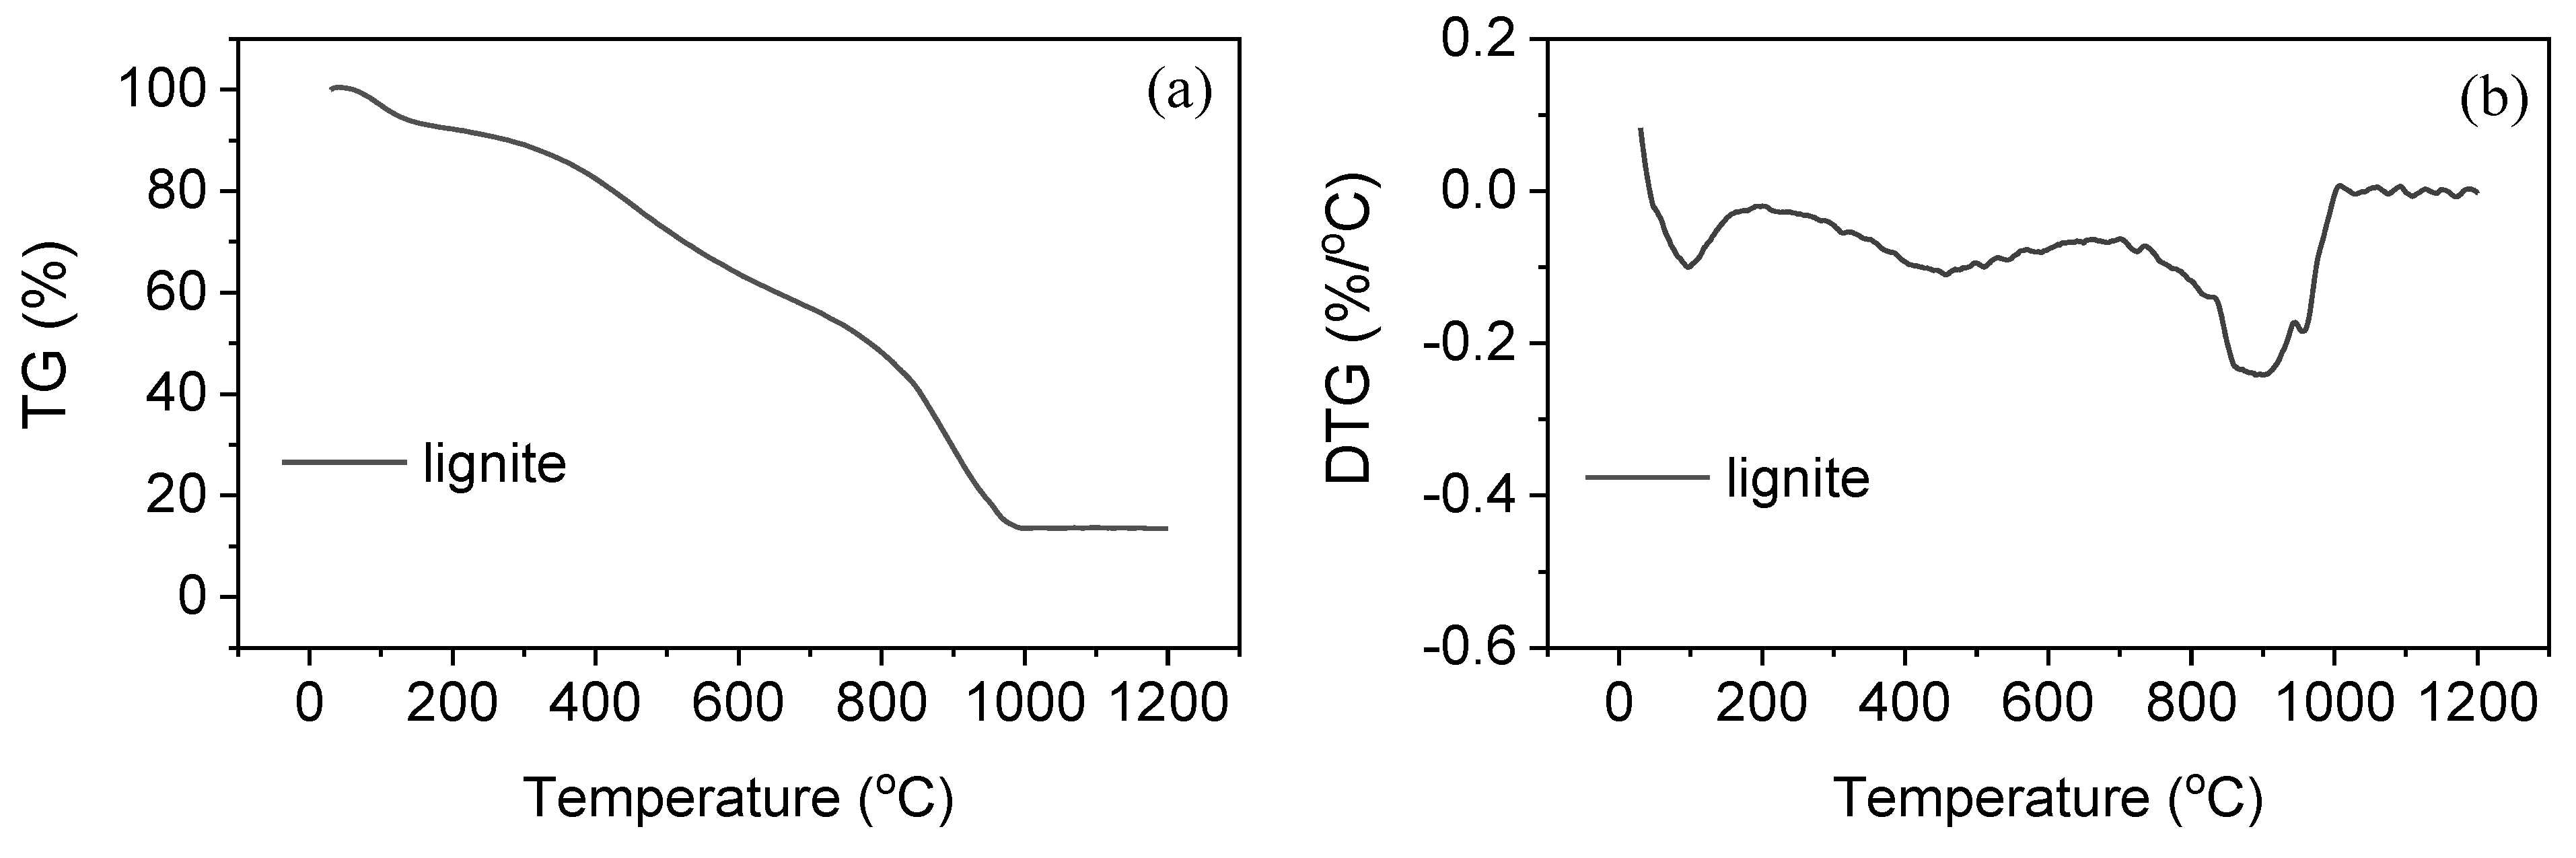
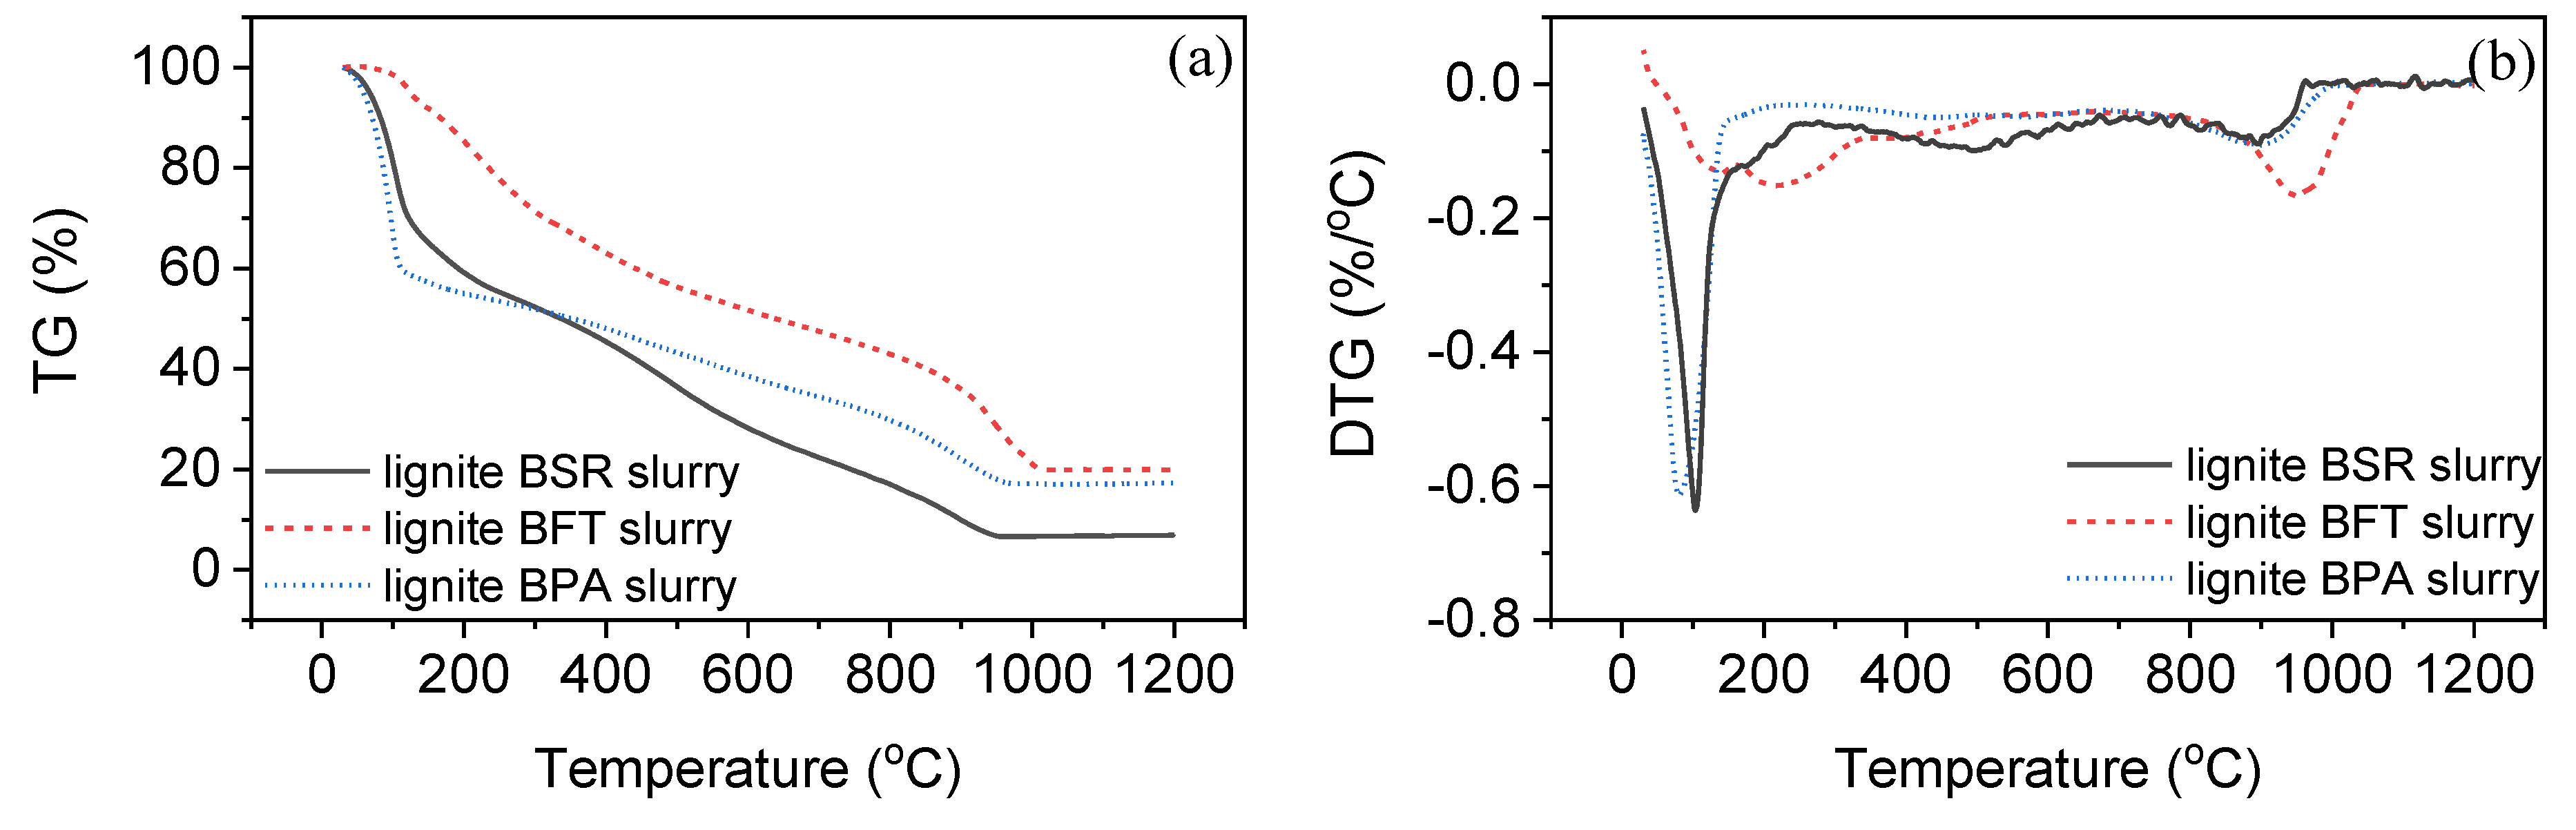
3.2. Gasification of Slurry Fuels
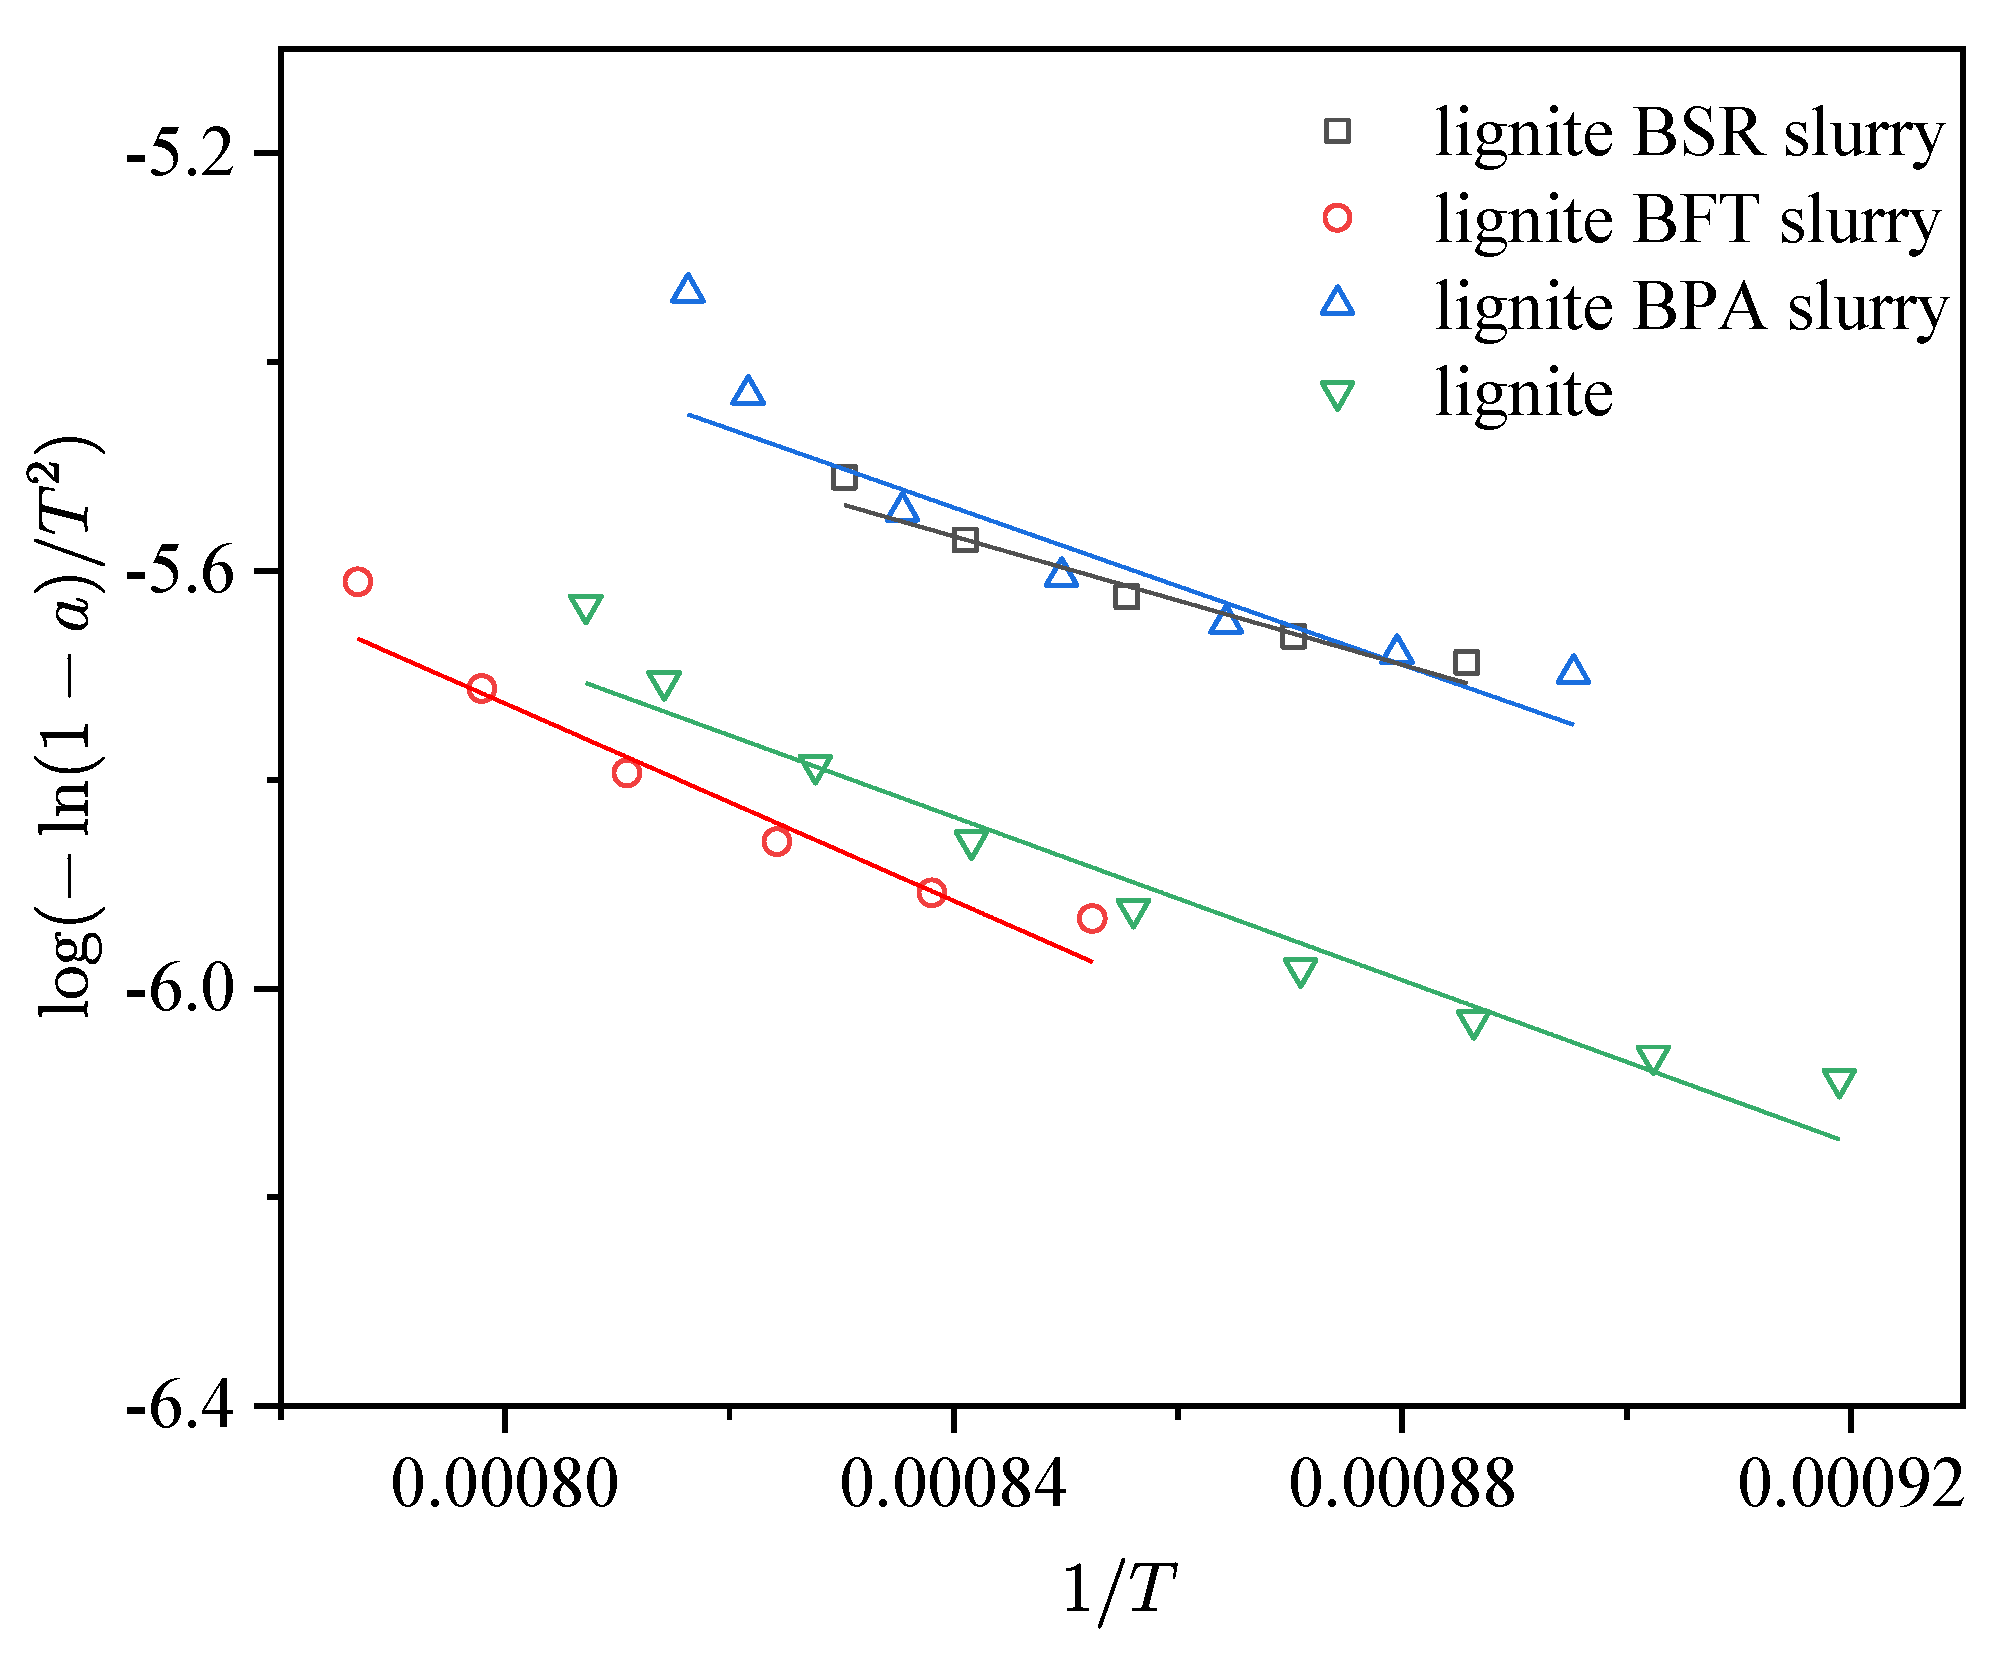
3.3. Thermaodynamic Analysis
4. Conclusions
Supplementary Materials
Author Contributions
Funding
Acknowledgments
Conflicts of Interest
Nomenclature
| BSR | bio-oil derived from straw and husk pyrolysis |
| BPA | bio-oil from pyroligneous acid |
| BFT | bio-oil derived from fruit trees pyrolysis |
| Tm1 | the temperature at the maximum weight loss rate in stage 1 |
| Tm2 | the temperature at the maximum weight loss rate in stage 2 |
| Tm3 | the temperature at the maximum weight loss rate in stage 3 |
| Tf | the final weight loss temperature |
| E | activation energy |
| A | frequency factor |
References
- Trippe, F.; Fröhling, M.; Schultmann, F.; Stahl, R.; Henrich, E. Techno-economic assessment of gasification as a process step within biomass-to-liquid (BtL) fuel and chemicals production. Fuel Process. Technol. 2011, 92, 2169–2184. [Google Scholar] [CrossRef]
- Chhiti, Y.; Salvador, S.; Commandré, J.-M.; Broust, F.; Couhert, C. Wood Bio-Oil Noncatalytic Gasification: Influence of Temperature, Dilution by an Alcohol and Ash Content. Energy Fuels 2011, 25, 345–351. [Google Scholar] [CrossRef][Green Version]
- Lu, Q.; Li, W.; Zhu, X. Overview of fuel properties of biomass fast pyrolysis oils. Energy Convers. Manag. 2009, 50, 1376–1383. [Google Scholar] [CrossRef]
- Feng, P.; Hao, L.; Huo, C.; Wang, Z.; Lin, W.; Song, W. Rheological behavior of coal bio-oil slurries. Energy 2014, 66, 744–749. [Google Scholar] [CrossRef]
- Dahmen, N.; Henrich, E.; Dinjus, E.; Weirich, F. The bioliq® bioslurry gasification process for the production of biosynfuels, organic chemicals, and energy. Energy Sustain. Soc. 2012, 2, 3. [Google Scholar] [CrossRef]
- Zhang, M.; Liaw, S.B.; Wu, H. Bioslurry as a Fuel. 5. Fuel Properties Evolution and Aging during Bioslurry Storage. Energy Fuels 2013, 27, 7560–7568. [Google Scholar] [CrossRef]
- Guo, F.; Guo, Y.; Guo, Z.; Miao, Z.; Zhao, X.; Zhang, Y.; Li, J.; Wu, J. Recycling Residual Carbon from Gasification Fine Slag and Its Application for Preparing Slurry Fuels. ACS Sustain. Chem. Eng. 2020, 8, 8830–8839. [Google Scholar] [CrossRef]
- Zhang, Y.; Kajitani, S.; Ashizawa, M.; Oki, Y. Tar destruction and coke formation during rapid pyrolysis and gasification of biomass in a drop-tube furnace. Fuel 2010, 89, 302–309. [Google Scholar] [CrossRef]
- Feng, P.; Lin, W.; Jensen, P.A.; Song, W.; Hao, L.; Raffelt, K.; Dam-Johansen, K. Entrained flow gasification of coal/bio-oil slurries. Energy 2016, 111, 793–802. [Google Scholar] [CrossRef]
- Feng, P.; Lin, W.; Jensen, P.A.; Song, W.; Hao, L.; Li, S.; Dam-Johansen, K. Characterization of Solid Residues from Entrained Flow Gasification of Coal Bio-Oil Slurry. Energy Fuels 2020, 34, 5900–5906. [Google Scholar] [CrossRef]
- Raffelt, K.; Henrich, E.; Koegel, A.; Stahl, R.; Steinhardt, J.; Weirich, F. The BTL2 Process of Biomass Utilization Entrained-Flow Gasification of Pyrolyzed Biomass Slurries. Appl. Biochem. Biotechnol. 2006, 129, 153–164. [Google Scholar] [CrossRef]
- Wu, H.; Yu, Y.; Yip, K. Bioslurry as a Fuel. 1. Viability of a Bioslurry-Based Bioenergy Supply Chain for Mallee Biomass in Western Australia. Energy Fuels 2010, 24, 5652–5659. [Google Scholar] [CrossRef]
- Abdullah, H.; Mourant, D.; Li, C.-Z.; Wu, H. Bioslurry as a Fuel. 3. Fuel and Rheological Properties of Bioslurry Prepared from the Bio-oil and Biochar of Mallee Biomass Fast Pyrolysis. Energy Fuels 2010, 24, 5669–5676. [Google Scholar] [CrossRef]
- Abdullah, H.; Wu, H. Bioslurry as a Fuel. 4. Preparation of Bioslurry Fuels from Biochar and the Bio-oil-Rich Fractions after Bio-oil/Biodiesel Extraction. Energy Fuels 2011, 25, 1759–1771. [Google Scholar] [CrossRef]
- Gao, W.; Zhang, M.; Wu, H. Fuel properties and ageing of bioslurry prepared from glycerol/methanol/bio-oil blend and biochar. Fuel 2016, 176, 72–77. [Google Scholar] [CrossRef]
- Sakaguchi, M.; Watkinson, A.P.; Ellis, N. Steam Gasification of Bio-Oil and Bio-Oil/Char Slurry in a Fluidized Bed Reactor. Energy Fuels 2010, 24, 5181–5189. [Google Scholar] [CrossRef]
- Svoboda, K.; Pohořelý, M.; Jeremiáš, M.; Kameníková, P.; Hartman, M.; Skoblja, S.; Huber, F. Fluidized bed gasification of coal–oil and coal–water–oil slurries by oxygen–steam and oxygen–CO2 mixtures. Fuel Process. Technol. 2012, 95, 16–26. [Google Scholar] [CrossRef]
- Ruoppolo, G.; Cante, A.; Chirone, R.; Miccio, F.; Stanzione, V. Fluidized bed gasification of coal/biomass slurries. Chem. Eng. Trans. 2011, 24, 13–18. [Google Scholar]
- Dash, U.; Dash, U.; Nayak, A.; Misra, P.K. Surface Engineering of Low Rank Indian Coals by Starch-Based Additives for the Formulation of Concentrated Coal−Water Slurry. Energy Fuels 2010, 24, 1260–1268. [Google Scholar] [CrossRef]
- Huang, J.; Xu, J.; Wang, N.; Li, L.; Guo, X. Effects of Amphiphilic Copolymer Dispersants on Rheology and Stability of Coal Water Slurry. Ind. Eng. Chem. Res. 2013, 52, 8427–8435. [Google Scholar] [CrossRef]
- Dash, U.; Dash, U.; Meher, J.; Misra, P.K. Improving stability of concentrated coal–water slurry using mixture of a natural and synthetic surfactants. Fuel Process. Technol. 2013, 113, 41–51. [Google Scholar] [CrossRef]
- Liu, Z.; Wang, Q. Calculation and confirmation of the kinetic triplet of metallurgical coke gasification with carbon dioxide under isothermal conditions. J. Therm. Anal. Calorim. 2019, 139, 2235–2241. [Google Scholar] [CrossRef]
- Di Blasi, C. Combustion and gasification rates of lignocellulosic chars. Prog. Energy Combust. Sci. 2009, 35, 121–140. [Google Scholar] [CrossRef]
- Slezak, R.; Krzystek, L.; Ledakowicz, S. CO2 gasification of char from spent mushroom substrate in TG-MS system. J. Therm. Anal. Calorim. 2019, 140, 2337–2345. [Google Scholar] [CrossRef]
- Creager, N.; Brown, R.C. High pressure, oxygen blown entrained-flow gasification of bio-oil. In Proceedings of the International Conference on Thermochemical Conversion of Biomass, Chicago, IL, USA, 3–6 September 2013. [Google Scholar]
- Chhiti, Y.; Salvador, S. Gasification of wood bio-oil. In Gasification for Practical Applications; Yun, Y., Ed.; InTech: Londin, UK, 2012. [Google Scholar] [CrossRef][Green Version]
- Chhiti, Y. Non Catalytic Steam Gasification of Wood Bio-Oil. Ph.D. Thesis, Univerite du Toulouse, Toulouse, France, 5 September 2011. [Google Scholar]
- Noumi, E.S.; Blin, J.; Valette, J.; Rousset, P. Combined Effect of Pyrolysis Pressure and Temperature on the Yield and CO2 Gasification Reactivity of Acacia Wood in macro-TG. Energy Fuels 2015, 29, 7301–7308. [Google Scholar] [CrossRef]


| Samples | Proximate Analysis | Ultimate Analysis | |||||||
|---|---|---|---|---|---|---|---|---|---|
| Mad * | Ad | Vdaf | FCd | Cdaf | Hdaf | Odaf | Ndaf | St,d | |
| % | % | % | % | % | % | % | % | % | |
| Lignite | 1.77 | 20.83 | 45.3 | 43.31 | 70.32 | 4.20 | 25.74 | 0.99 | 0.42 |
| Sample | τ0 | k | n | R2 |
|---|---|---|---|---|
| Coal BPA slurry | 4.84 | 6.21 | 0.58 | 0.97605 |
| Coal BSR slurry | 16.93 | 3.66 | 0.64 | 0.97775 |
| Coal BFT slurry | 5.00 | 4.32 | 0.88 | 0.9991 |
| Sample | Tm1 (°C) | Tm2 (°C) | Tm3 (°C) | Tf (°C) |
|---|---|---|---|---|
| BSR | 116 | 238 | 705 | 914 |
| BPA | 107 | 521 | - | - |
| BFT | 121 | 209/363 | 733/876 | 939 |
| lignite | 97 | 457 | 899 | 1021 |
| Sample | Tm1 (°C) | Tm2 (°C) | Tm3 (°C) | Tf (°C) |
|---|---|---|---|---|
| lignite BSR slurry | 103 | 498 | 895 | 967 |
| lignite BPA slurry | 81 | 428 | 898 | 1000 |
| lignite BFT slurry | 137 | 215/367 | 959 | 1041 |
| Sample | Temperature Range (°C) | E (kJ·mol−1) | A (×10−4 s−1) | R2 |
|---|---|---|---|---|
| lignite BSR slurry | 856–931 | 58.84 | 2.46 | 0.96 |
| lignite BFT slurry | 900–998 | 90.40 | 41.13 | 0.96 |
| lignite BPA slurry | 844–953 | 72.05 | 12.19 | 0.95 |
| lignite | 815–966 | 74.82 | 8.47 | 0.96 |
© 2020 by the authors. Licensee MDPI, Basel, Switzerland. This article is an open access article distributed under the terms and conditions of the Creative Commons Attribution (CC BY) license (http://creativecommons.org/licenses/by/4.0/).
Share and Cite
Feng, P.; Li, J.; Wang, J.; Wang, H.; Xu, Z. Effect of Bio-Oil Species on Rheological Behaviors and Gasification Characteristics of Coal Bio-Oil Slurry Fuels. Processes 2020, 8, 1045. https://doi.org/10.3390/pr8091045
Feng P, Li J, Wang J, Wang H, Xu Z. Effect of Bio-Oil Species on Rheological Behaviors and Gasification Characteristics of Coal Bio-Oil Slurry Fuels. Processes. 2020; 8(9):1045. https://doi.org/10.3390/pr8091045
Chicago/Turabian StyleFeng, Ping, Jie Li, Jinyu Wang, Huan Wang, and Zhiqiang Xu. 2020. "Effect of Bio-Oil Species on Rheological Behaviors and Gasification Characteristics of Coal Bio-Oil Slurry Fuels" Processes 8, no. 9: 1045. https://doi.org/10.3390/pr8091045
APA StyleFeng, P., Li, J., Wang, J., Wang, H., & Xu, Z. (2020). Effect of Bio-Oil Species on Rheological Behaviors and Gasification Characteristics of Coal Bio-Oil Slurry Fuels. Processes, 8(9), 1045. https://doi.org/10.3390/pr8091045