Article

Numerical Investigation of a Portable Incinerator: A Parametric Study

by
Mohsen Saffari Pour
1,2,
Ali Hakkaki-Fard
1,* and
Bahar Firoozabadi
1
1
Department of Mechanical Engineering, Sharif University of Technology, Tehran 79417, Iran
2
KTH Royal Institute of Technology, 114 28 Stockholm, Sweden
*
Author to whom correspondence should be addressed.
Processes 2020, 8(8), 923; https://doi.org/10.3390/pr8080923
Submission received: 18 June 2020 / Revised: 20 July 2020 / Accepted: 21 July 2020 / Published: 2 August 2020

Abstract

:
The application of incinerators for the municipal solid waste (MSW) is growing due to the ability of such instruments to produce energy and, more specifically, reduce waste volume. In this paper, a numerical simulation of the combustion process with the help of the computational fluid dynamics (CFD) inside a portable (mobile) incinerator has been proposed. Such work is done to investigate the most critical parameters for a reliable design of a domestic portable incinerator, which is suitable for the Iranian food and waste culture. An old design of a simple incinerator has been used to apply the natural gas (NG), one of the available cheap fossil fuels in Iran. After that, the waste height, place of the primary burner, and the flow rate of the cooling air inside the incinerator, as the main parameters of the design, are investigated. A validation is also performed for the mesh quality test and the occurrence of the chemical reactions near the burner of the incinerator. Results proved that the numerical results have less than 5% error compared to the previous experimental and numerical approaches. In addition, results show that by moving the primary burner into the secondary chamber of the incinerator, the temperature and the heating ability of the incinerator could be affected dramatically. Moreover, it has been found that by increasing the flow rate of the cooling air inside the incinerator to some extent, the combustion process is improved and, on the other hand, by introducing more cooling air, the evacuation of the hazardous gases from the exhaust is also improved.

1. Introduction

The history of burning waste is narrated from many years ago up to modern human life. In the previous era, people burned waste, usually various kinds of woods and animal wastes, to produce heat for boiling water or cooking foods [1,2]. This procedure is still popular in some rural areas of Iran and some other countryside due to the less populated area and difficulties of preparing/transportation of other kinds of fuels for their domestic use. Of course, waste burning and other related technologies have been improved during the past decades, but still these techniques are far from being fully implemented worldwide. Some of the main obstacles in front of their advances can be pointed out as; cultural issues, the countries’ directives and priorities, waste types, and sufficient places for landfills. It is noteworthy that all the progress in this way is related to many trials and errors and numerous devoted strategic studies, which are rarely publicly available for all researchers [2]. Access to all data related to the progress of this subject due to the vast usages, different applications, and various kinds of wastes are the main debates between the researchers in this field.
In the last few decades, many countries tried to have some good ideas to manage their wastes [3]. For example, during this period, many advances happened in medical applications; the medical wastes, how to treat them environmentally, and the use of them as a source of energy become a headache for all battle sides [3,4]. Moreover, it was essential for some troops to reduce their track by completely eliminating their wastes. Therefore, several countries have tried to apply some traditional methods together with novel research to invent new methods to use wastes efficiently [2]. In the available literature, the prior usage of the incinerators to the modern techniques with their current definition was first reported for the Czech Republic and the UK [4,5]. After that, recent instruments and advances in combustion techniques helped researchers and many other countries to be sure to make huge investments on this topic. Such efforts have paid off for advanced countries like Sweden, Germany, and Denmark. Nowadays, these countries use their wastes, and even import wastes from other countries to produce the domestic heat and electricity using the knowledge and techniques of district heating (DH) [6,7,8,9]. The progress in this topic is not only focused on the big incinerators but also on the small and home application of incinerators. Nowadays, small incinerators and portable ones are becoming popular in marine, military and hospital applications, and a few samples exist for home applications [10].
In advancing countries like Iran and many other regional countries, due to the vast and low-cost sources of fossil fuels, other resources received less attention [9]. For instance, renewable energies, like solar, hydropower, geothermal and incineration, were not that successful in competing with fossil fuels [11]. Renewable energies could be completely independent of fossil fuels, but incineration is a good sample way, which helps countries to think about a transition technique to partially/completely reduce their dependencies to fossil fuels. In Iran, traditionally, many applications of incineration were reported. Recently in Iran, some municipalities and some little companies tried to implement incineration to produce heat. Reports show that to some extent, by helping companies abroad and importing their techniques, some progress has been achieved. All of their attempts were mainly on the building of big incinerator facilities to produce heat and electricity [12,13,14,15,16,17]. Meanwhile, many research projects have been introduced at university levels, which are focused on the environmental concerns and not on the techniques [18]. Therefore, less attention to the combustion techniques and small portable incinerators is a matter of concern in this research. In such studies, it has been attempted to improve the combustion knowledge in incinerators as well as the application of portable incineration for small rural areas [19,20,21,22]. During the last year, many countries focused on research with special attention to the incinerators. The main principal behind using the incineration technique is to reduce the volume and toxicity level of the municipal solid wastes, chemical and other biomaterial wastes. As a sample of implementation of the incinerations, the United States could be considered. In this country, more than 100 active facilities exist for the solid wastes. In addition, 1600 smaller size incinerators are acting to reduce the medical wastes. These are not the only application of such chambers, around 200 similar combustion chambers, industrial boilers and furnaces are dealing with hazardous and nonhazardous fuel sources [23].
Therefore, many papers have been published, but their main matter of concern was about thermo-economic and environmental aspects. It means that a narrow gap exists regarding the full understanding of the combustion behavior inside incinerators [24,25]. More specifically, when pandemic dieses endanger human beings, the knowledge of incineration is of importance to deal with reducing the landfilling of the untreated medical wastes [26,27].
In this paper, with the help of Computational Fluid Dynamics (CFD) and combustion knowledge, a portable home incinerator, which can be used in the rural areas of Iran, has been simulated. A parametric study is done to investigate the most involved parameters on the working of a portable incinerator. Moreover, the ability of the incinerator to burn various volumes of wastes has been studied numerically.

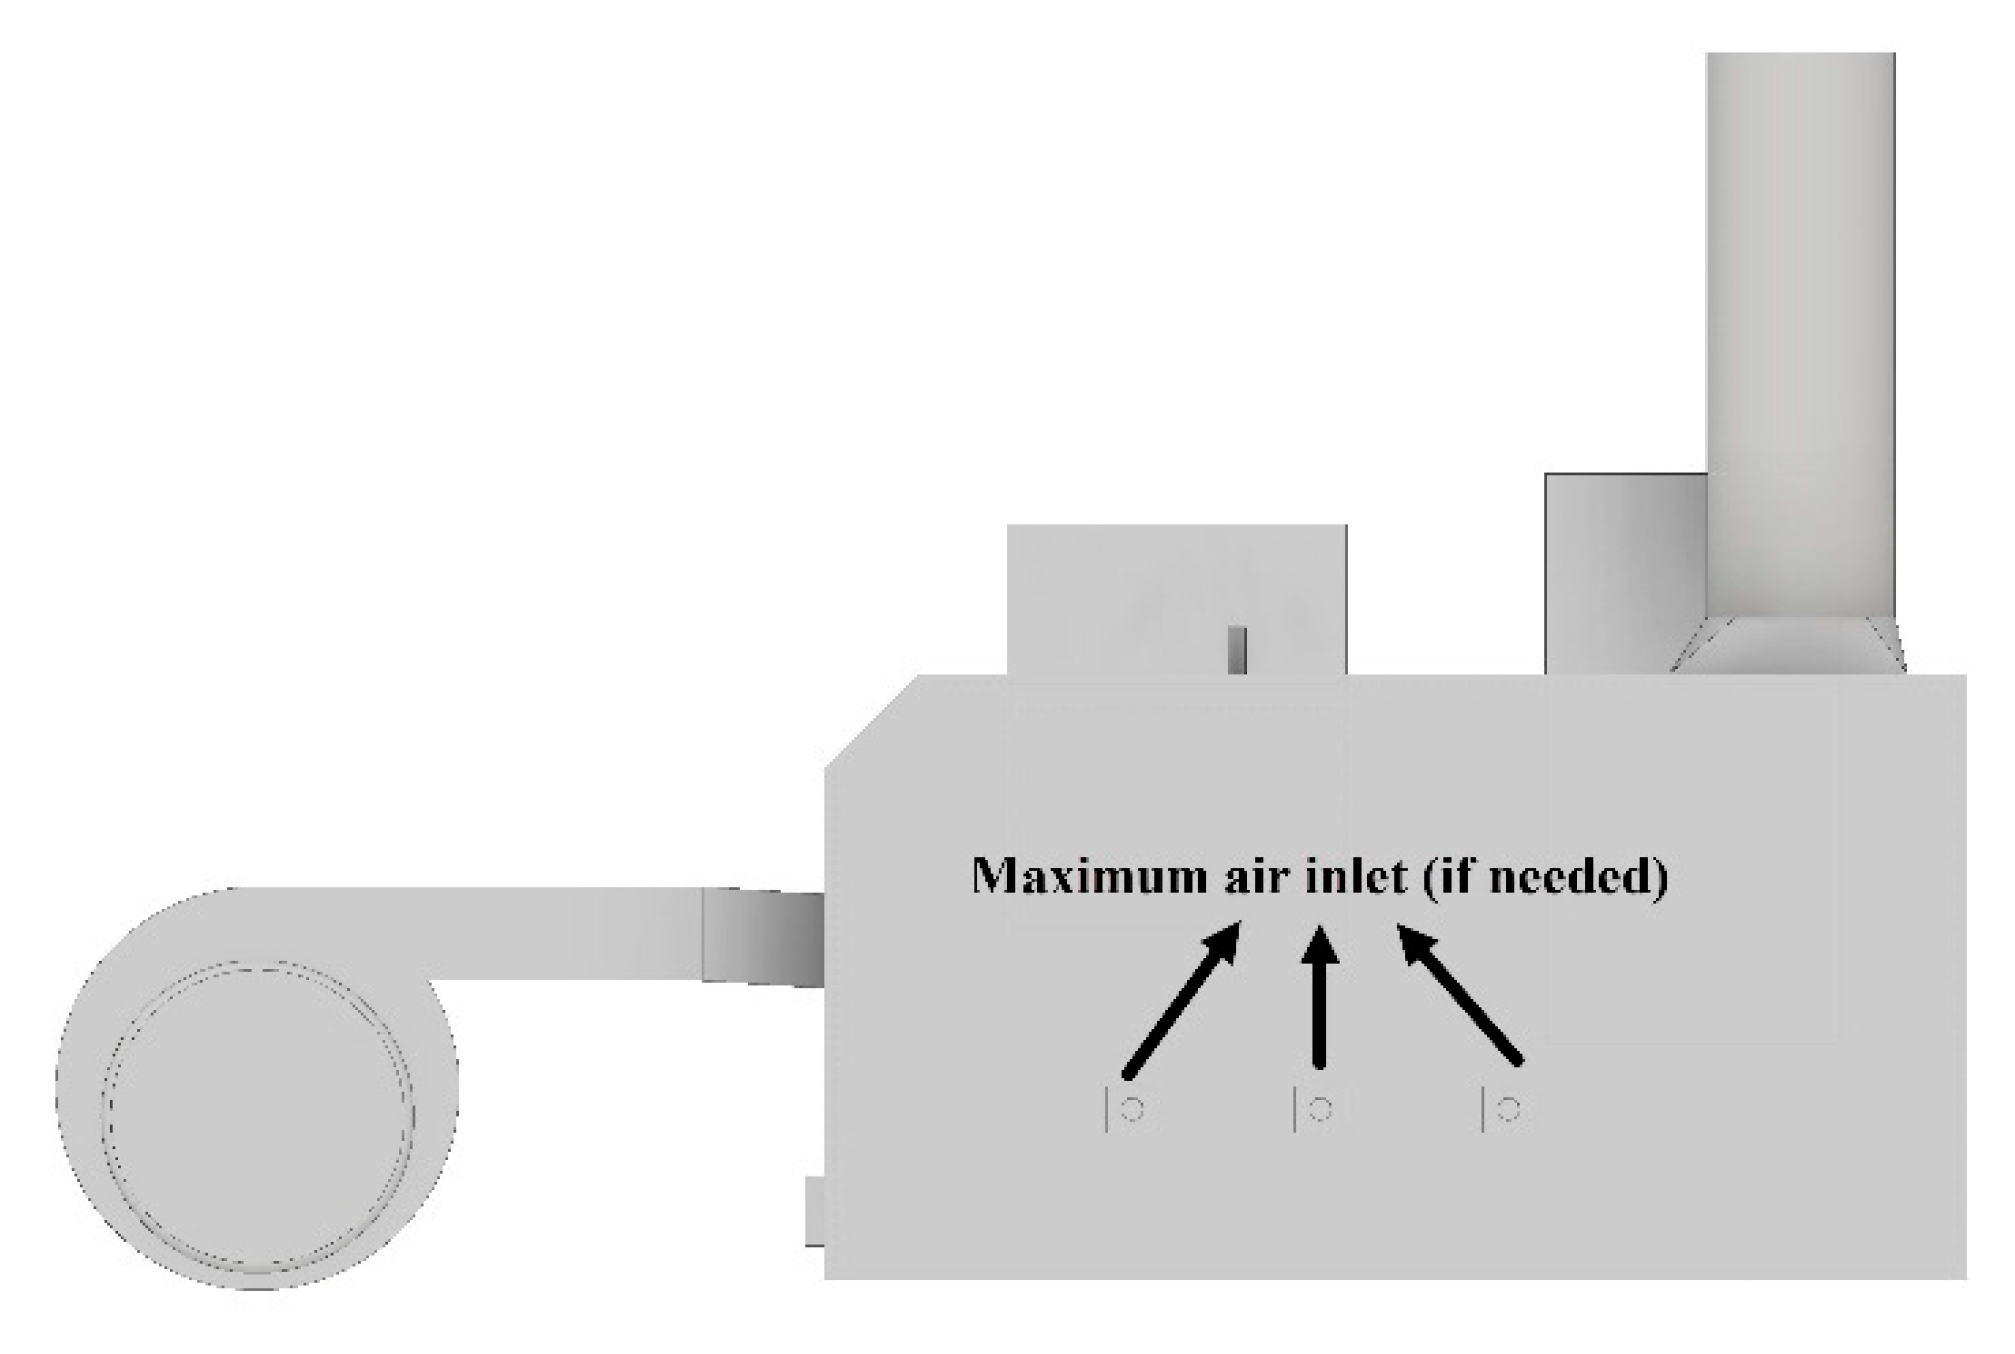
2. Geometry Creation

In order to simulate the combustion process inside the incinerator, it is necessary to follow several steps. In the first step, the geometry of the incinerator is created by using the ANSYS WORKBENCH 19.2 (Ansys Inc., Canonsburg, PA, USA) [28]. According to the first design of the incinerator, the geometry is depicted schematically in Figure 1 and Figure 2. In Figure 2, the considered incinerator is presented in a side view to show other important aspects of such geometry. Based on the schematic of the incinerator, the computational domain is created in Figure 3. Later on, the crated geometry is prepared by a network of mesh, which is verified and validated by temperature variations along the centerline. Such validation is done to show the independence of the results to the element numbers. More details of validations are reported in the results and discussion part.
Generally, the powers of the portable incinerators are in the range of 1000 kW to 1500 kW with the burning rate of 60–80 kg/h [10,29]. According to the principal geometry, the important parts of the portable incinerator are identified as the primary combustion chamber and the secondary combustion chamber. It is noteworthy to mention that for doing a simulation, it would be very difficult to consider all geometry details. Consequently, the most involved details in the simulations are introduced to the models. Figure 3 is presented to show the entire computational domain according to the simplified model. As it is shown in this figure, the biggest chamber on the right side is the primary one, and the smallest one left under the exhaust port is the secondary chamber.
In Figure 4a–c, the network of the created computational elements is presented. As it is shown in this figure, a network of mesh elements is generated in triangular form for the surface mesh and tetrahedral and triangular prism for volume mesh. The total number of elements after doing the mesh quality test is set to be 6,665,341 elements. In Figure 4a, a cut plane in the X–Z direction is depicted, which passed through the upper limit of the rubbish volume to show the volume meshes in this region. In Figure 4c, a cut plane in the X–Y direction is passed through the center line of the main fresh air inlet to show the volume mesh in another view.

3. Waste Properties

The rubbish (waste) composition and their properties are completely different according to many factors and the food culture. Table 1 is prepared according to the average material properties, which are prepared from the Iranian food and waste culture. In this study, the MSW involves approximately 38% paper, 25% food waste (solid material), 10% plastics, 19% car tire, and 8% glass.

4. Governing Equations

In order to calculate the flow field and the combustion of the waste burning inside an incinerator, it is necessary to have a very complicated system, which considers all of the involved phenomena. In the first step of simulations, for geometry a simplification is performed to consider the most involved boundaries. Now, it is the time to solve the equations according to the geometry and the created computational domain. Therefore, it is very common to use some simplifications in assumption to consider the most involved reactions as well. Accordingly, the governing equations are divided into two parts. The first part is related to the solid combustion and the respective reactions, and the second part is related to the gas-related equations. These two parts, with their corresponding nomenclatures, are reported in Table 2 and Table 3. Moreover, Iranian natural gas (NG) is used as the primary fuel. Therefore, in this case, all of the composition is normalized and given to the general combustion model of ANSYS FLUENT 19.2 [28]. The general combustion model is used according to the combustion theory for the hydrocarbons. This equation can be written as the following [30,31,32]:
C x H y O z N l S n + ( x + y 4 z 2 + n + l ) O 2 x C O 2 + y 2 H 2 O + l N O 2 + n S O 2
In the above chemical reaction, x, y, z, l, and n are the coefficients that can be derived from the stoichiometric balance of the reaction.
As the gas and air mixture velocity is high enough, the turbulent model has been used for the flow fields. The common k ε model is used for the turbulent modeling [30,31,33].
t ( ρ ¯ k ) + x i ( ρ ¯ u ˜ i k ) = x i ( ( μ + μ t σ k ) k x i ) + G k ρ ¯ ε
t ( ρ ¯ ε ) + x i ( ρ ¯ u ˜ i ε ) = x i ( ( μ + μ t σ ε ) ε x i ) + C 1 ε k G k C 2 ρ ¯ ε 2 k
G k = μ t ( u ˜ j x i + u ˜ i x j ) u ˜ i x i
μ t = C μ ρ ¯ k 2 ε
In the above equations, the constants are defined as: C 1 = 1.44 C 2 = 1.09 , C μ = 0.09 , σ k = 1.0 , and σ ε = 1.3 .
Moreover, the radiative heat transfer is modeled by discrete ordinate (DO). The heat transfer equations are fully discussed by Khodabandeh et al. [29].
The governing boundary conditions for solving the previous problem are given in Table 4 as:

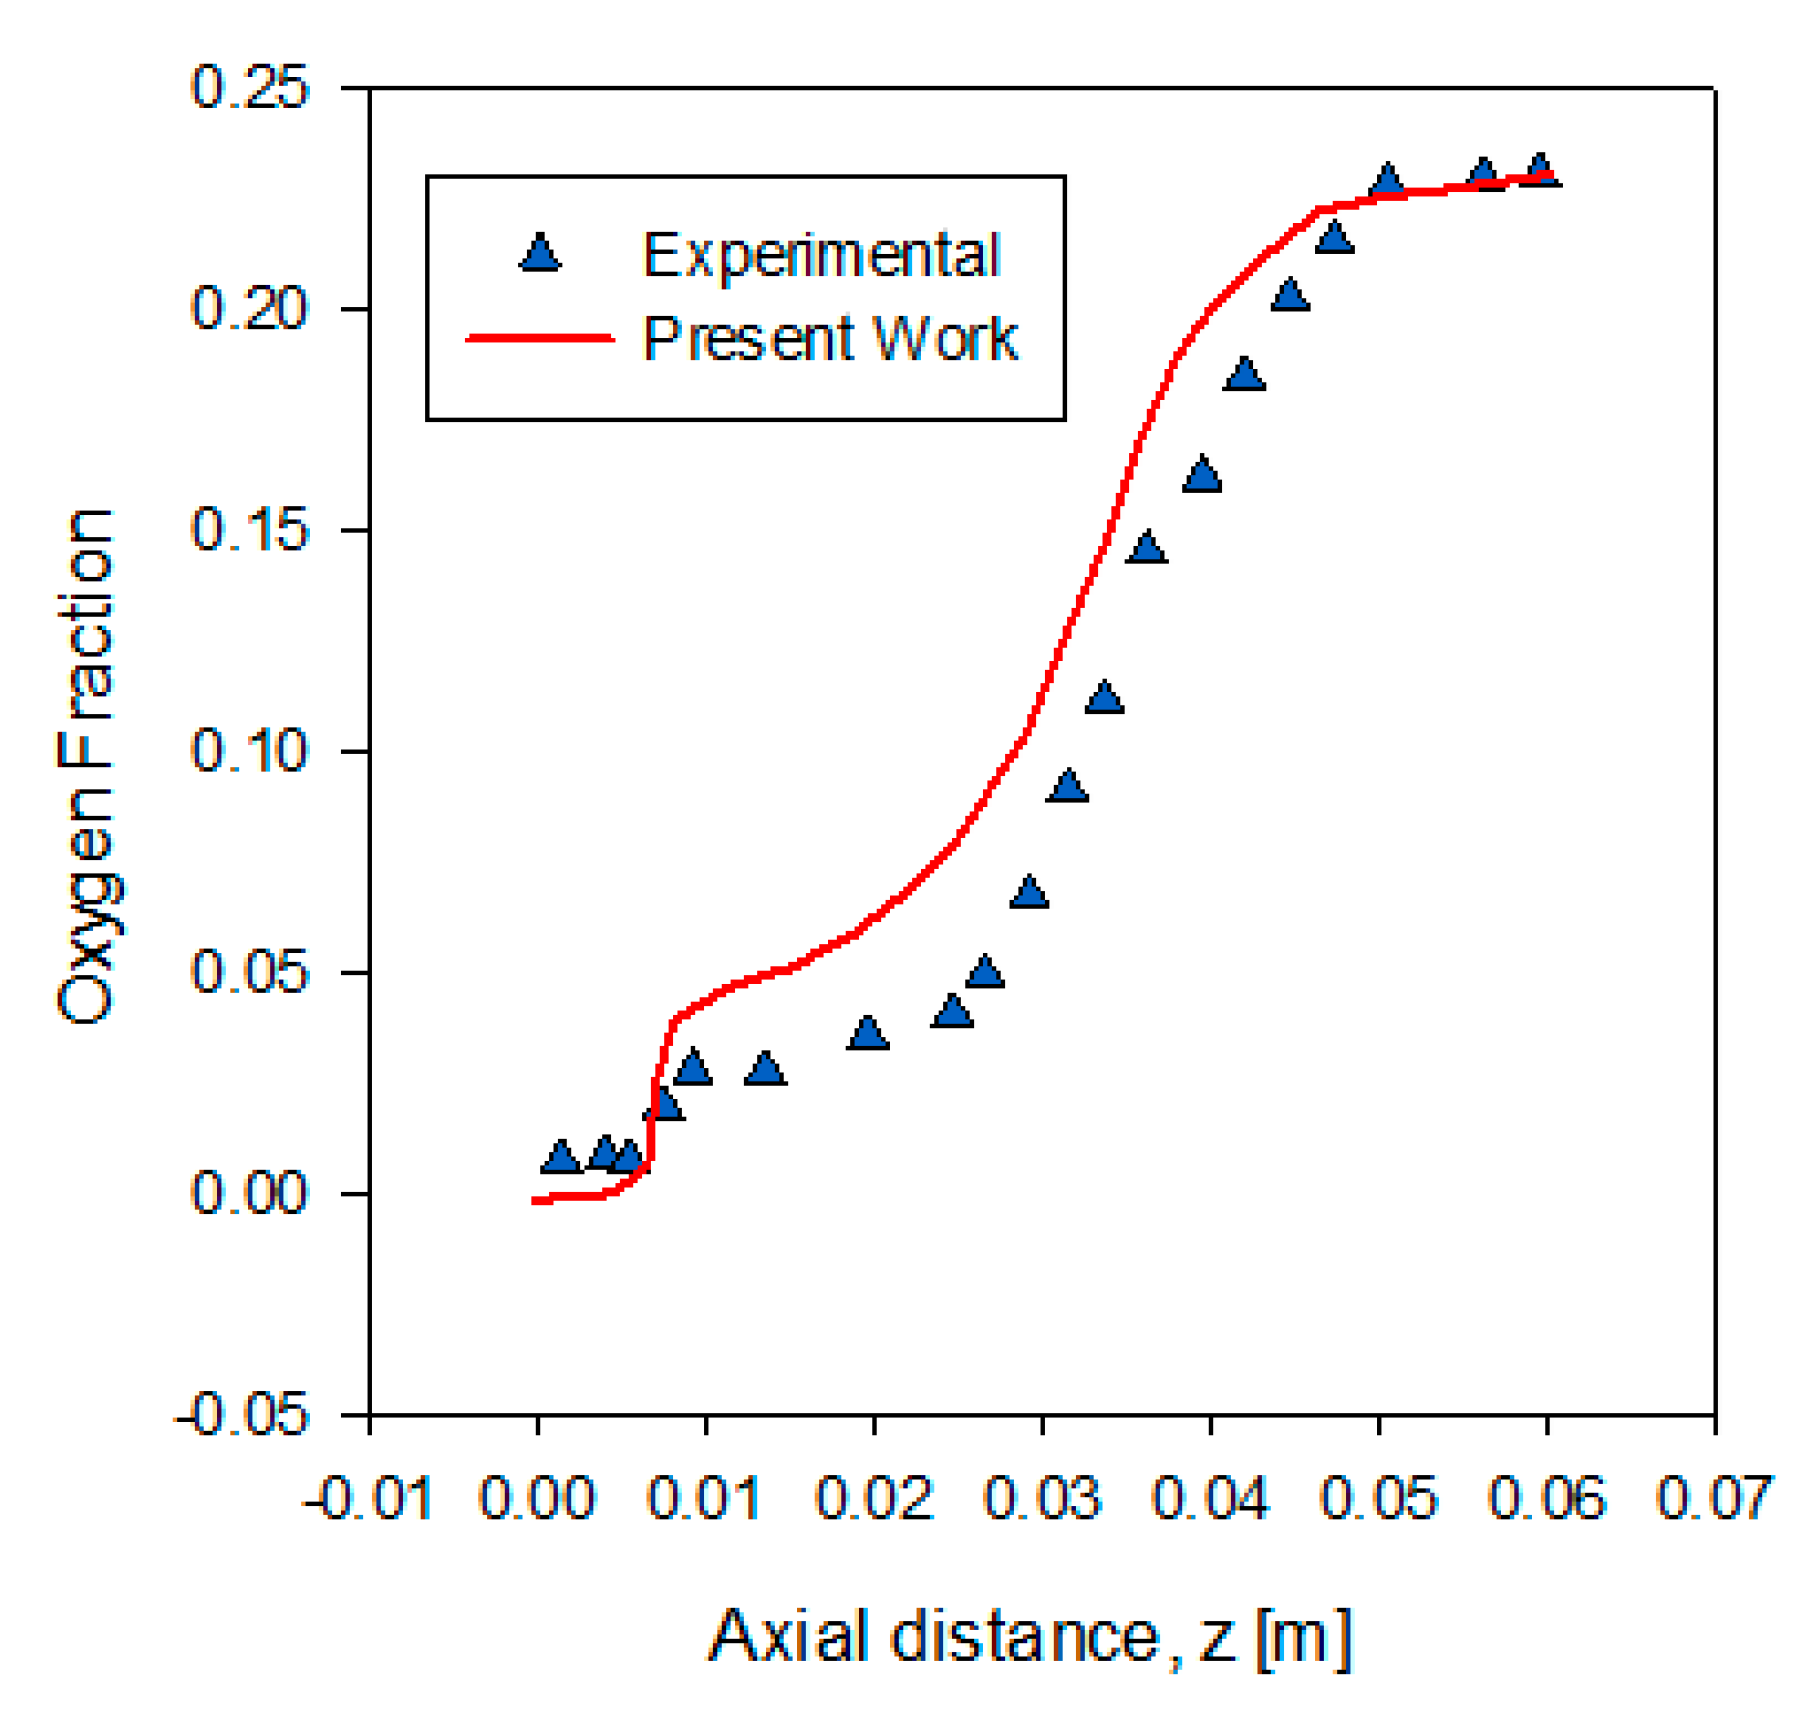
5. Results and Discussion

For doing a reliable simulation of an incinerator, it is completely essential to test the numerical procedures from computational and chemical error aspects. In order to pave the way of checking the simulation procedure, in the first step, three different numbers of mesh elements have been tested with the temperature gradient along with the considered incinerator. A line is passed from the center of the bottom of the main fresh air inlet and it is continued along the incinerator’s full length. These three different numbers of mesh elements are denoted by cases 1 to 3 with 5,969,969, 6,665,341, 77,723,753 elements, respectively. Moreover, the maximum skewness for cases is 0.847, 0.791, and 0.621, respectively. The curvature normal angle for cases is 18°. Figure 5 shows the results of these three cases. As it is clearly illustrated in this figure, the temperature of cases 2 and 3 are very close, and they reported almost similar results. Therefore, for saving the computational time and due to the similar results derived by cases 2 and 3, case 2 is selected as the reference mesh case for further thermo-chemical calculations.
A combustion process verification could be achieved through the validation of chemical reactions. A literature survey leads us to a very similar case, which is done by Alessio Frassoldati et al. [34]. They did the simulation for a 2D axisymmetric burner, which worked with methane/hydrogen as fuel. This selection is chosen due to their comparison with the experiments, and in their numerical work, different turbulent models were considered. Hence, in this case, a direct comparison is done for both numerical simulations and experiments in Figure 6. The compared results show that the oxygen concentration on the centerline is very close to those reported by Alessio Frassoldati et al. [34] and the overall error is less than 5 percent.
In order to present a visual sense of the differences of the compared cases, Figure 7 is presented. In this figure, a cut plane has been shown in the X–Y plane with its normal vector in the z-direction at Z = 0.98 m. All of the contours in this part are depicted based on this cut plane. The reason for choosing this cut plane is to explain the most involved boundaries of waste to show the chemical reactions at these boundaries.

5.1. Effects of Cooling Air

The first parameter in focus in this research is the mass flow rate of the cooling air. To investigate the effects of the cooling air, other parameters are kept constant. It means that the rubbish height is set to be 800 mm, and the primary burner position is set to be 1500 mm. Therefore, the flow rate of the cooling air varies from 0.07 kg/s up to 0.21. Table 5 is prepared to show a summary of the investigated cases and their conditions.
In Figure 8, three different cases for variation of the mass flow rate of the cooling air are presented. One of the famous contours, which are related to the production of gasses in the incinerator, is presented in this figure. As it can be seen from this figure, by increasing the mass flow of the cooling air, carbon monoxide (CO) production has been increased. This is due to the injection of more air with higher velocities, which can produce higher suction power for the evacuation of off-gases from the portable incinerator system.
A combustion reaction is always going in a direction to produce carbon dioxide (CO2). Therefore, having the contours of CO2 during a combustion process could help to identify the rate of pollutant emissions. In Figure 9, the contours of the mass fraction of CO2 on the representative plane similar to CO are depicted. From these contours, it can be inferred that by introducing more air the hot spots in the production of CO2 have been reduced from case 1 to case 3. In addition, an even dispersion of CO2 in the entire chamber could be expected.
Figure 10 is presented to show the total pressure during the combustion of the waste inside the incinerator. It can be seen that by increasing the mass flow rate of the cooling air from 0.07 to 0.21 kg/s, the pressure inside all chambers has been reduced. It means that the suction power is increased and the evacuation of the off-gases would be much faster than previously.
Another important characteristic of a combustion process is the temperature. As it is depicted in Figure 11, more cooling air results in reducing the total temperature inside the chambers. Furthermore, by comparing the above-mentioned cases, it can be observed that the hot spots reduced from case 1 to case 3. In addition, the temperature has a smooth distribution by increasing the cooling air. It means that a dilution happened inside the incinerator.
For a full investigation of the flow field inside an incinerator, it is essential to study the velocity fields, vectors and contours. As it is shown in Figure 12, the velocity magnitude near the exhaust port and inside the second chamber has been increased from case 1 to case 3. It means that the suction process creates more negative pressure and helps to evacuate the off-gases faster from the incinerator system. Moreover, the contours of velocity vectors from case 1 to case 3 illustrate that the suction process causes an amplitude in the velocity vectors near the outlet zone and consequently a better evacuation of off-gases from the secondary chamber has been achieved.

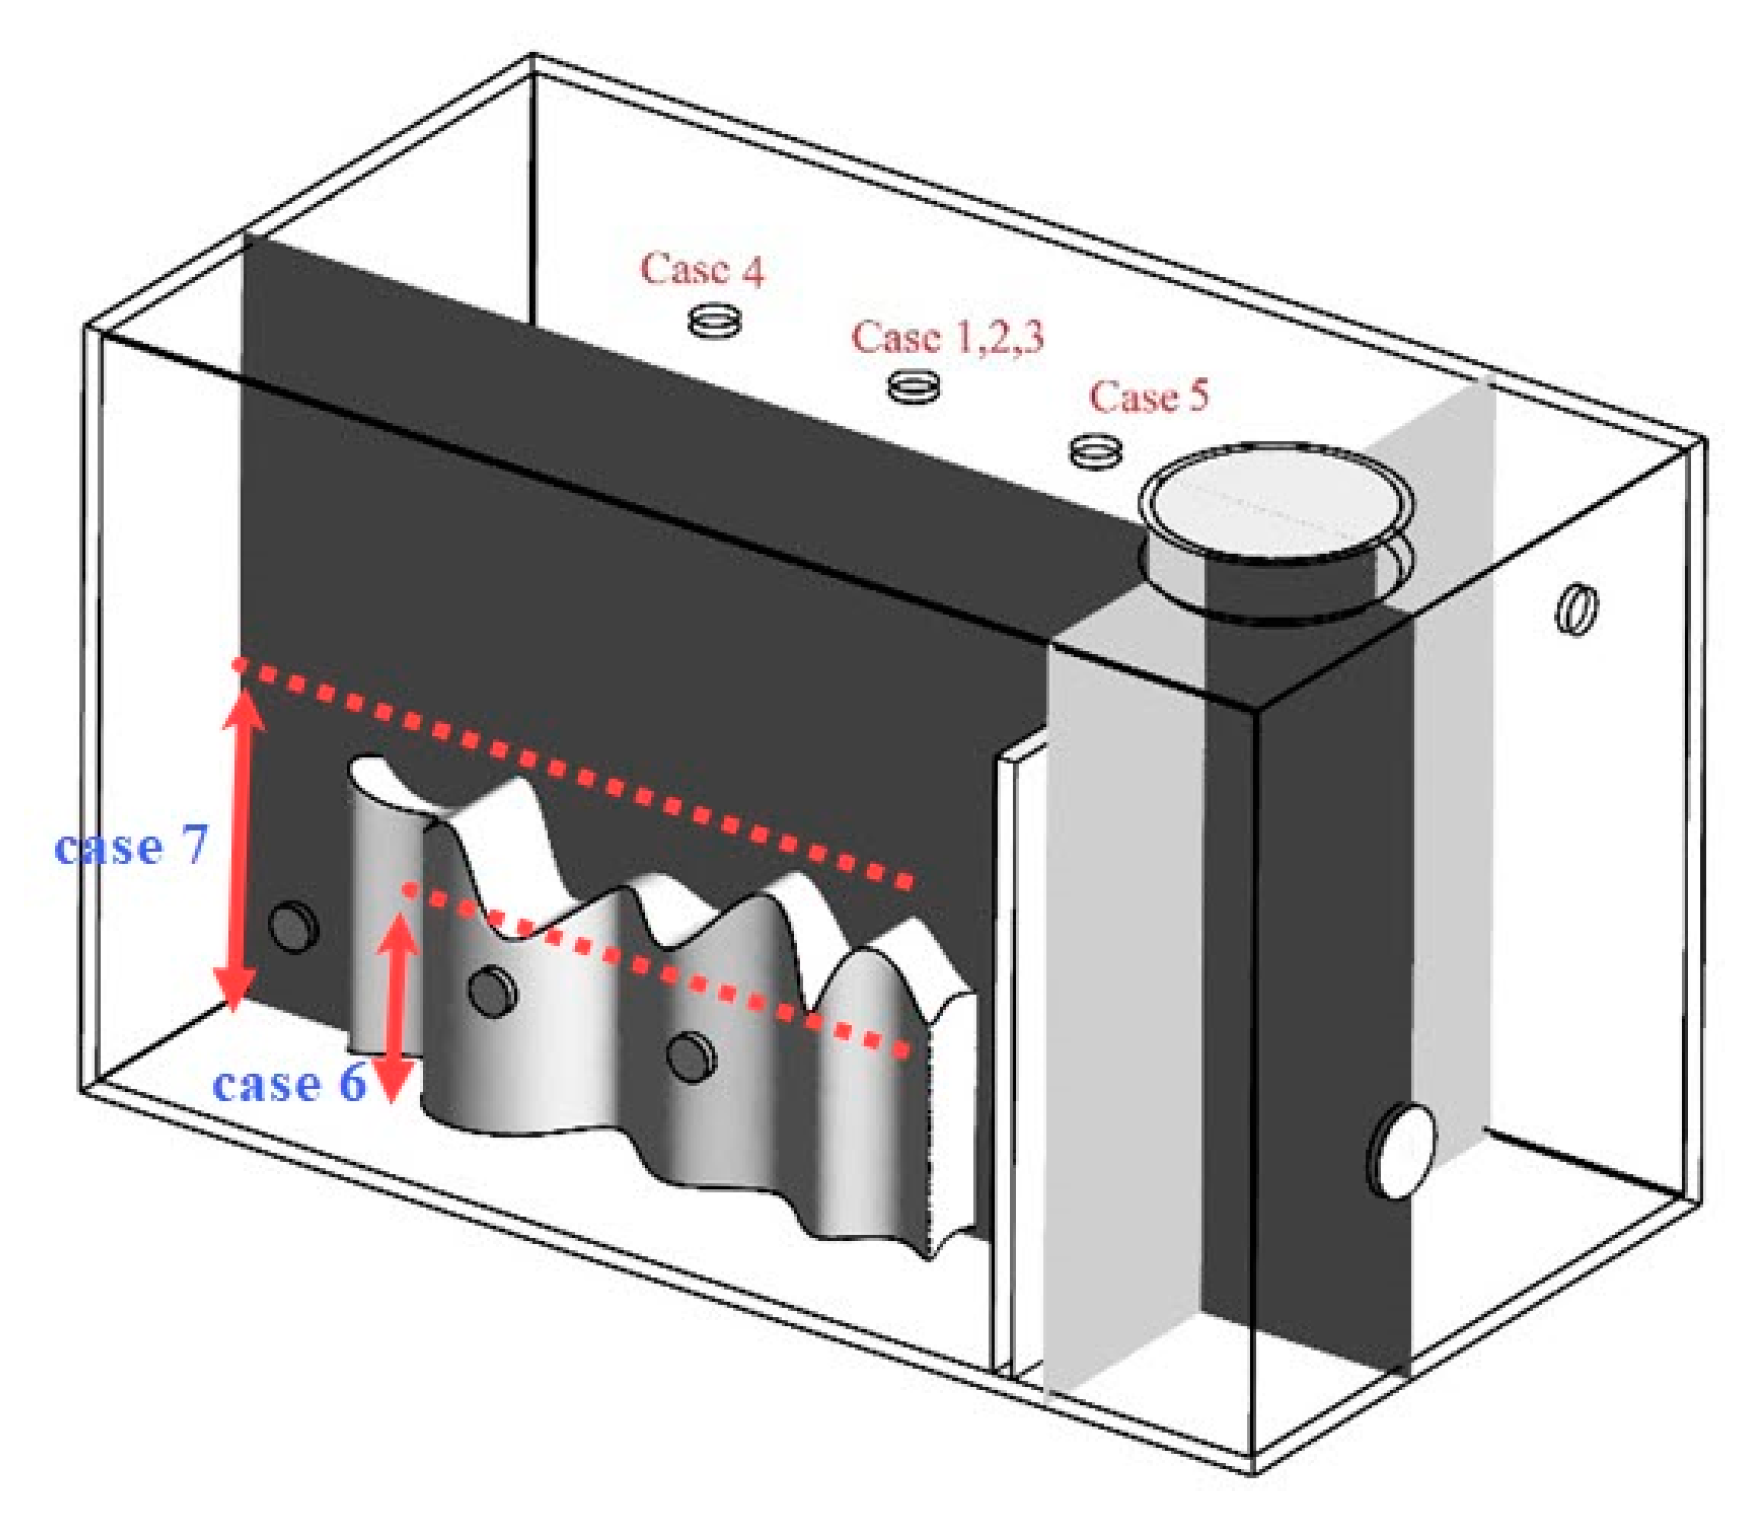
5.2. Effects of Primary Burner Position

The primary burner has the main responsibility of burning most of the waste volume. Hence, it is quite essential to be exact and in place to reduce the volume of the waste and produce the most energy and heat from the waste. In this part, the fluid dynamics of the place of the primary burner are in focus. Two cases have been prepared. For the previous case, the place of the primary burner was 1500 mm from the main fresh air inlet. In this section, the minimum and the maximum place for the installation of this burner from the main air inlet are considered to be 1000 and 2000 mm, respectively. Besides, other parameters have been kept constant, according to the summary presented in Table 6.
Figure 13 shows the differences between the total pressure inside the incinerator when the burner is in 1000 mm and 2000 mm from the main air inlet. It is clearly presented that by increasing the distance from the main air inlet, the pressure has been decreased. This phenomenon is due to producing the most heat and flow right near the secondary chamber and under the exhaust port. So, the incinerator could evacuate the off-gases faster and more efficiently.
In Figure 14, it is attempted to show the temperature contours for the position of the primary burner. As can be seen from the temperature contours, for case 5, the burner is so close to the wall that it separates the primary and the secondary chamber. Being adjacent to this wall results in an uneven temperature distribution in the primary chamber and the creation of hot spots in the secondary one. Likewise, the burner at the position of 2000 mm is very far from the waste volume and is unable to provide enough heat for them.
For the velocity field presented in Figure 15, the same principles are still valid in the same way for the temperature and the pressure. The closer the burner is to the exhaust port, the more velocity magnitude can be observed at the vicinity of the boundary of the primary and secondary chamber. This will result in the evacuation of more heat rather than off-gases.

5.3. Effects of Rubbish Height

The other important parameter to be studied in this research is the waste volume’s effect on the incinerator operation condition. Such evaluation is done by changing the waste height of the rubbish inserted to the incinerator. In order to study these effects, it is crucial to keep other parameters constant. A summary of the compared conditions in this part is reported in Table 7.
In Figure 16, it is attempted to show the pressure contours inside the incinerator versus variations in waste volume. As it can be observed, the pressure is not that affected by the waste volume changes. It means that such an incinerator is able to provide a reliable pressure range inside the chambers due to an efficient installed ejector system in the exhaust port to regulate this pressure.
The temperature contours for two samples of the waste volume are presented in Figure 17. From these contours, it is observed that by increasing the height of the waste, the hot spots are reduced drastically. In addition, the total temperature inside the primary combustion chamber has been reduced; it means that less heat can be provided for the lower parts of the waste.

5.4. Comparison of All Cases by Oxygen Concentration

For a complete comparison of the previously mentioned cases, the oxygen concentration inside the incinerator chamber is selected. Such a selection is made for more detailed investigation of the all-chemical involved reactions. On the other hand, for safety and according to the environmental regulations, the oxygen concentration at the exhaust of the incinerators must be around 3–5% [35]. Consequently, to have a good combustion system, keen attention must be devoted to the oxygen concentration. The oxygen data extraction is done on a line at Y = 1.09 m, which starts from the center of the main air inlet and passes directly along with the incinerator to the end of it. For the sake of clarity, this line is visualized in Figure 18.
Figure 19 shows the effects of the cooling air mass flow rate on the mass fraction of oxygen inside the considered incinerator. The plotted lines show that by increasing the mass flow of the cooling air up to 0.14 kg/s, the same trend follows for the oxygen concentration. On the other hand, when the mass flow of oxygen is increased to an amount of more than 0.14 kg/s the trend does not follow as it did previously. As the oxygen for the mass flow of 0.21 kg/s is high enough, it starts to be consumed immediately. Simultaneously, other air inlets on both sides of the incinerator increase the oxygen content, which can be observed in the middle of incinerator (X = 1.5). Consequently, due to the high airflow rate, the velocity of oxygen has been increased, and all of the injected oxygen is consumed at the primary chamber, and not enough oxygen exists at the secondary chamber. Lack of oxygen at this chamber could be a reason that more pollutants are produced when continuously working with this condition.
Figure 20 shows the effects of the primary burner position on the oxygen concentration inside the portable incinerator. As it is depicted by the plotted lines, the oxygen is injected from the main air inlet, and by reaching the burner position, it starts to be consumed. In this way, it can be seen that by increasing the primary burner distance from the main air inlet, more oxygen can be introduced to the system, but this oxygen behind the secondary chamber is suddenly consumed. This could lead to an unbalanced oxygen concentration inside the chamber and consequently, uneven heat release from the primary burner. In addition, the peak points right after X = 2 m correspond to the oxygen concentrations in the secondary combustion chamber.
Figure 21 shows the effect of the waste volume on the oxygen concentration inside the primary and secondary chambers. For all of the rubbish volumes as the cooling air mass flow rate is kept constant, the same trends could be expected. On the other hand, as the rubbish with a height of 700 mm is the minimum loading of the wastes, the total amount of oxygen would be higher compared to other rubbish heights. This means that the oxygen would react in a faster way and keep some unused oxygen in the primary chamber. Again, similar behavior for the second chamber could be expected in the same way as the primary chamber. Moreover, comparing all the results, whether in terms of temperature or other main factors including pressure and oxygen mass fraction, shows that the optimum place of the primary burner at the ceiling of the primary chamber is found to be 1500 mm from the main air inlet.

6. Conclusions

In this numerical work, an investigation is done through CFD for a portable incinerator. The waste inside the considered incinerator is selected according to Iranian waste compositions. A parametric study has been proposed for the most involved factors for the design of such an incinerator. Accordingly, the following remarks can be concluded:
  • By introducing the higher mass flow rate of the cooling air, the hot spots inside the combustion chamber reduced, and an even temperature distribution has been achieved.
  • By introducing the higher mass flow rate of the cooling air, not only the air velocities inside the combustion chambers have been improved, but also the negative pressure, which helps the evacuation of hazardous gases, decreased drastically.
  • By increasing the rubbish volume, the incinerator is still able to burn the waste but this burning would face some limitations, which could affect the fluid dynamics parameters of the incinerator.
  • According to the investigations, the optimum place of the primary burner at the ceiling of the primary chamber is found to be 1500 mm from the main air inlet.
  • By increasing the burner distance from the main air inlet, all thermo-chemical parameters of the incinerator are affected.
The worst case of the primary burner could be the closest one to the secondary chamber. In this case, there would be a high risk of unburned wastes in the main chamber as well as high-temperature concentrations near the boundary of these two chambers, which could damage the separation wall between the two chambers.

Author Contributions

M.S.P. performed the research, calculated all data, analyzed the data, and mainly wrote the paper. A.H.-F. suggested the structure of the research, edited, revised, and partially wrote the paper. B.F. is the principal supervisor of the research, suggested the main idea of the research, and numerical analysis has been performed under her supervision. All authors have read and agreed to the published version of the manuscript.

Funding

This research was funded by the National Elites Foundation of Iran for supporting the young researchers through the Postdoctoral research grant issued for Mohsen Saffari Pour.

Acknowledgments

The authors would like to express their gratitude to the National Elites Foundation of Iran for preparing the Postdoctoral research grant for Mohsen Saffari Pour. The authors are also very thankful for the Sharif University of Technology (SUT) staff, more specifically the Faculty of Mechanical Engineering for creating supportive equipment and cooperative atmosphere to fulfill this research.

Conflicts of Interest

The authors declare that they have no conflict of interest.

Nomenclature

Notations
A p Particle surface area[ m 2 ]
c p Specific heat capacity of particle[ J k g   K ]
E e x Volumetric heat sources[ w m 3 ]
e f Total internal energy[ J k g ]
F D Inverse of relaxation time[ 1 / s ]
F e x Other forces per unit mass of particle[ m / s 2 ]
F e x t Other forces per unit volume of gas[ k g m 2 s 2 ]
gGravity[ m / s 2 ]
h Convective coefficient[ w m 2 K ]
h ˜ Favre-Averaged enthalpy[ J k g ]
J i Diffusive flux of species[ k g m 2 s ]
k Thermal conductivity[ w m   K ]
m p Mass of particle[ k g ]
P Pressure[ k g m   s 2 ]
P ¯ Reynolds-Averaged pressure[ k g m   s 2 ]
P r Prandtl number[ ]
R i Net production rate of species[ k g m 3 s ]
S i Additional created source rate of species[ k g m 3 s ]
S h Other volumetric heat sources[ w m 3 ]
T f Temperature of gas mixture[°C]
T p Temperature of particle[°C]
T Temperature far from surface of particle[°C]
U f Gas mixture velocity[ m s ]
u ˜ i Favre-Averaged gas mixture velocity[ m s ]
u f Fluid flow velocity[ m s ]
u f Gas mixture velocity fluctuations[ m s ]
u p Particle velocity[ m s ]
Y i Local mass fraction of each species[ ]
Y ˜ k Favre-Averaged mass fraction of species[ ]
Greek symbols
ε p Particle emissivity[ ]
μ f Dynamic gas viscosity [ k g m s ]
ρ ¯ Reynolds-Averaged density of species [ k g m 3 ]
ρ i Density of species i [ k g m 3 ]
ρ f Density of gas mixture [ k g m 3 ]
ρ p Density of particle [ k g m 3 ]
σ Stefan-Boltzmann constant[ w m 2 K 4 ]
τ ¯ i j Viscous diffusion tensor[ k g m 2 s 2 ]
ω ˙ ¯ k Net production rate of species[ k g m 3 s ]
Subscripts
fGas
pParticle
Abbreviations
CFDComputational fluid dynamics
NGNatural Gas
DODiscrete ordinate
LHVLower heating value
MSWMunicipal solid waste

References

  1. Energy Recovery—Basic Information; US EPA: Washington, DC, USA, 2016. Available online: https://archive.epa.gov/epawaste/nonhaz/municipal/web/html/index-11.html (accessed on 23 July 2020).
  2. Stephenson, J.W. Some Recent Developments in Disposal of Solid Wastes by High Temperature Incineration, Pyrolysis, and Fluid Bed Reactor; New York State Action for Clean Air Committee: Schenectady, NY, USA, 7 May 1971. [Google Scholar]
  3. Knox, A. An overview of incineration and EFW technology as applied to the management of municipal solid waste (MSW). ONEIA Energy Subcommitte 2005. Available online: https://web.archive.org/web/20081205164320/http://www.oneia.ca/files/EFW%20-%20Knox.pdf (accessed on 23 July 2020).
  4. Herbert, L. Centenary History of Waste and Waste Managers in London and South East England. Chart. Inst. Wastes Manag. 2007. Available online: https://www.ciwm.co.uk/Custom/BSIDocumentSelector/Pages/DocumentViewer.aspx?id=QoR7FzWBtitMKLGdXnS8mUgJfkM0vi6KMAYwUqgqau3ztZeoed%252bsdmKIqDzPOm8yAXgBZR%252fn1fYhL%252bTNdjUq9g2xwY63C2g8GcAQQyfpf3SImIrrED%252bTfsUM91bKsogr (accessed on 23 July 2020).
  5. Lapčík, V.; Lapčíková, M. Possibilities of Energy Recovery from Municipal Waste, Možnosti Energetického Využití Komunálního Odpadu. GeoSci. Eng. 2012, 58, 49–58. (In Czech) [Google Scholar]
  6. Directive of the European Parliament and of the Council (EC) 76/2000; on Incineration of Waste; European Parliament, Council of the European Union: Brussels, Belgium, 2000.
  7. Directive of the European Parliament and of the Council (EU) 75/2010; on Industrial Emissions; European Parliament, Council of the European Union: Brussels, Belgium, 2010.
  8. Directive of the European Parliament and of the Council (EC) 98/2008; on Waste; European Parliament, Council of the European Union: Brussels, Belgium, 2008.
  9. Kavian, S.; Saffari Pour, M.; Hakkaki-Fard, A. Optimized Design of the District Heating System by Considering the Techno-Economic Aspects and Future Weather Projection. Energies 2019, 12, 1733. [Google Scholar] [CrossRef] [Green Version]
  10. The EPA-ORD Mobile Incineration System. In Proceedings of the 1982 National Waste Processing Conference; ASME: New York, NY, USA, 1982; pp. 199–212.
  11. Zeraatpisheh, M.; Arababadi, R.; Saffari Pour, M. Economic Analysis for Residential Solar PV Systems Based on Different Demand Charge Tariffs. Energies 2018, 11, 3271. [Google Scholar] [CrossRef] [Green Version]
  12. Leskens, M.; van Kessel, L.B.M.; Bosgra, O.H. Model predictive control as a tool for improving the process operation of MSW combustion plants. Waste Manag. 2005, 25, 788–798. [Google Scholar] [CrossRef]
  13. Asthana, A.; Menard, Y.; Sessiecq, P.; Patisson, F. Modeling On-Grate MSW Incineration with Experimental Validation in a Batch Incinerator. Ind. Eng. Chem. Res. 2010, 49, 7597–7604. [Google Scholar] [CrossRef] [Green Version]
  14. Pershing, D.W.; Lighty, J.S.; Silcox, G.D.; Heap, M.P.; Owens, W.D. Solid waste incineration in rotary kilns. Comb. Sci. Technol. 2007, 93, 245–276. [Google Scholar] [CrossRef]
  15. Goh, Y.R.; Yang, Y.B.; Zakaria, R.; Siddall, R.G.; Nasserzadeh, V.; Swithenbank, J. Development of an incinerator bed model for municipal solid waste incineration. Combust. Sci. Technol. 2000, 162, 37–58. [Google Scholar] [CrossRef]
  16. Goh, Y.R.; Siddall, R.G.; Nasserzadeh, V.; Zakaria, R.; Swithenbank, J.; Lawrence, D.; Garrod, N.; Jones, B. Mathematical modelling of the burning bed of a waste incinerator. J. Inst. Energy 1998, 71, 110–118. [Google Scholar]
  17. Shin, D.; Choi, S. The combustion of simulated waste particles in a fixed bed. Combust. Flame 2000, 121, 167–180. [Google Scholar] [CrossRef]
  18. Shin, D.; Ryu, C.K.; Choi, S. Computational fluid dynamics evaluation of good combustion performance in waste incinerators. J. Air Waste Manag. Assoc. 1998, 48, 345–351. [Google Scholar] [CrossRef]
  19. Wissing, F.; Wirtz, S.; Scherer, V. Simulating municipal solid waste incineration with a DEM/CFD method–influences of waste properties, grate and furnace design. Fuel 2017, 206, 638–656. [Google Scholar] [CrossRef]
  20. Ryu, C.; Shin, D.; Choi, S. Combined simulation of combustion and gas flow in a grate-type incinerator. J. Air Waste Manag. Assoc. 2002, 52, 189–197. [Google Scholar] [CrossRef] [PubMed] [Green Version]
  21. Ryu, C.; Yang, Y.B.; Nasserzadeh, V.; Swithenbank, J. Thermal reaction modeling of a large municipal solid waste incinerator. Combust. Sci. Technol. 2004, 176, 1891–1907. [Google Scholar] [CrossRef]
  22. Lai, A.C.H.; Law, A.W.-K. Numerical modeling of municipal waste bed incineration. Int. J. Numer. Methods Heat Fluid Flow 2019, 29, 504–522. [Google Scholar] [CrossRef]
  23. National Research Council. Waste Incineration and Public Health; The National Academies Press: Washington, DC, USA, 2000. [Google Scholar]
  24. Chen, D.-M.; Ran, J.-Y.; Niu, J.-T.; Yang, Z.; Pu, G.; Yang, L. Numerical Study on Separation Performance of Cyclone Flue Used in Grate Waste Incinerator. Processes 2019, 7, 866. [Google Scholar] [CrossRef] [Green Version]
  25. Ali, R.A.; Ibrahim, N.N.L.N.; Lam, H.L. Conversion Technologies: Evaluation of Economic Performance and Environmental Impact Analysis for Municipal Solid Waste in Malaysia. Processes 2019, 7, 752. [Google Scholar] [CrossRef] [Green Version]
  26. Wei, G.; Liu, H.; Liu, F.; Zeng, T.; Liu, G.; Zhou, J. Experimental Investigation of the Decarburization Behavior of Medical Waste Incinerator Fly Ash (MWIFA). Processes 2018, 6, 186. [Google Scholar] [CrossRef] [Green Version]
  27. Liu, F.; Liu, H.-Q.; Wei, G.-X.; Zhang, R.; Zeng, T.-T.; Liu, G.-S.; Zhou, J.-H. Characteristics and Treatment Methods of Medical Waste Incinerator Fly Ash: A Review. Processes 2018, 6, 173. [Google Scholar] [CrossRef] [Green Version]
  28. ANSYS Workbench Theory Guide. Available online: http://www.ansys.com (accessed on 23 April 2019).
  29. Khodabandeh, E.; Pourramezan, M.; Pakravan, M.H. Effects of excess air and preheating on the flow pattern and efficiency of the radiative section of a fired heater. Appl. Therm. Eng. 2016, 105, 537–548. [Google Scholar] [CrossRef]
  30. Frey, H.H.; Peters, B.; Hunsinger, H.; Vehlow, J. Characterization of municipal solid waste combustion in a grate furnace. Waste Manag. 2003, 23, 689–701. [Google Scholar] [CrossRef]
  31. Orsino, S.; Weber, R.; Bollettini, U. Numerical Simulation of Combustion of Natural Gas with High-Temperature Air. Combust. Sci. Technol. 2001, 170, 1–34. [Google Scholar] [CrossRef]
  32. Saffari Pour, M. Producer Gas Implementation in Steel Reheating Furnaces from Lab to Industrial Scale: A Computational Fluid Dynamics and Thermodynamics Approach. Ph.D. Thesis, KTH Royal Institute of Technology, Stockholm, Sweden, 2016. [Google Scholar]
  33. Hautman, A.N.; Dryer, F.L.; Schlug, K.P.; Glassman, I. A multiple step overall kinetic mechanism for the oxidation of hydrocarbons. Combust. Sci. Technol. 1981, 25, 219. [Google Scholar] [CrossRef]
  34. Frassoldati, A.; Sharma, P.; Cuoci, A.; Faravelli, T.; Ranzi, E. Kinetic and fluid dynamics modeling of methane/hydrogen jet flames in diluted coflow. Appl. Therm. Eng. 2010, 30, 376–383. [Google Scholar] [CrossRef] [Green Version]
  35. Ho, M.D.; Perdek, J.M.; Stumbar, J.P.; Sawyer, R.H. Field Demonstration of the Linde Oxygen Combustion System on the EPA Mobile Incinerator. J. Air Waste Manag. Assoc. 1992, 42, 493–499. [Google Scholar] [CrossRef] [Green Version]
Figure 1. A schematic 3D view of the considered portable incinerator.
Processes 08 00923 g001
Figure 2. Side view of the portable incinerator.
Processes 08 00923 g002
Figure 3. The created computational domain for doing combustion simulation of the portable incinerator (all values are in mm—A: Gas exhaust, B: Burner inlet in primary chamber, C: Fresh air inlet, D: Air inlet, E: Burner inlet in secondary chamber, F: fresh air inlet).
Processes 08 00923 g003
Figure 4. (a) The created mesh domain for the portable incinerator; (b) The cut plane from the above of rubbish height in (X–Z) direction to show the volume meshes; (c) The cut plane in (X–Y) direction to show the involved volume meshes in the computational domain.
Processes 08 00923 g004
Figure 5. A validation for 3 different mesh element numbers with temperature variation along the incinerator length.
Processes 08 00923 g005
Figure 6. Oxygen concentration along the centerline of the primary burner of the incinerator compared with Reference [34].
Processes 08 00923 g006
Figure 7. The place of cut plane for the computational contours.
Processes 08 00923 g007
Figure 8. Mass fraction of carbon monoxide (CO) for different mass flow rates of the cooling air.
Processes 08 00923 g008
Figure 9. Mass fraction of CO2 for different mass flow rates of the cooling air.
Processes 08 00923 g009
Figure 10. Total pressure inside the primary and secondary chambers of the incinerator (kPa).
Processes 08 00923 g010
Figure 11. Temperature contours inside the primary and secondary chambers of the incinerator (K).
Processes 08 00923 g011
Figure 12. Velocity contours inside the primary and secondary chambers of the incinerator (m/s).
Processes 08 00923 g012
Figure 13. Total pressure inside the incinerator for the place of installation of the primary burner (kPa).
Processes 08 00923 g013
Figure 14. Temperature contours inside the incinerator for the place of installation of the primary burner (K).
Processes 08 00923 g014
Figure 15. Velocity contours inside the incinerator for the place of installation of the primary burner (m/s).
Processes 08 00923 g015
Figure 16. Total pressure inside the incinerator for the variations in waste volume (kPa).
Processes 08 00923 g016
Figure 17. Temperature contours inside the incinerator for the variation of waste volume (K).
Processes 08 00923 g017
Figure 18. The place of the line at Y = 1.09 m for the numerical data extraction.
Processes 08 00923 g018
Figure 19. Mass fraction of oxygen on the line at Y = 1.09 m with the rubbish height = 700 mm and the primary burner position = 1500 mm.
Processes 08 00923 g019
Figure 20. Mass fraction of oxygen on the line at Y = 1.09 m with the rubbish height = 700 mm and the cooling air with the mass flow rate = 0.07 kg/s.
Processes 08 00923 g020
Figure 21. Mass fraction of oxygen on the line at Y = 1.09 m with the primary burner position = 1500 mm and the cooling air with the mass flow rate = 0.07 kg/s.
Processes 08 00923 g021
Table 1. Normalized Iranian waste properties. All numbers are reported as their lower heating values (LHV).
Solid MaterialsMJ/kg
Car tire37
Food waste4.2
Glass fiber-reinforced polyester (GRP)15
Leather18.9
Newspaper18.6
Paraffin wax42
Sawdust19
PlasticsMJ/kg
Acrylonitrile butadiene styrene (ABS)39
Cellulose16
Nylon, polyamide (PA)28
Polyester (PET), textiles, bottles23
Polyethylene (PE)46
Polypropylene (PP)43
Polystyrene (PS)46
Polyurethane (PU)36
Polyvinyl chloride (PVC)18.9
LiquidMJ/kg
Acetic acid15.8
Acetone22.4
Kerosene/Paraffin34.8
White spirit34.8
Table 2. Governing equations and the chemical reactions related to the solid combustion [29,30,31], reproduced with permission from M. Saffari Pour, Producer Gas Implementation in Steel Reheating Furnaces from Lab to Industrial Scale: A Computational Fluid Dynamics and Thermodynamics Approach, Doctoral Thesis, 2016 [32].
Equations NameMaterial PhaseGoverning Equations
Continuity
(Mass balance)
SolidDevolatilization and char burnout
Fluid t ( ρ i Y i ) + ( ρ i U f Y i ) = J i + R i + S i (EDC model)
MomentumSolid d u p d t = F D ( u f u p ) + g ( ρ p ρ f ) ρ p + F e x
Fluid t ( ρ f U f ) + ( ρ f U f U f ) = P + μ f 2 U f u f u f + F e x t
EnergySolid m p c p d T p d t = h A p ( T T p ) + ε p A p σ ( T f 4 T p 4 )
Fluid t ( ρ f e f ) + ( ρ f U f e f ) = ( k T ) + E e x
Table 3. Governing equations [30,31] and the chemical reactions [33] related to the gas combustion, reproduced with permission from M. Saffari Pour, Producer Gas Implementation in Steel Reheating Furnaces from Lab to Industrial Scale: A Computational Fluid Dynamics and Thermodynamics Approach, Doctoral Thesis, 2016 [32].
Equations NameMaterial PhaseGoverning Equations
Continuity
(Mass balance)
Gas Mixture x i ( ρ ¯ u ˜ i Y ˜ k ) = x i ( μ Y ˜ k x i ρ ¯ u i Y k ¯ ) + ω ˙ ¯ k k = 1 , 2 , 3 , , N
MomentumAsh Solid d u p d t = F D ( u f u p ) + g ( ρ p ρ f ) ρ p + F e x
Gas Mixture x i ( ρ ¯ u ˜ i u ˜ j ) = P ¯ x j + x i ( τ ¯ i j ρ ¯ u i u j ¯ ) + ρ ¯ g
EnergyGas Mixture x i ( ρ ¯ u ˜ i h ˜ ) = x i ( μ P r h ¯ x i ρ ¯ u i h ¯ ) + S h
Table 4. The governing boundary condition applied in this study.
LocationTypeValue
APressure gaugeP = 0 kPa
BBurnermass flow rate of air = 8 (kg/s)
mass flow rate of fuel = 5 (kg/s)
CAir inletV = 1.75 (m/s)
DAir inletV = 1.5 (m/s)
This value for all air inlets is the same.
EBurnermass flow rat of air = 6 (kg/s)
mass flow rate of fuel = 3 (kg/s)
FAir inletV = 3 (m/s)
Numbering is presented according to Figure 3.
Table 5. Different mass flow rate of the cooling air for the incinerator.
Case NumbersRubbish HeightBurner PositionMass Flow Rate
Case 1800 mm1500 mm0.07 kg/s
Case 2800 mm1500 mm0.14 kg/s
Case 3800 mm1500 mm0.21 kg/s
Table 6. Different places of the primary burner installation in the incinerator (Shown in Figure 13).
Case NumbersRubbish HeightBurner PositionMass Flow Rate
Case 4800 mm1000 mm0.07 kg/s
Case 1800 mm1500 mm0.07 kg/s
Case 5800 mm2000 mm0.07 kg/s
Table 7. Different rubbish heights inside the primary chamber of the incinerator.
Case NumbersRubbish HeightBurner PositionMass Flow Rate
Case 6700 mm1500 mm0.07 kg/s
Case 1800 mm1500 mm0.07 kg/s
Case 7900 mm1500 mm0.07 kg/s

