Structural and Thermal Characterization of Novel Organosolv Lignins from Wood and Herbaceous Sources

 ,
,  ,
, 
 , ,
, , 

Abstract
1. Introduction
2. Materials and Methods
2.1. Raw Materials
2.2. Organosolv Fractionation
2.3. Lignin Characterization
2.3.1. Elemental Analysis
2.3.2. Headspace Gas Chromatography-Mass Spectroscopy
2.3.3. Molecular Weight Determination of Lignin
2.3.4. FTIR Spectroscopy
2.3.5. Quantitative P NMR Analysis
2.3.6. Qualitative H-C HSQC Analysis
2.3.7. Thermogravimetric Analysis
3. Results and Discussion
3.1. Ultimate and Proximate Analysis
3.2. GPC Analysis
3.3. FTIR Analysis
3.4. P NMR and H-C HSQC Analysis
3.5. Headspace Gas Chromatography-Mass Spectrometry
3.6. Thermogravimetric Analysis
4. Discussion
5. Conclusions
Author Contributions
Funding
Acknowledgments
Conflicts of Interest
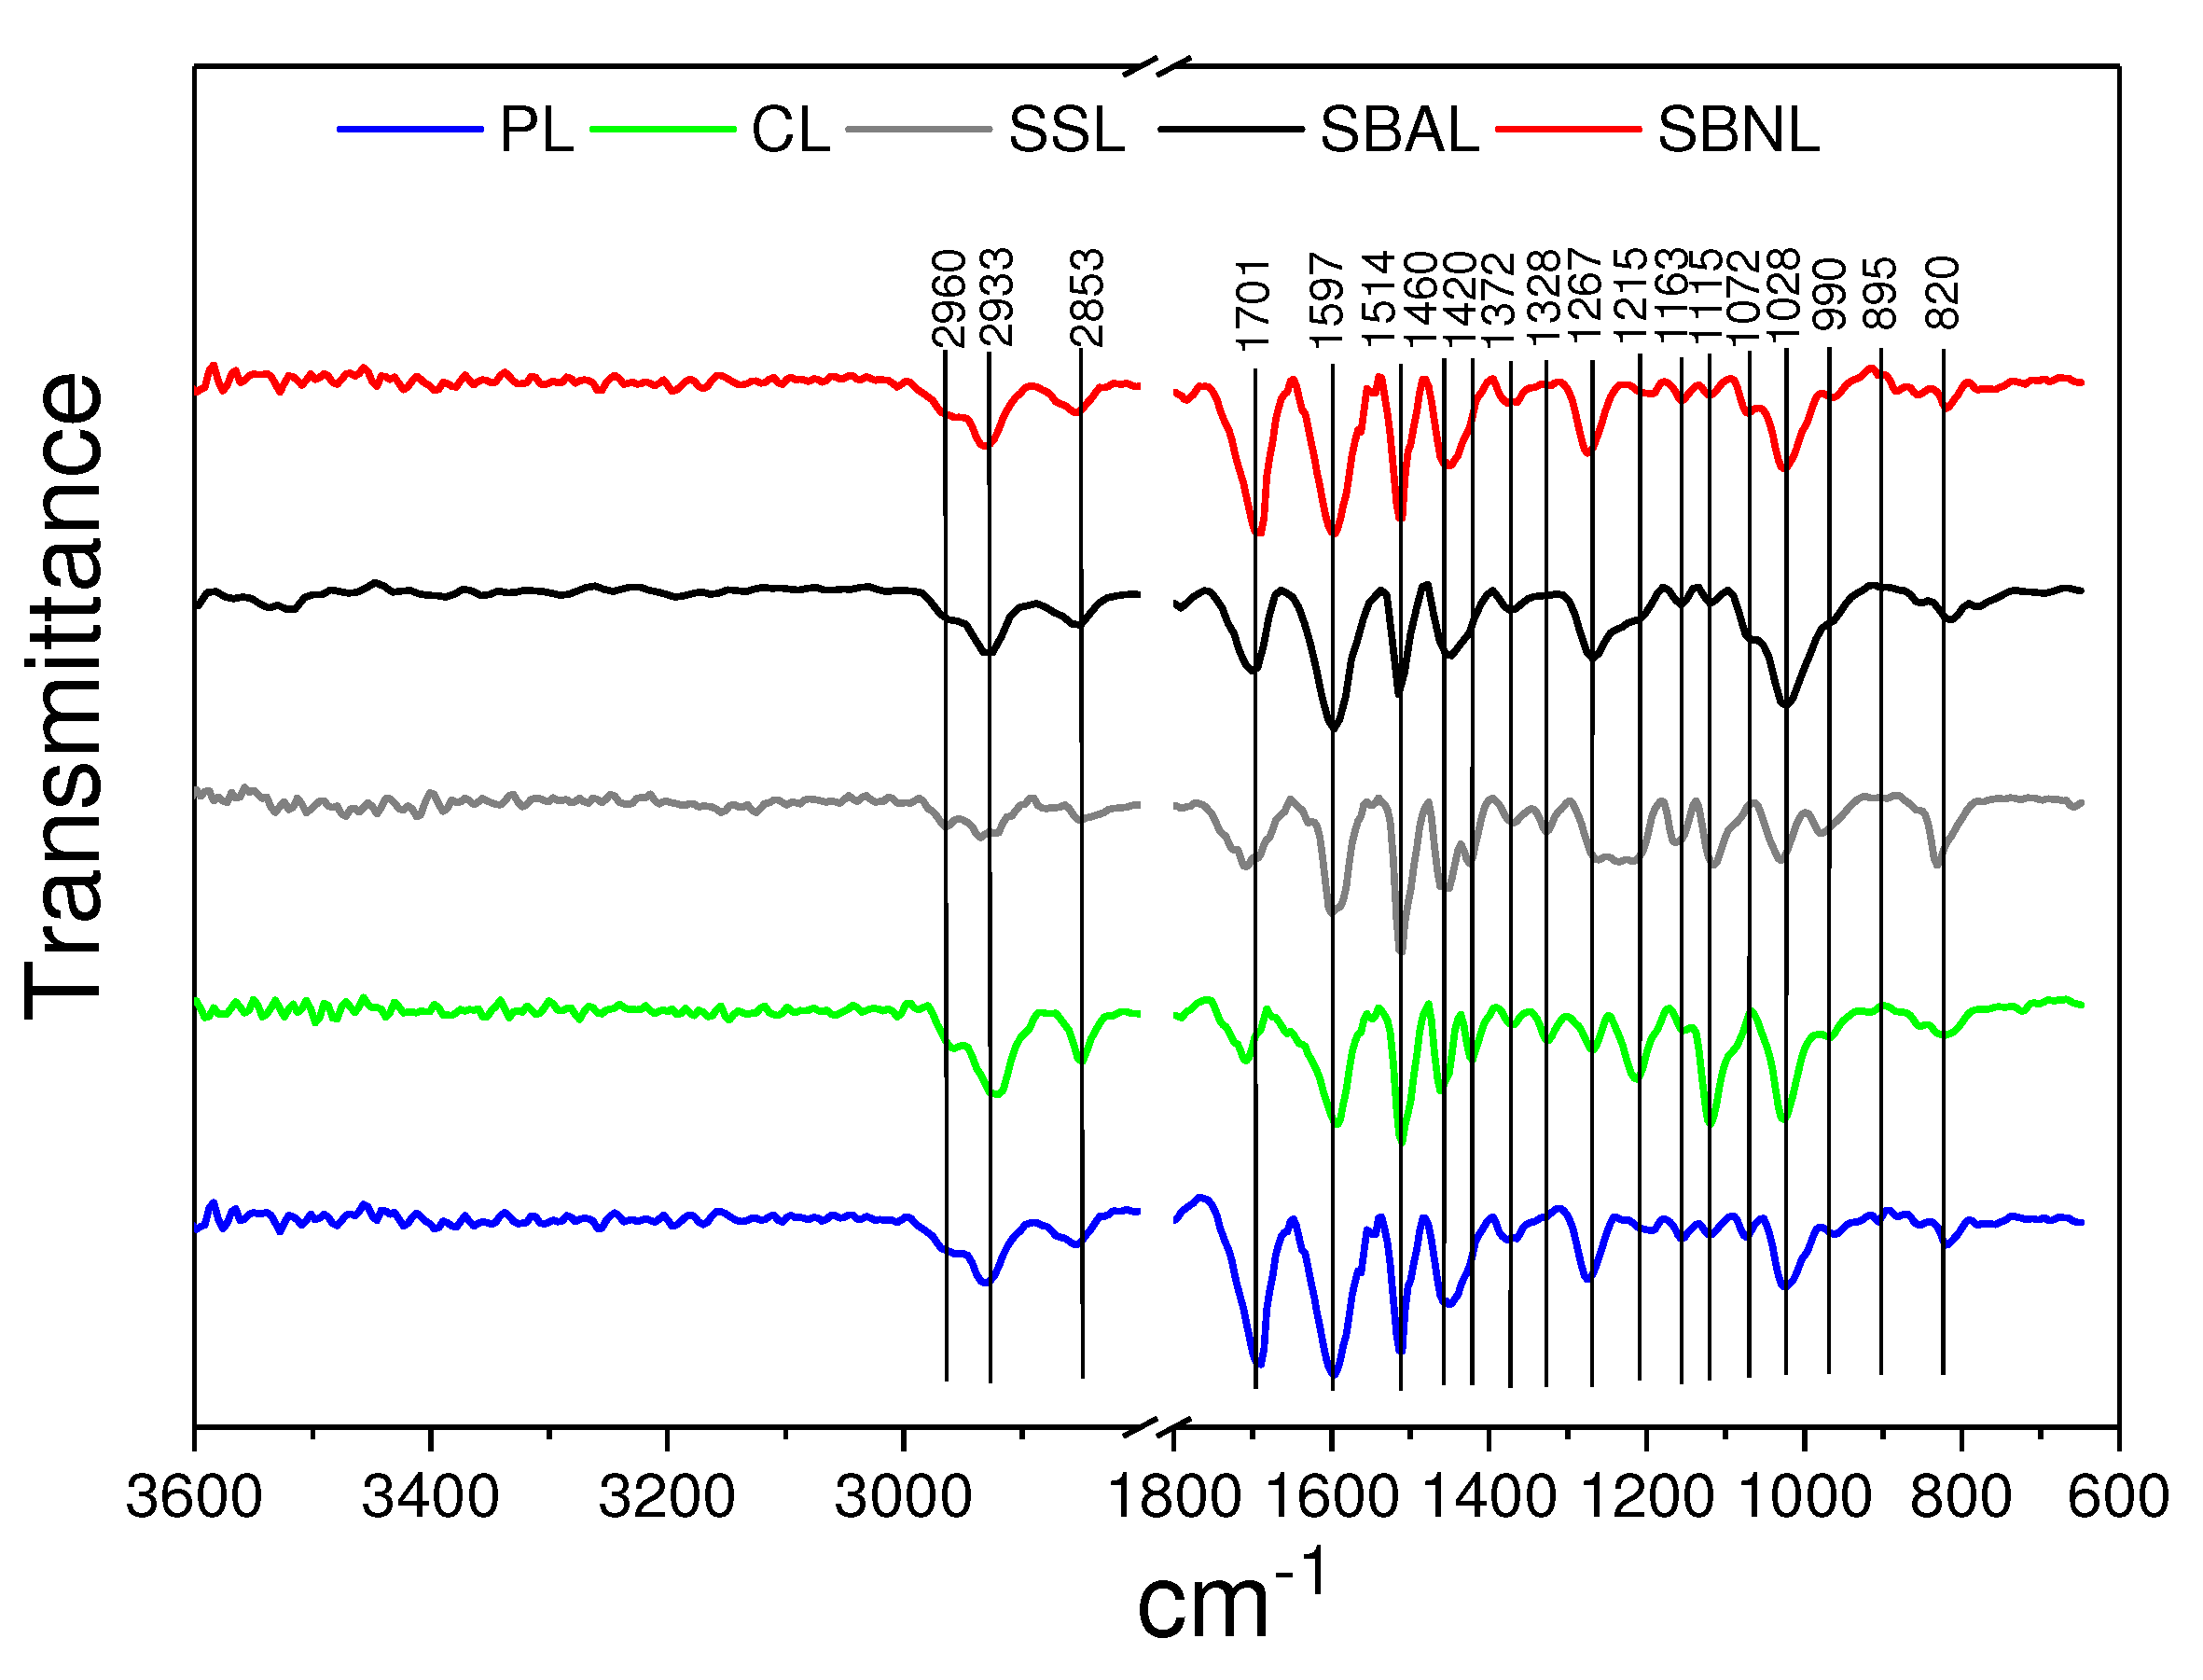
Appendix A. FTIR Analysis

| Band Position, cm | |||||
|---|---|---|---|---|---|
| SSL | CL | PL | SBNL | SBAL | Peak Assignment |
| 2960, 2933 | C-H stretch [64] | ||||
| 2953 | C-H stretching in CH and CH [64] | ||||
| 1701 | 1694 | C=O stretching, unconjugated [65] | |||
| 1597 | aromatic skeletal vibrations (S > G) [38] | ||||
| 1514 | aromatic skeletal vibrations (G > S) [65] | ||||
| 1460 | 1450 | C-H deformations in CH and CH [39] | |||
| 1420 | Aromatic skeletal vibrations [39] | ||||
| 1372 | C-H bending [66] | ||||
| 1328 | S ring breathing [39] | ||||
| 1267 | 1272 | G ring stretching [66] | |||
| 1215 | 1202 | C-C and C-O stretch [67] | |||
| 1163 | 1155 | C-O stretch in ester groups (HGS) [39] | |||
| 1115 | C-O stretch, -OCH (S) [68,69] | ||||
| 1072 | C-O stretching [70] | ||||
| 1028 | C-C, C-OH, C-H ring [39] | ||||
| 990 | HC=CH-out-of-plane deformation [45] | ||||
| CH-out-of-plane deformation in ethylenic double bonds [67] | |||||
| 828 | 820 | CH-out-of-plane in positions 2, 5, and 6 of G units [45] | |||
References
- Umeki, K.; Yamamoto, K.; Namioka, T.; Yoshikawa, K. High temperature steam-only gasification of woody biomass. Appl. Energy 2010, 87, 791–798. [Google Scholar] [CrossRef]
- Akin, D.E.; Benner, R. Degradation of polysaccharides and lignin by ruminal bacteria and fungi. Appl. Environ. Microbiol. 1988, 54, 1117–1125. [Google Scholar] [CrossRef] [PubMed]
- Dutta, T.; Papa, G.; Wang, E.; Sun, J.; Isern, N.G.; Cort, J.R. Characterization of Lignin Streams during Bionic Liquid-Based Pretreatment from Grass, Hardwood, and Softwood. ACS Sustain. Chem. Eng. 2018, 6, 3079–3090. [Google Scholar] [CrossRef]
- Doherty, W.O.S.; Mousavioun, P.; Fellows, C.M. Value-adding to cellulosic ethanol: Lignin polymers. Ind. Crops. Prod. 2011, 33, 259–276. [Google Scholar] [CrossRef]
- Alvira, P.; Tomas-Pejo, E.; Ballesteros, M.; Negro, M.J. Pretreatment technologies for an efficient bioethanol production process based on enzymatic hydrolysis: A review. Biores. Technol. 2010, 10, 4851–4861. [Google Scholar] [CrossRef]
- Trubetskaya, A.; Brown, A.; Tompsett, G.A.; Timko, M.T.; Kling, J.; Umeki, K. Characterization and reactivity of soot from fast pyrolysis of lignocellulosic compounds and monolignols. Appl. Energy 2018, 212, 1489–1500. [Google Scholar] [CrossRef]
- Kalogiannis, K.G.; Matsakas, L.; Aspden, J.; Lappas, A.A.; Rova, U.; Christakopoulos, P. Acid Assisted Organosolv Delignification of Beechwood and Pulp Conversion towards High Concentrated Cellulosic Ethanol via High Gravity Enzymatic Hydrolysis and Fermentation. Energies 2018, 23, 1647. [Google Scholar] [CrossRef]
- Zhao, X.; Cheng, K.; Liu, D. Organosolv pretreatment of lignocellulosic biomass for enzymatic hydrolysis. Appl. Microbiol. Biotech. 2009, 82, 815–827. [Google Scholar] [CrossRef] [PubMed]
- Matsakas, L.; Nitsos, C.; Raghavendran, V.; Yakimenko, O.; Persson, G.; Christakopoulos, P. A novel hybrid organosolv: Steam explosion method for the efficient fractionation and pretreatment of birch biomass. Biotech. Biofuels 2018, 11, 1–14. [Google Scholar]
- Zhang, J.; Tang, M.; Viikari, L. Xylans inhibit enzymatic hydrolysis of lignocellulosic materials by cellulases. Biores. Technol. 2012, 121, 8–12. [Google Scholar] [CrossRef]
- Kristensen, J.B.; Thygesen, L.G.; Felby, C.; Jorgensen, H.; Elder, T. Cell wall structural changes in wheat straw pretreated for bioethanol production. Biotech. Biofuels 2008, 1, 1–9. [Google Scholar]
- Sipponen, M.H.; Rahikainen, J.; Leskinen, T.; Pihlajaniemi, V.; Mattinen, M.L.; Lange, H. Structural changes of lignin in biorefinery pretreatments and consequences to enzyme-lignin interactions. Nordic. Pulp. Paper Res. J. 2018, 32, 550–571. [Google Scholar] [CrossRef]
- Kalogiannis, K.G.; Matsakas, L.; Lappas, A.A.; Rova, U.; Christakopoulos, P. Aromatics from Beechwood Organosolv Lignin through Thermal and Catalytic Pyrolysis. Energies 2019, 12, 1606. [Google Scholar] [CrossRef]
- Wyman, C.E.; Dale, B.E.; Elander, R.T.; Holtzapple, M.; Ladisch, M.R.; Lee, Y.Y. Coordinated development of leading biomass pretreatment technologies. Biores. Technol. 2005, 96, 1959–1966. [Google Scholar] [CrossRef] [PubMed]
- Constant, S.; Wienk, H.L.J.; Frissen, A.E.; de Peinder, P.; Boelens, R.; van Es, D. New insights into the structure and composition of technical lignins: A comparative characterisation study. Green Chem. 2016, 18, 2651–2665. [Google Scholar] [CrossRef]
- Nitsos, C.; Rova, U.; Christakopoulos, P. Organosolv Fractionation of Softwood Biomass for Biofuel and Biorefinery Applications. Energies 2018, 11, 1–23. [Google Scholar]
- Huber, G.W.; Iborra, S.; Corma, A. Synthesis of Transportation Fuels from Biomass: Chemistry, Catalysts, and Engineering. Energies 2006, 106, 4044–4098. [Google Scholar]
- Yang, H.; Yan, R.; Chen, H.; Lee, D.H.; Zheng, C. Characteristics of hemicellulose, cellulose and lignin pyrolysis. Fuel 2007, 86, 1781–1788. [Google Scholar] [CrossRef]
- Stefanidis, S.D.; Kalogiannis, K.G.; Iliopoulou, E.F.; Michailof, C.M.; Pilavachi, P.A.; Lappas, A.A. A study of lignocellulosic biomass pyrolysis via the pyrolysis of cellulose, hemicellulose and lignin. J. Anal. Appl. Pyrolysis. 2014, 105, 143–150. [Google Scholar] [CrossRef]
- Rinaldi, R.; Jastzebski, R.; Clough, M.T.; Ralph, J.; Kennema, M.; Bruijnincx, P.C.A. Paving the Way for Lignin Valorisation: Recent Advances in Bioengineering, Biorefining and Catalysis. Angew. Chem. 2016, 55, 8164–8215. [Google Scholar] [CrossRef]
- Karnaouri, A.; Lange, H.; Crestini, C.; Rova, U.; Christakopoulos, P. Chemoenzymatic Fractionation and Characterization of Pretreated Birch Outer Bark. ACS Sustain. Chem. Eng. 2016, 4, 5289–5302. [Google Scholar] [CrossRef]
- Lange, H.; Schiffels, P.; Sette, M.; Sevastyanova, O.; Crestini, C. Fractional Precipitation of Wheat Straw Organosolv Lignin: Macroscopic Properties and structural Insights. ACS Sustain. Chem. Eng. 2016, 4, 5136–5151. [Google Scholar] [CrossRef]
- Nitsos, C.; Stoklosa, R.; Lange, H.; Hodge, D.; Rova, U.; Christakopoulos, P. Isolation and Characterization of Organosolv and Alkaline Lignins from Hardwood and Softwood Biomass. ACS Sustain. Chem. Eng. 2016, 4, 5171–5193. [Google Scholar] [CrossRef]
- Matsakas, L.; Christakopoulos, P. Fermentation of liquefacted hydrothermally pretreated sweet sorghum bagasse to ethanol at high-solids content. Biores. Technol. 2013, 127, 202–208. [Google Scholar] [CrossRef]
- Kemppainen, K.; Siika-aho, M.; Pattathil, S.; Giovando, S.; Kruus, K. Spruce bark as an industrial source of condensed tannins and non-cellulosic sugars. Ind. Crops. Prod. 2014, 52, 158–168. [Google Scholar] [CrossRef]
- MS-SEARCH. NIST Mass Spectrometry Data Center: NIST/EPA/NIH Mass Spectral Database. Available online: http://chemdata.nist.gov (accessed on 1 January 2011).
- Mu, L.; Matsakas, L.; Wu, J.; Chen, M.; Rova, U.; Christakopoulos, P. Two important factors of selecting lignin as efficient lubricating additives in poly (ethylene glycol): Hydrogen bond and molecular weight. Int. J. Biol. Macromol. 2019, 129, 564–570. [Google Scholar] [CrossRef] [PubMed]
- Asikkala, J.; Tamminen, T.; Argyropoulos, D.S. Accurate and Reproducible Determination of Lignin Molar Mass by Acetobromination. J. Agric. Food Chem. 2012, 60, 8968–8973. [Google Scholar] [CrossRef]
- Meng, X.; Crestini, C.; Ben, H.; Hao, N.; Pu, Y.; Ragauskas, A.J. Determination of hydroxyl groups in biorefinery resources via quantitative 31P NMR spectroscopy. Nat. Protoc. 2019, 14, 2627–2647. [Google Scholar] [CrossRef] [PubMed]
- Gordobil, O.; Moriana, R.; Zhang, L.; Labidi, J.; Sevastyanova, O. Assessment of technical lignins for uses in biofuels and biomaterials: Structure-related properties, proximate analysis and chemical modification. Ind. Crops. Prod. 2014, 83, 155–165. [Google Scholar] [CrossRef]
- Guo, H.; Zhang, B.; Qi, Z.; Li, C.; Ji, J.; Dai, T. Valorization of Lignin to Simple Phenolic Compounds over Tungsten Carbide: Impact of Lignin Structure. ChemSusChem 2016, 10, 523–532. [Google Scholar] [CrossRef]
- Nadji, H.; Diouf, P.N.; Benaboura, A.; Bedard, Y.; Riedl, B.; Stevanovic, T. Comparative Study of Lignin Isolated from Alfa grass (Stipa Tenacissima L.). Biores Tech 2009, 100, 3585–3592. [Google Scholar] [CrossRef]
- Sluiter, A.; Hames, B.; Ruiz, R.; Scarlata, C.; Sluiter, J.; Templeton, D. Determination of Structural Carbohydrates and Lignin in Biomass. Golden (CO); Report No. NREL/TP-510-42618. Contract No.; DE-AC36-08-GO28308; National Renewable Energy LAboratory: Golden, CO, USA, 2011. [Google Scholar]
- Thring, R.W.; Vanderlaan, M.N.; Griffin, S.L. Fractionation of ALCELL lignin by sequential solvent extraction. J. Wood Chem. Technol. 1996, 16, 139–154. [Google Scholar] [CrossRef]
- Brodin, I.; Sjöholm, E.; Gellerstedt, G. The behavior of kraft lignin during thermal treatment. J. Anal. Appl. Pyrolysis. 2010, 87, 70–77. [Google Scholar] [CrossRef]
- Cui, C.; Sun, R.; Argyropoulos, D.S. Fractional Precipitation of Softwood Kraft Lignin: Isolation of Narrow Fractions Common to a Variety of Lignins. ACS Sustain. Chem. Eng. 2014, 2, 959–968. [Google Scholar] [CrossRef]
- Sun, S.L.; Wen, J.L.; Ma, M.G.; Li, M.F.; Sun, R.C. Revealing the Structural Inhomogeneity of Lignans from Sweet Sorghum Stem by Successive Alkali Extractions. J. Agric. Food Chem. 2013, 61, 4226–4235. [Google Scholar] [CrossRef]
- El-Hendawy, A.N.A. Variation in the FTIR spectra of a biomass under impregnation, carbonization and oxidation conditions. J. Anal. Appl. Pyrolysis. 2004, 75, 159–166. [Google Scholar] [CrossRef]
- Inkrod, C.; Raita, M.; Champreda, V.; Laosiripojana, N. Characteristics of Lignin Extracted from Different Lignocellulosic Materials via Organosolv Fractionation. BioEnergy Res. 2018, 11, 277–290. [Google Scholar] [CrossRef]
- Abdelaziz, O.Y.; Brink, D.P.; Prothmann, J.; Ravi, K.; Sun, M.; Garcia-Didalgo, J. Biological valorization of low molecular weight lignin. Biotechnol. Adv. 2016, 34, 1318–1346. [Google Scholar] [CrossRef]
- Pawliszyn, J. Theory of Solid-Phase Microextraction. J. Chromatogr. Sci. 2000, 38, 270–278. [Google Scholar] [CrossRef] [PubMed]
- Rocha, S.M.; Gonçalves, V.; Evtuguin, D.; Delgadillo, I. Distinction and identification of lignins based on their volatile headspace composition. Talanta 2008, 75, 594–597. [Google Scholar] [CrossRef]
- Tarasov, D.; Leitch, M.; Fatehi, P. Lignin-carbohydrate complexes: Properties, applications, analyses, and methods of extraction: A review. Biotechnol. Biofuels 2018, 11, 1–28. [Google Scholar]
- Koller, J.; Baumer, U.; Kaup, Y.; Schmid, M.; Weser, U. Analysis of a pharaonic embalming tar. Nature 2003, 425, 784. [Google Scholar] [CrossRef] [PubMed]
- Faix, O. Classification of Lignins from Different Botanical Origins by FT-IR Spectroscopy. Holzforschung 1991, 45, 21–28. [Google Scholar] [CrossRef]
- Xue, L.; Zhao, Z.; Zhang, Y.; Chu, D.; Mu, J. Analysis of Gas Chromatography-Mass Spectrometry Coupled with Dynamic Headspace Sampling on Volatile Organic Compounds of Heat-Treated at High Temperatures. Biores 2016, 11, 3550–3560. [Google Scholar] [CrossRef]
- Oliveira, D.; Finger-Teixeira, A.; Mota, T.; Salvador, V.H.; Moreira-Vilar, F.C.; Molinari, H.B.C. Ferilic Acid: A Key Component in Grass Lignocellulose Recalcitrance to Hydrolysis. Plant Biotechnol. J. 2015, 13, 1224–1232. [Google Scholar] [CrossRef]
- Gutierrez, A.; Rodriguez, I.M.; Del Rio, J.C. Chemical Characterization of Lignin and Lipid Fractions in Industrial Hemp Bast Fibbers Used for Manufacturing High-Quality Paper Pulps. J. Agric. Food Chem. 2006, 54, 2138–2144. [Google Scholar] [CrossRef]
- Marques, G.; Gutierrez, A.; del Rio, J.C. Chemical Characterization of Lignin and Lipid Fractions in Leaf Fibers of Curaua (Ananas erectifolius). J. Agric. Food Chem. 2007, 55, 1327–1336. [Google Scholar] [CrossRef]
- Surup, G.R.; Foppe, M.; Schubert, D.; Deike, R.; Heidelmann, M.; Trubetskaya, A. The effect of feedstock origin and temperature on the structure and reactivity of char from pyrolysis at 1300–2800 ∘C. Fuel 2019, 235, 306–316. [Google Scholar] [CrossRef]
- Surup, G.R.; Nielsen, H.K.; Heidelmann, M.; Trubetskaya, A. Characterization and reactivity of charcoal from high temperature pyrolysis (800–1600 ∘C). Fuel 2019, 235, 1544–1554. [Google Scholar] [CrossRef]
- Du, S.; Valla, J.A.; Bollas, G.M. Characteristics and origin of char and coke from fast and slow, catalytic and thermal pyrolysis of biomass and relevant model compounds. Green Chem. 2013, 15, 3214–3229. [Google Scholar] [CrossRef]
- Cen, K.; Cao, X.; Chen, D.; Zhou, J.; Chen, F.; Li, M. Leaching of alkali and alkaline earth metallic species (AAEMs) with phenolic substances in bio-oil and its effect on pyrolysis characteristics of moso bamboo. Fuel Process. Technol. 2020, 200, 106332. [Google Scholar] [CrossRef]
- Yan, K.; Liu, F.; Chen, Q.; Ke, M.; Huang, X.; Hu, W. Pyrolysis characteristics and kientics of lignin derived from enzymatic hydrolysis residue of bamboo pretreated with white-rot fungus. Biotechnol. Biofuels 2016, 9, 1–11. [Google Scholar]
- Cherif, M.F.; Trache, D.; Brosse, N.; Benaliouche, F.; Tarchoun, A.F. Comparison of the Physicochemical Properties and Thermal Stability of Organosolv and Kraft Lignins from Hardwood and Softwood Biomass for Their Potential Valorization. Waste Biomass Valoriz 2020, 15, 1–13. [Google Scholar]
- Shimizu, S.; Yokoyama, T.; Akiyama, T.; Matsumoto, Y. Reactivity of Lignin with Different Composition of Aromatic Syringyl/Guaiacyl Structures and Erythro/Threo Side Chain Structures in β-O-4 Type during Alkaline Delignification: As a Basis for the Different Degradability of Hardwood and Softwood Lignin. J. Agric. Food Chem. 2012, 60, 6471–6476. [Google Scholar] [CrossRef] [PubMed]
- Trubetskaya, A.; Jensen, P.A.; Jensen, A.D.; Umeki, K.; Gardini, D.; Kling, J.; Glarborg, P. Effects of several types of biomass fuels on the yield, nanostructure and reactivity of soot from fast pyrolysis at high temperatures. Appl. Energy 2016, 171, 468–482. [Google Scholar] [CrossRef]
- Jiang, G.; Nowakowski, D.J.; Bridgwater, A.V. Effect of the temperature on the composition of lignin pyrolysis products. Energy Fuel 2010, 24, 4470–4475. [Google Scholar] [CrossRef]
- Trubetskaya, A.; Larsen Andersen, M.; Talbro Barsberg, S. The Nature of Stable Char Radicals: An ESR and DFT Study of Structural and Hydrogen Bonding Requirements. ChemPlusChem 2018, 83, 780–786. [Google Scholar] [CrossRef] [PubMed]
- Mood, S.H.; Golfeshan, A.H.; Tabatabaei, M.; Abbasalizadeh, S.; Ardjmand, M. Comparison of different ionic liquids pretretment for barley straw enzymatic saccharification. Biotech 2013, 3, 399–406. [Google Scholar]
- Kumar, A.; Kumar, J.; Bhaskar, T. Utilization of lignin: A sustainable and eco-friendly approach. J. Energy Inst. 2020, 93, 235–271. [Google Scholar] [CrossRef]
- Brauns, F.E.; Brauns, D.A. The Thermal Decomposition of Lignin. In The Chemistry of Lignin; Academic Press: Cambridge, MA, USA, 1960; p. 814. [Google Scholar]
- Fengel, D.; Wegener, G. Wood: Chemistry, Ultrastructure, Reactions; Walter de Gruyter: Berlin, Germany, 1989; p. 612. [Google Scholar]
- Arellano, O.; Flores, M.; Guerra, J.; Hidalgo, A.; Rojas, D.; Strubinger, A. Hydrothermal Carbonization of Corncob and Characterization of the Obtained Hydrochar. Chem. Eng. Trans. 2016, 50, 235–240. [Google Scholar]
- Adapa, P.K.; Tabil, L.G.; Schoenau, G.J.; Canam, T.; Dumonceaux, T. Quantitative Analysis of Lignocellulosic Components of Non-Treated and Steam Exploded Barley, Canola, Oat and Wheat Straw Using Fourier Transform Infrared Spectroscopy. J. Agric. Sci. Technol. B 2011, 1, 177–188. [Google Scholar]
- Fan, M.; Dai, D.; Huang, B. Chapter 3 Fourier Transform Infrared Spectroscopy for Natural Fibres. In Fourier Transform. IntechOpen 2012, 3, 45–68. [Google Scholar]
- Lisperguer, J.; Perez, P.; Upizar, S. Structure and thermal properties of lignins: Characterization by infrared spectroscopy and differential scanning calorimetry. J. Chil. Chem. Soc. 2009, 54, 460–463. [Google Scholar] [CrossRef]
- Arafat, A.; Samad, S.A.; Masum, S.M.; Moniruzzaman, M. Preparation and Characterization of Chitosan from Shrimp shell waste. IJSER 2015, 6, 538–541. [Google Scholar]
- Liu, Z.; Quek, A.; Hoekman, S.K.; Balasubramanian, R. Production of solid biochar fuel from waste biomass by hydrothermal carbonization. Fuel 2013, 103, 943–949. [Google Scholar] [CrossRef]
- Lopes, J.O.; Garcia, R.A.; Souza, N.D. Infrared spectroscopy of the surface of thermally-modified teak juvenile wood. Maderas Cienc. Technol. 2018, 20, 737–746. [Google Scholar] [CrossRef]


| Properties | PL | CL | SSL | SBAL | SBNL |
|---|---|---|---|---|---|
| Proximate and ultimate analysis (% on dry basis) | |||||
| Moisture a | 2.1 | 0.1 | 0.4 | 0.1 | 0.2 |
| C | 65.2 | 64.9 | 61.9 | 66.5 | 64.6 |
| H | 6.3 | 7.0 | 5.9 | 6.7 | 6.4 |
| O | 28.0 | 26.3 | 31.0 | 25.8 | 27.8 |
| N | 0.4 | 1.7 | 1.1 | 0.9 | 1.1 |
| S | 0.1 | 0.1 | 0.1 | 0.1 | 0.1 |
| Feedstock | Cellulose | Hemicellulose | Ash | M | M | PDI |
|---|---|---|---|---|---|---|
| %, w/w | Da | |||||
| PL | 0.2 | 0.9 | 0.2 | 1900 | 7700 | 4.4 |
| CL | 0.3 | 0.6 | 0.2 | 3400 | 16,800 | 4.9 |
| SSL | 4.1 | 2.9 | 0.3 | 1600 | 6600 | 4.1 |
| SBAL | 1.5 | 0.7 | 0.6 | 1600 | 10,600 | 6.6 |
| SBNL | 1.5 | 0.6 | 0.2 | 1600 | 8900 | 5.6 |
| Lignin | Aliph OH | Aromatic OH | Acidic | Total | Arom/Aliph | |||
|---|---|---|---|---|---|---|---|---|
| Cond | G | p-OH | Total | OH | OH | OH | ||
| mmoL g | mmoL g | mmoL g | mmoL g | |||||
| PL | 1.41 | 0.32 | 0.58 | 0.06 | 0.96 | 0.16 | 2.37 | 0.68 |
| CL | 1.06 | 0.46 | 0.41 | 0.14 | 1.00 | 0.26 | 2.06 | 0.95 |
| SSL | 1.64 | 0.55 | 0.39 | 0.45 | 1.39 | 0.27 | 3.03 | 0.85 |
| SBAL | 0.83 | 0.39 | 0.45 | 0.36 | 1.21 | 0.32 | 2.04 | 1.46 |
| SBNL | 0.87 | 0.25 | 0.43 | 0.32 | 1.01 | 0.31 | 1.88 | 1.16 |
| Bonding Motif | H | C | Comparison to PL,% | Comparison SBAL, SBNL,% | |||||
|---|---|---|---|---|---|---|---|---|---|
| ppm | PL | CL | SSL | SBAL | SBNL | SBAL | SBNL | ||
| H2,6-H | 7.23 | 128.23 | 0.86 | 0.85 | 1.13 | 1.52 | 1.27 | 2.17 | −0.10 |
| G2-H | 7.00 | 110.64 | 13.34 | −0.47 | −0.74 | −0.29 | −0.45 | 9.47 | −0.23 |
| S2,6-H | 6.72 | 103.65 | 1.71 | 5.10 | 3.29 | 0.28 | 0.02 | 2.19 | −0.20 |
| H in cinn-OH | 4.04 | 59.85 | 1.34 | 1.82 | 0.75 | 4.72 | 4.37 | 7.67 | −0.06 |
| H in -O-4’ | 4.87 | 71.35 | 3.33 | 0.26 | −0.47 | −0.46 | −0.47 | 1.79 | −0.02 |
| H in -O-4’ | 4.34 | 83.12 | 3.57 | −0.41 | −0.69 | −0.55 | −0.55 | 1.62 | −0.01 |
| H in -O-4’ -C=O G | 7.48 | 110.83 | 1.14 | −0.15 | −0.54 | −0.18 | −0.43 | 0.94 | −0.31 |
| H in -5’ | 5.47 | 86.74 | 2.35 | −0.51 | −0.84 | −0.50 | −0.55 | 1.18 | −0.10 |
| H in -’ | 4.65 | 85.11 | 0.68 | 0.34 | −0.71 | −0.40 | −0.22 | 0.41 | 0.29 |
| H in -’ | 3.06 | 53.66 | 1.21 | 0.31 | −0.67 | 0.03 | −0.04 | 1.25 | −0.07 |
| H in epi--’ | 2.86 | 53.61 | 0.55 | −0.04 | −0.73 | −0.09 | −0.29 | 0.50 | −0.22 |
| benzaldehyde | 6.84 | 126.49 | 0.57 | −0.84 | −0.81 | 4.98 | 4.89 | 3.41 | −0.01 |
| G-hydroxyethylketone | 1.24 | 21.93 | 7.49 | 0.16 | −0.74 | 0.95 | 0.58 | 14.57 | −0.19 |
| Aryl ethyl ketone | 2.21 | 33.2 | 2.37 | 3.27 | 0.02 | 7.57 | 5.80 | 20.31 | −0.21 |
| Cinnamyl aldehyde | 6.96 | 123.8 | 0.61 | −0.79 | −0.87 | 4.41 | 4.15 | 3.30 | −0.05 |
| FA-H6 | 7.16 | 123.97 | 0.92 | −0.60 | −0.61 | 3.14 | 3.01 | 3.81 | −0.03 |
| PCE-H2,6 | 7.47 | 129.91 | 0.23 | 0.65 | 21.17 | 1.35 | 2.04 | 0.54 | 0.30 |
| 3.05 | 72.47 | ||||||||
| xylan signals | 3.29 | 73.64 | 0.36 | 0.31 | 2.57 | 0.99 | 1.11 | 0.73 | 0.10 |
| 3.52 | 75.26 | ||||||||
| No | Compound | Presence with More than 0.5 % of Total Amount in Lignin Samples at T Equal | ||
|---|---|---|---|---|
| 110 C | 180 C | 270 C | ||
| 1 | Acetosyringone | PL | ||
| 2 | Acetovanillone | SSL, PL, CL, SBNL, SBAL | ||
| 3 | 5-Acetoxymethyl-2-furaldehyde | PL | ||
| 4 | 4-Acetylsyringol | SSL, CL, PL, BNL | SSL, CL | |
| 5 | 1,2-Benzenediol | CL, SBNL, SBAL | ||
| 6 | Benzoic acid | PL | ||
| 7 | Cadelene | SBAL, CL, PL | SBNL, SBAL | SBNL |
| 8 | -Calacorene | SBAL | ||
| 9 | Calamenene | SBAL, SBNL, PL | SBAL, SBNL, PL | SBAL, SBNL, PL |
| 10 | -Caprolactone | CL | ||
| 11 | -Carboethoxy--butyrolactone | SBAL, CL | ||
| 12 | Cembrene | SBNL | ||
| 13 | Coumaran | CL, SSL | CL, SSL | |
| 14 | -Curcumene | CL | ||
| 15 | Decanal | SBAL, SBNL | ||
| 16 | 2-Decanone | CL | ||
| 17 | Dehydroabietal | SBAL, SBNL | ||
| 18 | Dehydroabietan | SBAL, SSL | ||
| 19 | Dihydroeugenol | PL | ||
| 20 | Ethyl coumarate | SSL, SBNL | ||
| 21 | Ethyl DL-malate | SSL, SBAL, SBNL | ||
| 22 | Ethyl elaidate | SSL, CL | ||
| 23 | Ethyl heptadecanoate | SBAL, SBNL | ||
| 24 | Ethyl homovanillate | SSL | ||
| 25 | Ethyl levulinate | CL, SBAL, SBNL, SSL | ||
| 26 | Ethyl linolenate | SBAL, CL | CL | |
| 27 | Ethyl oleate | SBNL, CL | ||
| 28 | Ethyl pentadecanoate | SSL | ||
| 29 | Ethyl pyroglumate | SSL | ||
| 30 | 4-Ethylguaiacol | SSL, SBNL, SBAL | SSL, SBNL, CL, PL | |
| 31 | Ethylhexyl benzoate | PL | ||
| 32 | Eugenol | PL | ||
| 33 | 4-Ethylphenol | SSL, SBNL, SBAL, CL | SBAL, CL, SSL | |
| 34 | Ferulic acid ethyl ester | SSL | SSL, CL | |
| 35 | 5-Formylfurfural | SBAL, SBNL, SSL | ||
| 36 | 4-Formylphenol | PL | SSL, PL | |
| 37 | 2-Furoic acid | SBAL | SBNL | |
| 38 | Guaiacylacetone | SSL, CL | SSL, SBNL, CL | |
| 39 | 5-Hydroxymethylfurfural | SSL, PL, SBAL | SSL, PL | |
| 40 | Isoeugenol | CL | CL, SBNL, SBAL, PL, SSL | SSL, SBNL, CL, PL |
| 41 | 8-Isopropyl-1,3-dimethylphenanthrene | PL | ||
| 42 | Isovanilline | CL, PL, SSL | PL | |
| 43 | Levoglucosan | SBNL | ||
| 44 | Methoxyeugenol | SSL, CL, SBNL | ||
| 45 | (1-Methoxy-pentyl)-cyclopropane | SBAL, SBNL | SBNL | |
| 46 | Methyl dehydroabiatate | PL | SBAL, SBNL | |
| 47 | Methyl pimarate | SBNL, SSL | ||
| 48 | Methyl vanillate | SSL, PL, CL, SBNL | ||
| 49 | Mono(2-ethylhexyl)phthalate | SSL, PL, SBAL, CL | SSL, PL, SBAL, CL | |
| 50 | Naphthalene | SBAL | ||
| 51 | Nonanal | SBAL | SBAL, PL | |
| 52 | Nonanoic acid | CL | CL | |
| 53 | 9,12-Octadecadienoic acid | SSL | SSL | |
| 54 | Octadecenoic acid | SSL, SBNL | ||
| 55 | o-Guaiacol | CL | CL, PL, SSL, SBNL, SBAL | CL, PL, SSL, SBNL, SBAL |
| 56 | o-Pyrocatechualdehyde | SBAL, SBNL | ||
| 57 | 4-Oxononanal | CL | ||
| 58 | Palmitic acid | SBAL, CL | ||
| 59 | Palmitic acid ethyl ester | CL | SBAL, SSL, SBNL, CL | SBAL, SSL, SBNL, CL |
| 60 | p-cresol | PL, SSL | ||
| 61 | p-Formylphenol | CL | ||
| 62 | Propenal | SSL, PL | ||
| 63 | 3-Pyridinol | SSL | SBNL, CL | |
| 64 | Retene | SSL, SBAL, SBNL, CL, PL | SSL, SBAL, SBNL, CL, PL | |
| 65 | Succinic acid | CL | CL, SBNL, SBAL, SSL | SBAL, SBNL, SSL |
| 66 | Syringa aldehyde | SSL, CL | SSL | |
| 67 | Syringaldehyde | SSL, CL, PL | ||
| 68 | Syringol | CL | CL | |
| 69 | Tetradecanal | CL | ||
| 70 | 2-Tetradecanone | CL | ||
| 71 | 2-Undecanone | CL | ||
| 72 | Vanillin | SBNL, SBAL | SSL, CL, PL | SBNL, SSL, SBAL, CL, PL |
| 73 | 4-Vinylguaiacol | CL | SSL, CL, PL, SBNL, SBAL | SSL, CL, PL |
© 2020 by the authors. Licensee MDPI, Basel, Switzerland. This article is an open access article distributed under the terms and conditions of the Creative Commons Attribution (CC BY) license (http://creativecommons.org/licenses/by/4.0/).
Share and Cite
Trubetskaya, A.; Lange, H.; Wittgens, B.; Brunsvik, A.; Crestini, C.; Rova, U.; Christakopoulos, P.; Leahy, J.J.; Matsakas, L. Structural and Thermal Characterization of Novel Organosolv Lignins from Wood and Herbaceous Sources. Processes 2020, 8, 860. https://doi.org/10.3390/pr8070860
Trubetskaya A, Lange H, Wittgens B, Brunsvik A, Crestini C, Rova U, Christakopoulos P, Leahy JJ, Matsakas L. Structural and Thermal Characterization of Novel Organosolv Lignins from Wood and Herbaceous Sources. Processes. 2020; 8(7):860. https://doi.org/10.3390/pr8070860
Chicago/Turabian StyleTrubetskaya, Anna, Heiko Lange, Bernd Wittgens, Anders Brunsvik, Claudia Crestini, Ulrika Rova, Paul Christakopoulos, J. J. Leahy, and Leonidas Matsakas. 2020. "Structural and Thermal Characterization of Novel Organosolv Lignins from Wood and Herbaceous Sources" Processes 8, no. 7: 860. https://doi.org/10.3390/pr8070860
APA StyleTrubetskaya, A., Lange, H., Wittgens, B., Brunsvik, A., Crestini, C., Rova, U., Christakopoulos, P., Leahy, J. J., & Matsakas, L. (2020). Structural and Thermal Characterization of Novel Organosolv Lignins from Wood and Herbaceous Sources. Processes, 8(7), 860. https://doi.org/10.3390/pr8070860