Article

Liquid Polymer Eutectic Mixture for Integrated Extractive-Oxidative Desulfurization of Fuel Oil: An Optimization Study via Response Surface Methodology

by
Mohd. Faridzuan Majid
1,
Hayyiratul Fatimah Mohd Zaid
1,2,*,
Chong Fai Kait
1,2,
Khairulazhar Jumbri
1,3,
Jun Wei Lim
1,4,
Asiah Nusaibah Masri
3,5,
Siti Musliha Mat Ghani
5,
Hiroshi Yamagishi
6,
Yohei Yamamoto
6,* and
Brian Yuliarto
7,8
1
Department of Fundamental and Applied Sciences, Universiti Teknologi PETRONAS, Seri Iskandar 32610, Perak Darul Ridzuan, Malaysia
2
Centre of Innovative Nanostructures & Nanodevices (COINN), Institute of Autonomous System, Universiti Teknologi PETRONAS, Seri Iskandar 32610, Perak, Malaysia
3
Centre for Research in Ionic Liquids (CORIL), Institute of Contaminant Management, Universiti Teknologi PETRONAS, Seri Iskandar 32610, Perak, Malaysia
4
HICoE-Centre for Biofuel and Biochemical Research, Institute of Self-Sustainable Building, Universiti Teknologi PETRONAS, Seri Iskandar 32610, Perak, Malaysia
5
Department of Chemical Engineering, Universiti Teknologi PETRONAS, Seri Iskandar 32610, Perak, Malaysia
6
Department of Materials Science and Tsukuba Research Center for Energy Materials Science (TREMS), Faculty of Pure and Applied Sciences, University of Tsukuba, 1-1-1 Tennodai, Tsukuba, Ibaraki 305-8573, Japan
7
Engineering Physics Department, Institute of Technology Bandung, Bandung 40132, Indonesia
8
Research Center for Nanosciences and Nanotechnology (RCNN), Institute of Technology Bandung, Bandung 40132, Indonesia
*
Authors to whom correspondence should be addressed.
Processes 2020, 8(7), 848; https://doi.org/10.3390/pr8070848
Submission received: 29 May 2020 / Revised: 25 June 2020 / Accepted: 28 June 2020 / Published: 16 July 2020
(This article belongs to the Section Sustainable Processes)

Abstract

:
Hydrodesulfurization (HDS) has been commercially employed for the production of ultra-low sulfur fuel oil. However, HDS is unable to remove sterically hindered sulfur-containing compounds such as dibenzothiophene (DBT) and benzothiophene (BT). An alternative way to remove sulfur is via extractive desulfurization system (EDS) using deep eutectic solvents (DES) as sustainable extractant. In this work, liquid polymer DES was synthesized using tetrabutylammonium chloride (TBAC) and poly(ethylene glycol) 400 (PEG) with different molar ratios. Response surface methodology (RSM) was applied to study the effect of independent variables toward extraction efficiency (EE). Three significant operating parameters, temperature (25–70 °C), DES molar ratio (1–3), and DES volume ratio (0.2–2.0), were varied to study the EE of sulfur from model oil. A quadratic model was selected based on the fit summary test, revealing that the extraction efficiency was greatly influenced by the amount of DES used, followed by the extraction temperature and PEG ratio. Although molar ratio of DES was less sensitive towards EDS performance, the EE was much higher at lower PEG ratio. For the realization of an energy-efficient EDS system, optimization of EDS parameters and EE was carried out via a desirability tool. At 25 °C, 1:1 molar ratio of TBAC to PEG, and DES-to-model-oil-volume ratio of 1, removal of DBT reached as high as 79.01%. The present findings could provide valuable insight into the development of practicable EDS technology as a substitute to previous HDS process.

1. Introduction

Refractory sulfurs in fuel oil are known to be a pollutant as they produce sulfur dioxide, SOx when combusted. SOx gasses can react with water vapor in the atmosphere forming sulfuric acid, otherwise known as acid rain. Acid rain can disrupt marine ecology, destroy forests, and deteriorate heritage buildings. Moreover, long-term exposure to SOx can cause respiratory related illness, heart disease, and asthma [1]. With the rapid growth of automobile industries, production of ultra-low sulfur fuel oil is indispensable to minimize SOx emission.
Current technology uses hydrodesulfurization (HDS) to eliminate sulfur from fuel oil. This process however demands high temperature (300–400 °C) and high hydrogen gas pressure (30–130 atm) to operate, making it an energy-extensive and financially tasking separation process [2]. Moreover, HDS is unable to intensely remove sterically hindered sulfurs such as dibenzothiophene (DBT), 1-benzothiophene (BT), 4-methyldibenzothiophene (MDBT), benzonaphthothiophene (BPT), and 4,6-dimethyldibenzothiophene (4,6-DMDBT) due to the existence of bulky substituent groups. Therefore, alternative separation technologies are highly desired to solve the drawbacks of conventional HDS.
Some of the non-conventional ways to remove sulfur are currently being tested including biodesulfurization (BDS) [3,4,5], adsorptive desulfurization (ADS) [6,7,8], extractive desulfurization (EDS) [9,10,11,12], and oxidative desulfurization (ODS) [13,14]. Compared to BDS and ADS, EDS could be operated at mild conditions with the use of suitable extractant to desulfurize fuel oil. On the other hand, integrating ODS in EDS system (EODS) will promote the oxidation of sulfur into sulfone components, which can be easily extracted into the solvent phase [15,16,17,18]. Selection of extractant is nonetheless challenging since some of the conventional solvents are highly flammable and volatile [19,20,21]. Therefore, ionic liquids (ILs), which are composed of cationic and anionic salts, have been introduced as green solvent since it has extremely low vapor pressure, customizable polarity, minimum flammability, and substantial stability for various applications [22,23,24,25]. By using ILs in EODS, the performance of desulfurization could be greatly improved [20,26,27]. Despite its unique solvent properties, the synthesis of IL requires tedious process and the raw materials are expensive, therefore it is not economically preferred by industrial practice.
Pioneered by Abbot et al., [28,29], a new class of green solvent called deep eutectic solvent (DES), which have similar properties with IL, have received considerable attention in the past few years. It is formed from the interaction of hydrogen bond acceptor (HBA), which is usually in the form of quaternary ammonium salt and hydrogen bond donors (HBD). The raw materials are widely available and affordable, while the synthesis of DES is straightforward compared to IL. Moreover, reports from the literature show that this type of solvent is environmentally benign due to the biodegradability properties of the raw materials [30,31].
Research of polyethylene glycol (PEG)-based DES in EDS is currently attracting researchers’ attentions due to its enormous performance in sulfur removal. In early 2013, Li et al. had synthesized PEG eutectic mixture with different HBAs namely choline chloride (ChCl), tetramethylammonium chloride (TMAC), and tetrabutylammonium chloride (TBAC) for application in EDS system. It was found that in a single extraction, 82.83% of sulfur could be removed from simulated fuel by using TBAC-PEG as an extractant [32]. The higher extraction efficiency arose from the longer alkyl chain components in DES. Furthermore, Xu et al. had synthesized a metal-based DES using cobalt chloride (CoCl2), ChCl, and PEG (number average molecular weight of 200 g mol−1) in extractive and catalytic-oxidative desulfurization system (ECODS) [33]. At optimal conditions, 90% of sulfur could be removed using this DES. Another finding on the application of PEG-based DES in EDS was also reported by Lima et al., where 85% of sulfur could be eliminated when using PEG with the molecular weight of 400 g mol−1 as HBD [34]. In their findings, low-molecular-weight liquid polymer was preferable for EDS system since higher molecular weight may hinder the mass transfer during the extraction process. According to these reports, several EDS parameters were analyzed to optimize the performance of EDS, which includes extraction time, extraction temperature, volume ratio of extractant to simulated fuel, and stirring speed. However, all important parameters were studied independently, and the relationship between the variables have not yet been studied statistically in the context of EDS performance. Therefore, a systematic way to study the effect of each variable is crucial to analyze the sensitivity of input parameters towards EDS.
Response surface methodology (RSM) is a statistical tool that can help users to empirically analyze the effect of input variables for optimizing a system [35]. The three essential processes employed in RSM are the methodical design of experiments, regression modelling approach, and optimization technique. By implementing RSM, the total experiments can be minimized and a synergistic influence of each independent variable could be monitored along the process. A Box–Behnken design RSM was employed by Mokhtar et al., to optimize EDS using dimethylformamide as extractant [19]. Based on the response contour of interacting variables, they found that the increase of extractant volume and extraction time both gave a positive effect towards EDS performance with a maximum removal of 67.5%. Rahma et al. utilized RSM in evaluating the performance of PEG-based DES using tetrabutylammonium bromide as HBA. According to their outcome, extraction efficiency could reach as high as 82.40% within one extraction [36]. They concluded that the stirring speed was the most sensitive factor in EE. Meanwhile, Almashjary et al. reported an EE of 64.9% at optimized conditions using ChCl:propionic acid as EDS extractant [37]. Likewise, many parameters have been studied to optimize the EDS conditions. Nonetheless, reports on the influence of DES composition in EDS are relatively scarce. Especially, as far as we know, no statistical models have been constructed for the performance of TBAC:PEG in EODS.
Herein, we report a systematic investigation of the influence of independent variables toward EDS performance via RSM. We first synthesize the TBAC:PEG mixture in different mole ratios. Next, important parameters are included in the design stage of experiment employing central composite design (CCD) to understand the mutual effect of different variables on EE. From the statistical analysis, suitable mathematical modelling is established and optimum points that yield the highest extraction efficiency are determined.

2. Materials and Methods

2.1. Chemicals and Software

Tetrabutylammonium chloride, TBAC (95%) and n-dodecane (99%) were obtained from Acros Organics (Geel West Zone 2, Janssen Pharmaceuticalaan 3a, B-2440 Geel, Belgium). Hydrogen peroxide (30% in water) and dibenzothiophene, DBT were purchased from Merck (Sunway Annexe Tower, Jalan Lagoon Timur, Sunway City, Selangor, Malaysia). Poly(ethylene glycol), PEG400 was supplied by Sigma Aldrich (Jalan PJS 7/21, Sunway City, Subang Jaya, Petaling Jaya, Selangor, Malaysia). DesignExpert (version: 12.0.0.6, 64-bit) software was provided by State-Ease Inc. (1300 Godward St NE, Suite 6400, Minneapolis, MN 55413, USA).

2.2. DES Synthesis

TBAC-PEG was prepared by weighing desired amount of TBAC salt, followed by PEG in a closed vial. The mixtures were heated to 50 °C and stirred at 500 rpm within 60 min. The obtained clear solution was left to cool down prior to the analysis.

2.3. Fourier Transformation Infrared (FTIR) Spectroscopy

All samples of DES were characterized via Nicolet Series FTIR Spectrometer (Fisher Scientific (M) Sdn Bhd, Taman Perindustrian Axis, Shah Alam, Selangor, Malaysia) to confirm the formation of intermolecular forces between TBAC and PEG. A background spectrum was initially collected before sample characterization to get rid of undesirable residue peaks from the spectrum. The sample was dropped in a small amount on the diamond cell. For spectrum smoothing purpose, a total of 16 scans were used while the wavenumbers were collected from 550–4000 cm−1. All FTIR spectrums were reported in terms of transmittance.

2.4. Viscosity Measurement

Evaluation of viscosity values was made via SVM 3000 Anton Paar viscometer (Anton Paar Malaysia Sdn Bhd, The Pinnacle, Persiaran Lagoon, Sunway City, Subang Jaya, Selangor, Malaysia). In general, 5 mL of DES sample was injected into an oscillating u-tube viscometer and the measurement was taken from 293.15 K to 363.15 K with temperature uncertainty of ± 0.01K. After each measurement was done, the tube was cleaned with acetone for three times before introducing the next sample.

2.5. Differential Scanning Calorimetry (DSC)

The melting point of DES was characterized via DSC Mettler-Toledo model SC822 (Mettler-Toledo Sdn Bhd, Bukit Jelutong, Shah Alam, Selangor, Malaysia). The temperature and heat flow of DSC was calibrated with zinc and indium reference sample. Approximately 10 mg of samples were weighed in a pan before exposed to flowing liquid nitrogen. The heating range was set from −150 °C to 130 °C at a heating/cooling rate of 10 °C min−1. The sample was subjected to four heating cycles, which started with cooling, followed by heating for elimination of thermal history.

2.6. Extractive Desulfurization System (EDS) Experiments

A 100 ppm simulated fuel was prepared by mixing fixed amount of DBT with n-dodecane in a volumetric flask. For the EDS set up, a desired amount of simulated fuel was mixed with DES and oxidant (oxidant to oil ratio of 2) in a reaction vial with a stirring speed of 200 rpm. Typically, phase separation into two layers occurred due to the immiscibility of DES and simulated fuel. A disposable syringe was used to transfer an aliquot of simulated fuel to a 2 mL screw-top vial followed by sulfur analysis.

2.7. Sulfur Content Analysis

To analyze the removal efficiency of sulfur from simulated fuel, high-performance liquid chromatography (1200 Series, Agilent Technologies, Damansara Uptown, Petaling Jaya, Selangor, Malaysia) was utilized. Determination of sulfur concentration was carried using external standard method and the UV-vis wavelength was fixed at 310 nm. Reversed-phase Zorbax SB-C18 was used as stationary phase with a column dimension of 4.6 × 150 mm. A mixture of methanol/deionized water/propan-2-ol (90%/8%/2%) was used as the mobile phase and the flow rate was set to 1 mL min−1. Extraction efficiency (EE) was calculated using Equation (1):
Extraction   efficiency   %   ( EE % ) = S i S f S i   × 100 %
where S i and S f are the initial and final concentration of sulfur, respectively.

2.8. Design of Experiments (DOE)

A systematic set of experiments was designed using central-composite design (CCD) approach. DES mole ratio (A), DES volume ratio (B), and extraction temperature (C) were incorporated as independent variables while EE% was selected as the output response. A face-centered design space with an axial spacing, α, of 1 was selected and a total of 20 experiments were generated in randomized order. All EDS parameters were coded as −1, 0, and ±1, which represents low level, central point, and high level (Table 1).
Equation (2) shows the second order polynomial equation, which was used to fit all variables:
y = β o + i 1 k β i χ i + i 1 k β i i χ i 2 + i < j   β i j χ i χ j + ξ  
where y is the predicted response, β o is the constant coefficient, β i is the linear coefficient, β i i is the squared coefficient, β i j denotes mutual interaction coefficient, χ i and χ j are both independent variables, and ξ is the error term. EE was statistically analyzed via analysis of variance (ANOVA) while the significance of RSM model was quantified by regression analysis. A three-dimensional (3D) response surface and contour plot were used to study the interaction of independent variable towards EDS performances.

3. Results and Discussion

3.1. Formation of Eutectic Mixture

PEG-based eutectic mixtures were synthesized at four different mole ratios using TBAC as quaternary ammonium salt. All DES appeared as clear homogenous solution at room temperature. According to Smith, Abbot, and Ryder [29], TBAC-PEG is considered as Type III DES since it is formed by coordination of HBD to the HBA salt via complexation.
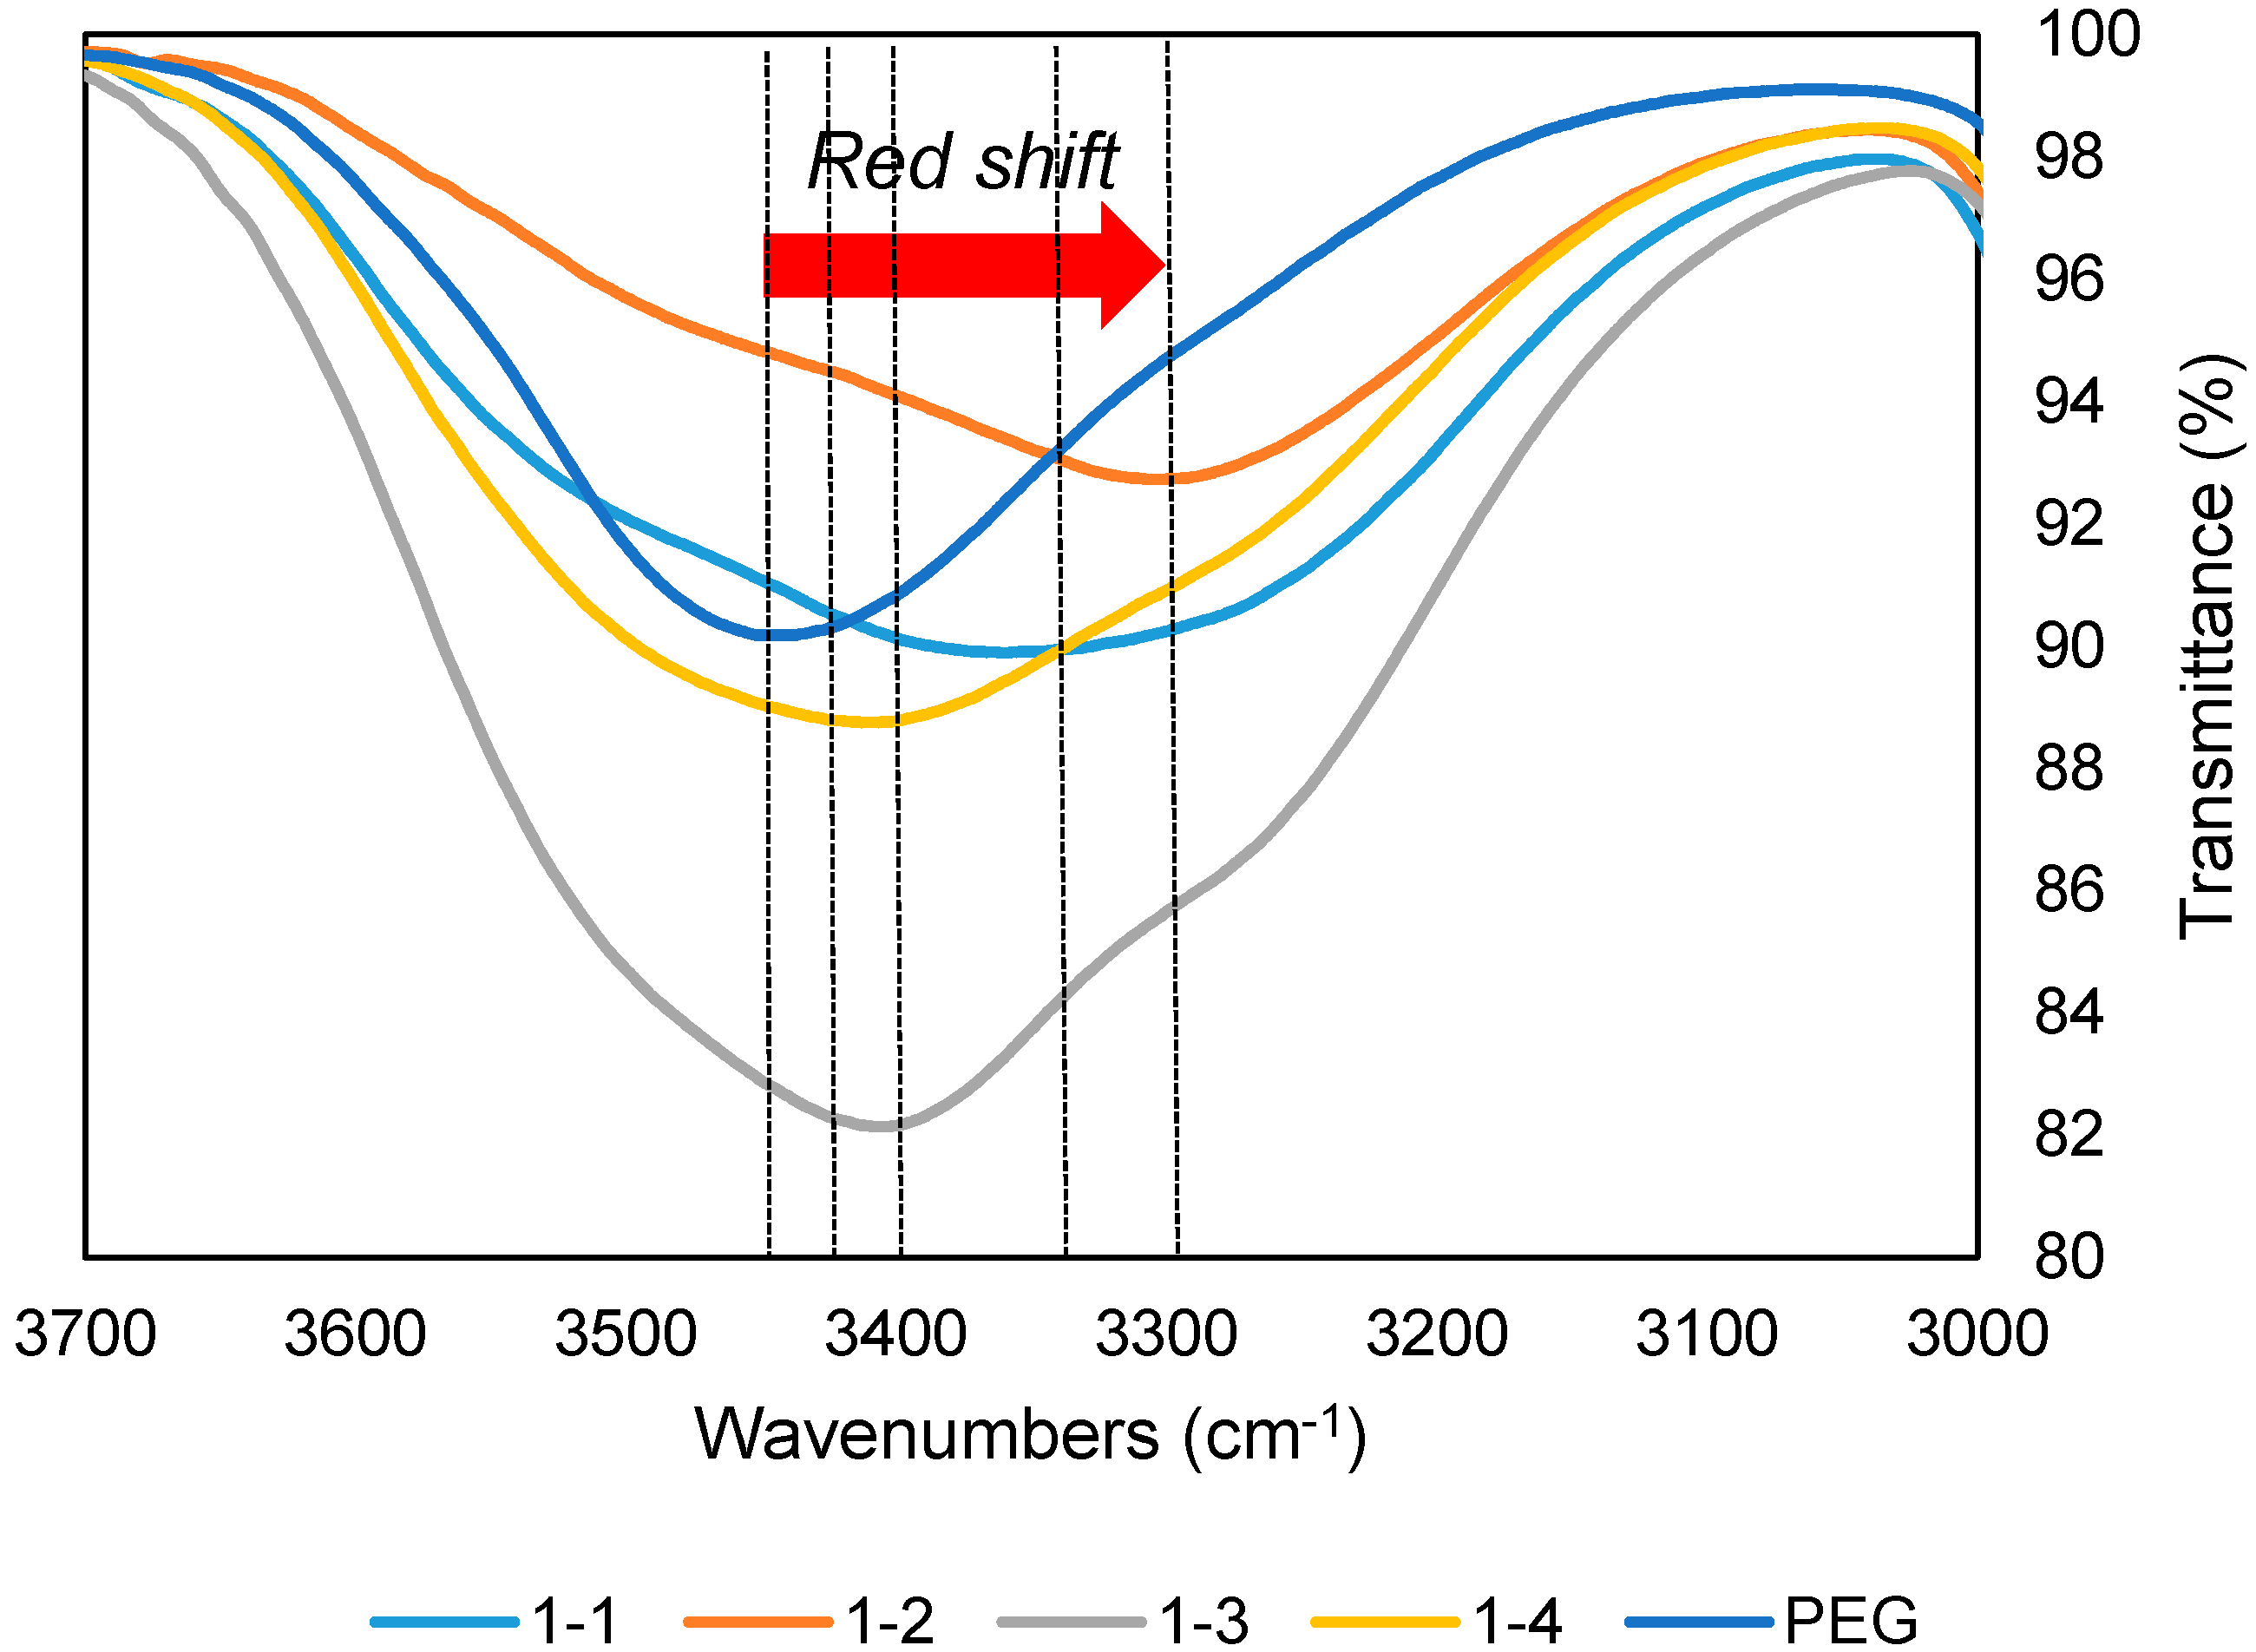
The complete synthesis of DESs were confirmed by the shifting of hydroxyl group in FTIR spectrum from the original starting compound as shown in Figure 1. The change of wavenumbers was due to the formation of hydrogen bonding arose from the intermolecular forces between TBAC and PEG. The interaction was contributed by hyperconjugation, where lone pair from hydroxyl in PEG was donated into antibonding orbital of TBAC, producing a red shift (lowering of wavenumbers) as a result of the decrease of force constant [38].
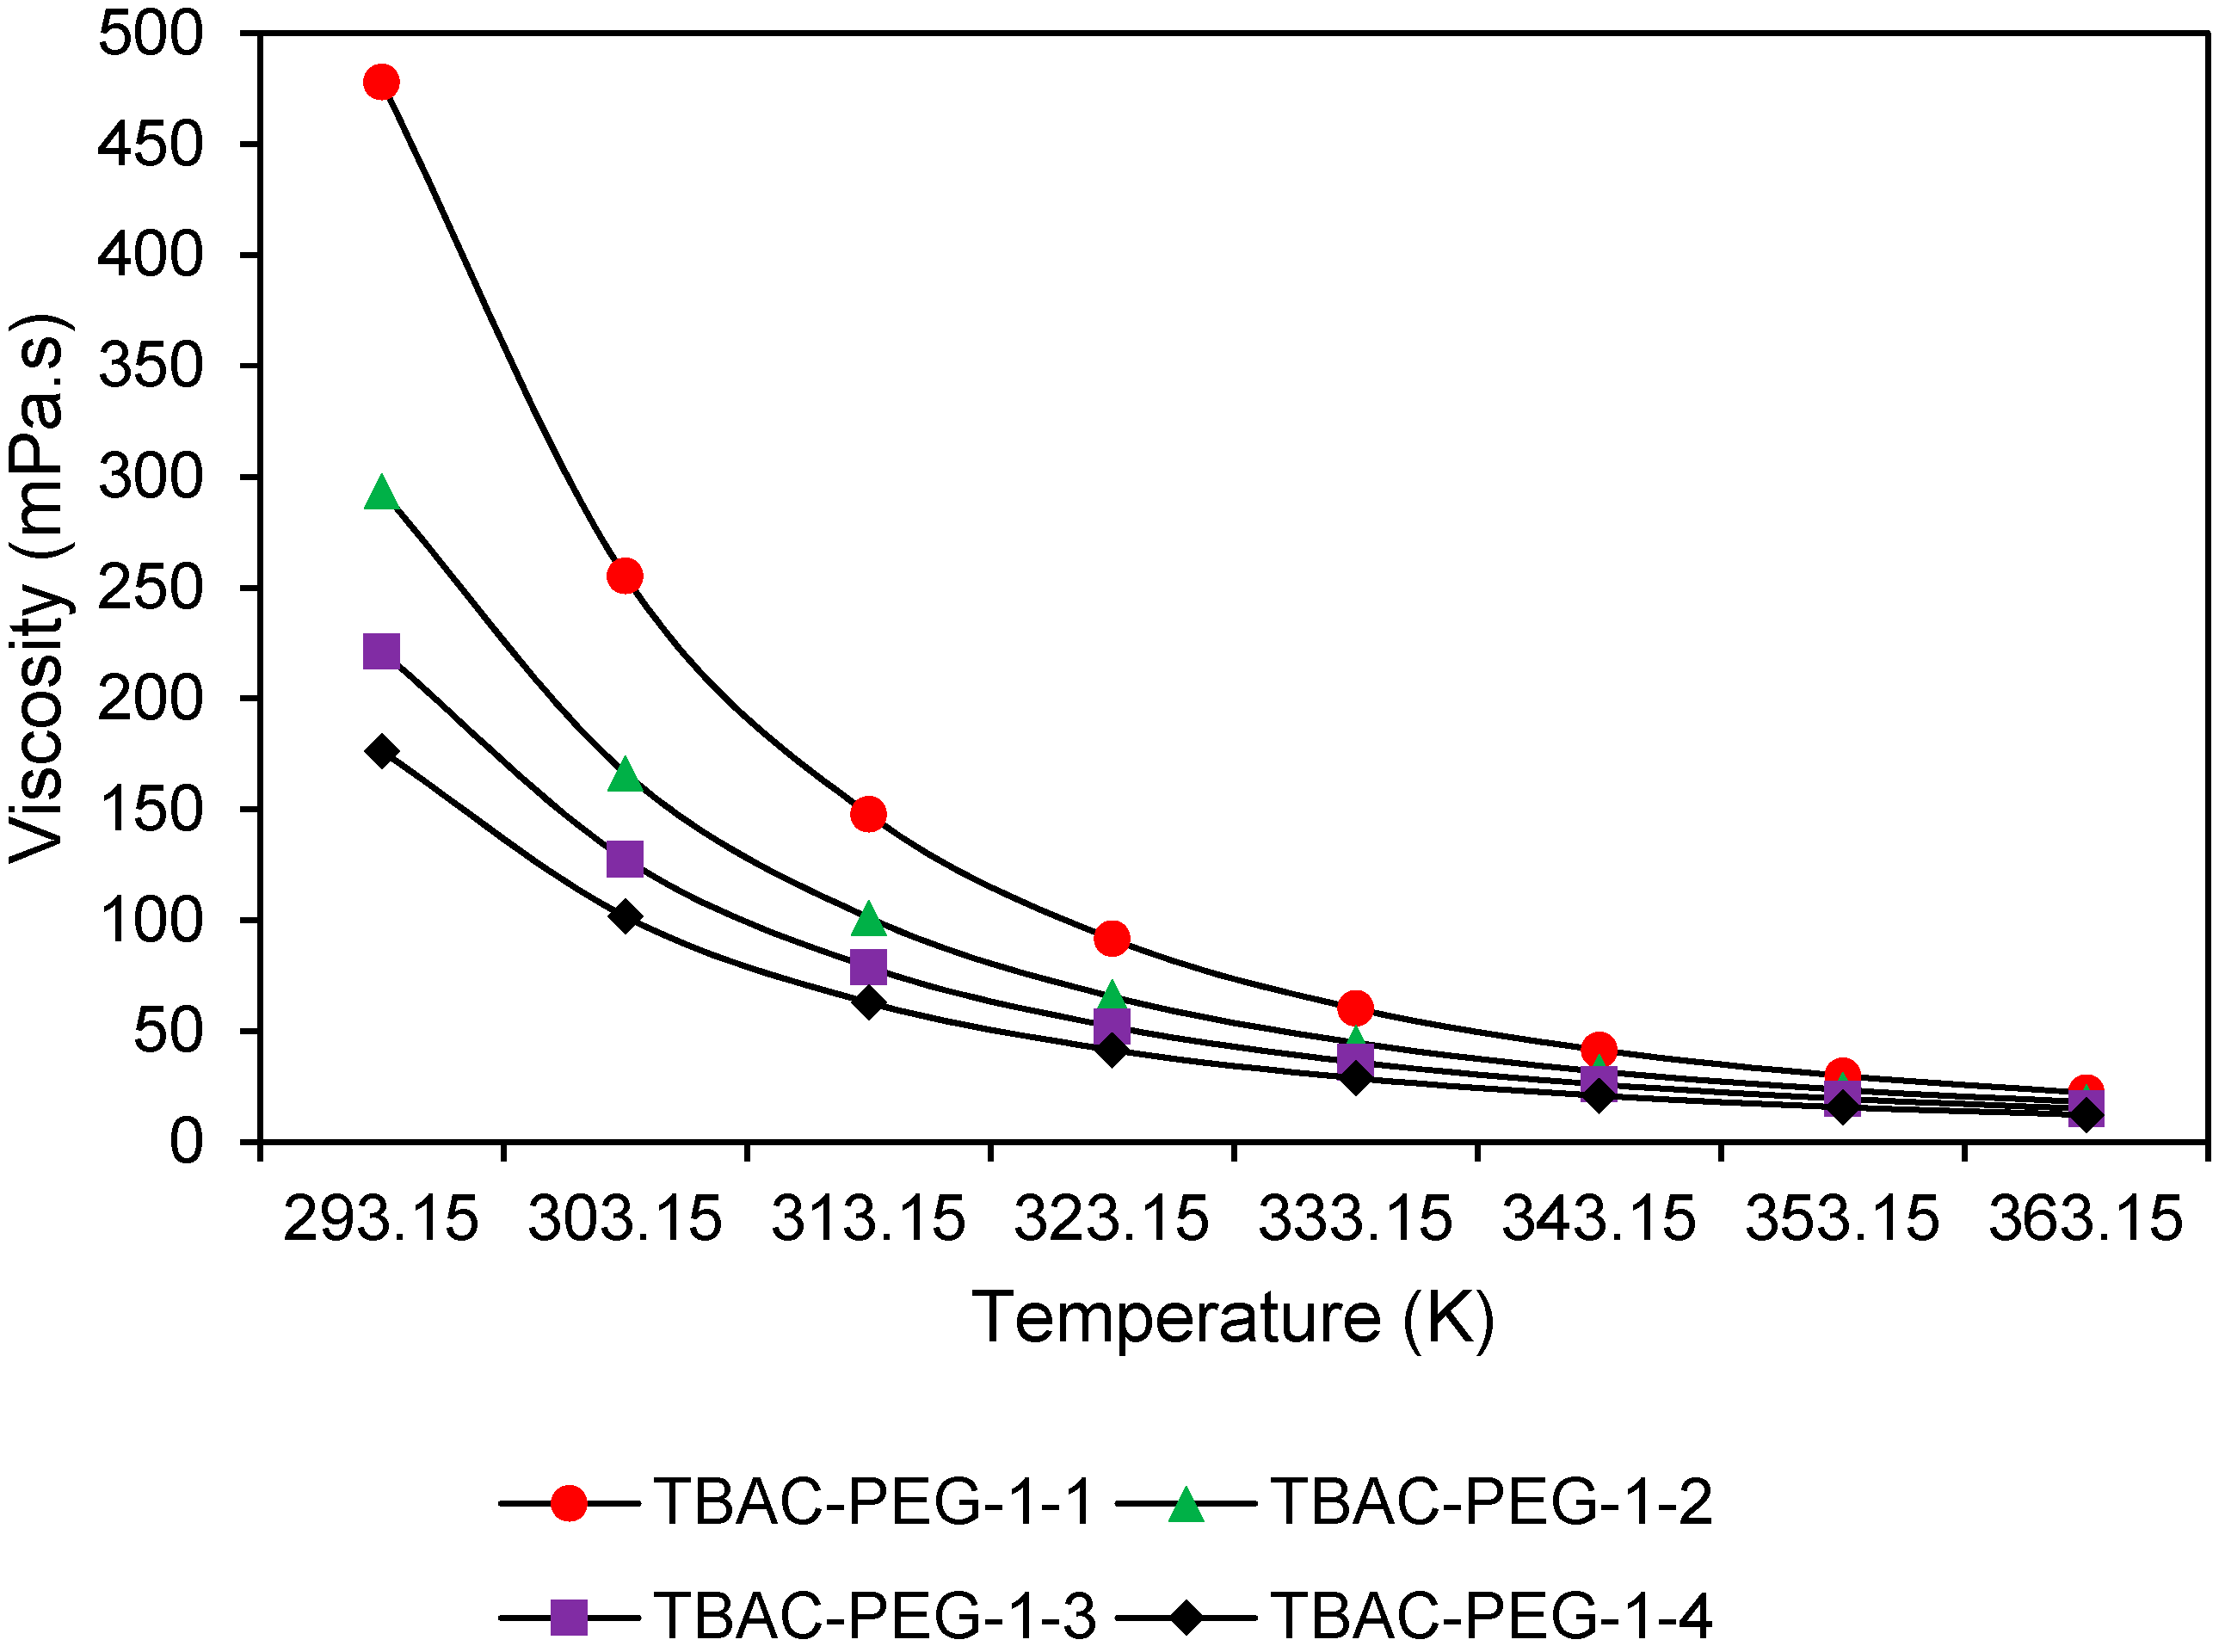
The viscosity against temperature curve for all DES samples was illustrated in Figure 2. The viscosity values were tabulated in Table S1. All tested samples show exponentially decaying curves. When heat was applied, the intermolecular forces between TBAC and PEG were weakened, which enhance their mobility. This causes the value of viscosity to decrease as the temperature increased. When the amount of PEG increased, the viscosity of DES decreased. This was due to elevation of free molar volume, which decrease the occupancy of TBAC. Furthermore, electrostatic force between TBAC and PEG was weakened due to domination of PEG-PEG hydrogen bonding.
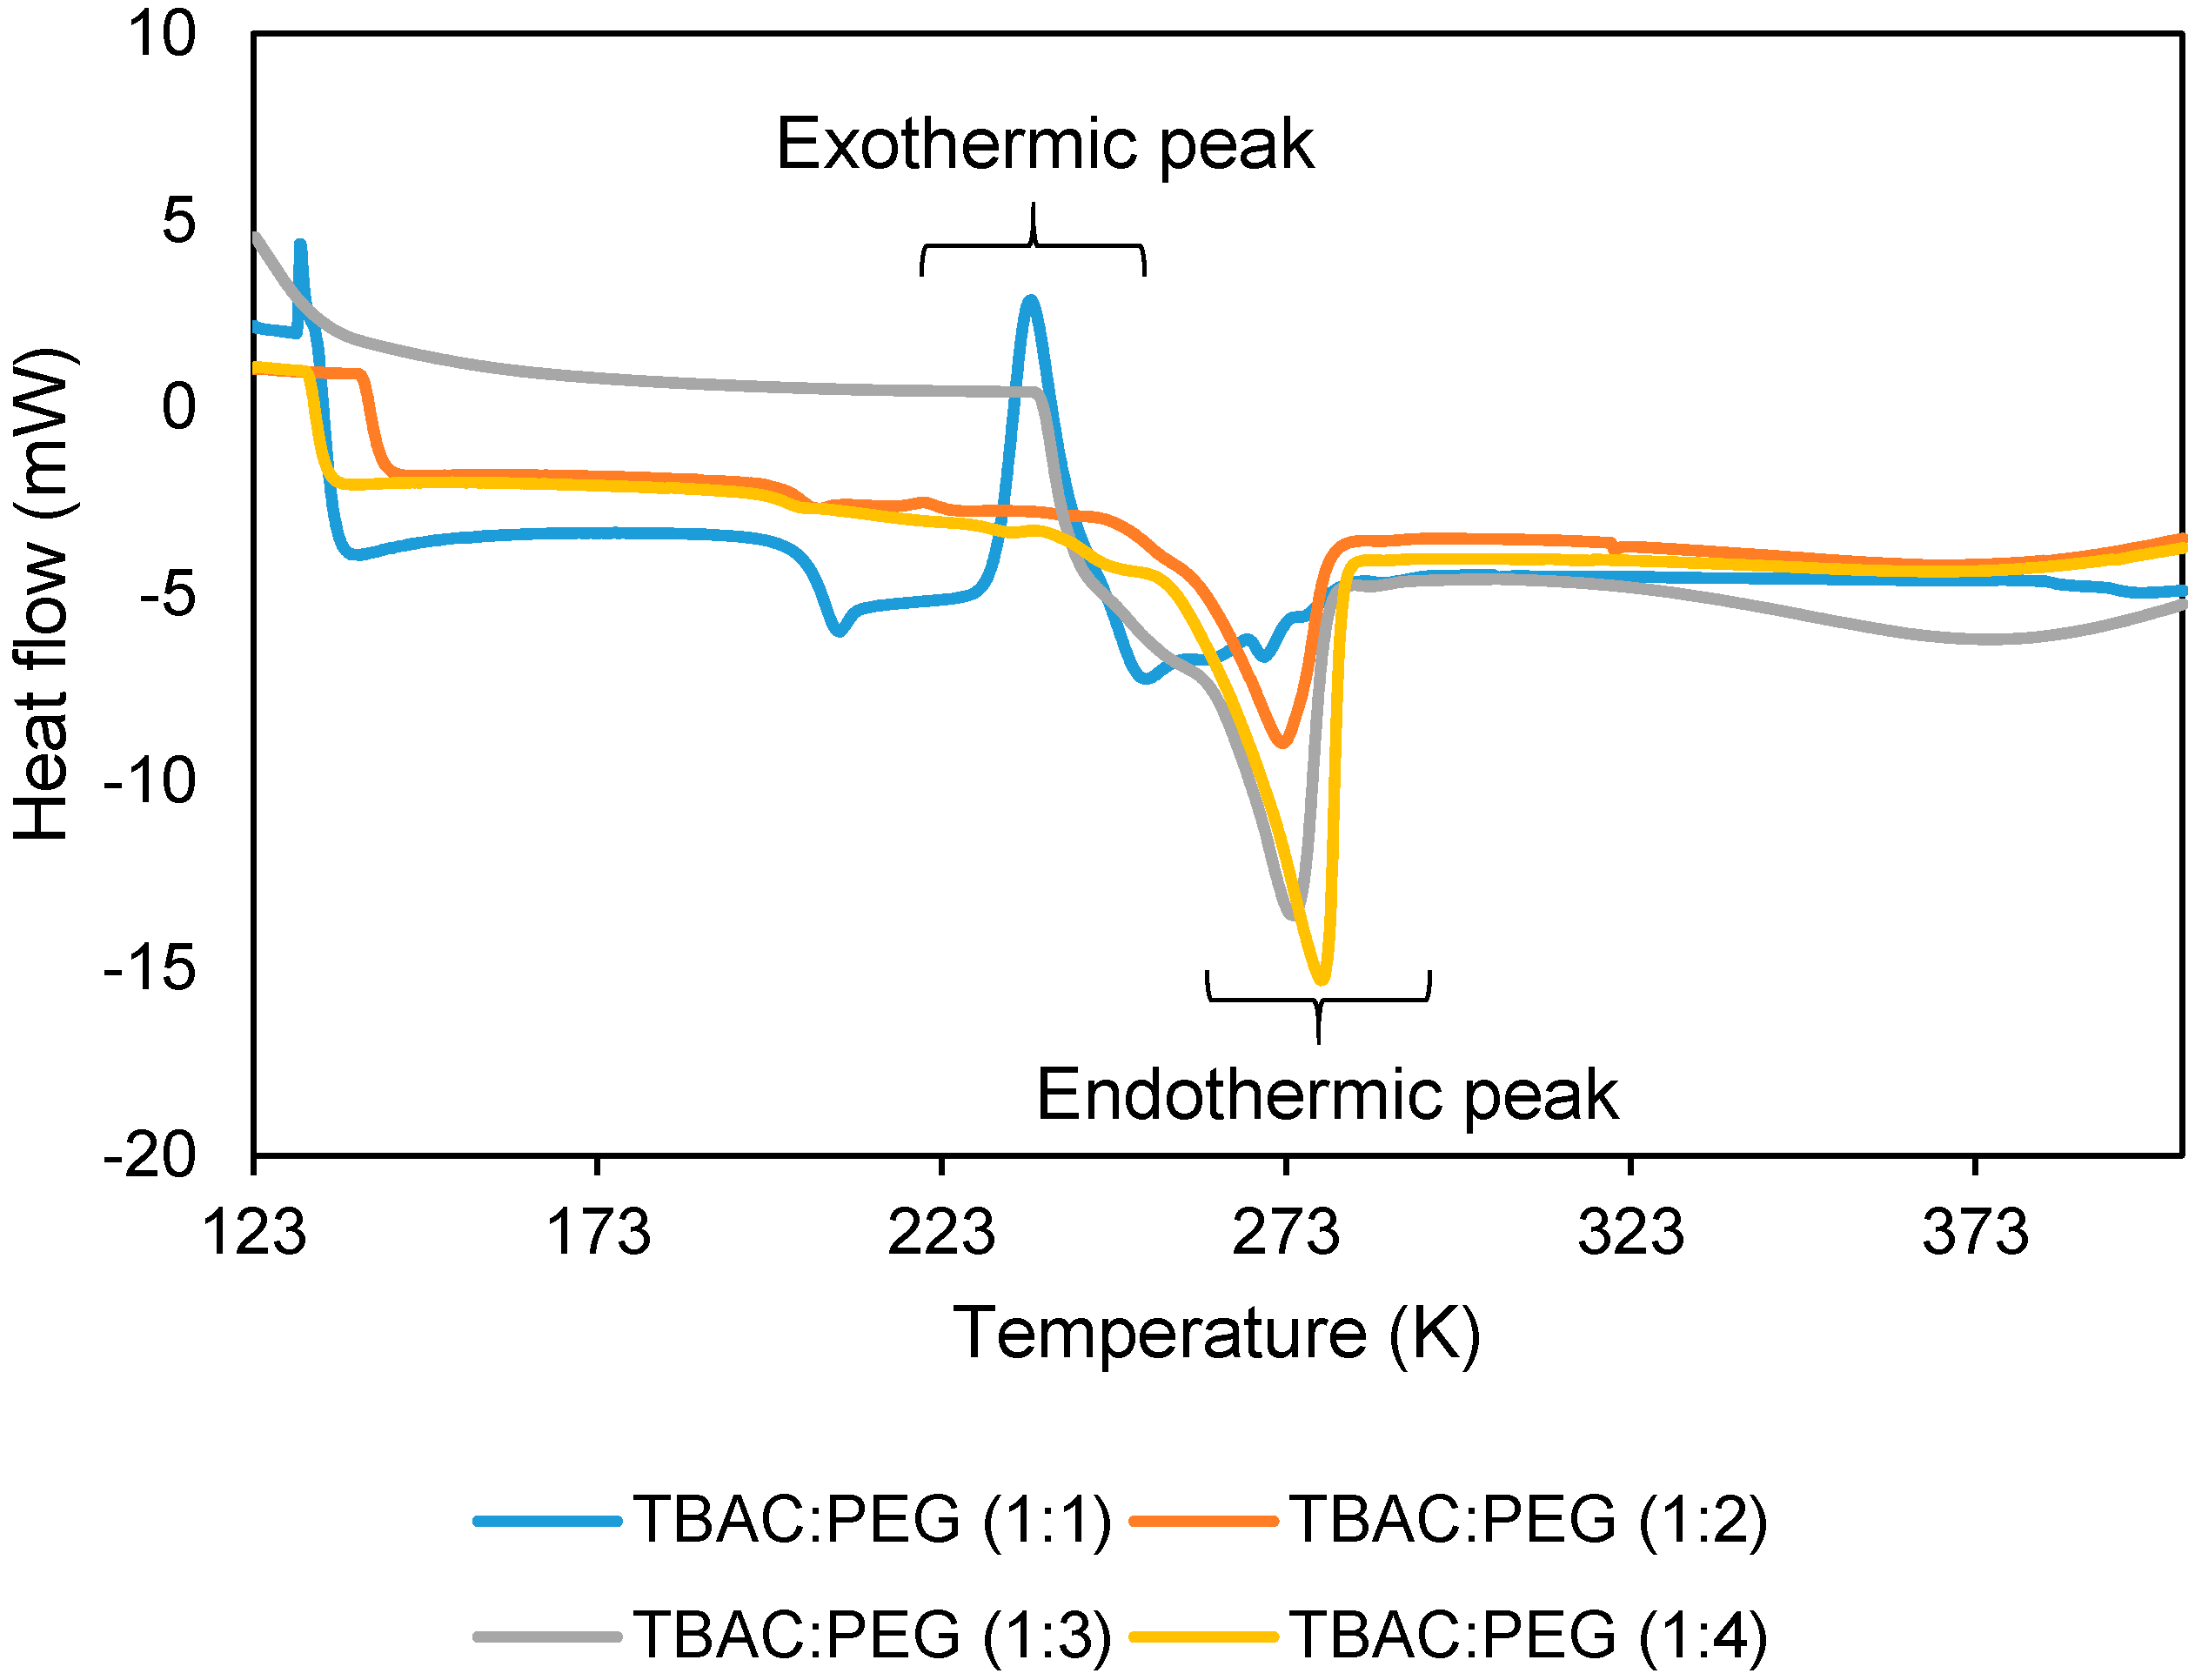
A eutectic point, where a mixture melts below the melting point of their pure constituents, resulted from the formation of DES. To determine the eutectic point, the phase transitions of DES was thermally characterized at TBAC:PEG mole ratio of 1:1, 1:2, 1:3 and 1:4 via DSC.
Figure 3 shows the heating curve of TBAC:PEG. A single distinctive endothermic peak was observed for all samples, which corresponds to melting temperature (Tm). An extra exothermic peak was detected for TBAC:PEG (1:1), which represents the crystallization temperature (Tc) of DES. Absence of Tc in other tested samples does not mean that this transition is impossible because the peak is still detectable but not within our method conditions. Our main focus here was to study the melting point depression, which is one of the significant properties of DES. The area between two baselines indicated the enthalpy of fusion, ∆Hfus. As the ratio of PEG increased, the size of the Tm peak increased. More heat was required to initiate the physical transformation of DES from solid into liquid as the amount of PEG increased, which can be attributed to the strength of intermolecular forces formed between the PEG chains. As expected, a decrease in melting point was observed for all DES. A comparison of the final melting point and their depression value are tabulated in Table 2. The lowest melting point was observed at 1:1 molar ratio of TBAC to PEG, followed by 1:2, 1:3, and 1:4. The decrease in the melting point can be explained by the weakened strength of interaction in DES. Molecular dynamic simulation performed by Shah et al. revealed that the number of hydrogen bonds formed in pure PEG fell to almost zero in TBA-PEG system, suggesting that the decrease in melting point arose from the disruption of interaction energy [39]. Increasing the PEG molecules, however, did not significantly decrease the melting point.
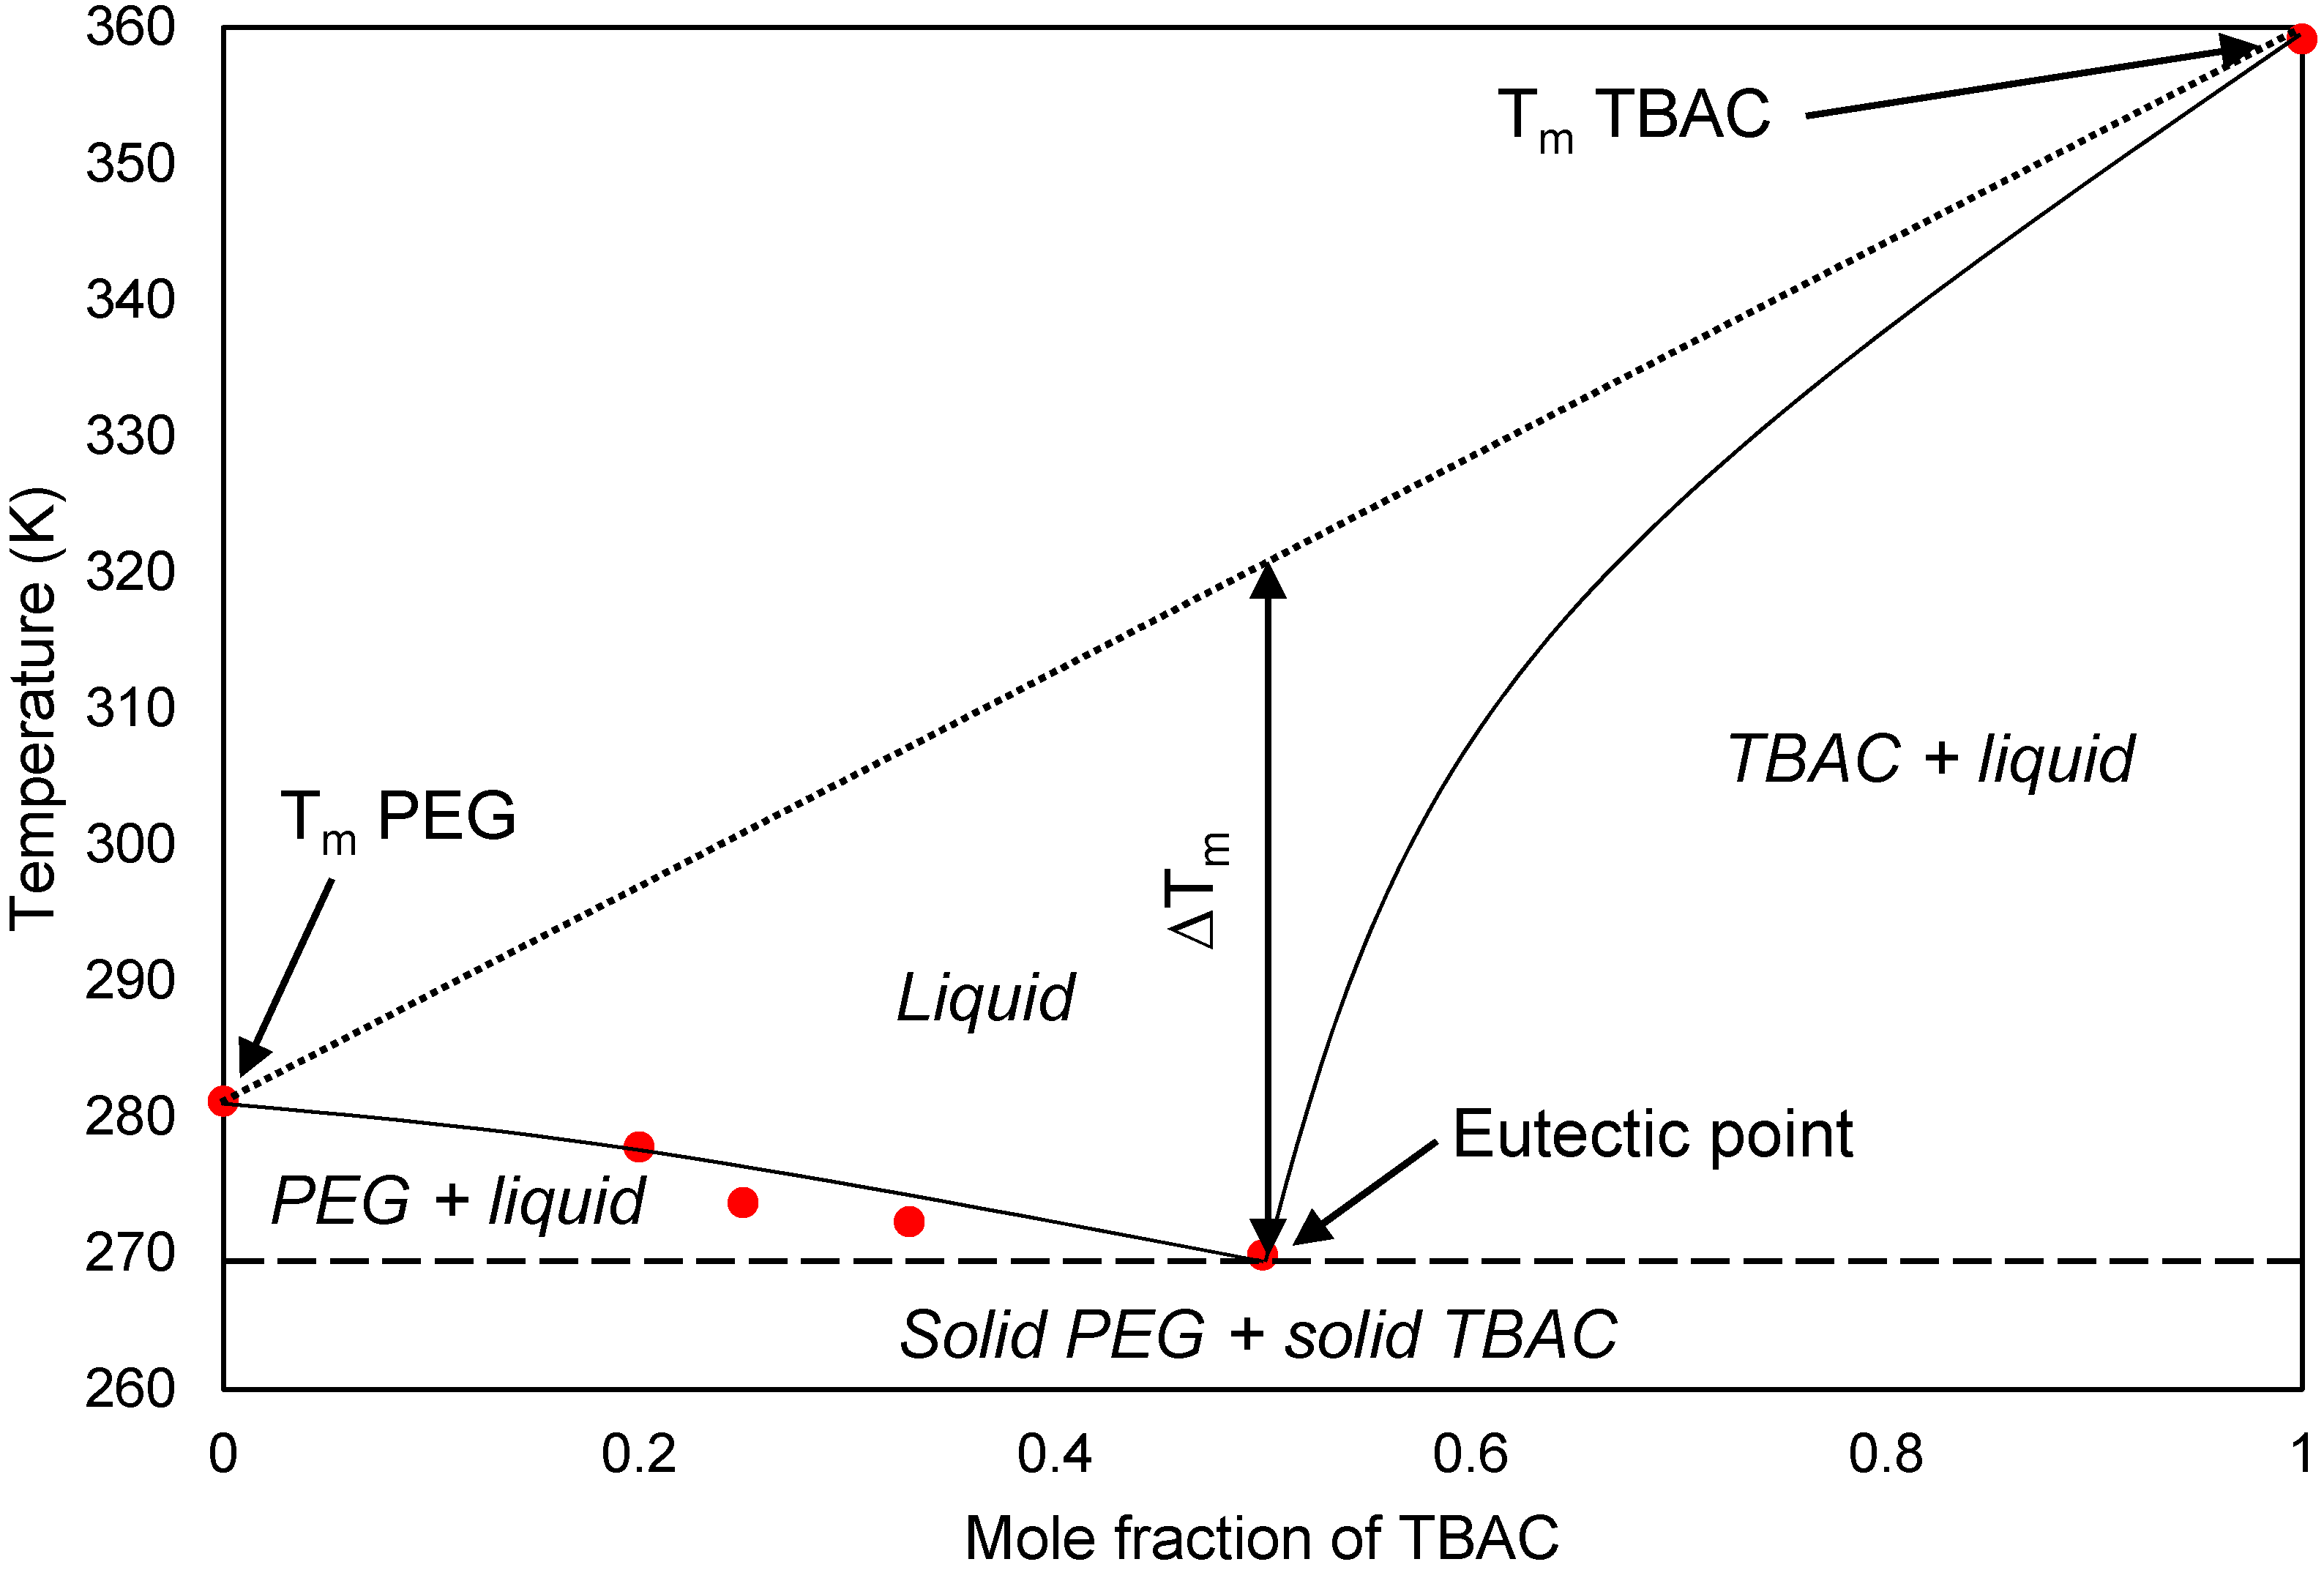
To locate the eutectic point of TBAC:PEG, a binary solid–liquid phase diagram was constructed using TBAC as reference point (Figure 4). The plots on the phase diagram can be calculated using TBAC mole fraction as in Equation (3):
ξ A = δ a δ a + δ b  
where ξ A is the molar fraction of TBAC, δ a is the mole numbers of TBAC, and δ b is the mole numbers of PEG. The phase diagram exhibited similar trend with other eutectic systems [40,41,42]. The eutectic point was detected at TBAC molar ratio of 0.5, which corresponds to TBAC:PEG (1:1) with a melting point of 269.85 K, whereas the melting points for pure components were 359.15 K and 281.15 K for TBAC and PEG, respectively. The decrease in melting point arose from the HBA-HBD intermolecular forces, however less amount of PEG was desirable to achieve the lowest possible melting temperature.

3.2. Statistical Analysis and Model Fitting

The performance of TBAC:PEG as extractant in EDS was examined via RSM. The three EDS parameters (DES mole ratio, DES volume ratio, and extraction temperature) and EE were included as input variables and output response, respectively. Table 3 represents the total experiment runs generated by the CCD design matrix. The prediction model was calculated from the ANOVA and the regression analysis to investigate the influences of each independent variables towards EE.

3.2.1. Analysis of Variance (ANOVA)

The prediction model of EE was constructed based on second-order polynomial equation as suggested by statistical model fit summary (Equation (4)):
y = + 73.94 1.69 A + 24.59 B 5.18 C + 0.32 A B 0.67 A C + 1.38 B C + 1.05 A 2 14.88 B 2 + 0.55 C 2  
where the positive and negative signs on each term represent the synergistic and antagonistic effects, respectively. The ANOVA report for this model is tabulated in Table 4. The significance of this model can be evaluated by Fischer values (F-test) and probability values (p-value). The model F-value of 605.55 indicated that the model was significant. There was only 0.01% probability that such a high F-value will occur due to noise. Model terms are significant if the p-value is less than 0.05. Therefore, A, B, C, BC, and B2 were identified as significant model terms. The most significant model term was DES volume ratio with the highest F-value of 4490.17 and lowest p-value (<0.0001). The reliability of the model was also influenced by the lack of fit F-value to ensure good prediction of EE. Based on ANOVA, the calculated lack of fit was 1.79, which was not significantly relative to the pure error. A possibility of 27% of large lack of fit F-value may occur due to noise.

3.2.2. Fit Statistics

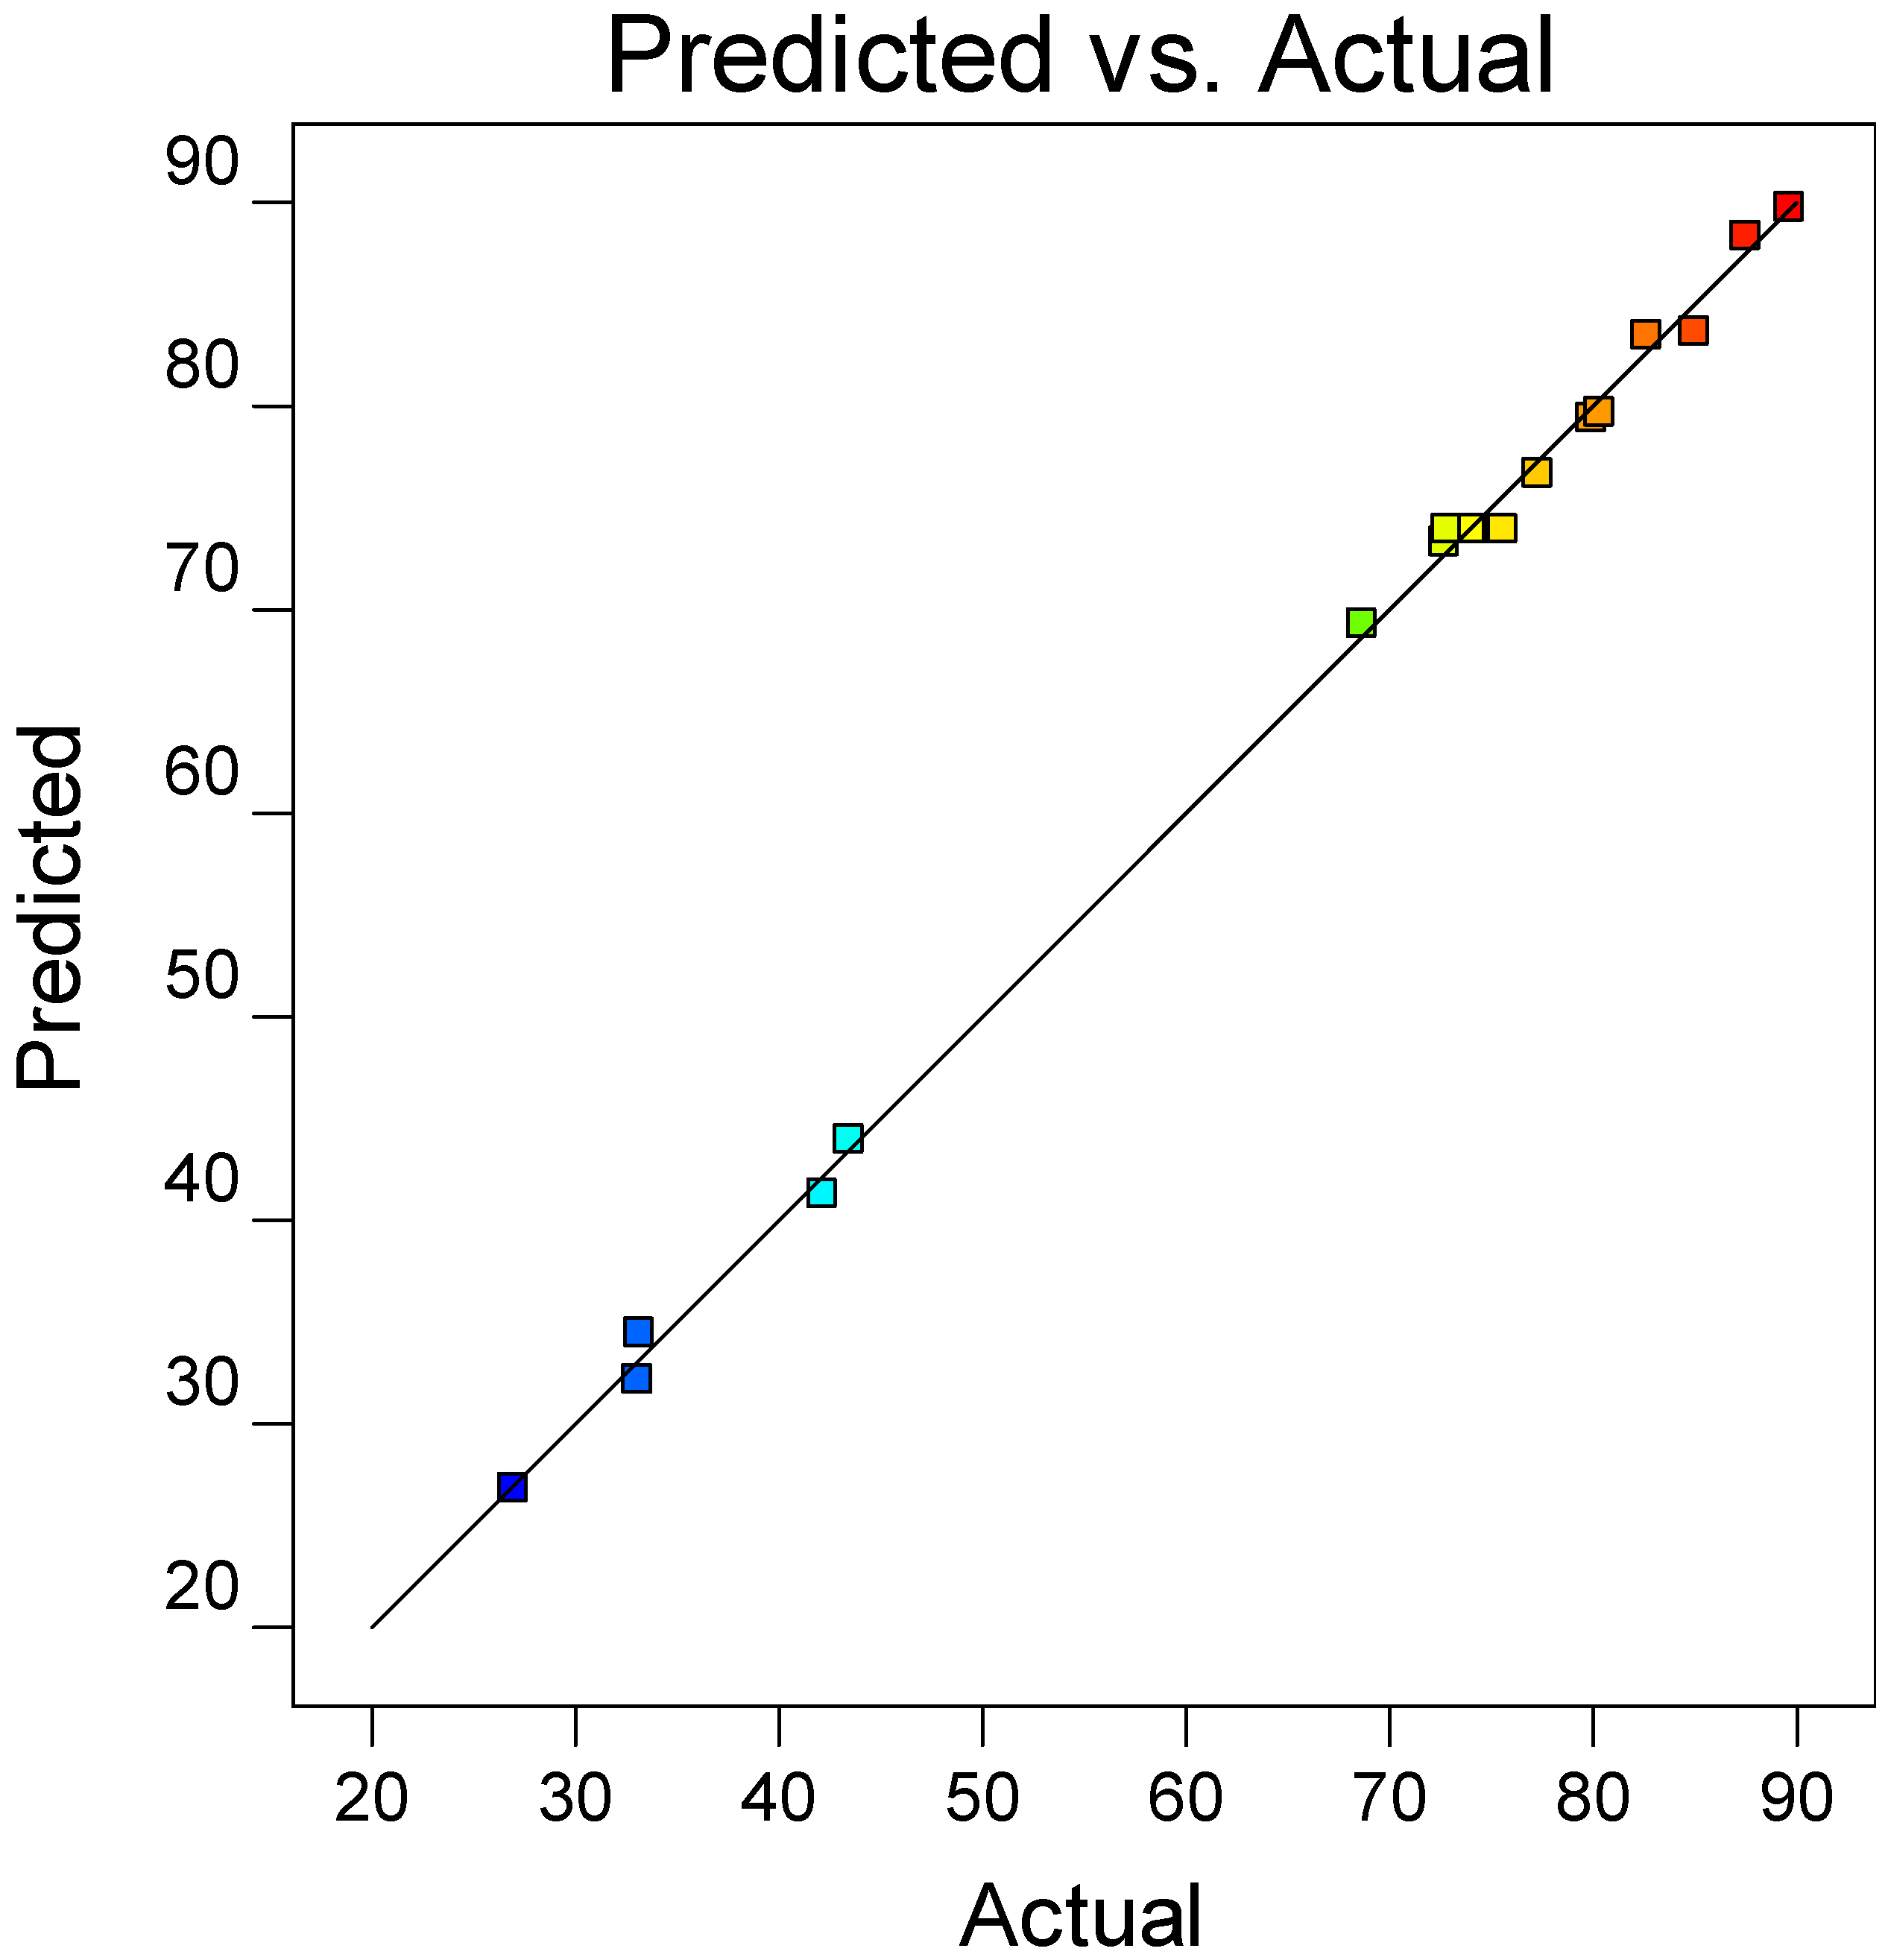
Regression measurement of the model was analyzed to ensure adequate accuracy between experimental data and predicted value. The statistical parameters of the fit statistics were presented in Table 5. The value of coefficient of determination (R2) was 0.9982, indicating that up to 99.82% of the total variables could be explained by the predicted model. A graphical description of the predicted versus actual value can be referred from the scattered plot in Figure 5. Removal of non-significant terms from the model is necessary to ensure minimum error between experimental and empirical value of output response. Considering the number of parameters in the model and degree of freedom, the value of R2 was adjusted to 0.9965, which led to a predicted R2 of 0.9852. Both values were in acceptable agreement since the difference was less than 0.2. Navigation of design space in this model can be carried out if the ratio of adequate precision, which determine the signal to noise ratio is higher than 4. The measured adequate precision was 76.68, indicating a satisfactory signal. In addition, the reproducibility of the experiment could be explained by the coefficient of variance (CV%) of regression model, which denotes the relative dispersion of actual data compared to predicted value. The CV% of the model was 1.72, suggesting that the model was valid for estimation of EE.

3.2.3. Effect of DES Volume Ratio

The relationship between two independent variables towards EE can be explained using 3D response surface plot and contour response. In brief, 3D response surface plot is a graphical representation of three variables using x, y, and z-scales while contour plot is the projection of 3D response surface plot on a two-dimensional plot.
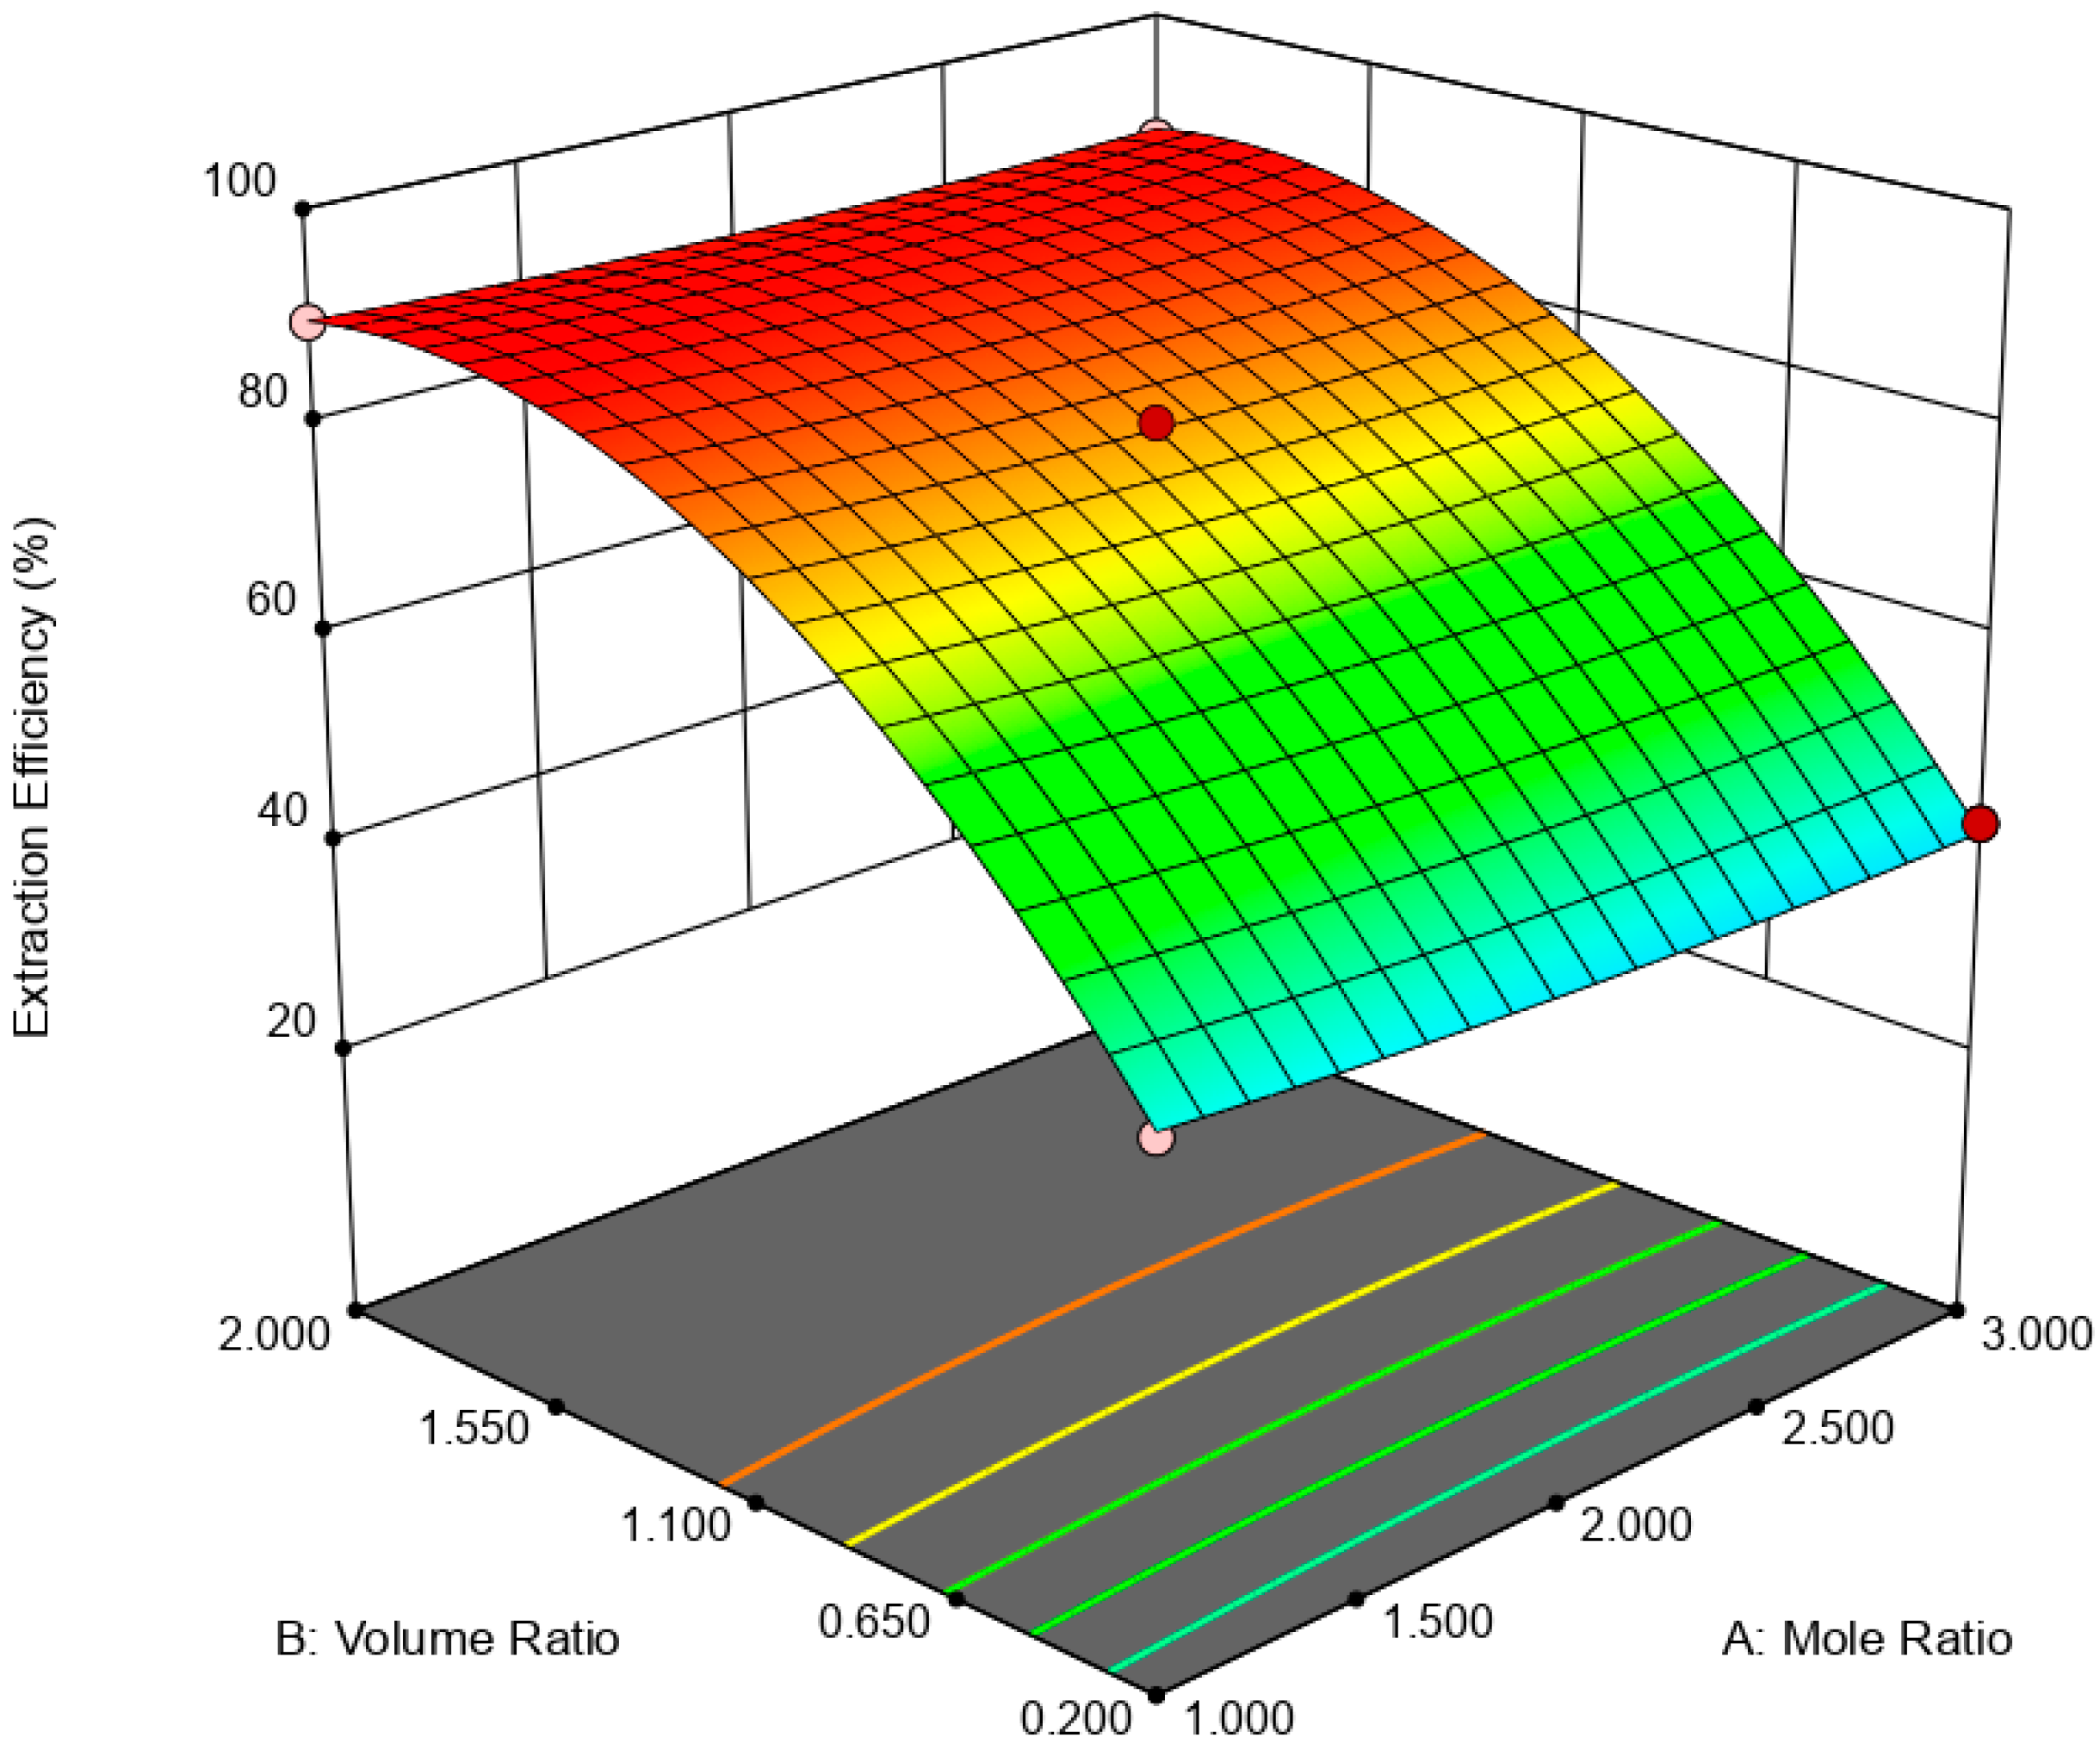
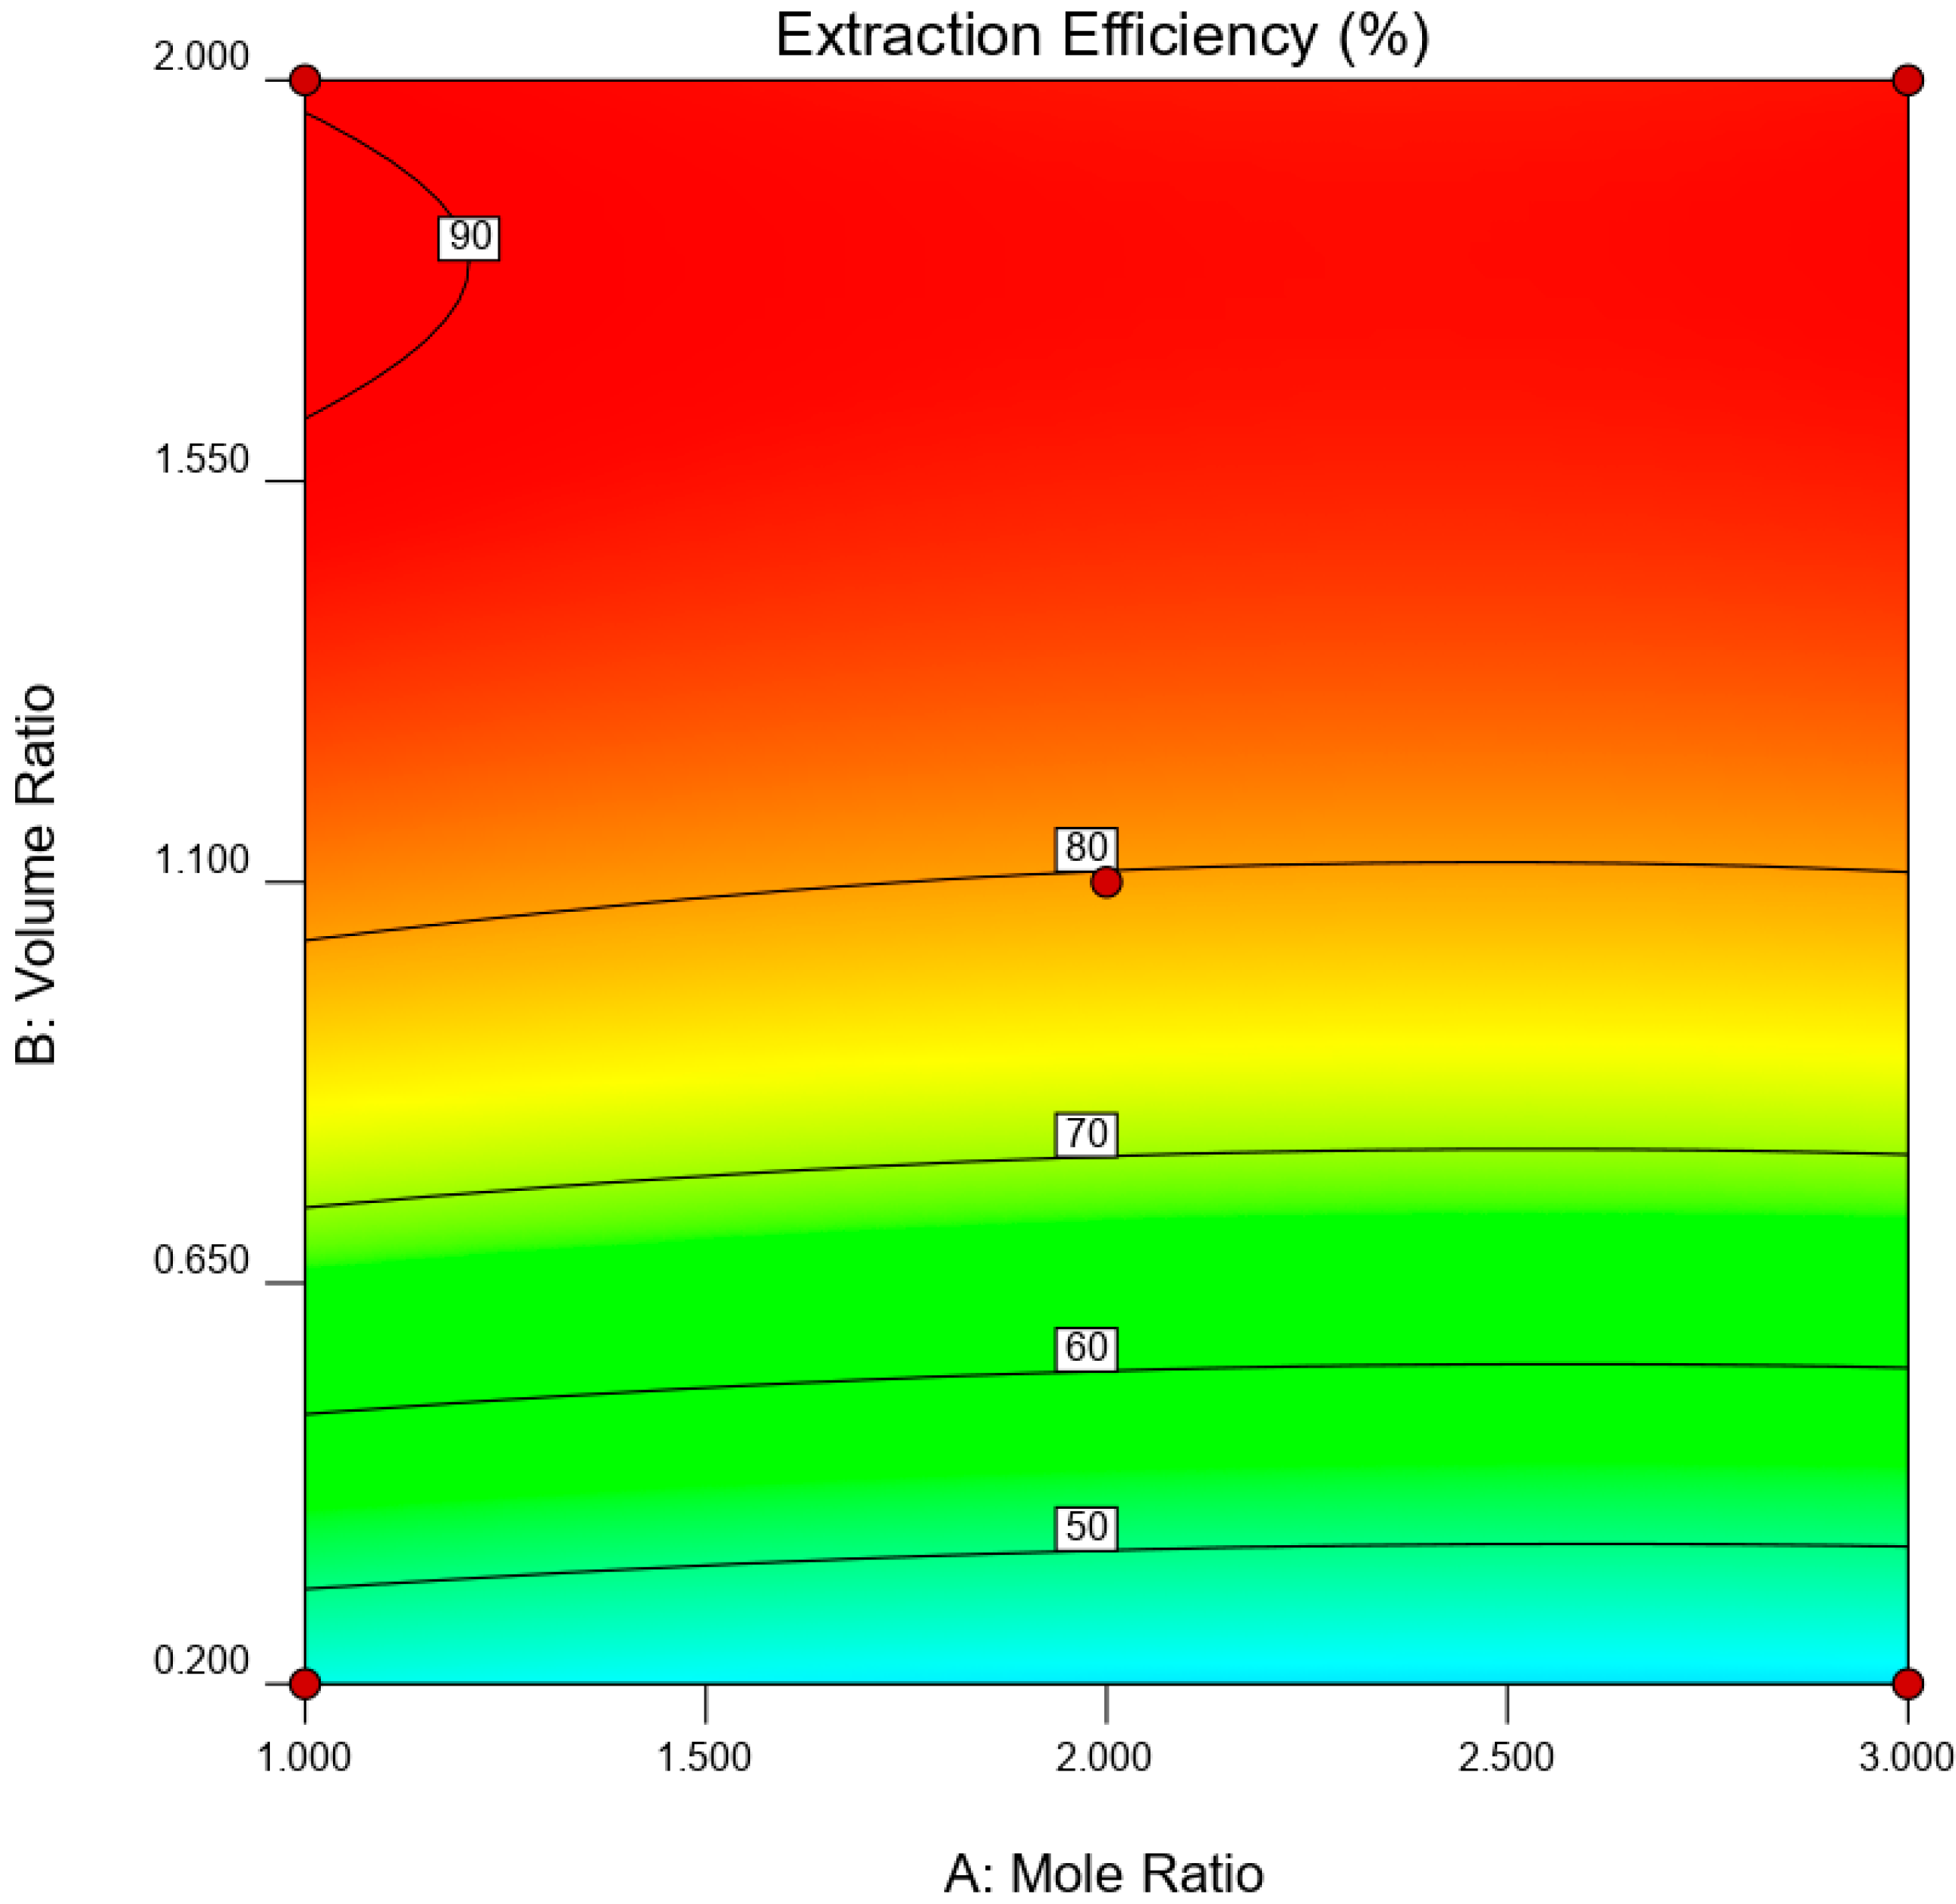
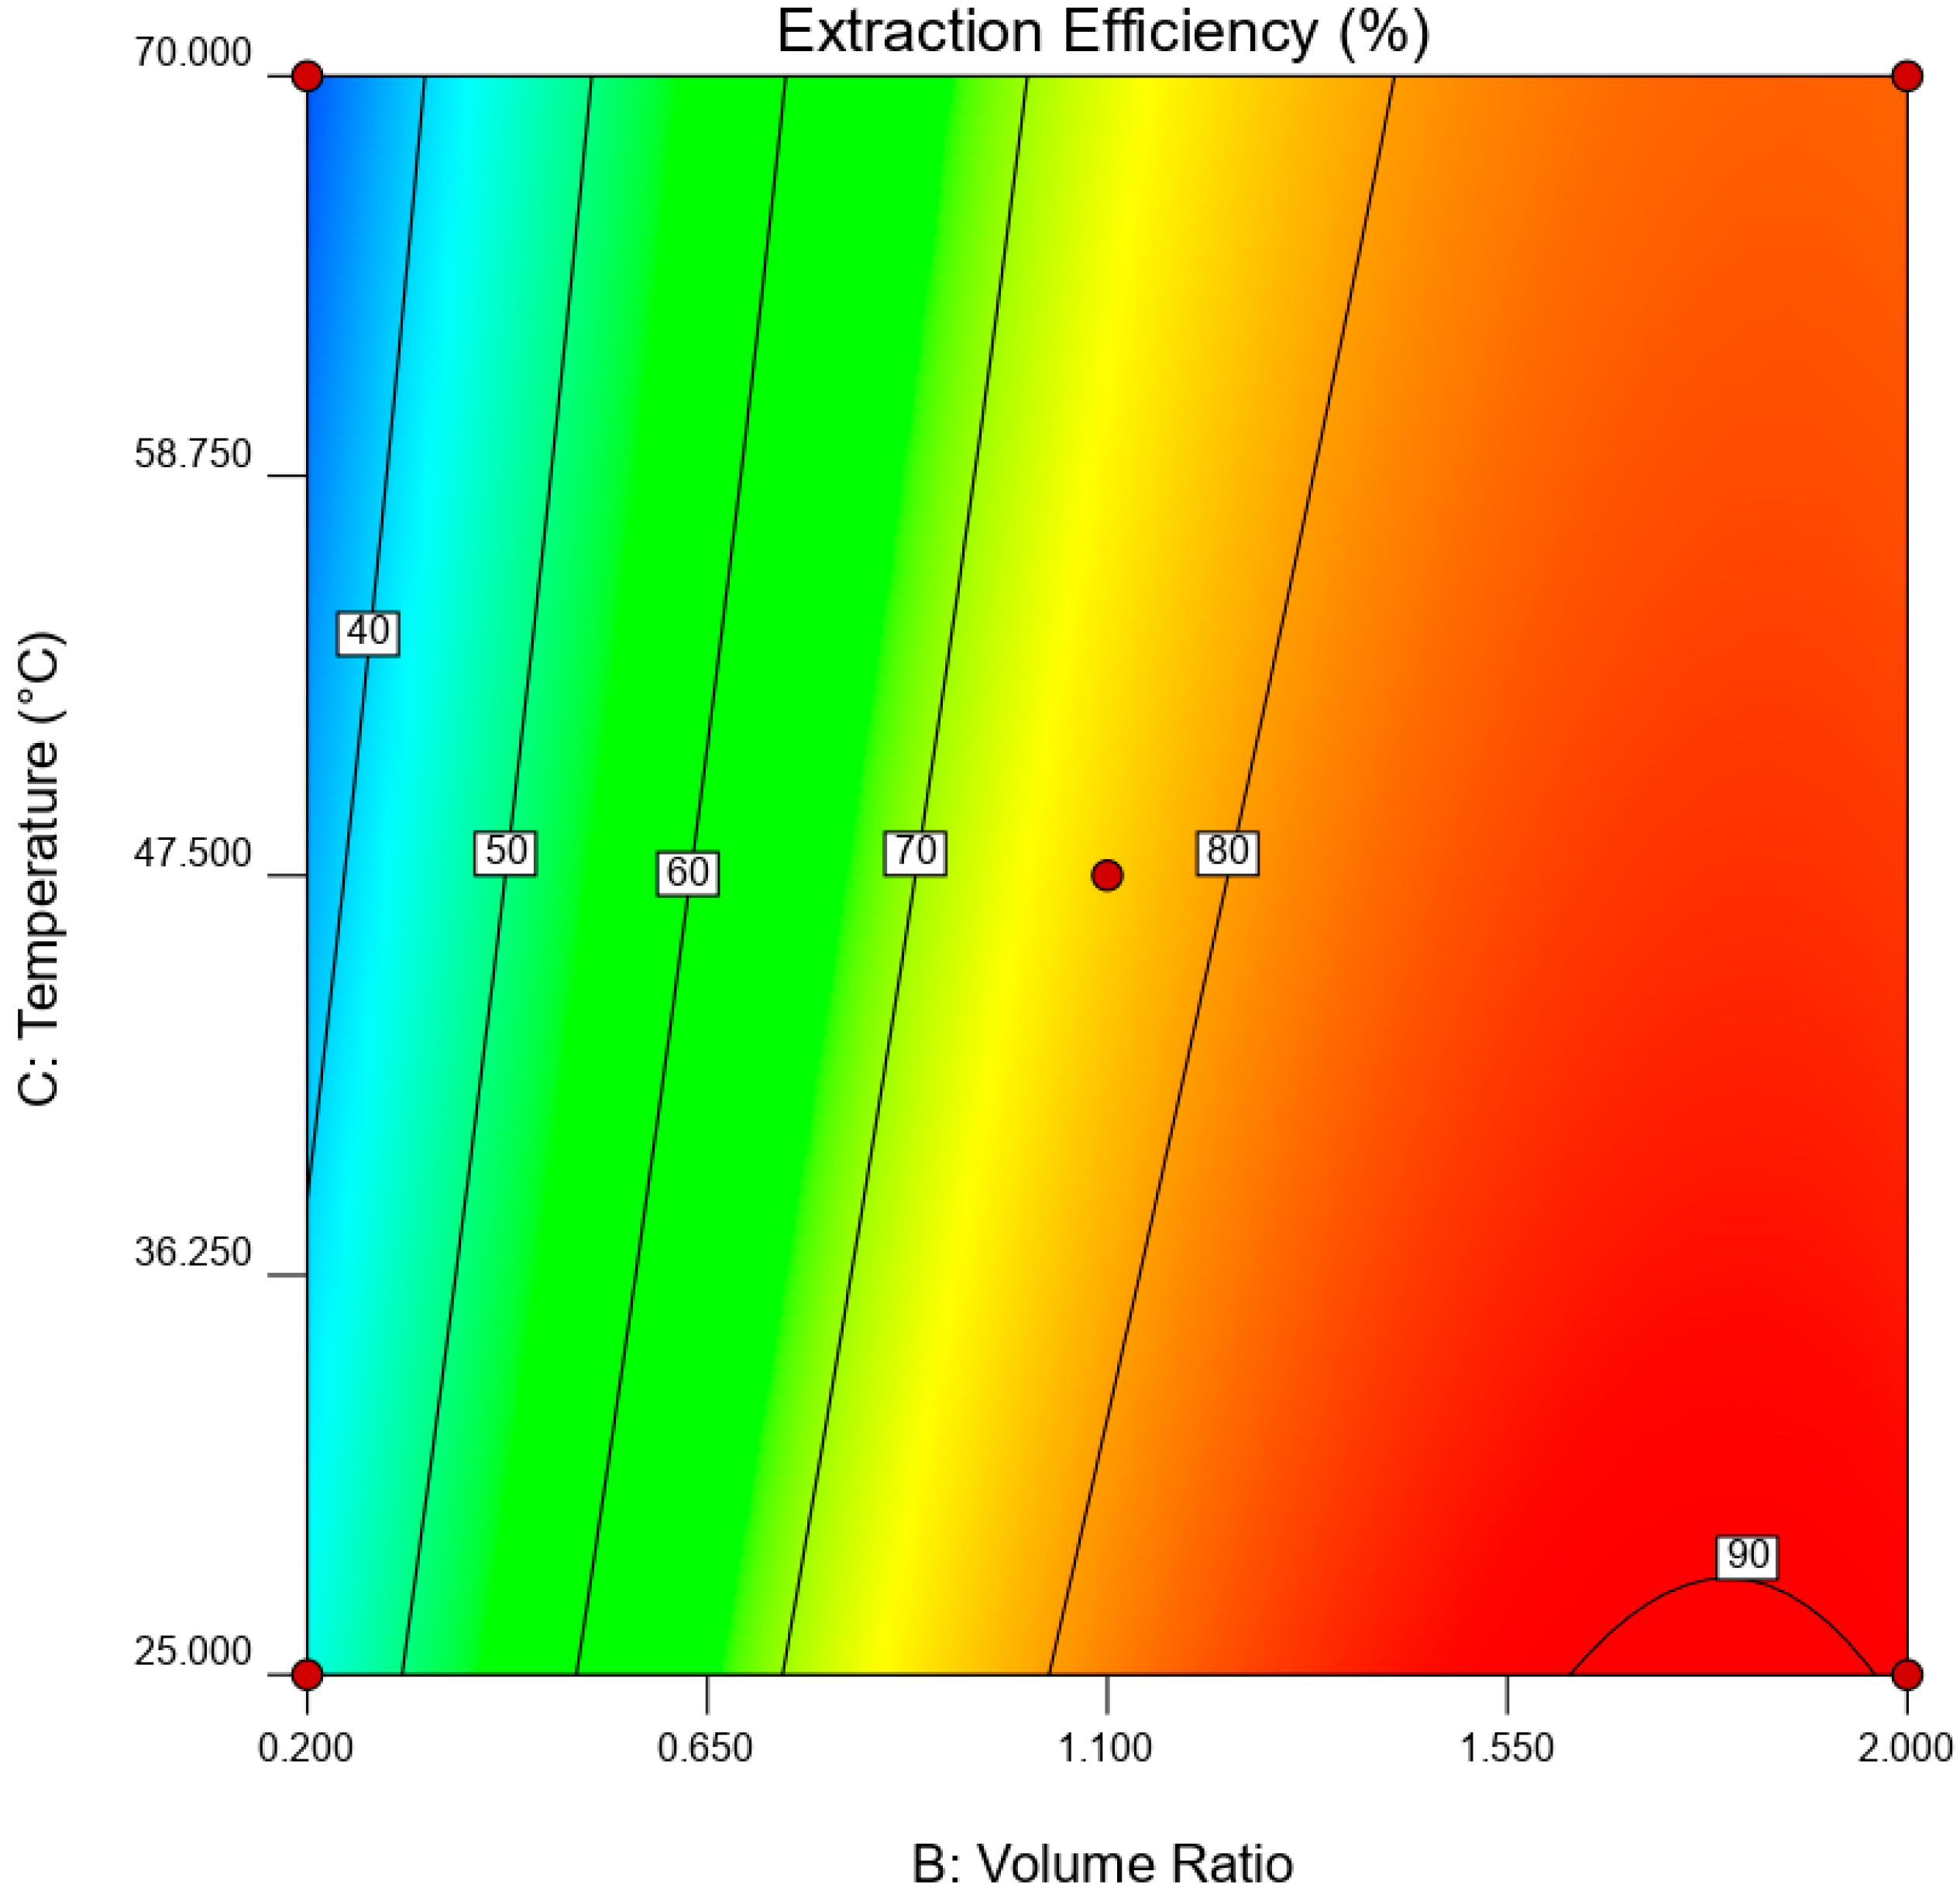
DES-to-oil-volume ratio was considered as the most influential factor in EDS system since it is closely related to the distribution ratio, D, of DES phase to oil phase. The effect of DES to oil volume ratio towards EE was investigated at 0.2–2.0 and the 3D visualization of the prediction points were illustrated in Figure 6 and Figure 7 which represents their combined effect with DES molar ratio and extraction time, respectively. It is clearly shown that at low DES molar ratio at room temperature, the EE increased tremendously as the volume ratio increased, however there was no significant increase as the volume ratio reached 1.55. This result indicates that the system had achieved equilibrium. Zhao et al. revealed that the yield rate of simulated fuel decreased dramatically as they increased the volume ratio of dimethylacetamide/dimethylformamide/methylene sulfone system to 2.5. They hypothesized that the reason for this trend arose from the occurrence of compatibility of simulated fuel and extractant [43]. Moreover, the use of large amount of extractant is undesirable and less economical for industrial practice. Nonetheless repeated extraction steps with minimum volume of extractant will significantly improve the EE. Estimation of optimum point can be further explained in contour response plot depicted in Figure 6 and Figure 7, respectively. When the amount of extractant increases, the predicted point lies at the red–yellow region, signalling a relatively high EE. The contour plot reported by Mokthar et al. and Almashjary et al. also confirmed the prediction of optimum point for extractant to oil volume ratio [19,37].

3.2.4. Effect of the Molar Ratio of DES

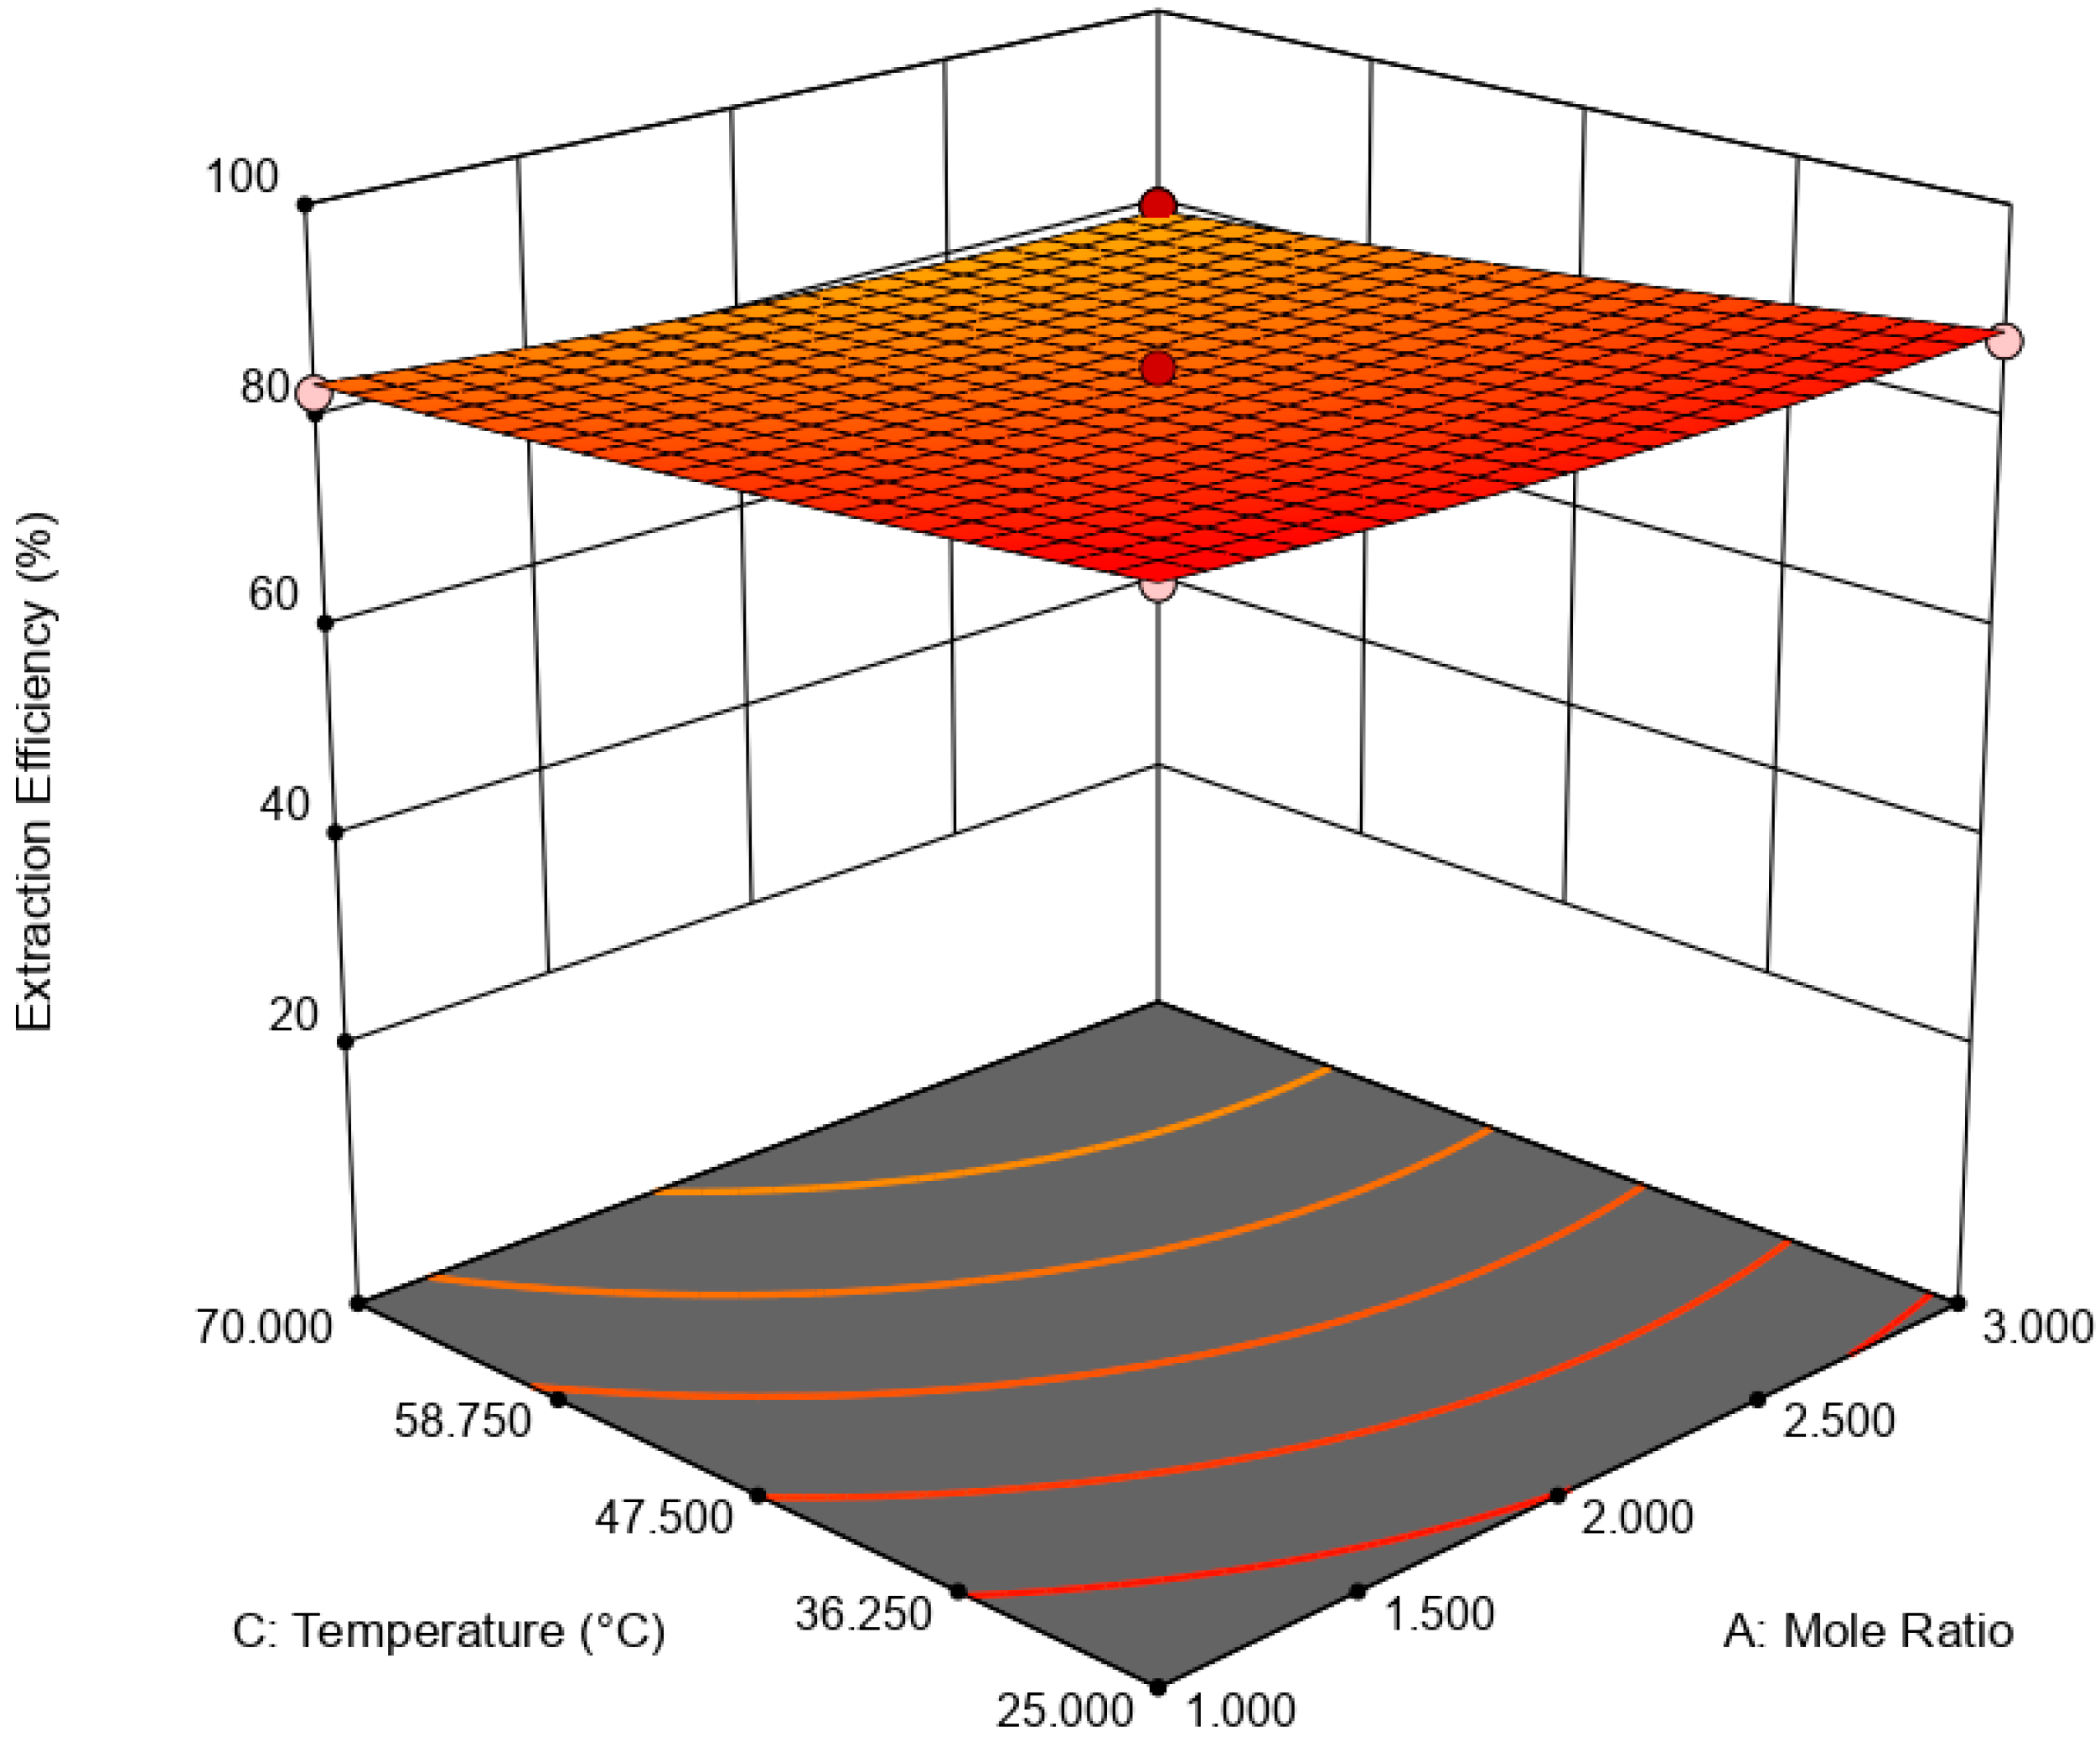
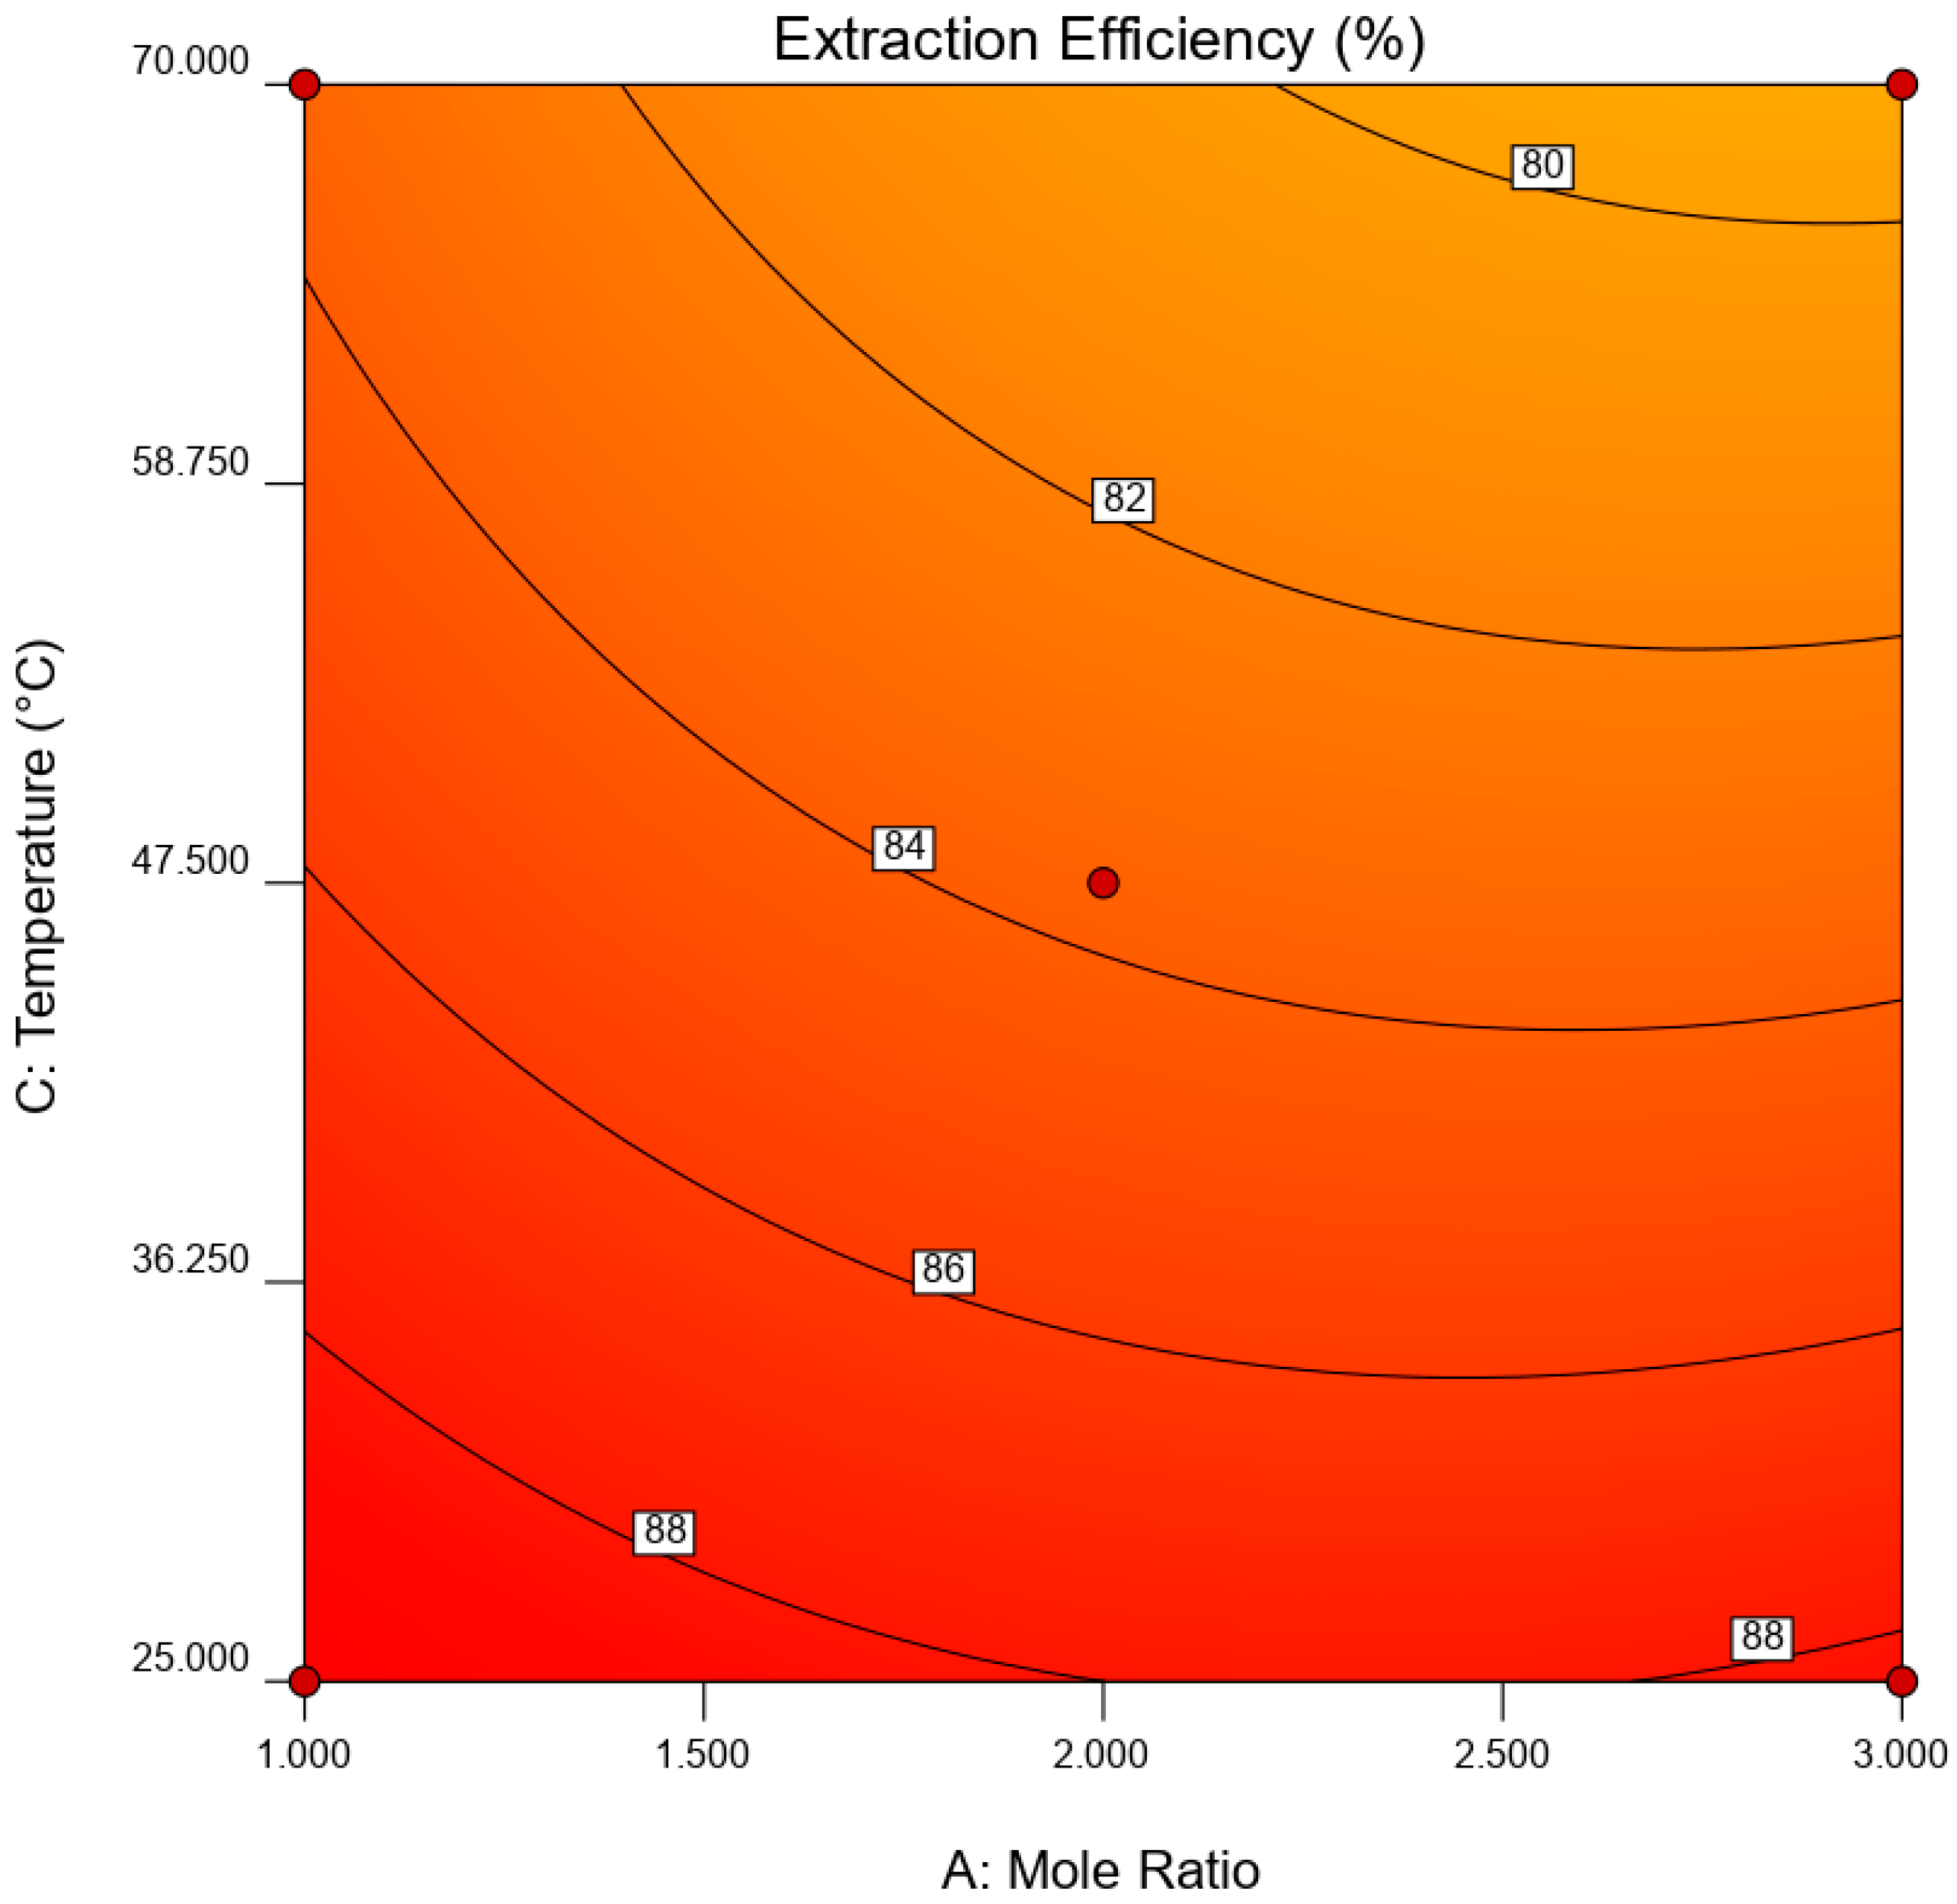
Understanding the influence of molar ratio of DES gives insight into the direct consequences of PEG molecules for sulfur removal. The range of DES molar ratio was fixed from 1 to 3 and their synergistic effect with DES volume ratio and extraction temperature towards EE were graphically described in Figure 8 and Figure 9, respectively. In any case, as the liquid polymer ratio increased from 1.0 to 2.5, a slight decrease in EE was observed. Further increase of EE was observed, however the increase was insignificant. The increase of EE might be attributed to the increase in hydrophilicity of DES. A report by H. Zhang et al. also confirms the gradual decrease of hydrophobicity of TBAC:PEG from molar ratio of 3:1 to 1:6 [44]. As the PEG molar ratio increased, more active hydroxyl groups were available to form hydrogen bonding with sulfur species. Moreover, since the EDS involves oxidant, the hydrophobicity of DBT will decrease, making it easier for DES to extract the more polar DBT. However, study on the hydrophobic/hydrophilic switchable DES can be further investigated to evaluate whether it can improve the overall EE considering the extraction of non-oxidized DBT during the extraction process. The reversible hydrophobic-hydrophilic transition might be beneficial especially for fuel oil recovery and regeneration of DES [45]. The combined effect from DES volume ratio and extraction temperature did not significantly diverge the observed trend. Almashjary et al. reported the contradict trend in the EE; when the molar ratio of ChCl:propionic acid increased from 1:2 to 1:3, the EE marginally increased from 65% to 67% [37]. Recent findings reported by Makoś and Boczkaj also mentioned the same trend when using phenolic-based DES using ChCl as HBA. Interestingly, the effect of DES molar ratio was also influenced by the type of sulfur compound. In their study, using DBT as the simulated fuel favors better EE in low DES molar ratio, compared to thiophene and benzothiophene [46]. The higher amount of HBD lad to the decrease in viscosity value, which consequently decreases the rate of sulfur removal. This was true when comparing to the viscosity of our studied liquid polymer DES towards EE.
Molecular dynamics simulation performed by Shah et al. also suggested that the main contribution of desulfurization was the HBA component of DES rather than HBD [39]. They stated that effective desulfurization can occur only when the interaction strength of oil and sulfur molecules decreased. Based on the simulation analysis, when the DES mixed with the oil, the interaction energy between oil and sulfur decreased, while strong intermolecular forces were formed in TBA-DBT system. On the other hand, PEG did not show any significant interaction towards DBT. The PEG however contributes to the melting point depression for the formation of DES. Interestingly, the melting point of DES has a direct effect towards EE. The highest EE corresponds to the lowest melting point of TBAC:PEG, while at slightly high melting point, the EE decreased accordingly. Further molecular simulation study should be carried out in future to explain the correlating behavior.

3.2.5. Effect of Extraction Temperature

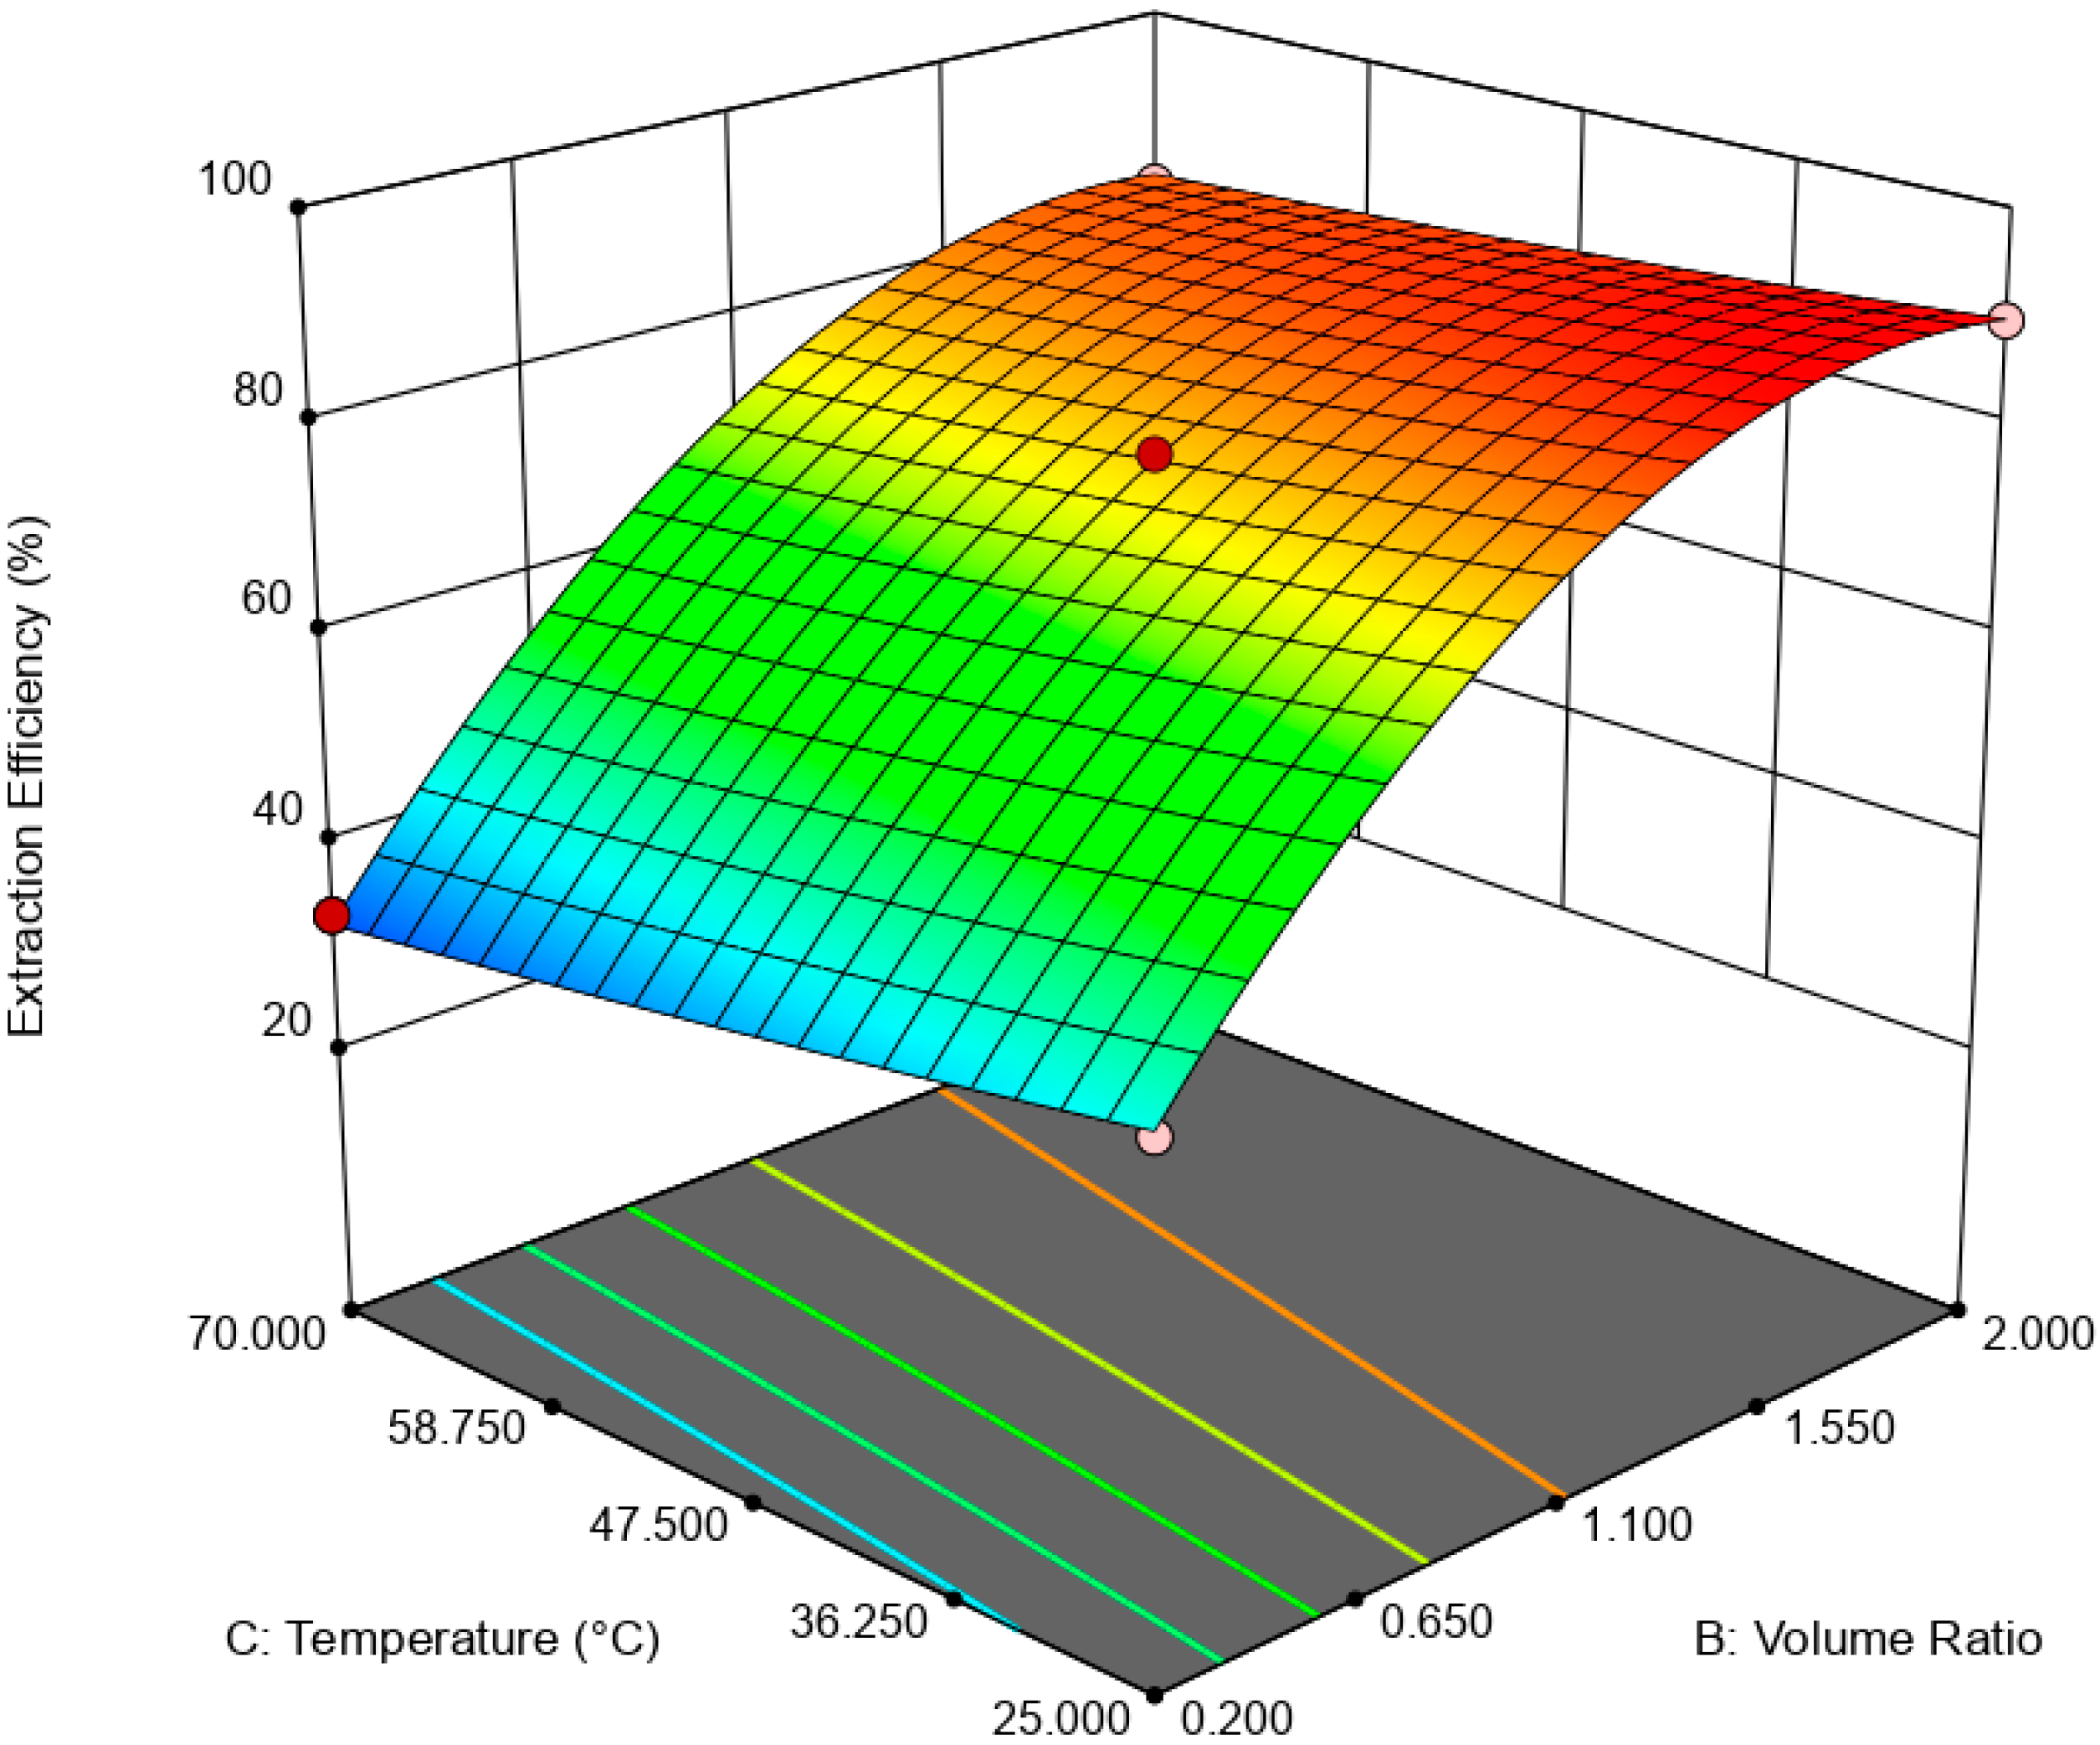
Minimum energy consumption is preferable to ensure sustainability and economic value of a separation process. In general, supplying heat to a system will increase the kinetics of extraction. However, high temperature causes formation of undesired biproducts. Therefore, optimization of extraction temperature should be taken into consideration for realization of EDS. Figure 10 and Figure 11, respectively, represent the response plot surface of extraction temperature combined with DES volume ratio. The temperature range was set from 25 to 70 °C. Based on the response surface plot, as temperature increased, the EE continued to decrease. The same trend was observed when the DES volume ratio increased. The model suggested that for an effective EDS, a low temperature is desirable. Makoś and Boczkaj revealed that the unfavorable extraction of DES at high temperature is due to the exothermic reaction between extractant and sulfur species, which gives a direct consequences towards their partition coefficient [46]. Moreover, in this system, oxidant was employed to convert DBT to DBT sulfone to promote the extraction of sulfur into the DES layer. High temperature may lead to the rapid decomposition of H2O2 to water, which hinders the effective extraction. Mokhtar et al. also stated that formation of sulfate was influenced by the high extraction temperature, which subsequently diminished the rate of sulfur removal [47]. The same trend was also recorded by Rahma et al. [36] and Xu et al. [33] when using TBAB:PEG and CoCl2:ChCl:PEG as extractant. Recent reports of EDS performance using conventional solvent and ionic liquids however showed different trends. Banisharif et al. reported an improvement of EE upon increasing the temperature from 60 to 80 °C when using 1-butyl-3-methylimidazolium methyl sulfate as extractant. Meanwhile, Khodadadi et al. utilized acetonitrile with graphene catalyst in ECODS system and they found that the EE was enhanced tremendously as the temperature increased up to 60 °C. This indicates that the effect of extraction temperature towards EE was influenced by the nature of solvent.
The decrease in EE as temperature increased when using DES can be explained by the interaction energy formed in the mixture. Shah et al. demonstrated the simulation of TBAC:PEG:FeCl3 as EDS extractant from 25 °C to 100 °C [39]. They observed that the interaction energy formed between DES and DBT was higher than DES-octane system. Moreover, the separation factor, S, which indicates the ratio of energy between DES/DBT to DBT/octane in the simulated fuel, decreased as heat was gradually applied. The simulation study suggested that capability of TBAC-PEG DES system in EDS is effective at low temperature, which is less energy-intensive.

3.2.6. Optimization of EDS

The realization of energy-friendly EDS system is essential for a feasible and cost-effective separation technology. To achieve this, desirability function was employed from the numerical optimization tool to maximize the EE. Table 6 represents the numerical optimization for each independent variable, and 37 solutions were suggested (Table S2). The combination, DES molar ratio of 1, DES volume ratio of 1, and extraction temperature of 25 °C, were selected as the best optimum point with desirability of 0.94 and the predicted EE was 79.01%. For confirmation test, the experimental values were compared to the empirical data and the values were tabulated in Table 7. A minimum relative error of 0.74% indicates a good agreement with the predicted model.

3.2.7. Comparison of Tested DES with Previous Literature

Table 8 shows the comparison of materials expenditure, DES mole ratio, DES volume ratio, extraction temperature, and EDS performance from literature with our optimized values. Our result shows that as high as 79.59% of sulfur could be removed at minimum DES molar ratio, DES volume ratio and ambient temperature. The sulfur removal is slightly lower than using TEA:OHBA (1:2) and TBAC:PEG (1:2) as extractant. Using ChCl as HBA can reduce the overall cost, however lower sulfur removal will be another issue. Moreover, when metal was included as the component of DES, the EDS performance could not be improved. The cost of metal is also expensive such as in CoCl2-ChCl:PEG, which is less economical when considering effective EE. Even though the price of TBAC is high, the overall cost will be reduced in mass production using automated assembly line production process. Additionally, sequential extraction process will ultimately direct the EE towards deep desulfurization. Compared to previous studies, which used excess amount of extractant and HBA, our optimized conditions could minimize the use of extractant. Meanwhile, the optimum usage of HBD was 1–2 ratio. Higher ratio of HBD might not beneficial for sulfur removal such as in ChCl:PA. In terms of extraction temperature, low temperature was preferable for practical EDS. Increasing the temperature will reduce the extraction capacity and hindering the mass transfer of sulfur species into extractant layer. However, conventional ionic liquid might need high temperature as this was attributed to difference in extraction thermodynamics. Despite the superior performance of DES in EDS, a systematic investigation of the ecological toxicity of TBAC:PEG is necessary as the cytotoxicity of final mixture of DES might significantly differ from their individual starting materials. This can be done via an in-silico-based approach to probe the toxicity of DES over various biological targets [48].

4. Conclusions

This paper demonstrated the application of TBAC:PEG as extractant in EDS system. The formation of TBAC:PEG led to the melting point depression, which resulted from the decrease in interaction energy between HBA and HBD component. Eutectic point in the eutectic system was observed in TBAC:PEG (1:1), the minimum PEG ratio tested. The performance of TBAC:PEG was analyzed via response surface methodology and the experiments were constructed by central-composite design. The statistical data revealed that the prediction model followed a second-order polynomial equation. Regression analysis also confirmed the good agreement of predicted value with actual data. The effect of three independent variables namely DES molar ratio, DES volume ratio, and extraction temperature towards EE were analyzed using response surface plot. In general, the most influential factor was DES volume ratio. This fact was further confirmed by the F-value of 4490.17, which implies the significance of term. Increasing the volume ratio could improve the EE, however at a volume ratio of 1.55, the effect was started to diminish. Meanwhile, high EE can be obtained at low DES molar ratio while excess PEG did not show significant improvement of the EE. The EDS system could be implemented at low temperature since high temperature decreases the EE tremendously. The desirability tool suggested that the optimum points for EDS system were located at DES volume ratio of 1.0, DES molar ratio of 1.0, and extraction temperature of 25 °C with predicted EE of 79.01%. Verification of model revealed that the experimental data has similar value with empirical data with relative error of 0.74%. As a conclusion, substituting conventional HDS with EDS could eliminate the use of energy-intensive process, which involves extremely high pressure and temperature in HDS and solve the problems to remove sterically hindered sulfur compounds. Although there are other non-conventional methods to remove sulfur, the advantages of EDS lied on its mild operating system, reusability of extractant, minimum loss of fuel quality, and practicability in industrial application. Extractant based on DES is likely to be a promising alternative compared to conventional organic solvent and ionic liquid due to its tunability, simple synthesis, low flammability, and effortless desulfurizing capability. Our findings show that implementing an optimization strategy in conducting experiments could yield best solution by studying the combined effect of two or more variables simultaneously. Analysis of their interrelationships permits the evaluation of interaction effects without the need for large and tedious set of experiments. Moreover, optimization based on factorial design permit the effect of a factor to be predicted at various levels of other factors, and hence providing valid conclusion over a range of experimental constrains. In a nutshell, these findings could provide valuable perspectives on the advancement of energy-friendly and economic EDS process for desulfurization technology as well as the importance of optimization process to maximize desulfurization efficiency.
Supplementary Materials

The following are available online at https://www.mdpi.com/2227-9717/8/7/848/s1, Table S1: Dynamic viscosity of TBAC:PEG at different mole ratios and temperature (Standard uncertainties, u are u(η) = ±0.32% mPa.s, u(T) = ±0.01 K), Table S2: Solutions for optimizing EE generated by the desirability tool.

Author Contributions

Funding acquisition, J.W.L.; investigation, M.F.M.; Methodology, A.N.M. and S.M.M.G.; project administration, H.F.M.Z.; resources, J.W.L.; software, M.F.M. and K.J.; supervision, H.F.M.Z. and C.F.K.; writing—original draft, M.F.M.; writing—review and editing, H.F.M.Z., H.Y., Y.Y., and B.Y. All authors have read and agreed to the published version of the manuscript.

Funding

Financial support by Yayasan Universiti Teknologi PETRONAS Grant (015LC0-047) and the International Grant awarded by Universitas Muhammadiyah Purwokerto (015ME0-094).

Acknowledgments

All authors gratefully acknowledge the financial support by Yayasan Universiti Teknologi PETRONAS Grant (015LC0-047) and an author, Jun Wei Lim, wishes to acknowledge the financial supports from the International Grant awarded by Universitas Muhammadiyah Purwokerto with grant number 015ME0-094.

Conflicts of Interest

The authors declare no conflict of interest.

References

  1. Chandra Srivastava, V. An evaluation of desulfurization technologies for sulfur removal from liquid fuels. RSC Adv. 2012, 2, 759–783. [Google Scholar] [CrossRef]
  2. Pimerzin, A.; Mozhaev, A.; Varakin, A.; Maslakov, K.; Nikulshin, P. Comparison of citric acid and glycol effects on the state of active phase species and catalytic properties of CoPMo/Al2O3 hydrotreating catalysts. Appl. Catal. B: Environ. 2017, 205, 93–103. [Google Scholar] [CrossRef]
  3. Karimi, E.; Yazdian, F.; Rasekh, B.; Jeffryes, C.; Rashedi, H.; Sepahi, A.A.; Shahmoradi, S.; Omidi, M.; Azizi, M.; Bidhendi, M.E.; et al. DBT desulfurization by decorating bacteria using modified carbon nanotube. Fuel 2018, 216, 787–795. [Google Scholar] [CrossRef]
  4. Ye, J.; Zhang, P.; Zhang, G.; Wang, S.; Nabi, M.; Zhang, Q.; Zhang, H. Biodesulfurization of high sulfur fat coal with indigenous and exotic microorganisms. J. Clean. Prod. 2018, 197, 562–570. [Google Scholar] [CrossRef]
  5. Chen, S.; Zhao, C.; Liu, Q.; Zang, M.; Liu, C.; Zhang, Y. Thermophilic biodesulfurization and its application in oil desulfurization. Appl. Microbiol. Biotechnol. 2018, 102, 9089–9103. [Google Scholar] [CrossRef]
  6. Neubauer, R.; Kienzl, N.; Hochenauer, C. Integration of an adsorptive desulfurization unit into an SOFC-based auxiliary power unit operated with diesel fuel. Chem. Eng. Res. Des. 2019, 141, 47–55. [Google Scholar] [CrossRef]
  7. Saleh, T.A.; Al-Hammadi, S.A.; Tanimu, A.; Alhooshani, K. Ultra-deep adsorptive desulfurization of fuels on cobalt and molybdenum nanoparticles loaded on activated carbon derived from waste rubber. J. Colloid Interface Sci. 2018, 513, 779–787. [Google Scholar] [CrossRef]
  8. Saleh, T.A. Simultaneous adsorptive desulfurization of diesel fuel over bimetallic nanoparticles loaded on activated carbon. J. Clean. Prod. 2018, 172, 2123–2132. [Google Scholar] [CrossRef]
  9. Li, H.; Zhang, B.; Jiang, W.; Zhu, W.; Zhang, M.; Wang, C.; Pang, J.; Li, H. A comparative study of the extractive desulfurization mechanism by Cu(II) and Zn-based imidazolium ionic liquids. Green Energy Environ. 2019, 4, 38–48. [Google Scholar] [CrossRef]
  10. Player, L.C.; Chan, B.; Lui, M.Y.; Masters, A.F.; Maschmeyer, T. Toward an Understanding of the Forces behind Extractive Desulfurization of Fuels with Ionic Liquids. ACS Sustain. Chem. Eng. 2019, 7, 4087–4093. [Google Scholar] [CrossRef]
  11. Gano, Z.S.; Mjalli, F.S.; Al-Wahaibi, T.; Al-Wahaibi, Y.; AlNashef, I.M. Extractive desulfurization of liquid fuel with FeCl3-based deep eutectic solvents: Experimental design and optimization by central-composite design. Chem. Eng. Process. Process Intensif. 2015, 93, 10–20. [Google Scholar] [CrossRef]
  12. Hayyan, M.; Alakrach, A.M.; Hayyan, A.; Hashim, M.A.; Hizaddin, H.F. Superoxide Ion as Oxidative Desulfurizing Agent for Aromatic Sulfur Compounds in Ionic Liquid Media. ACS Sustain. Chem. Eng. 2017, 5, 1854–1863. [Google Scholar] [CrossRef]
  13. Dizaji, A.K.; Mokhtarani, B.; Mortaheb, H.R. Deep and fast oxidative desulfurization of fuels using graphene oxide-based phosphotungstic acid catalysts. Fuel 2019, 236, 717–729. [Google Scholar] [CrossRef]
  14. Banisharif, F.; Dehghani, M.R.; Capel-Sanchez, M.C.; Campos-Martin, J.M. Highly catalytic oxidative desulfurization and denitrogenation of diesel using anchored-silica-gel vanadium-substituted Dawson-type polyoxometalate. Catal. Today 2019, 333, 219–225. [Google Scholar] [CrossRef]
  15. Julião, D.; Gomes, A.C.; Pillinger, M.; Valença, R.; Ribeiro, J.C.; Gonçalves, I.S.; Balula, S.S. Desulfurization of fuel by extraction and sulfoxidation using H2O2 and [CpMo(CO)3R] as catalysts. Appl. Catal. B Environ. 2018, 230, 177–183. [Google Scholar] [CrossRef]
  16. Gao, S.; Chen, X.; Xi, X.; Abro, M.; Afzal, W.; Abro, R.; Yu, G. Coupled Oxidation-Extraction Desulfurization: A Novel Evaluation for Diesel Fuel. ACS Sustain. Chem. Eng. 2019, 7, 5660–5668. [Google Scholar] [CrossRef]
  17. Dizaji, A.K.; Mortaheb, H.R.; Mokhtarani, B. Extractive-Catalytic Oxidative Desulfurization with Graphene Oxide-Based Heteropolyacid Catalysts: Investigation of Affective Parameters and Kinetic Modeling. Catal. Lett. 2019, 149, 259–271. [Google Scholar] [CrossRef]
  18. Banisharif, F.; Dehghani, M.R.; Capel-Sánchez, M.C.; Campos-Martin, J.M. Desulfurization of Fuel by Extraction and Catalytic Oxidation Using a Vanadium Substituted Dawson-Type Emulsion Catalyst. Ind. Eng. Chem. Res. 2017, 56, 3839–3852. [Google Scholar] [CrossRef]
  19. Mokhtar, W.N.A.W.; Bakar, W.A.W.A.; Ali, R.; Kadir, A.A.A. Optimization of extractive desulfurization of Malaysian diesel fuel using response surface methodology/Box-Behnken design. J. Ind. Eng. Chem. 2015, 30, 274–280. [Google Scholar] [CrossRef]
  20. Ibrahim, M.H.; Hayyan, M.; Hashim, M.A.; Hayyan, A. The role of ionic liquids in desulfurization of fuels: A review. Renew. Sustain. Energy Rev. 2017, 76, 1534–1549. [Google Scholar] [CrossRef]
  21. Mohd Zaid, H.F.; Chong, F.K.; Abdul Mutalib, M.I. Extractive deep desulfurization of diesel using choline chloride-glycerol eutectic-based ionic liquid as a green solvent. Fuel 2017, 192, 10–17. [Google Scholar] [CrossRef]
  22. Stolarska, O.; Soto, A.; Rodríguez, H.; Smiglak, M. Thermal behaviour of mixtures of 1-alkylpyridinium halides with and without a common ion. J. Mol. Liq. 2018, 268, 781–790. [Google Scholar] [CrossRef]
  23. Liu, L.; Li, Z.; Hou, W.; Shen, H. Direct conversion of lignocellulose to levulinic acid catalyzed by ionic liquid. Carbohydr. Polym. 2017, 181, 778–784. [Google Scholar] [CrossRef] [PubMed]
  24. Penín, L.; Peleteiro, S.; Yáñez, R.; Parajó, J.C.; Santos, V. Kinetics of 5-Hydroxymethylfurfural production from monosaccharides in media containing an ionic liquid and a solid acid catalyst. BioResources 2017, 12, 8402–8418. [Google Scholar] [CrossRef]
  25. Zhang, H.; Zhang, Q.; Zhang, L.; Pei, T.; Dong, L.; Zhou, P.; Li, C.; Xia, L. Acidic polymeric ionic liquids based reduced graphene oxide: An efficient and rewriteable catalyst for oxidative desulfurization. Chem. Eng. J. 2018, 334, 285–295. [Google Scholar] [CrossRef]
  26. Kianpour, E.; Azizian, S.; Yarie, M.; Zolfigol, M.A.; Bayat, M. A task-specific phosphonium ionic liquid as an efficient extractant for green desulfurization of liquid fuel: An experimental and computational study. Chem. Eng. J. 2016, 295, 500–508. [Google Scholar] [CrossRef]
  27. Houda, S.; Lancelot, C.; Blanchard, P.; Poinel, L.; Lamonier, C. Oxidative Desulfurization of Heavy Oils with High Sulfur Content: A Review. Catalysts 2018, 8, 344. [Google Scholar] [CrossRef] [Green Version]
  28. Abbott, A.P.; Capper, G.; Davies, D.L.; Munro, H.L.; Rasheed, R.K.; Tambyrajah, V. Preparation of novel, moisture-stable, lewis-acidic ionic liquids containing quaternary ammonium salts with functional side chains. Chem. Commun. 2001, 19, 2010–2011. [Google Scholar] [CrossRef] [Green Version]
  29. Smith, E.L.; Abbott, A.P.; Ryder, K.S. Deep Eutectic Solvents (DESs) and Their Applications. Chem. Rev. 2014, 114, 11060–11082. [Google Scholar] [CrossRef] [Green Version]
  30. Khodadadi Dizaji, A.; Mortaheb, H.R.; Mokhtarani, B. Complete oxidative desulfurization using graphene oxide-based phosphomolybdic acid catalyst: Process optimization by two phase mass balance approach. Chem. Eng. J. 2018, 335, 362–372. [Google Scholar] [CrossRef]
  31. Gajardo-Parra, N.F.; Lubben, M.J.; Winnert, J.M.; Leiva, Á.; Brennecke, J.F.; Canales, R.I. Physicochemical properties of choline chloride-based deep eutectic solvents and excess properties of their pseudo-binary mixtures with 1-butanol. J. Chem. Thermodyn. 2019, 133, 272–284. [Google Scholar] [CrossRef]
  32. Li, C.; Li, D.; Zou, S.; Li, Z.; Yin, J.; Wang, A.; Cui, Y.; Yao, Z.; Zhao, Q. Extraction desulfurization process of fuels with ammonium-based deep eutectic solvents. Green Chem. 2013, 15, 2793–2799. [Google Scholar] [CrossRef]
  33. Xu, H.; Zhang, D.; Wu, F.; Wei, X.; Zhang, J. Deep desulfurization of fuels with cobalt chloride-choline chloride/polyethylene glycol metal deep eutectic solvents. Fuel 2018, 225, 104–110. [Google Scholar] [CrossRef]
  34. Lima, F.; Gouvenaux, J.; Branco, L.C.; Silvestre, A.J.D.; Marrucho, I.M. Towards a sulfur clean fuel: Deep extraction of thiophene and dibenzothiophene using polyethylene glycol-based deep eutectic solvents. Fuel 2018, 234, 414–421. [Google Scholar] [CrossRef]
  35. Morshedi, A.; Akbarian, M. Application of Response Surface Methodology: Design of Experiments and Optimization: A Mini Review. Indian J. Fundam. Appl. Life Sci. 2014, 4, 2434–2439. [Google Scholar]
  36. Ahmed Rahma, W.S.; Mjalli, F.S.; Al-Wahaibi, T.; Al-Hashmi, A.A. Polymeric-based deep eutectic solvents for effective extractive desulfurization of liquid fuel at ambient conditions. Chem. Eng. Res. Des. 2017, 120, 271–283. [Google Scholar] [CrossRef]
  37. Almashjary, K.H.; Khalid, M.; Dharaskar, S.; Jagadish, P.; Walvekar, R.; Gupta, T.C.S.M. Optimisation of extractive desulfurization using Choline Chloride-based deep eutectic solvents. Fuel 2018, 234, 1388–1400. [Google Scholar] [CrossRef]
  38. Tang, W.; Row, K.H. Design and evaluation of polarity controlled and recyclable deep eutectic solvent based biphasic system for the polarity driven extraction and separation of compounds. J. Clean. Prod. 2020, 268, 122306. [Google Scholar] [CrossRef]
  39. Shah, D.; Gapeyenko, D.; Urakpayev, A.; Torkmahalleh, M. Molecular dynamics simulations on extractive desulfurization of fuels by tetrabutylammonium chloride based Deep Eutectic Solvents. J. Mol. Liq. 2019, 274, 254–260. [Google Scholar] [CrossRef]
  40. Crespo, E.A.; Silva, L.P.; Martins, M.A.R.; Bülow, M.; Ferreira, O.; Sadowski, G.; Held, C.; Pinho, S.P.; Coutinho, J.A.P. The Role of Polyfunctionality in the Formation of [Ch]Cl-Carboxylic Acid-Based Deep Eutectic Solvents. Ind. Eng. Chem. Res. 2018, 57, 11195–11209. [Google Scholar] [CrossRef]
  41. Crespo, E.A.; Silva, L.P.; Martins, M.A.R.; Fernandez, L.; Ortega, J.; Ferreira, O.; Sadowski, G.; Held, C.; Pinho, S.P.; Coutinho, J.A.P. Characterization and Modeling of the Liquid Phase of Deep Eutectic Solvents Based on Fatty Acids/Alcohols and Choline Chloride. Ind. Eng. Chem. Res. 2017, 56, 12192–12202. [Google Scholar] [CrossRef] [Green Version]
  42. Abranches, D.O.; Martins, M.A.R.; Silva, L.P.; Schaeffer, N.; Pinho, S.P.; Coutinho, J.A.P. Phenolic hydrogen bond donors in the formation of non-ionic deep eutectic solvents: The quest for type V DES. Chem. Commun. 2019, 55, 10253–10256. [Google Scholar] [CrossRef] [PubMed] [Green Version]
  43. Zhao, K.; Cheng, Y.; Liu, H.; Yang, C.; Qiu, L.; Zeng, G.; He, H. Extractive desulfurization of dibenzothiophene by a mixed extractant of N,N-dimethylacetamide, N,N-dimethylformamide and tetramethylene sulfone: Optimization by Box-Behnken design. RSC Adv. 2015, 5, 66013–66023. [Google Scholar] [CrossRef]
  44. Zhang, H.; Wang, Y.; Zhou, Y.; Xu, K.; Li, N.; Wen, Q.; Yang, Q. Aqueous biphasic systems containing PEG-based deep eutectic solvents for high-performance partitioning of RNA. Talanta 2017, 170, 266–274. [Google Scholar] [CrossRef]
  45. Tang, W.; Ho Row, K. Evaluation of CO2-induced azole-based switchable ionic liquid with hydrophobic/hydrophilic reversible transition as single solvent system for coupling lipid extraction and separation from wet microalgae. Bioresour. Technol. 2020, 296, 122309. [Google Scholar] [CrossRef]
  46. Makoś, P.; Boczkaj, G. Deep eutectic solvents based highly efficient extractive desulfurization of fuels – Eco-friendly approach. J. Mol. Liq. 2019, 296, 111916. [Google Scholar] [CrossRef]
  47. Mokhtar, W.N.A.W.; Bakar, W.A.W.A.; Ali, R.; Kadir, A.A.A. Optimization of oxidative desulfurization of Malaysian Euro II diesel fuel utilizing tert-butyl hydroperoxide-dimethylformamide system. Fuel 2015, 161, 26–33. [Google Scholar] [CrossRef]
  48. Halder, A.K.; Cordeiro, M.N.D.S. Probing the Environmental Toxicity of Deep Eutectic Solvents and Their Components: An In Silico Modeling Approach. ACS Sustain. Chem. Eng. 2019, 7, 10649–10660. [Google Scholar] [CrossRef]
  49. Lima, F.; Dave, M.; Silvestre, A.J.D.; Branco, L.C.; Marrucho, I.M. Concurrent Desulfurization and Denitrogenation of Fuels Using Deep Eutectic Solvents. ACS Sustain. Chem. Eng. 2019, 7, 11341–11349. [Google Scholar] [CrossRef]
  50. Zhao, X.; Zhu, G.; Jiao, L.; Yu, F.; Xie, C. Formation and Extractive Desulfurization Mechanisms of Aromatic Acid Based Deep Eutectic Solvents: An Experimental and Theoretical Study. Chem. A Eur. J. 2018, 24, 11021–11032. [Google Scholar] [CrossRef] [PubMed]
Figure 1. Fourier transformation infrared (FTIR) spectrum of tetrabutylammonium chloride (TBAC):poly(ethylene glycol) (PEG) deep eutectic solvent (DES) at hydroxyl group region. The shifting of stretching indicates formation of hydrogen bonding.
Processes 08 00848 g001
Figure 2. Viscosity against temperature curve of TBAC:PEG DES. The viscosity trend shows an exponentially decaying curve.
Processes 08 00848 g002
Figure 3. Heating curve of TBAC:PEG at different mole ratios.
Processes 08 00848 g003
Figure 4. The eutectic phase diagram of TBAC:PEG was plotted based on the different mole ratios of DES and its corresponding melting temperature. The red dots represent the mole fraction of TBAC. Original melting temperature of PEG and TBAC were indicated by red dot on the edges of graph. Melting point depression (∆Tm) was indicated between the red dot bounded by curve and dotted inclined line. The region beneath the horizontal dashed line was a mixture of solidified PEG and TBAC. Upon heating process, three distinctive phases were observed; PEG + liquid mixture (left side), a single liquid phase (middle), and TBAC + liquid mixture (right side).
Processes 08 00848 g004
Figure 5. Predicted values versus actual response of EE.
Processes 08 00848 g005
Figure 6. 3D response surface plot of effect of DES molar ratio and volume ratio towards EE.
Processes 08 00848 g006
Figure 7. Contour response plot of effect of DES molar ratio and volume ratio towards EE.
Processes 08 00848 g007
Figure 8. 3D response surface plot of effect of DES mole ratio and extraction temperature towards EE.
Processes 08 00848 g008
Figure 9. Contour response surface plot of effect of DES mole ratio and extraction temperature towards EE.
Processes 08 00848 g009
Figure 10. 3D response surface plot of effect of DES volume ratio and extraction temperature towards EE.
Processes 08 00848 g010
Figure 11. Contour response surface plot of effect of DES volume ratio and extraction temperature at DES 1 ratio towards EE.
Processes 08 00848 g011
Table 1. Range and levels of all extractive desulfurization system (EDS) parameters.
Independent VariablesUnitsRange and Levels
−10+1
DES mole ratio-123
DES volume ratio-0.21.12
Extraction temperature°C2547.570
Table 2. Melting point depression of DES components.
DESMelting Point (Tm)Melting Point Depression of HBA (∆TTBAC)Melting Point Depression of HBD (∆TPEG)
TBAC:PEG (1:1)269.8589.311.3
TBAC:PEG (1:2)272.386.858.85
TBAC:PEG (1:3)273.785.457.45
TBAC:PEG (1:4)277.881.353.35
Table 3. The central composite design (CCD) design matrix, actual, and predicted extraction efficiency (EE).
RunCoded ValuesActual ValuesExtraction Efficiency (%)
ABCABCActualPredicted
100021.147.572.8073.94
20102247.584.9783.65
300021.147.573.0273.94
4−10011.147.577.2876.68
5−1−1110.27033.0632.18
60−1020.247.533.1534.47
700121.17068.6569.31
800021.147.574.1673.94
91−1130.27026.9426.83
1000021.147.574.1473.94
1100−121.12580.3379.67
12−11−1122589.6489.75
1300021.147.573.9973.94
14−1−1−110.22543.4543.97
1510031.147.572.7073.31
16−111127082.6283.47
17111327079.9279.40
1800021.147.575.5673.94
1911−1322587.4888.35
201−1−130.22542.1541.29
Table 4. ANOVA for quadratic modelling of EE.
SourceSum of SquaresDegree of FreedomMean SquareF-Valuep-ValueCommentary
Model7338.119815.35605.55<0.0001significant
A—Mole Ratio28.44128.4421.120.0010
B—Volume Ratio6045.8616045.864490.17<0.0001
C—Temperature268.761268.76199.61<0.0001
AB0.818410.81840.60780.4537
AC3.5813.582.660.1341
BC15.19115.1911.280.0073
3.0313.032.250.1646
609.131609.13452.39<0.0001
0.820110.82010.60910.4532
Residual13.46101.35
Lack of Fit8.6351.731.790.2700not significant
Pure Error4.8350.9668
Correlation Total7351.5819
Table 5. Fit statistics of response surface methodology (RSM) model.
Statistical ParametersValue
Standard deviation1.16
Mean67.30
Coefficient of variance percentage1.72
0.9982
Adjusted R²0.9965
Predicted R²0.9852
Adequate Precision76.6819
Table 6. Numerical optimization of EDS parameters towards EE.
EDS ParameterGoalSolution
DES mole ratio (A)minimize1.00
DES volume ratio (B)in range1.00
Extraction temperature (C)minimize25.00
Table 7. Predicted and actual data for validation of statistical model.
NoPredicted EE (%)Actual EE (%)Relative Error (%)
179.0179.670.84
280.6872.11
378.9570.07
479.060.06
Average79.590.74
Table 8. Comparison price of raw material, mole ratio, DES volume ratio, extraction temperature, and performance of EDS using various DES in single extraction. The price of materials was presented as per kg and per L and based on the latest price by Sigma Aldrich. However, the price might differ when considering bulk production.
DESHBA Price ($)HBD Price ($)DES Mole RatioDES Volume RatioExtraction Temperature (°C)EE (%)Ref.
ChCl:PA a107/kg400/L1:333764.9[37]
[CH3(CH2)3]4PBr:FeCl3 b526/kg53.7/kg1:1.50.535064.1[11]
CoCl2I-ChClII:PEG c2172/kgI
107/kgII
46.3/L1:22 g DES: 6 g oil2074.4[33]
TBAC:Sul d1562/kg105/kg1:412567.0[49]
TEA:OHBA e102/L151.6/kg1:21.53081.04[50]
TBAC:PEG1562/kg48.2/L1:222582.83[32]
TBAC:PEG1562/kg48.2L1:112579.59This work
a Choline chloride:propionic acid; b Tetra-n-butylphosphonium bromide:ferric chloride; c Cobalt chloride-choline chloride:PEG; d Tetrabutylammonium chloride:sulfolane; e Triethylamine:o-hydroxybenzoic acid.