Effects of Ethanol Concentration on Organosolv Lignin Precipitation and Aggregation from Miscanthus x giganteus


Abstract
1. Introduction
2. Materials and Methods
2.1. Materials
2.2. Methodology
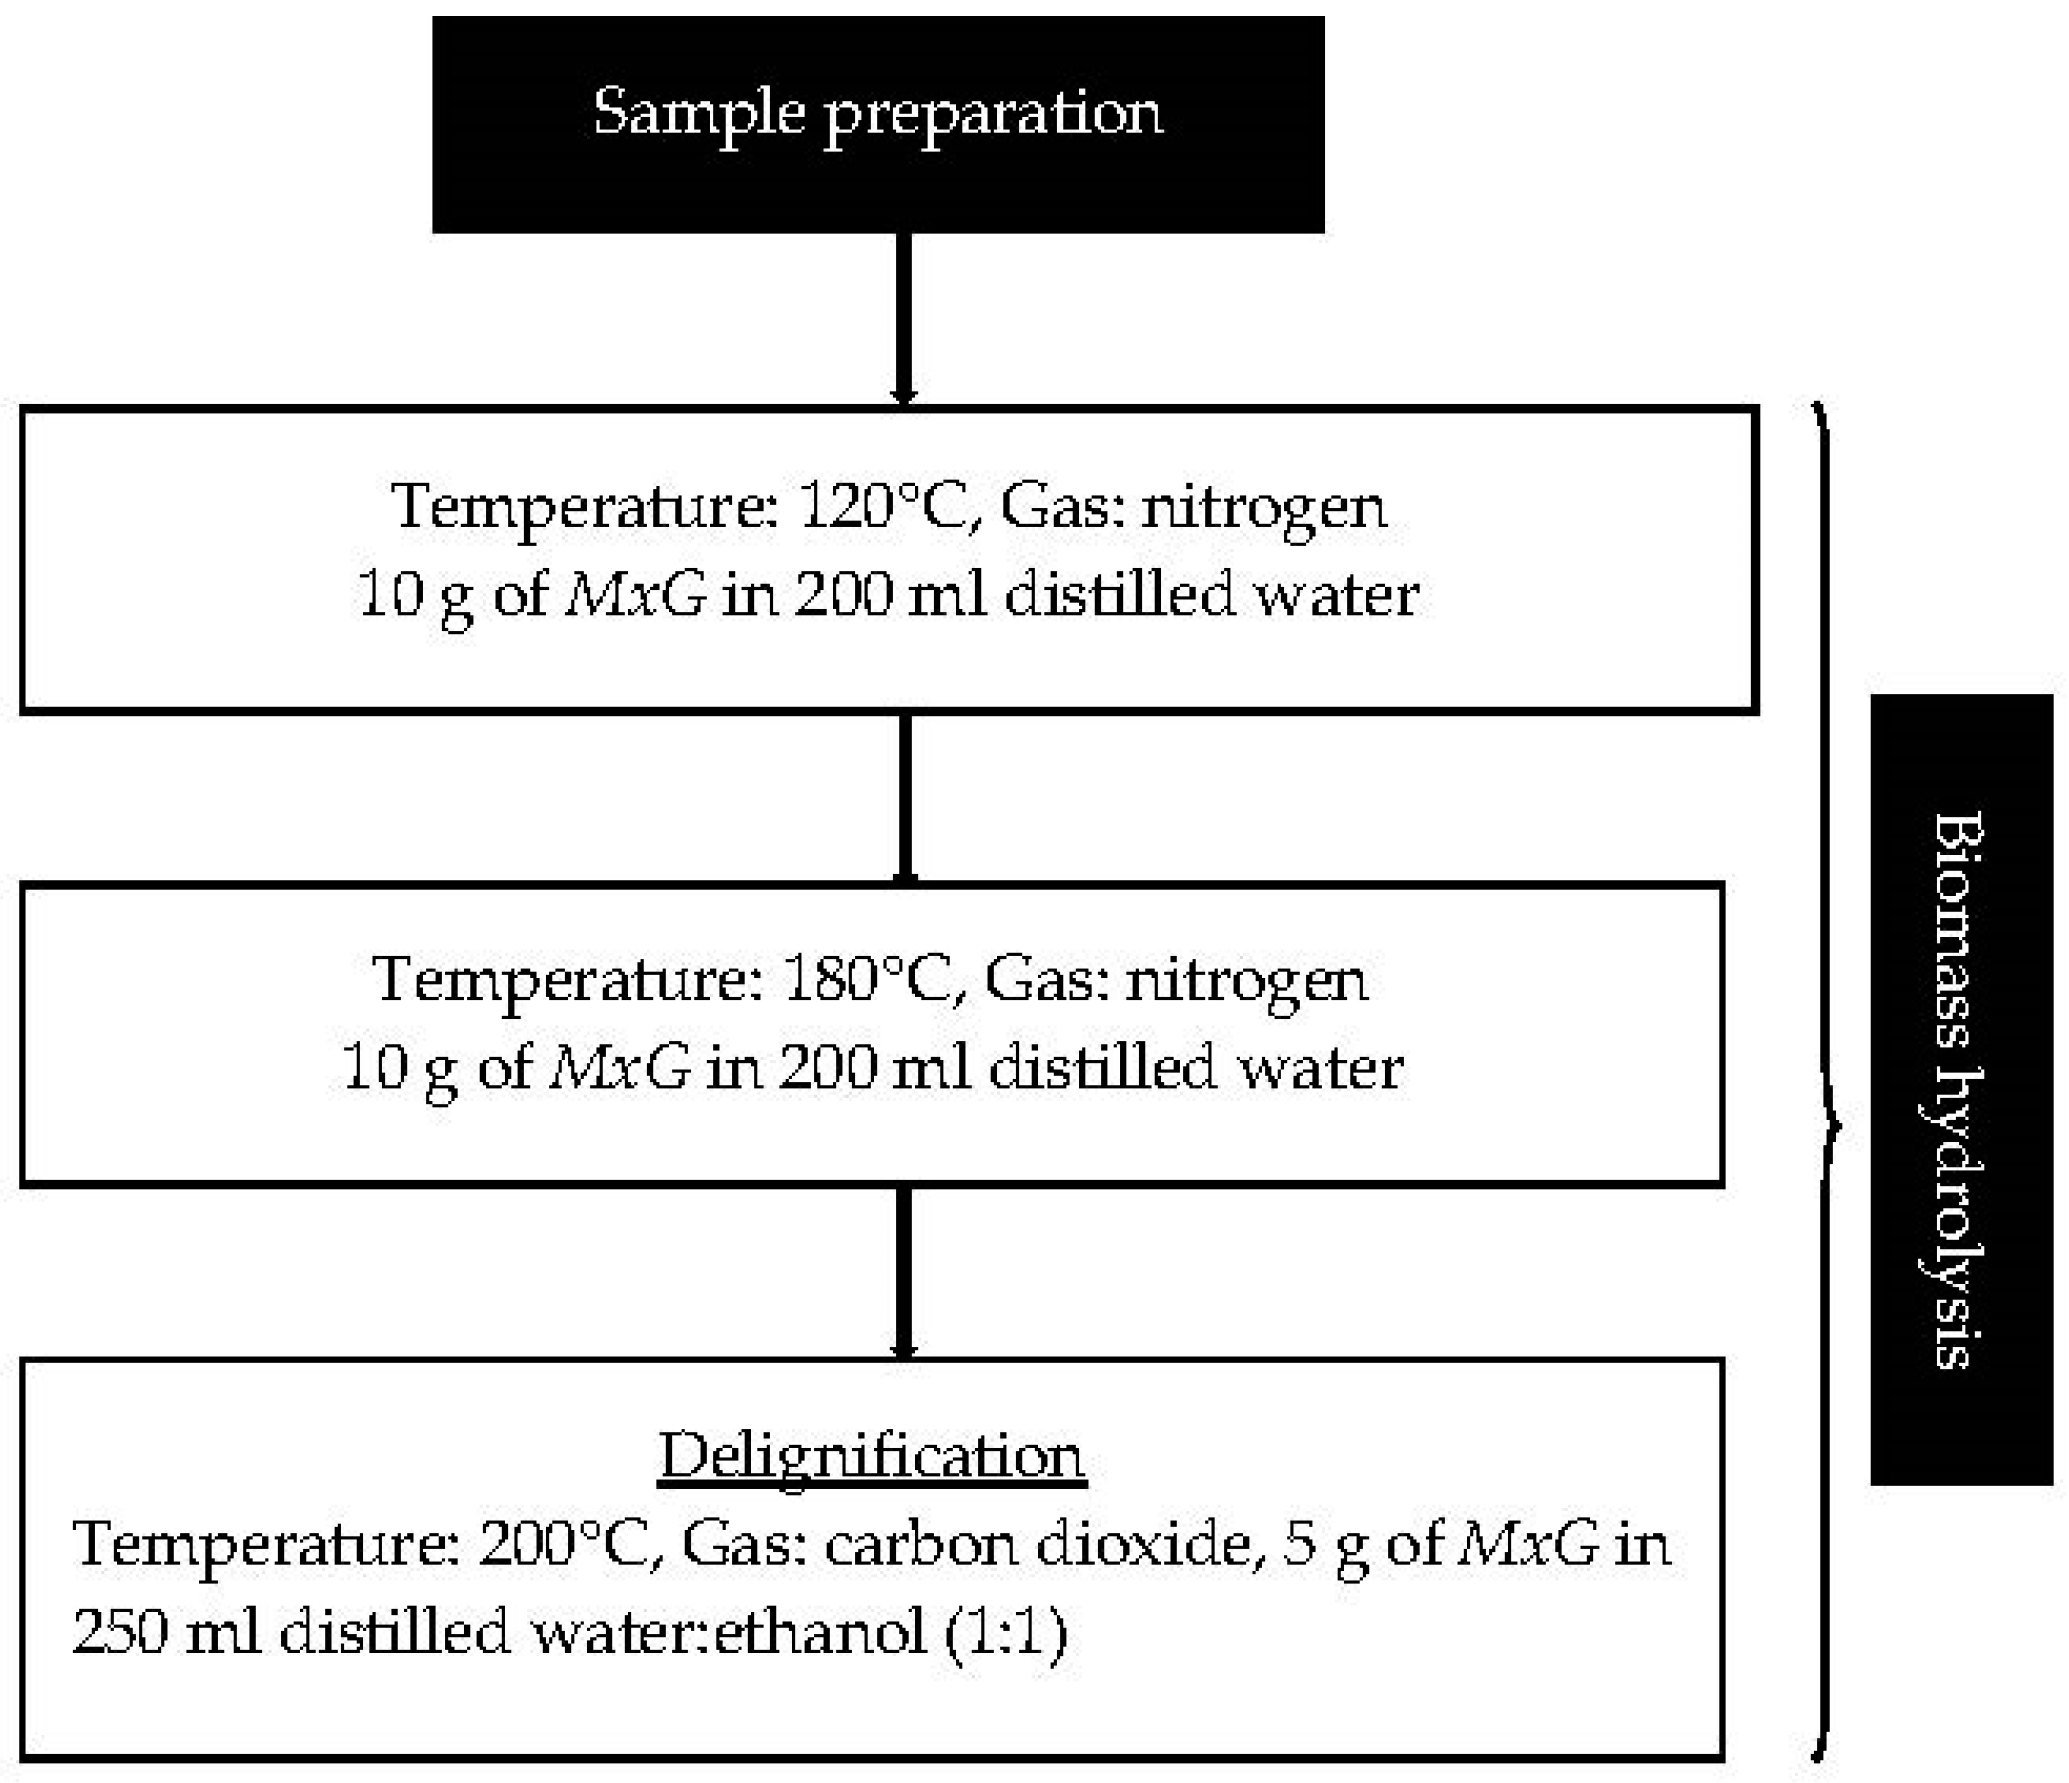
2.2.1. Biomass Preparation
2.2.2. Biomass Hydrolysis
2.2.3. Lignin Precipitation
2.2.4. Klason Lignin Determination
2.2.5. FTIR Analysis
2.2.6. SEM Analysis
2.2.7. Particle Size Analysis
Malvern Zetasizer Nano ZS
Malvern Mastersizer 2000
2.2.8. Statistical Analysis
3. Results and Discussion
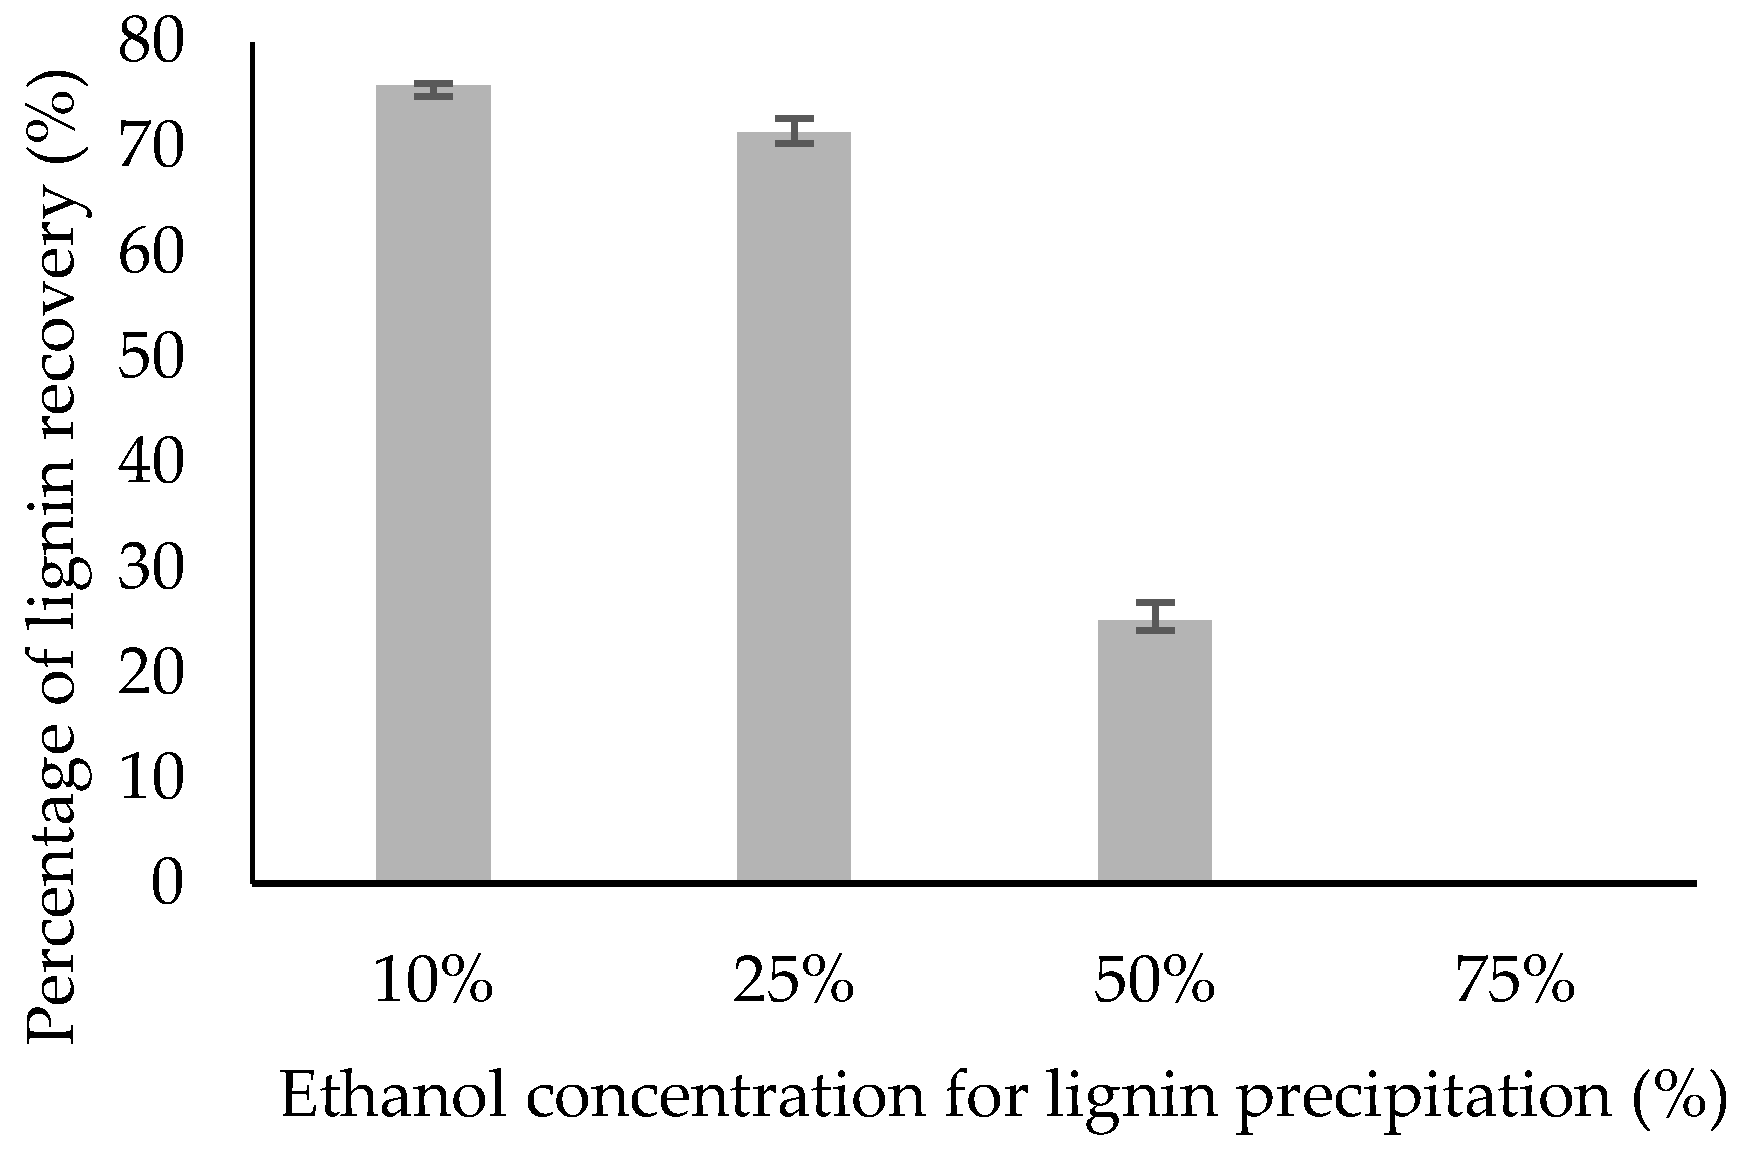
3.1. Percentage of Lignin Recovery
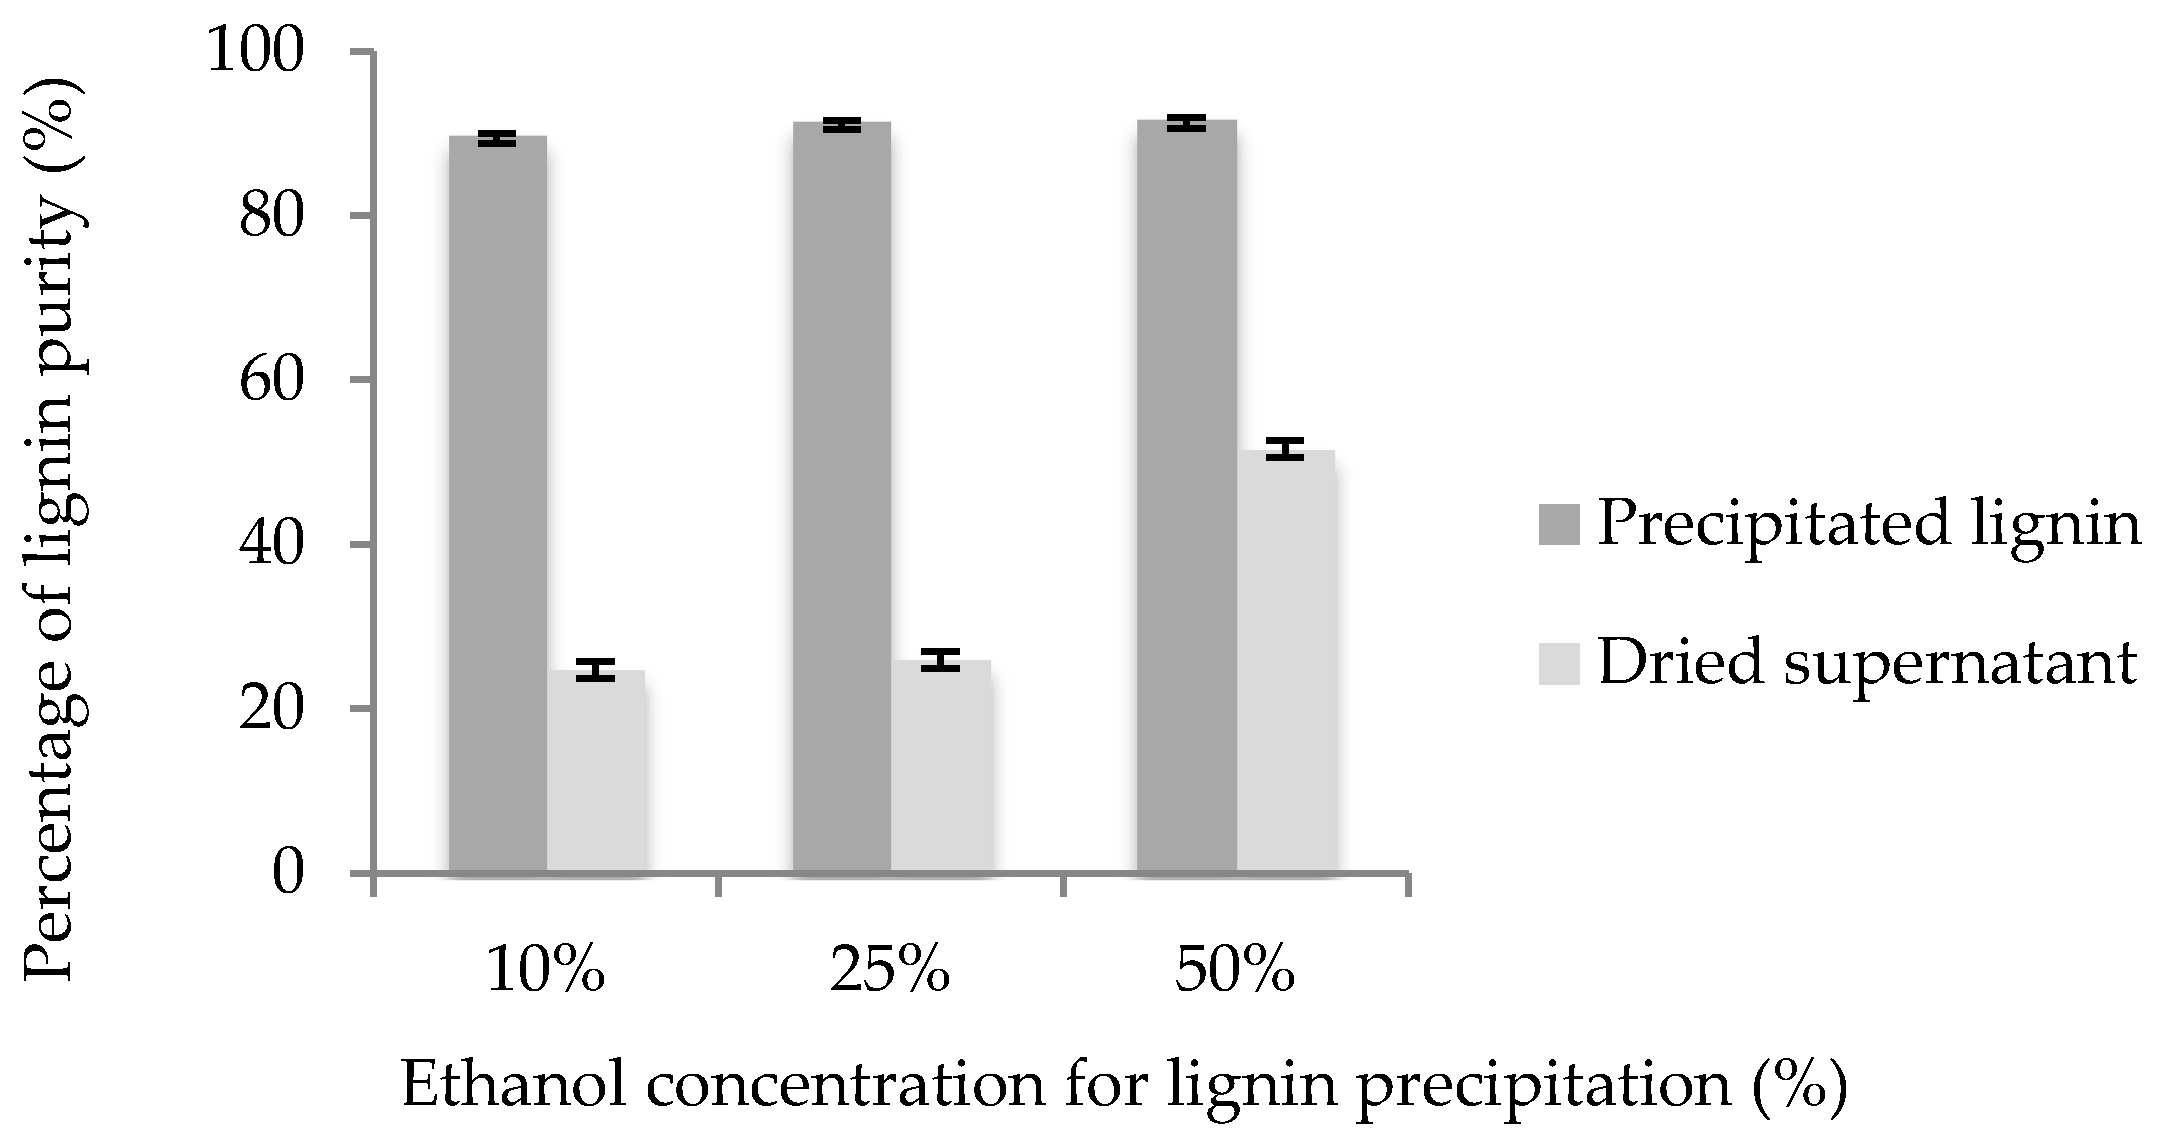
3.2. Percentage of Lignin Purity
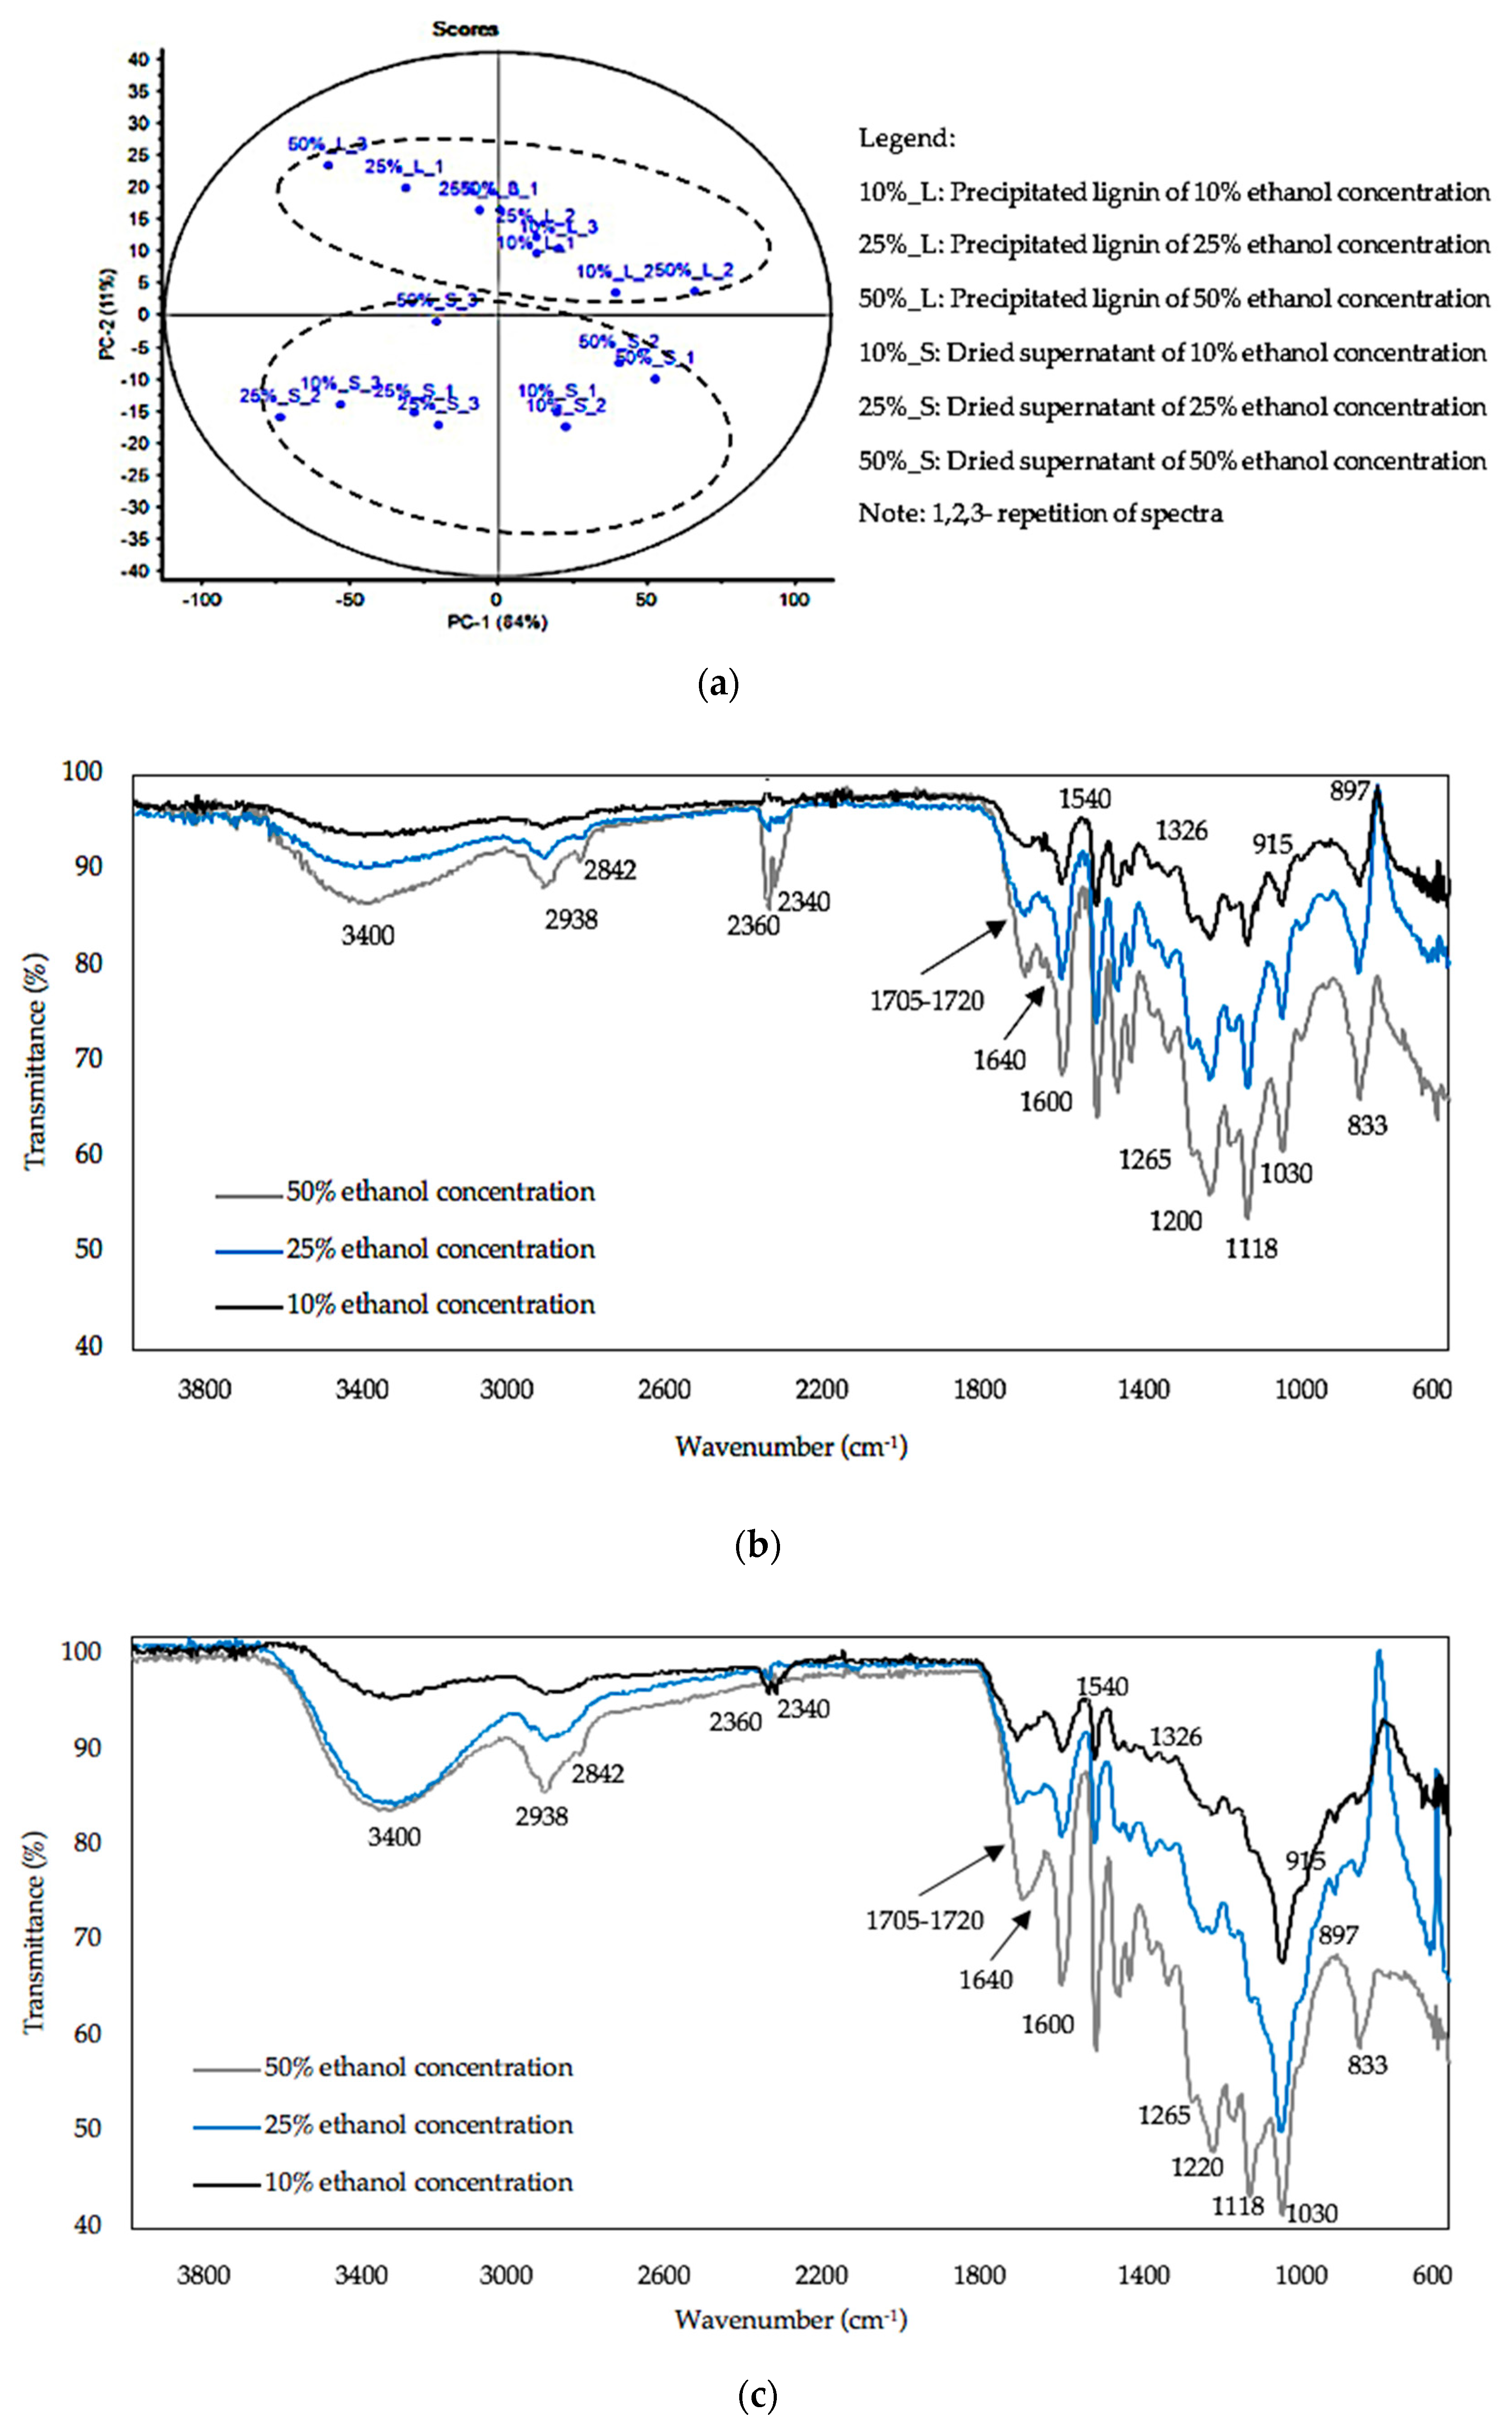
3.3. FTIR Analysis
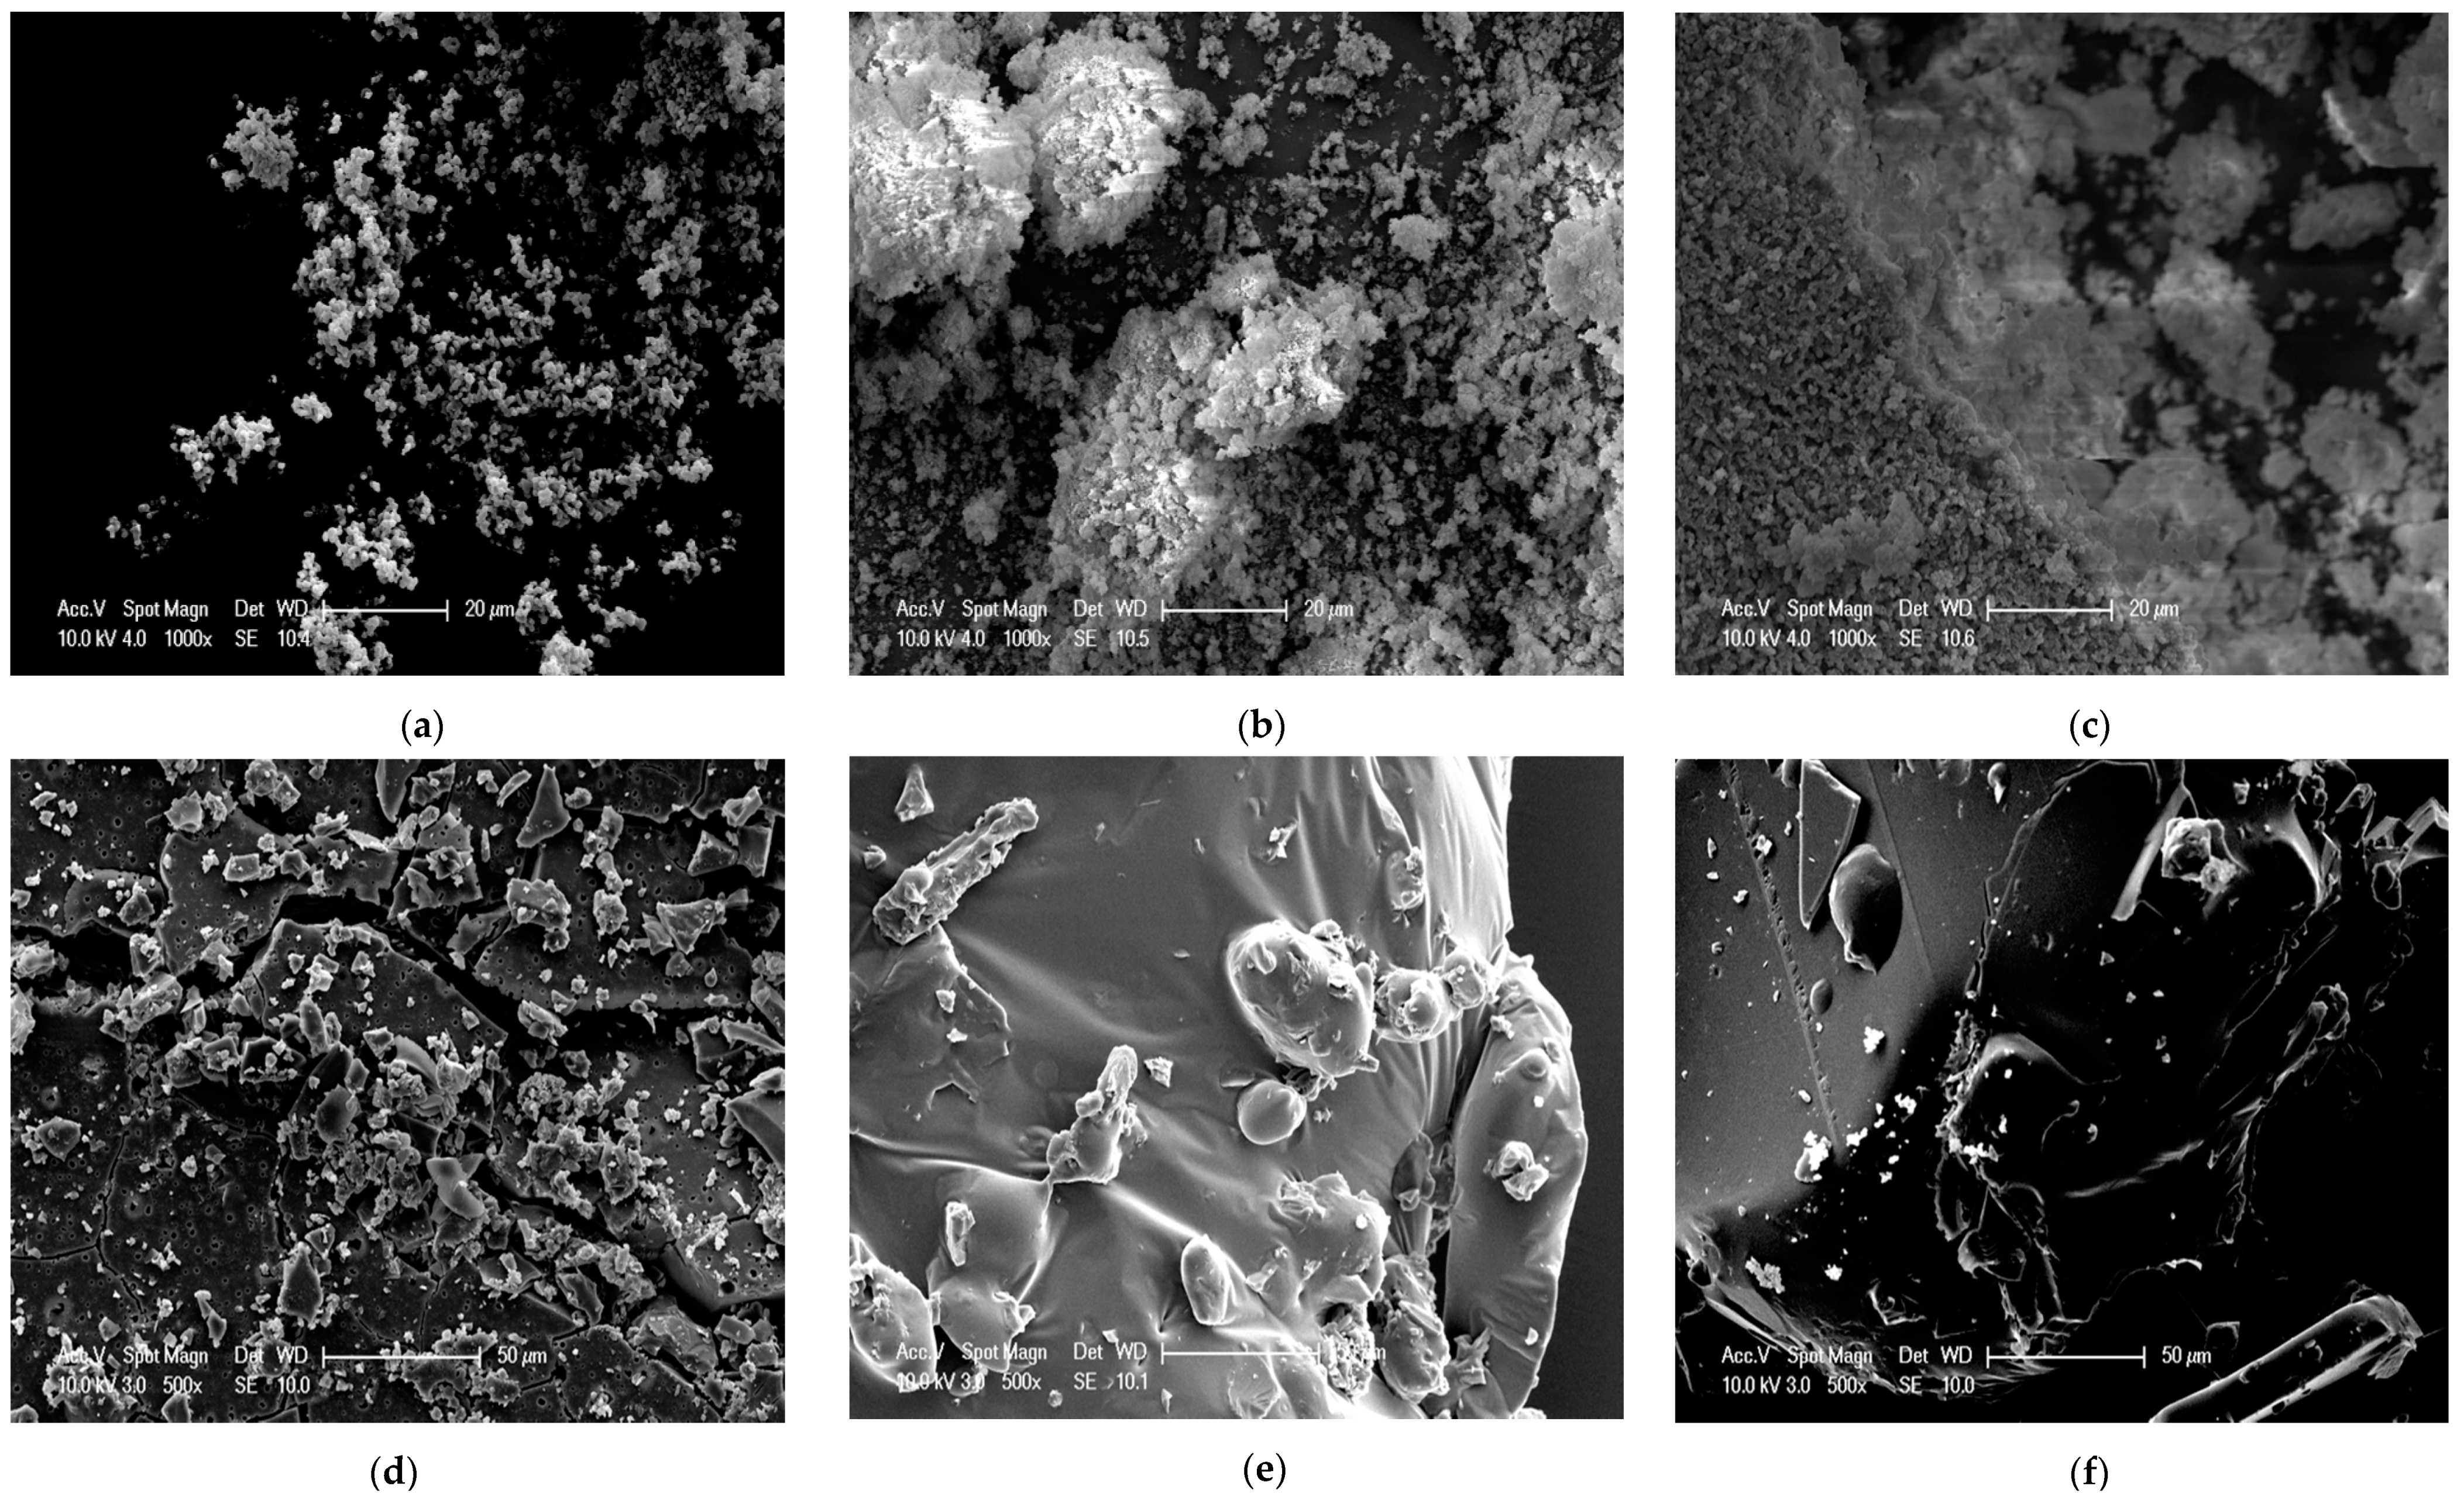
3.4. SEM Analysis
3.5. Particle Size Analysis
4. Conclusions
Author Contributions
Funding
Acknowledgments
Conflicts of Interest
References
- Wahid, R.; Nielsen, S.F.; Hernandez, V.M.; Ward, A.J.; Gislum, R.; Jørgensen, U.; Møller, H.B. Methane production potential from Miscanthus sp.: Effect of harvesting time, genotypes and plant fractions. Biosyst. Eng. 2015, 133, 71–80. [Google Scholar] [CrossRef]
- Lanzerstorfer, C. Combustion of miscanthus: Composition of the ash by particle size. Energies 2019, 12, 178. [Google Scholar] [CrossRef]
- Kryževičienė, A. Cultivation of Miscanthus x giganteus for biofuel and its tolerance of Lithuania’s climate. Zemdirb. Agric. 2011, 98, 267–274. [Google Scholar]
- Wang, D.; Naidu, S.L.; Portis, A.R.; Moose, S.P.; Long, S.P. Can the cold tolerance of C4 photosynthesis in Miscanthus x giganteus relative to Zea mays be explained by differences in activities and thermal properties of Rubisco? J. Exp. Bot. 2008, 59, 1779–1787. [Google Scholar] [CrossRef]
- Xi, Q.; Jezowski, S. Plant resources of Triarrhena and Miscanthus species in China and its meanning for Europe. Plant Breed. Seed Sci. 2004, 49, 63–75. [Google Scholar]
- Jørgensen, U. Benefits versus risks of growing biofuel crops: The case of Miscanthus. Curr. Opin. Environ. Sustain. 2011, 3, 24–30. [Google Scholar] [CrossRef]
- Lewandowski, I.; Clifton-Brown, J.C.; Scurlock, J.M.O.; Huisman, W. Miscanthus: European experience with a novel energy crop. Biomass Bioenergy 2000, 19, 209–227. [Google Scholar] [CrossRef]
- Glasser, W.G. About Making Lignin Great Again—Some Lessons From the Past. Front. Chem. 2019, 7, 1–17. [Google Scholar] [CrossRef]
- Hamzah, M.H.; Bowra, S.; Cox, P. Purity and structural composition of lignin isolated from Miscanthus x giganteus by sub-critical water extraction with associated modifiers. J. Agric. Food Eng. 2020, 1, 1–12. [Google Scholar]
- Ratnaweera, D.R.; Saha, D.; Pingali, S.V.; Labbé, N.; Naskar, A.K.; Dadmun, M. The impact of lignin source on its self-assembly in solution. RSC Adv. 2015, 5, 67258–67266. [Google Scholar] [CrossRef]
- Ganewatta, M.S.; Lokupitiya, H.N.; Tang, C. Lignin biopolymers in the age of controlled polymerization. Polymers 2019, 11, 1176. [Google Scholar] [CrossRef] [PubMed]
- Lu, Y.; Lu, Y.C.; Hu, H.Q.; Xie, F.J.; Wei, X.Y.; Fan, X. Structural characterization of lignin and its degradation products with spectroscopic methods. J. Spectrosc. 2017, 1–15. [Google Scholar] [CrossRef]
- Vishtal, A.; Kraslawski, A. Challenges in industrial applications of technical lignins. BioResources 2011, 6, 3547–3568. [Google Scholar]
- Deng, Y.; Feng, X.; Zhou, M.; Qian, Y.; Yu, H.; Qiu, X. Investigation of aggregation and assembly of alkali lignin using iodine as a probe. Biomacromolecules 2011, 12, 1116–1125. [Google Scholar] [CrossRef]
- Clauss, M.M.; Weldin, D.L.; Frank, E.; Giebel, E.; Buchmeiser, M.R. Size-exclusion chromatography and aggregation studies of acetylated lignins in N,N-dimethylacetamide in the presence of salts. Macromol. Chem. Phys. 2015, 216, 2012–2019. [Google Scholar] [CrossRef]
- Matsakas, L.; Karnaouri, A.; Cwirzen, A.; Rova, U.; Christakopoulos, P. Formation of lignin nanoparticles by combining organosolv pretreatment of birch biomass and homogenization processes. Molecules 2018, 23, 1822. [Google Scholar] [CrossRef]
- Roque, R.M.N. Hydrolysis of Lignocellulosic Biomass by a Modified organosolv Method on a Biorefinery Perspective—Example of Miscanthus x Giganteus. Ph.D. Thesis, University of Birmingham, Birmingham, UK, 2013. [Google Scholar]
- Mohan, M.; Banerjee, T.; Goud, V.V. Hydrolysis of bamboo biomass by subcritical water treatment. Bioresour. Technol. 2015, 191, 244–252. [Google Scholar] [CrossRef]
- Rogalinski, T.; Liu, K.; Albrecht, T.; Brunner, G. Hydrolysis kinetics of biopolymers in subcritical water. J. Supercrit. Fluids 2008, 46, 335–341. [Google Scholar] [CrossRef]
- Sluiter, A.; Hames, B.; Ruiz, R.; Scarlata, C.; Sluiter, J.; Templeton, D.; Crocker, D. Determination of Structural Carbohydrates and Lignin in Biomass; National Renewable Energy Laboratory: Golden, CO, USA, 2012.
- Durak, T.; Depciuch, J. Effect of plant sample preparation and measuring methods on ATR-FTIR spectra results. Environ. Exp. Bot. 2020, 169, 103915. [Google Scholar] [CrossRef]
- Šurina, I.; Jablonskỳ, M.; Ház, A.; Sladková, A.; Briškárová, A.; Kačík, F.; Šima, J. Characterisation of non-wood lignin precipitated with sulphuric acid of various concentrations. BioResources 2015, 10, 1408–1423. [Google Scholar] [CrossRef]
- Aleš, H.; Michal, J.; Lenka, D.; Alexandra, S.; Igor, Š. Thermal properties and size distribution of lignins precipitated with sulphuric acid. Wood Res. 2015, 60, 375–384. [Google Scholar]
- Donaldson, L.A. Critical assessment of interference microscopy as a technique for measuring lignin distribution in cell walls. N. Z. J. For. Sci. 1985, 15, 349–360. [Google Scholar]
- Stewart, H.E. Development of Food-Grade Microparticles From Lignin. Ph.D. Thesis, Massey University, Palmerston North, New Zealand, 2015. [Google Scholar]
- Pasquini, D.; Pimenta, M.T.B.; Ferreira, L.H.; da Silva Curvelo, A.A. Extraction of lignin from sugar cane bagasse and Pinus taeda wood chips using ethanol–water mixtures and carbon dioxide at high pressures. J. Supercrit. Fluids 2005, 36, 31–39. [Google Scholar] [CrossRef]
- Tu, Q.; Fu, S.; Zhan, H.; Chai, X.; Lucia, L.A. Kinetic modeling of formic acid pulping of bagasse. J. Agric. Food Chem. 2008, 56, 3097–3101. [Google Scholar] [CrossRef]
- Xu, Y.; Li, K.; Zhang, M. Lignin precipitation on the pulp fibers in the ethanol-based organosolv pulping. Colloids Surf. A Physicochem. Eng. Asp. 2007, 301, 255–263. [Google Scholar] [CrossRef]
- Ni, Y.; Hu, Q. Alcell lignin solubility in ethanol-water mixtures. J. Appl. Polym. Sci. 1995, 57, 1441–1446. [Google Scholar] [CrossRef]
- Fernando, E.F. Lignin recovery from spent liquors from ethanol-water fractionation of sugar cane bagasse. Cellul. Chem. Technol. 2010, 44, 311–318. [Google Scholar]
- Ortega, J.H. Process Design of Lignocellulosic Biomass Fractionation Into Cellulose, Hemicellulose and Lignin by Prehydrolysis and Organosolv Process. Master’s Thesis, Wageningen University, Wageningen, The Netherlands, 2015. [Google Scholar]
- Sun, J.; Dutta, T.; Parthasarathi, R.; Kim, K.H.; Tolic, N.; Chu, R.K.; Isern, N.G.; Cort, J.R.; Simmons, B.A.; Singh, S. Rapid room temperature solubilization and depolymerisation of polymeric lignin at high loadings. Green Chem. 2016, 18, 6012–6020. [Google Scholar] [CrossRef]
- Hussin, M.H. Extraction, Modification and Characterization of Lignin From Oil Palm Fronds as Corrosion Inhibitors for Mild Steel in Acidic Solution. Ph.D. Thesis, Universite de Lorraine, Nancy and Metz, France, 2014. [Google Scholar]
- Vallejos, M.E.; Felissia, F.E.; Curvelo, A.A.S.; Zambon, M.D.; Ramos, L.; Area, M.C. Chemical and physico-chemical characterisation of lignins obtained from ethanol-water fractionation of bagasse. BioResources 2011, 6, 1158–1171. [Google Scholar]
- Bauer, S.; Sorek, H.; Mitchell, V.D.; Ibáñez, A.B.; Wemmer, D.E. Characterisation of Miscanthus x giganteus lignin isolated by ethanol organosolv process under reflux condition. J. Agric. Food Chem. 2012, 60, 8203–8212. [Google Scholar] [CrossRef]
- Alriols, M.G.; García, A.; Llano-Ponte, R.; Labidi, J. Combined organosolv and ultrafiltration lignocellulosic biorefinery process. Chem. Eng. J. 2010, 157, 113–120. [Google Scholar] [CrossRef]
- Boeriu, C.G.; Bravo, D.; Gosselink, R.J.A.; van Dam, J.E.G. Characterisation of structure-dependent functional properties of lignin with infrared spectroscopy. Ind. Crops Prod. 2004, 20, 205–218. [Google Scholar] [CrossRef]
- Mahmood, N.; Yuan, Z.; Schmidt, J.; Xu, C. Depolymerisation of lignins and their applications for the preparation of polyols and rigid polyurethane foams: A review. Renew. Sustain. Energy Rev. 2016, 60, 317–329. [Google Scholar] [CrossRef]
- Behera, S.; Arora, R.; Nandhagopal, N.; Kumar, S. Importance of chemical pretreatment for bioconversion of lignocellulosic biomass. Renew. Sustain. Energy Rev. 2014, 36, 91–106. [Google Scholar] [CrossRef]
- Mosier, N.; Wyman, C.; Dale, B.; Elander, R.; Lee, Y.Y.; Holtzapple, M.; Ladisch, M. Features of promising technologies for pretreatment of lignocellulosic biomass. Bioresour. Technol. 2005, 96, 673–686. [Google Scholar] [CrossRef] [PubMed]
- Xiao, L.-P.; Sun, Z.-J.; Shi, Z.-J.; Xu, F.; Sun, R. Impact of hot compressed water pretreatment on the structural changes of woody biomass for bioethanol production. BioResources 2011, 6, 1576–1598. [Google Scholar]
- Mohamad Ibrahim, M.N.; Zakaria, N.; Sipaut, C.S.; Sulaiman, O.; Hashim, R. Chemical and thermal properties of lignins from oil palm biomass as a substitute for phenol in a phenol formaldehyde resin production. Carbohydr. Polym. 2011, 86, 112–119. [Google Scholar] [CrossRef]
- Pandey, K.K. A study of chemical structure of soft and harwood and wood polymers by FTIR spectrscopy. J. Appl. Polym. Sci. 1999, 71, 1969–1975. [Google Scholar]
- Davis, W.M.; Erickson, C.L.; Johnston, C.T.; Delfino, J.J.; Porter, J.E. Quantitative Fourier Transform Infrared spectroscopic investigation humic substance functional group composition. Chemosphere 1999, 38, 2913–2928. [Google Scholar] [CrossRef]
- Holladay, J.E.; White, J.F.; Bozell, J.J.; Johnson, D. Top Value-Added Chemicals from Biomass; Pacific Northwest National Lab. (PNNL): Richland, WA, USA; National Renewable Energy Lab. (NREL): Golden, CO, USA, 2007.
- Guo, F.; Shi, W.; Sun, W.; Li, X.; Wang, F.; Zhao, J.; Qu, Y. Differences in the adsorption of enzymes onto lignins from diverse types of lignocellulosic biomass and the underlying mechanism. Biotechnol. Biofuels 2014, 7, 38. [Google Scholar] [CrossRef]
- Savy, D.; Cozzolino, V.; Vinci, G.; Nebbioso, A.; Piccolo, A. Water-Soluble Lignins from Different Bioenergy Crops Stimulate the Early Development of Maize (Zea mays, L.). Molecules 2015, 20, 19958–19970. [Google Scholar] [CrossRef] [PubMed]
- Radotić, K.; Roduit, C.; Simonović, J.; Hornitschek, P.; Fankhauser, C.; Mutavdžić, D.; Steinbach, G.; Dietler, G.; Kasas, S. Atomic force microscopy stiffness tomography on living arabidopsis thaliana cells reveals the mechanical properties of surface and deep cell-wall layers during growth. Biophys. J. 2012, 103, 386–394. [Google Scholar] [CrossRef] [PubMed]
- Kumar, A.; Kumar, J.; Bhaskar, T. Utilization of lignin: A sustainable and eco-friendly approach. J. Energy Inst. 2020, 93, 235–271. [Google Scholar] [CrossRef]
- He, L.; Liu, Q.; Song, Y.; Deng, Y. Effects of metal chlorides on the solubility of lignin in the black liquor of prehydrolysis kraft pulping. BioResources 2014, 9, 4636–4642. [Google Scholar] [CrossRef][Green Version]
- Ye, Y.; Zhang, Y.; Fan, J.; Chang, J. Novel method for production of phenolics by combining lignin extraction with lignin depolymerisation in aqueous ethanol. Ind. Eng. Chem. Res. 2012, 51, 103–110. [Google Scholar] [CrossRef]
- Xu, C.; Arneil, R.; Arancon, D.; Labidi, J.; Luque, R. Lignin depolymerisation strategies: Towards valuable chemicals and fuels. Chem. Soc. Rev. 2014, 43, 7485–7500. [Google Scholar] [CrossRef] [PubMed]
- Matsushita, Y.; Yasuda, S. Reactivity of a condensed—Type lignin model compound in the Mannich reaction and preparation of cationic surfactant from sulfuric acid lignin. J. Wood Sci. 2003, 49, 166–171. [Google Scholar] [CrossRef]
- Duval, A.; Lawoko, M. A review on lignin-based polymeric, micro- and nano-structured materials. React. Funct. Polym. 2014, 85, 78–96. [Google Scholar] [CrossRef]
- Allen, E.; Smith, P.; Henshaw, J. A Review of Particle Agglomeration; AEA Technology: Dorset, UK, 2001. [Google Scholar]
- Sayyar, S.; Abidin, Z.Z.; Yunus, R.; Muhammad, A. Extraction of oil from Jatropha seeds-optimisation and kinetics. Am. J. Appl. Sci. 2009, 6, 1390–1395. [Google Scholar] [CrossRef]
- Shulga, G.; Vitolina, S. Lignin separated from the hydrolysate of the hydrothermal treatment of birch wood and its surface properties. Cellul. Chem. Technol. 2012, 46, 307–318. [Google Scholar]
- Xiong, F.; Han, Y.; Wang, S.; Li, G.; Qin, T.; Chen, Y.; Chu, F. Preparation and formation mechanism of size-controlled lignin nanospheres by self-assembly. Ind. Crops Prod. 2017, 100, 146–152. [Google Scholar] [CrossRef]
- Qian, Y.; Deng, Y.; Qiu, X.; Li, H.; Yang, D. Formation of uniform colloidal spheres from lignin, a renewable resource recovered from pulping spent liquor. Green Chem. 2014, 16, 2156. [Google Scholar] [CrossRef]
- Li, H.; Deng, Y.; Liu, B.; Ren, Y.; Liang, J.; Qian, Y.; Qiu, X.; Li, C.; Zheng, D. Preparation of Nanocapsules via the Self-Assembly of Kraft Lignin: A Totally Green Process with Renewable Resources. ACS Sustain. Chem. Eng. 2016, 4, 1946–1953. [Google Scholar] [CrossRef]
- Rao, X.; Liu, Y.; Zhang, Q.; Chen, W.; Liu, Y.; Yu, H. Assembly of Organosolv Lignin Residues into Submicron Spheres: The Effects of Granulating in Ethanol/Water Mixtures and Homogenisation. ACS Omega 2017, 2, 2858–2865. [Google Scholar] [CrossRef] [PubMed]


| Dependent Variable | Percentage of Ethanol Concentration | Comparison with Other Percentage of Ethanol Concentration | Sig. |
|---|---|---|---|
| Percentage of purity precipitated lignin | 50% | 25% | 0.857 |
| 10% | 0.010 * | ||
| 25% | 50% | 0.857 | |
| 10% | 0.010 * | ||
| 10% | 50% | 0.010 * | |
| 25% | 0.010 * | ||
| Percentage of purity dried supernatant | 50% | 25% | 0.013 * |
| 10% | 0.000 * | ||
| 25% | 50% | 0.000 * | |
| 10% | 0.525 | ||
| 10% | 50% | 0.000 * | |
| 25% | 0.525 | ||
| Percentage of lignin recovery | 50% | 25% | 0.000 * |
| 10% | 0.000 * | ||
| 25% | 50% | 0.000 * | |
| 10% | 0.100 | ||
| 10% | 50% | 0.000 * | |
| 25% | 0.100 |
| Sample | Ethanol Concentration (%) | Particle Size | |||||
|---|---|---|---|---|---|---|---|
| Particle Diameter from Zetasizer Nano ZS (nm) | Particle Diameter from Mastersizer 2000 (μm) | ||||||
| Particle Size Distribution | Particle Size | 1Dv10 | 2Dv50 | 3Dv90 | 4D3,2 | ||
| Lignin | 50 | 342.0–1281.0 | 2050.0 | 5.5 | 98.2 | 257.7 | 18.3 |
| 1281.0–6439.0 | |||||||
| 25 | 91.3–1718.0 | 391.7 | 7.0 | 36.2 | 131.7 | 8.6 | |
| 3580.0–6439.0 | |||||||
| 10 | 58.8–295.3 | 306.2 | 3.8 | 67.8 | 300.2 | 11.1 | |
| 295.3–2669.0 | |||||||
| 3580.0–6439.0 | |||||||
| Supernatant | 50 | 68.1–295.3 | 875.1 | 4.5 | 13.3 | 239.6 | 10.3 |
| 295.3–1484.0 | |||||||
| 1484.0–6439 | |||||||
| 25 | 825.0–2305.0 | 1197.3 | 3.0 | 9.3 | 86.3 | 6.9 | |
| 10 | 531.2–6439.0 | 1598.3 | 4.1 | 40.7 | 275.6 | 12.6 | |
© 2020 by the authors. Licensee MDPI, Basel, Switzerland. This article is an open access article distributed under the terms and conditions of the Creative Commons Attribution (CC BY) license (http://creativecommons.org/licenses/by/4.0/).
Share and Cite
Hamzah, M.H.; Bowra, S.; Cox, P. Effects of Ethanol Concentration on Organosolv Lignin Precipitation and Aggregation from Miscanthus x giganteus. Processes 2020, 8, 845. https://doi.org/10.3390/pr8070845
Hamzah MH, Bowra S, Cox P. Effects of Ethanol Concentration on Organosolv Lignin Precipitation and Aggregation from Miscanthus x giganteus. Processes. 2020; 8(7):845. https://doi.org/10.3390/pr8070845
Chicago/Turabian StyleHamzah, Muhammad Hazwan, Steve Bowra, and Philip Cox. 2020. "Effects of Ethanol Concentration on Organosolv Lignin Precipitation and Aggregation from Miscanthus x giganteus" Processes 8, no. 7: 845. https://doi.org/10.3390/pr8070845
APA StyleHamzah, M. H., Bowra, S., & Cox, P. (2020). Effects of Ethanol Concentration on Organosolv Lignin Precipitation and Aggregation from Miscanthus x giganteus. Processes, 8(7), 845. https://doi.org/10.3390/pr8070845