Abstract
The aim of this study was to characterize the properties of lactoferrin (LF) obtained in a process developed for its isolation from acid whey derived from the production of fresh curd cheese, using a unique technology of ion-exchange chromatography on CIM® monolithic columns. The freeze-dried lactoferrin samples produced on the pilot plant (capacity 1 m3) were examined for the purity, iron-binding capacity, antibacterial activity, and pH- and temperature-stability. Apo-LF inhibited several tested strains (enterobacteria, Staphylococcus, Streptococcus salivarius) except clostridia, lactic acid bacteria, and bifidobacteria. Sample of LF intentionally saturated with Fe3+ lost its antibacterial activity, indicating the involvement of mechanisms based on depriving bacteria of an iron source. All samples, regardless of the iron-saturation level, exhibited stability in pH range 4.0 to 11.0. LF with higher iron content (A-value = 41.9%) showed better thermal stability. Heat treatment up to 72 °C/3 s did not reduce antimicrobial activity against E. coli O157: H7 tox-. Higher purity (above 91%), higher iron-binding capacity and higher inhibitory activity against E. coli O157: H7 tox- compared to some similar products from the market was observed. These results demonstrate a high potential of monolithic ion-exchange chromatography for industrial processing of acid whey as a source of LF that can be used in new products with high-added value. The upscaling of the process is ongoing on a demonstration plant (10–30 m3/day capacity).
1. Introduction
Acid whey is a by-product in the manufacture of fermented dairy products such as cottage cheese, fresh curd cheese, granulated cheeses, and Greek yoghurt [1]. While the sweet whey derived from the rennet cheeses production can be after appropriate treatment relatively easily used in a wide range of products, such as food with added concentrated whey or whey fractions, dietary supplements, products for sports nutrition, infants’ formula, bioplastics etc., or processed further to separate organic acids, lactose, minerals or enzymes, the use of acid whey is considerably more limited [2,3]. Low pH, high mineral, and lactic acid content makes it difficult to dry, therefore, the majority of acid whey still ends as a waste product that represents the environmental burden and presents certain cost for the producer [4]. The possibility to create whey-based beverages that has been reviewed recently by Barukčić et al. [5], has not been sufficiently exploited so far but still, only a part of acid whey could be processed this way. Acid whey, however, contains high-bioavailable proteins, which can be extracted by advanced technological processes and used in various functional foods or dietary supplements [2,6].
Lactoferrin (LF) is an 80 kDa large glycoprotein found in milk, whey, and colostrum. LF can respond to various physiological and environmental changes and thus represent a key player in the first host defense line. Its structural characteristics allow different effects in the body, such as: (I) regulating Fe3+ transport, which is common to all transferrins, (II) high antimicrobial activity against a broad spectrum of bacteria, fungi, yeasts, viruses, and parasites, (III) protection against inflammatory and neuronal diseases, cancer, metabolic disorders, and (IV) several other enzymatic functions [7,8]. The promising results of clinical studies addressing the beneficial effects of bovine LF on children’s health, through protection against pathogens, improved nutrient absorption, and support for the development of the immune system raises the potential for the involvement of LF in children’s formulae [9]. Furthermore, research is also focused on obtaining scientific evidence for positive effects in the treatment of dermatological disorders (inhibition of acne and dandruff agents, inhibition of oxidative skin changes), promising for the development of cosmetic products [10].
The isolation of LF from whey at the industrial scale is challenging because of its minor proportion in this medium. Various technological approaches are used nowadays for the isolation of individual proteins from milk and by-products of milk processing including whey: (I) paramagnetic particles bound to heparin ligands [11], (II) Cationic surfactants [12], (III) different chromatographic techniques, such as cation exchange or affinity chromatography [13,14,15,16], and (IV) other techniques, such as hydrophobic ionic liquids extractions [17]. Chromatographic techniques, mainly ion-exchange chromatography, represent an efficient and robust approach for LF isolation. Most commonly, strong cationic exchangers are used, in the form of particle resins, membranes, or CIM® (CIM—Convective Interaction Media, trademark of the BIA Separations company) monolithic columns [18,19,20,21]. The separation of whey proteins is carried out in these cases on the basis of differences in isoelectric points (IEP) which are in the pH range from 4.5 to 9.5. The chromatography with monolithic CIM® columns provides some advantages in comparison with other types of columns, such as: (I) high resolution, which does not depend on the flow rate, (II) a simple transition from small to larger chromatographic units without affecting the resolution, and (III) low pressure drop allowing the column to operate at high flow rates, resulting in a reduced separation time [22]. While monolithic ion-exchange chromatography has been increasingly used in the pharmaceutical industry, it has not been used in the industrial production of food and food supplements so far.
After completing the chromatographic separation of the individual proteins, the eluate should be desalted, concentrated and the LF concentrate dried by lyophilisation or spray drying. LF, aimed to be used in food supplements and in various food products, needs to be well-characterized (purity, stability) and should exert claimed biological activity.
In this study, several LF samples obtained on a pilot plant (Arhel, Ljubljana, Slovenia; capacity 1 m3) using ion-exchange chromatography on CIM® monolithic columns (BIA Separations, Ajdovščina, Slovenia) were characterized and compared to some products available on the market.
2. Materials and Methods
2.1. Pilot System for the Processing of Acid Whey—Isolation of LF
Figure 1 shows the flowchart of the process developed for the LF isolation on the pilot system. Prior to the isolation of LF on the chromatographic column, about 1100 L of acid whey obtained from the production of fresh curd cheese in Celeia dairy plant, was filtered using ceramic multi-channel alumina/zirconia asymmetric membranes for microfiltration with a pore diameter <0.8 μm in tangential filtration system—TFF (JIUWU HI-TECH, Pukou, Nanjing, Jiangsu, China). The filtered whey (1000 L) was then loaded on 8 L CIM® monolithic column (BIA Separations, Ajdovščina, Slovenia), which was pre-conditioned using an appropriate buffer. The LF, adsorbed on the column, was eluted using combinations of suitable buffer solutions. The eluate was subsequently concentrated and desalted using a smaller TFF system with a pore diameter <50 kDa. After drying the LF concentrate by lyophilisation or spray drying, the dried LF was stored at refrigeration temperatures and tested. The entire process is described in more detail in the patent application [23].

Figure 1.
Schematic presentation of the process of lactoferrin isolation from the acid whey.
2.2. Determination of Lactoferrin Content in Acid Whey by HPLC
Acid whey samples were analyzed by cation exchange chromatography on a Shimadzu HPLC system (Shimadzu USA Manufacturing, Candy, OR, USA) with a diode array detector using the 0.1 mL analytical column CIMac™ COOH-0.1 (BIA Separations, Ajdovščina, Slovenia). The column was equilibrated for 2 min in mobile phase A (25 mM sodium phosphate, pH 7.5). Then 15 or 25 µL of undiluted acid whey, filtered through a 0.22 µm CA Minisart NML Hydrophilic filter (Sartorius Stedim Biotech, Goettingen, Germany), was loaded using the auto sampler. Unbound material was removed by washing the column for 0.5 min with mobile phase A and then the retained proteins were eluted with a linear gradient of 0–62.5% of mobile phase B (2 M sodium chloride, 25 mM sodium phosphate, pH 7.5) in 2.5 min. The column was then washed with a linear gradient of mobile phase B from 62.5% to 100% in 0.5 min and then for 1 min with 100% mobile phase B. A linear gradient from 100% B to 100% A in 0.5 min followed and then the column was re-equilibrated in mobile phase A for 2 min before the next sample injection. The flow throughout the analysis was 1 mL min−1. Absorbance was measured at 226 nm. Chromatograms were analyzed by using the Postrun program (LabSolutions LC/GC 5.32 SP1; Shimadzu Corporation, Nakagyo-Ku, Kyoto, Japan). Peaks with retention times, corresponding to the retention time of the LF standard (Sigma-Aldrich, St. Louis, MO, USA), were integrated and the concentration of LF was determined by using a calibration curve, prepared with a two-fold dilution series of the LF standard with final concentrations from 0.011 to 0.166 mg mL−1 with known amounts of the LF standard.
2.3. SDS-PAGE Analysis of Protein Composition of Dried Lactoferrin
We determined the protein composition of whey and at different stages of the process by using SDS-PAGE (Bio-Rad Laboratories, Hercules, CA, USA) as described by Laemmli (1970). Samples were dissolved in a non-reducing loading buffer, mixed by vortexing, incubated at 95 °C for 5 min and cooled before application. The samples (25 µL of LF per well) were then loaded onto 4–20% precast polyacrylamide gels (Bio-Rad Laboratories, Hercules, CA, USA) and separated at 25 mA per gel. The proteins were visualized by staining with 0.25% Coomasie Brilliant Blue R250 (Merck, Darmstadt, Germany) in 30% ethanol/10% acetic acid and the background was de-stained with the same solution without the dye.
The purity of the final product was determined similarly, using reducing (2-mercaptoethanol) loading buffer and home-made polyacrylamide gel composed of 4% stacking and 12.5% separating gel.
2.4. C-Value and A-Value Determination
The LF potential for Fe3+ binding (C-value) and the ratio of already bound Fe3+ (A-value) were determined using two commonly used colorimetric methods provided by kit manufacturer NRL Pharma (Takatsu-ku Kanagawa Science Park, Takatsu-ku, Kawasaki, Kanagawa, Japan) in the form of kits. The detailed principle was published in slightly modified form by Ito et al. [24].
2.5. pH and Temperature Stability Using Fluorescence and UV–VIS Spectrophotometry
Dried LF samples with low iron saturation (A-value 3.4%, 4.6%, 5.1%, 5.2%) and iron-rich LF (A-value 41.9%) were produced in this study (Arhel company). Aqueous buffer solutions used for spectrophotometric measurements were 10 mM glycine/HCl (pH 4.0) and 10 mM Tris/HCl (pH 7.0).
For measuring of pH stability of LF, the pH titration experiments were performed at 20 °C. LF was prepared in distilled water (0.2 mg mL−1). For titration, different concentrations (0.0039–4.0 M) of HCl or NaOH were used. pH was measured by using a pH meter equipped with a microelectrode (Mettler Toledo, Greifensee, Switzerland), and fluorescence spectra were recorded with spectrofluorimeter (Varian Cary Eclipse Spectrofluorimeter; Varian Australia, Mulgrave, Victoria, Australia), using a 1 cm path length quartz cuvette. Intrinsic fluorescence emission spectra of LF were recorded from 300 to 400 nm at different pH values. An excitation wavelength of 293 nm was used to follow tryptophan fluorescence. The wavelengths at maximum emission intensity, λmax, and the fluorescence intensity at 330 nm and 350 nm were determined and plotted as a ratio of fluorescence intensity FI330/FI350.
The evaluation of the thermal stability of LF samples at pH 4.0 and 7.0 was performed using UV–VIS spectrophotometer (Cary 100 Bio UV–VIS spectrophotometer; Varian Australia, Mulgrave, Victoria, Australia) using a 1 cm path length quartz cuvette. The concentration of LF was 0.5 mg mL−1 and spectra were recorded at 280 nm over a temperature range from 25 °C to 95 °C with 1 °C increment per minute. Each cuvette was sealed with a Teflon stopper to prevent evaporation during the experiment. Measurements were made in triplicate. From UV melting curve, the apparent denaturation temperature (Tm) was determined by using the first derivative plot of absorbance [25].
2.6. Qualitative Assessment of Antimicrobial Activity of LF by Agar Diffusion Assay
LF samples were prepared by dissolving 100 mg of dried LF sample in 1 mL of microfiltered water (miliQ) and by microfiltration of the solution (0.2 µm). Indicator strains were grown in liquid growth media suitable for their growth (MRS for lactobacilli and bifidobacteria, RCM for clostridia, and BHI for all others). All the media were purchased from Merck (Merck, Darmstadt, Germany). A total of 100 μL of overnight bacterial cultures were spread evenly over the appropriate solid medium (MRS, M17, RCM, BHA). A total of 5 μL of each sample of LF was applied on the surface and allowed to dry. This step was repeated twice. After incubation, we examined visually whether a zone of growth inhibition was visible at the LF application site.
2.7. Determination of Antimicrobial Activity (MIC) of LF by Microdilution Assay
Minimal inhibitory concentration (MIC) of LF was assessed by microdilution test in 96-well plates (Brand GmbH, Germany), using E. coli O157: H7 tox- indicator strain. A stock solution of LF at a concentration of 200 mg mL−1 was prepared in MilliQ water. Commercially available LF products in the form of capsules (LF 28–30) contained also other ingredients such as cellulose, silica, and stearic acid, therefore, the samples were appropriately diluted in accordance with the labelled composition, to obtain the final LF concentration 200 mg mL−1. The solutions were centrifuged at 25,000× g for 5 min to remove insoluble ingredients and eventually present microorganisms. Each line in the microtiter plate contained a series of increasing LF concentration (5, 10, 20, 30, 40, 50, 60, and 70 mg mL−1) and bacteria resuspended in BHI. The first and last row contained positive (LF concentration = 0 mg mL−1, bacteria in BHI) and negative (BHI medium) controls. The bacterial suspension was prepared by resuspension of colonies grown on the surface of brain-heart agar (Merck, Darmstadt, Germany) at 37 °C for 18 h, in ¼ strength Ringer solution (Merck, Darmstadt, Germany) to reach turbidity according to McFarland 1 (OD600 0.123 ± 0.005). The suspension was diluted 250-times in two-fold BHA medium supplemented with Antifoam SE-15 (Sigma) to prevent bubble formation and applied (50 µL) into each well which already contained 50 µL of diluted LF. After 6 h incubation at 37 °C, OD was measured at 630 nm (BIO-TEK EL 808; BioTek Instruments, Winooski, VT, USA). The OD of the medium with diluted lactoferrin was subtracted from the measured OD630 values for each individual lactoferrin sample. MIC was defined as the minimal concentration that caused at least 50% of inhibition. All assays were performed in duplicate, and the tests were repeated three times.
2.8. Statistical Evaluation
The differences in composition and LF content in different whey fractions (income whey, filtered whey, flow-through fraction) were evaluated by Mann-Whitney U test in Sigmaplot 11.0 (Systat Software, San Jose, CA, USA). Differences were considered significant at p < 0.05. Eleven batches were included in the analyses, and each sample was analyzed in duplicate. Measurements of thermal stability and pH were performed in triplicates.
Microbiological determinations of the inhibitory activity and stability in microtiter plates were carried in triplicates. The error bars represent standard errors of the mean, calculated with Microsoft Excel 2013 (Microsoft Corporation, Redmond, WA, USA).
3. Results and Discussion
3.1. Composition of Incoming Acid Whey and Whey Fractions after Processing
Samples of acid whey derived from the production of fresh curd cheese were obtained from Celeia dairy (Arja vas, Slovenia). The process of whey proteins extraction, especially LF, was established on the pilot plant (Arhel, Ajdovščina, Slovenia) where approximately 1 m3 of income acid whey was processed in each batch. Eleven production batches were processed in the Arhel pilot system. The chemical composition, pH and LF content in the income acid whey, microfiltered whey, and flow-through fraction are presented in Table 1.

Table 1.
The composition and pH of the acid whey derived from the production of fresh curd cheese (Celeia dairy plant), before (incoming whey) and after processing on the pilot system (microfiltered whey, flow-through whey after loading on CIM® cation-exchange columns). Average values and standard errors of the mean (SEM) are presented.
The composition of the income acid whey did not deviate from the values common for the acid whey [1,3]. The filtration significantly reduced the concentration of fat (p = 0.019), of proteins (p = 0.003), and of dry matter (p = 0.002), which shows that a part of these components ended up in the retentate. The chromatography step did not significantly affect the composition of major whey components and minerals. The content of lactose only differed significantly between incoming whey and flow-through whey (p = 0.02). The flow-through whey samples still contained 94–97% of initial proteins, 95–100% of initial dry matter and 95–100% of initial lactose. This observation met the expectations as under the conditions applied, only a small part of whey proteins, first of all LF, selectively bound to the cation-exchange column due to its basic nature, while other molecules were mostly retained in the flow-through fraction.
A typical result of SDS-PAGE analysis of acid whey and the flow-through fraction is presented in Figure 2. The predominant whey proteins β-lactoglobulin (β-LG), α-lactalbumin (α-LA), bovine serum albumin (BSA), and IgG representing about 50–55%, 20–25%, 5–10%, and 10–15% of the whey protein fraction, respectively, as well as LF (LF, 80 kDa, 1–2%) were detected in the acid whey samples. The comparison of the protein composition of incoming whey and flow-through whey (Figure 2) clearly demonstrated that most of LF effectively bound to the column as the band representing LF was very weak in the sample of flow-through whey.
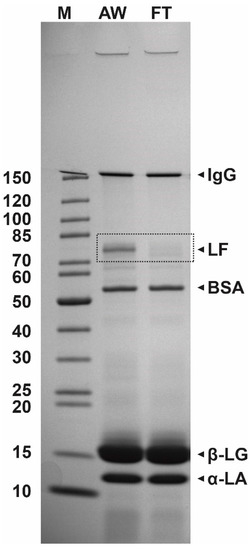
Figure 2.
The results of SDS-PAGE analysis (4–20% polyacrylamide gel) of protein composition of acid whey (AW) and flow-through whey (FT) after loading on the cation-exchange CIM® monolithic columns. M, protein weight marker (kDa).
Whey proteins have a wide range of isoelectric points (pI), and this characteristic enables their separation by ion-exchange chromatography. Three major components among whey proteins, β-lactoglobulin (β-LG), α-lactalbumin (α-LA), and bovine serum albumin (BSA) are acidic proteins, with isoelectric points 5.4, 4.4, and 5.1, respectively [6]. Bovine milk lactoperoxidase (LPO), however, is like LF a positively charged protein, both having isoelectric pH above 8 (9.6 and 8.0–8.5, respectively) [8,26,27], which makes their separation more difficult. In a process developed in this study, LF and lactoperoxidase, and partially Ig G (isoelectric pH 6, 4–9) were selectively bound on the monolith column. In the elution step, however, LF was selectively eluted from the column. As can be seen on the HPLC chromatogram (Figure 3), the concentrated eluate contained a high proportion of LF, in comparison with incoming whey, microfiltered whey and flow-through fractions where other proteins predominated.
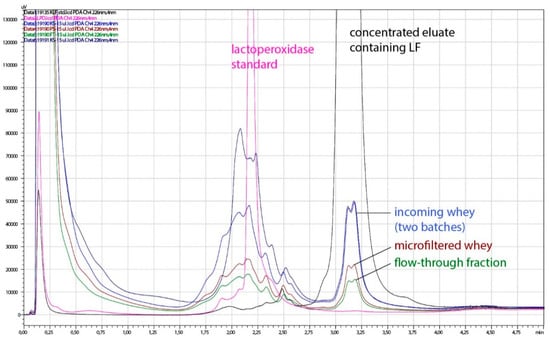
Figure 3.
Representative chromatogram of acid whey (AW) and fractions obtained during processing on a pilot plant. Pink line, lactoperoxidase standard; black line, concentrated eluate containing LF; blue lines, incoming whey (two batches); brown line, microfiltered whey; green line, flow-through fraction.
The product obtained after further processing of the eluate (desalting, concentrating, and drying) was characterized by a high content of LF and low content of other proteins (Figure 4, Table 2).
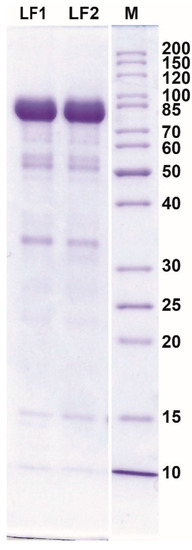
Figure 4.
The results of SDS-PAGE analysis of protein composition of dried lactoferrin samples obtained from acid whey (AW) using cation-exchange CIM® monolithic columns. M, protein weight marker (kDa).
Table 2.
HPLC determination of concentration and purity of nine lactoferrin samples produced in this study and of three commercial samples purchased on the market.
The process was established on the pilot plant, where approximately 1 m3 of income acid whey was processed in each batch. The LF content in different batches of income acid whey varied between 74.9 to 163.3 mg L−1, with an average concentration of 131 mg L−1 (Table 1). The losses of LF during filtration were not significant (p = 0.718). Anyway, due retention in a retentate, the concentration of LF in permeate was lower, which could be further improved by optimization of filtration conditions or implementation of diafiltration process. On average 15% of the LF present in the permeate after microfiltration, was found in the flow-through fraction after loading of the columns, while 85% was adsorbed to the column and further eluted, desalted and concentrated by spray-drying or freeze-drying. Using a pilot system, up to 90 g of high purity LF were obtained from 1000 L of acid whey, by cation-exchange chromatography on 8 L CIM® monolithic column (results not shown).
3.2. Characterisation of Dried Lactoferrin Produced on a Pilot Plant
The concentration and purity of obtained LF was compared with some products containing LF available on the market. The purity of nine batches of lactoferrin produced in this study, assessed on the basis of LF chromatographic peak area (HPLC) proportion (%) in relation of all proteins, reached the values 91.0–95.8%, while the purity of three products purchased on the market was below 88% (Table 2, Figure 5).
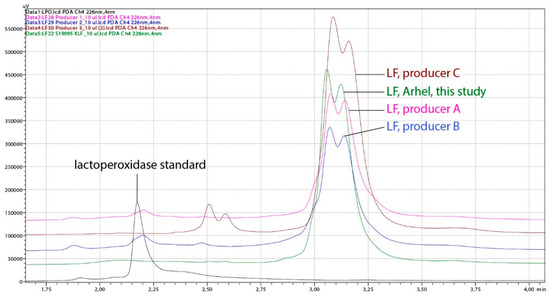
Figure 5.
Chromatograms obtained by HPLC analysis of representative lactoferrin (LF) sample, produced in this study (Arhel, 8 L CIM® monolithic column) and LF products purchased on the market (three different producers). The analysis was performed on the HPLC system weak cation exchange column CIMac™COOH-0.1. Black line, lactoperoxidase standard; green line, LF (Arhel, this study); pink line, LF of producer A; blue line, LF of producer B; brown line, LF of producer C.
Several protocols were developed at a lab-scale for the separation of minor and major whey proteins, resulting in high purity of proteins obtained. Du et al. [28] for instance, reported recovery of LF from whey with a purity of 88.5% using an expanded bed adsorption process with cation-exchanger. Some other processes reported, such as serial cation-anion exchange chromatography or magnetic affinity separation, leaded even to at least 95% pure LF [11,29]. The purity, however, remains a challenge when the protocols are up-scaled. While fractionation of all major and minor whey proteins with radial flow membrane adsorption chromatography at lab scale resulted in 97% pure LF, 89% purity of LF could be achieved at pilot scale [30].
Another important quality parameter of LF is its potential for Fe3+ binding (C-value, also UIBC) and the ratio of already bound Fe3+ (A-value). The iron, up to two iron atoms per molecule, can be efficiently trapped by iron-free apo-LF [31] which presents a basic mechanism of LF inhibitory activity against several G-bacteria. High C-value and low A-value of LF are, therefore, desirable. C-value of the native LF is theoretically 100%. Contrary to some commercial LF samples on the market, whose C- values did not exceed 57% (Table 3), the samples of LF produced in the pilot plant showed higher C (70–74%). Only two commercial LF samples showed the A-value similar to those determined for the samples from this study (2–4, 9). In addition, the overall bioactivity (A + C) were most favorable for LF produced in this study, indicating low denaturation of the molecules.
Table 3.
Iron-binding capacity (C-value), iron saturation (A-value) and overall bioactivity of commercially available lactoferrin (sevenproducers and standard LF Sigma) and LF produced in this study (LF Arhel). The sum of C- and A-values presents overall bioactivity of LF in the sample, i.e., the proportion of the active LF in the sample.
3.3. Temperature and pH Stability of the Produced Lactoferrin
In order to confirm that lactoferrin, that was exposed during the process of its isolation from the acid whey to heat treatment and other stress factors, retained pH- and temperature-stability, we investigated these features using fluorescence emission spectrophotometry and determination of UV melting curve. In addition, we investigated the thermal stability of iron-saturated LF at acidic pH since there is a limited information on this in the literature.
Figure 6 presents the fluorescence emission maxima (a–c) and fluorescence intensity ratio FI330/FI350 (d–f) of three LF samples differing in the iron saturation level (3.4%, 5.2%, 41.9%). Two transitions at pH 4.0 and pH 11.0 were observed, demonstrating good stability of LF in pH range from 4.0 to 11.0, regardless of the degree of saturation. Higher fluorescence emission maxima and lower fluorescence intensity ratios at pH 2.0 and pH 12.0, indication the unfolding of LF molecules, correlate with exposing tyrosine residues to the polar aqueous environment. These observations are in agreement with the previous studies [31,32]. The stability over a wide pH range good performance of LF during fermentation and during the passage through the gastrointestinal tract, where it is exposed to acidic pH values.
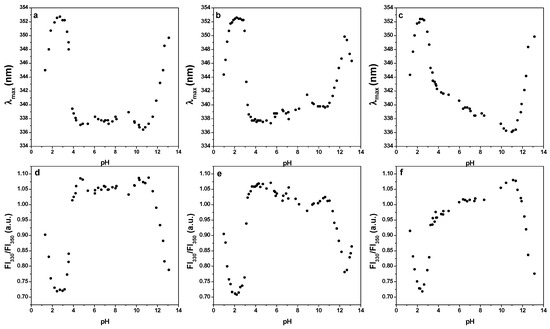
Figure 6.
Fluorescence emission maxima (λmax) and fluorescence intensity ratio FI330/FI350 of three different lactoferrins, respectively. Lactoferrin with iron saturation 3.4% (a,d), lactoferrin with iron saturation 5.2% (b,e), lactoferrin with iron saturation 41.9% (c,f). Excitation wavelenght was 293 nm and fluorescence emission spectra were recorded from 300 to 400 nm. Lactoferrin c = 0.2 mg mL−1, T = 20 °C.
Thermal stability of four apo-LF samples (A-values 3.4%, 4.6%, 5.1%, 5.2%) and one LF with higher iron saturation (A-value 41.9%) was studied at pH 4.0 (Figure 7a) and pH 7.0 (Figure 7b). At pH 7.0, apo-LFs showed thermal stability up to about 53 °C, with denaturation temperature (Tm) of 58.6 °C (±1.2 °C), while LF with higher iron content remained unchanged up to approximately 80 °C, with Tm 87.8 °C (±0.7 °C). Such results were expected since it is already well-known from the previous studies that apo-LF has more open conformation and is more prone to thermal denaturation than holo-LF, which has more closed conformation [33,34,35,36]. There is, however, limited data about the thermal stability of LF, in conjunction with iron saturation level, at acidic pH. At pH 4.0 all apo-LF samples from this study were thermally stable to approximately 40 °C with the denaturation temperature (Tm) about 44.7 °C (±0.8 °C), while LF with higher iron content (A-value = 41.9%) showed thermal stability up to approximately 70 °C, with Tm of 80.6 °C (± 0.3 °C). Comparison with the results obtained at pH 7 showed that all LF samples tested were more prone to denaturation in acidic conditions. Similar was reported by Abe et al. [37], whose observations based on HPLC pattern of heat-treated apo-LF, and Kawakami et al. [38] who observed the reduction (15–30%) of the iron-binding capacity of native LF after heat-treatment (90 °C/10 min) in acidic conditions. The results on the thermal stability of LF in acidic conditions, depending on the iron content, will be useful when developing of products (dairy, non-dairy food, food supplements) containing LF, with the aim of preserving the bioactivity of this heat-sensitive protein.
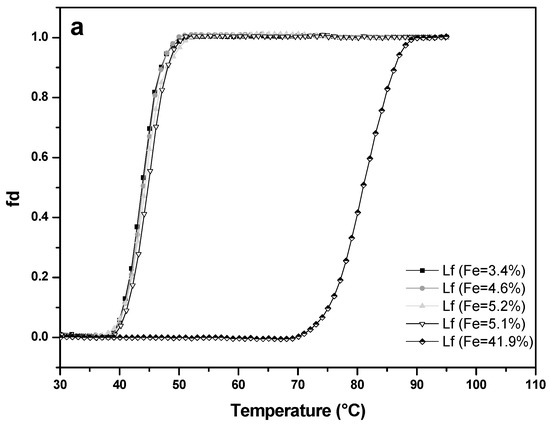
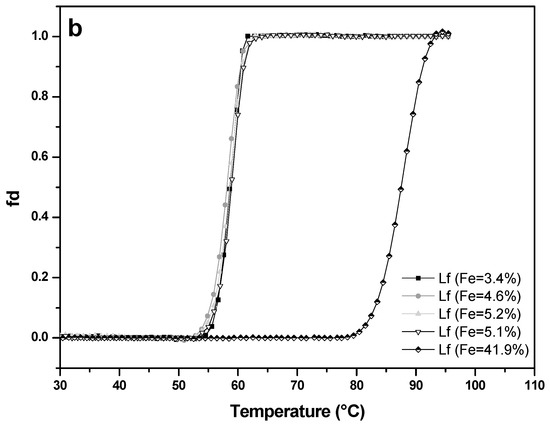
Figure 7.
Thermal stability of four lactoferrin samples with low iron saturation (A-value 3.4% to 5.2%) and of an iron-rich sample (A-value 41.9%) measured by UV–VIS spectrophotometry at pH 4.0 (a) and pH 7.0 (b). Lactoferrin concentration used was 0.5 mg mL−1 and the absorbance was recorded at 280 nm with a 1 °C increment per minute.
3.4. Biological—Antimicrobial Activity of Lactoferrin Produced in a Pilot Plant
Antibacterial activity of seven LF samples produced on a pilot plant was tested against different G+ and G- indicator bacteria strains including representatives of potentially pathogenic species such as Escherichia coli, Staphylococcus aureus, Listeria monocytogenes, Salmonella enterica, Clostridium difficile, Klebsiella oxytoca and Clostridium perfringens, and cheese spoiling Clostridium tyrobutyricum. Bifidobacteria and lactobacilli tested comprised isolates from cheeses, from yoghurt and representatives of probiotic cultures. All LF samples except sample 3 were apo-LFs, while sample 3 was intentionally saturated with Fe3+ (A-value 27.4%).
Sample 3, which differed from the rest in terms of lower iron-binding capacity, inhibited only listeria strains, but did not inhibit the other test bacteria strains (Table 4). All other LF samples inhibited all tested strains (enterobacteria, Staphylococcus, Streptococcus salivarius) except clostridia, lactobacilli, and bifidobacteria. Growth inhibition of various representatives of lactobacilli and bifidobacteria, which are probiotic strains or isolates from cheeses or yoghurt, was not observed by agar diffusion assay on a solid medium, which is in accordance with the previous studies [39]. Wide range of inhibitory activity of apo-LFs against enterobacteria and some G+ bacteria was expected since it is typical for this protein of human or animal origin [8]. The mechanism of antimicrobial activity of LF through the removal of iron from the environment and thus depriving bacteria of an iron source is well known and can explain the reduced activity of the sample saturated with iron [8,40,41]. There are three strains of Listeria monocytogenes, which have been successfully inhibited by all LF samples, including those with a lower iron-binding capacity, pointing to other mechanisms of action. It is well known that LF also affects the bacterial wall of G+ and G- bacteria, so that it binds to lipid A lipopolysaccharide, resulting in the release of this lipid and the injury of the external cell membrane [42,43].
Table 4.
Antibacterial activity of seven lactoferrin (LF) samples produced on a pilot plant (Arhel). 1, lyophilised LF, C-value (iron-binding capacity) 60%, A-value (iron saturation) 18.4%; 2, spray-dried LF (SDLF), C-value 66.8%, A-value 3.4%; 3, SDLF saturated with Fe3+, C-value 38%, A-value 27.4%; 4, SDLF, C-value 76%, A-value 4.6%; 5, SDLF, C-value 71.3%, A-value 3.7%; 6, SDLF, C-value 66.8%, A-value 3.4%; 7, SDLF, C value 68.8%, A-value 5.1%; +, partial inhibition (weaker growth); ++, complete inhibition (clear zone without colonies.
In order to quantitatively evaluate the antimicrobial activity of LF, we developed a microdilution assay, using the E. coli O157:H7 tox- (non-toxigenic mutant) strain as an indicator microorganism. The minimal inhibitory concentration of 9 batches of LF produced in this study (MIC 5–10 mg mL−1) was comparable to the previous reports [39] and was found to be lower in comparison with 3 LF samples purchased on the marked (MIC 40–70) (Figure 8). The MIC of LF against E. coli O157:H7 reported by Conesa et al. [44] was lower (0.5 mg mL−1), which could be explained by the differences among assays in the medium (1% peptone broth) and in the strain of E. coli O157:H7 used. The same authors also reported the absence of inhibition in TSB broth.
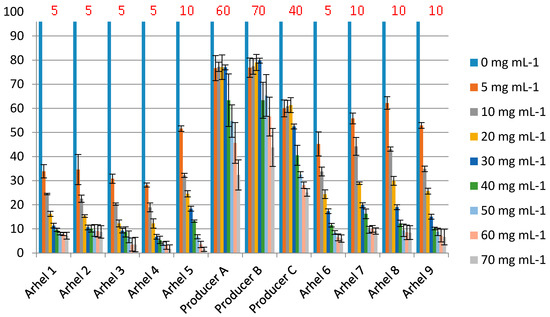
Figure 8.
The growth inhibition of E. coli O157: H7 tox- by nine samples of LF produced in this study (Arhel) and three LF products purchased on the market. The concentrations used in the assay apply to the concentration of pure lactoferrin (commercial products may contain some other ingredients). % of growth (measured as OD600) compared to the sample without added LF (100%) is shown. MIC breakpoint was the concentration of LF that resulted in >50% inhibition). MIC values are indicated above the bars (in red).
3.5. The Effect of Heat Treatment on Antibacterial Activity of Lactoferrin
In order to examine the effect of heat treatment on the biological activity of apo-LF produced in this study, two aliquots of LF solution (200 mg mL−1) were prepared, one was adjusted to pH 4.0 and another one to pH 7.0. Four aliquots of each solution were subjected to different heat treatments: (I) 15 min at 55 °C, (II) 15 min at 60 °C or (III) 3 s at 72 °C. After heat-treatment, the remaining antibacterial activity was assessed by the microdilution method. In general, heat treatment did not reduce antimicrobial activity against E. coli indicator strain, regardless of pH (Figure 9a,b). These results are in accordance with the previous study of Sánchez et al. [34], which showed that the pasteurization (72–74 °C, 15 s) had no significant effect on the structure of LF and on its immunoreactivity. Similarly, Conesa et al. [44] have observed that the heat treatment at 62 °C for 30 min (low temperature long time—LTLT pasteurization), at 72 °C for 15 s (high temperature short time—HTST pasteurization) and at 72 °C for 10 min did not affect the antibacterial activity of LF (iron saturation 26%) against E. coli O157:H7, but 85 °C for 10 min destroyed antimicrobial activity.
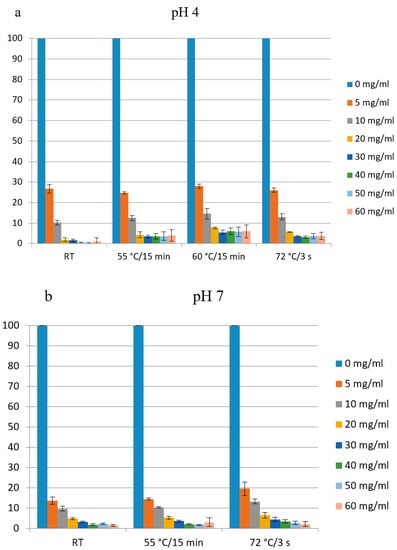
Figure 9.
Antimicrobial activity of lactoferrin produced in a pilot plant after heat treatment (15 min at 55 °C, 15 min at 60 °C or 3 s at 72 °C). Two aliquots of the sample (200 mg mL−1) were adjusted before the heat-treatment either to pH 7 (a) or to pH 4 (b). E. coli O157:H7 tox- was used as indicator strain. % of growth (measured as OD600) compared to the sample without added LF (100%) is shown.
The HPLC analysis of the same LF samples showed a slight degradation of LF observed as the lowering of the dual LF peak and the presence of an additional peak at higher salt concentration. When the pH of LF samples was adjusted to pH 4.0, slight degradation was observed in all heat-treated samples (55 °C/15 min, 60 °C/15 min, 72 °C/3 s), as well in the non-heated control (Figure 10). Heat treatment at pH 7.0 led to similar chromatographic pattern at pasteurization temperature only (Figure 11). The sample treated at 60 °C for 15 min at pH 7 could not be tested by HPLC or for antimicrobial activity since it was completely solidified. Given that spectroscopy carried out in this study showed slightly better thermal stability of apo-LF at pH 7 than at pH 4, these irreversible change might be a result of a combination of different factors such as high concentration of lactoferrin in the sample (200 mg mL−1), longer treatment and particular ionic strength. Partial degradation of some samples demonstrated by HPLC, however, did not result in the reduced antimicrobial activity, indicating that the iron-binding activity was not affected.
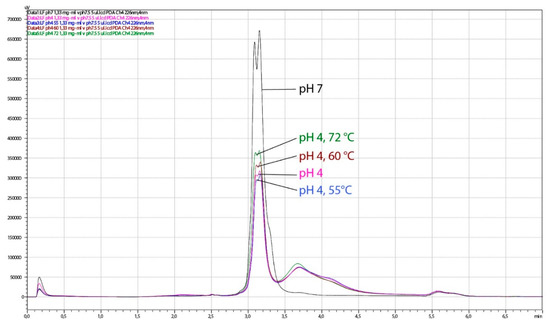
Figure 10.
Chromatograms obtained by HPLC analysis of lactoferrin (LF) samples, thermally treated at pH 4. The analysis was performed on the HPLC system weak cation exchange column CIMac™COOH-0.1. Black line, control 1 (no thermal treatment, LF in buffer pH 7.5); pink line, control 2 (no thermal treatment, pH 4); blue line, 15 min at 55 °C, pH 4; brown line, 15 min at 60 °C, pH 4; green line, 3 s at 72 °C, pH 4.
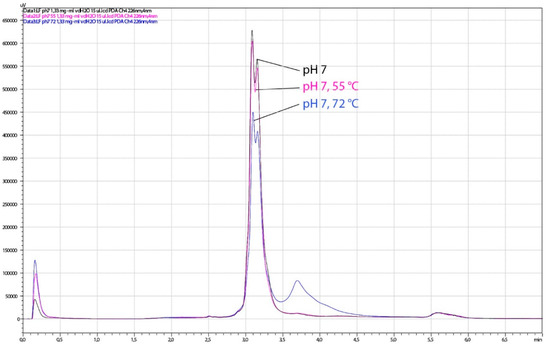
Figure 11.
Chromatograms obtained by HPLC analysis of lactoferrin (LF) samples, thermally treated at pH 7. The analysis was performed on the HPLC system weak cation exchange column CIMac™COOH-0.1. Black line, control LF (no thermal treatment); pink line, 15 min at 55 °C; blue line, 3 s at 72 °C.
The observation that the short treatment at pasteurization temperature 72 °C did not negatively affect the biological (antimicrobial) activity of LF from this study is particularly interesting from application point of view, as it confirms that pasteurization temperatures are suitable for the treatment of products containing LF produced in this pilot process.
4. Conclusions
These results demonstrate a high potential of monolithic ion-exchange chromatography for industrial processing of acid whey as a source of lactoferrin and possibly some other bioactive proteins which can be used in the new products with high-added value. With the applied procedure, predominately apo-LF was isolated, exhibiting high antimicrobial activity and high purity. A comparison of the antimicrobial activity of different LFs on the market showed that the purity of a protein product does not necessarily show its biological activity. The upscaling of the process is ongoing on a demonstration plant (Arhel company, 10–30 m3/day capacity).
Author Contributions
Conceptualization: B.B.M., M.Z.J., and N.P.U.; methodology: J.O., P.M.L., Š.G., and M.K.; validation: P.M.L., N.S., and M.K.; formal analysis: P.M.L., D.P., N.S., B.K., Š.G., and M.K.; funding acquisition: B.B.M. and M.Z.J.; data curation: B.B.M., B.K., Š.G., and J.O.; writing—original draft preparation: B.B.M., J.O., and Š.G.; writing—review and editing: P.M.L., N.P.U., M.Z.J., B.B.M. and M.Z.J. All authors have read and agreed to the published version of the manuscript.
Funding
This research was co-funded by European financial instrument LIFE: LIFE16 ENV/SI/000335 Reuse of waste acid whey for the extraction of bioactive proteins with high added value http://lifeforacidwhey.arhel.si/en and Support of Research and development projects (TRL 3–6), S4—Networks for the transition to a circular economy, Biomass and alternative raw materials: LAKTIKA, Fractionation and processing of whey proteins and exploitation of the residue for the formation of new functional foods and food supplements http://laktika.arhel.si/en.
Conflicts of Interest
The authors declare no conflict of interest.
References
- Jelen, P. Whey Processing-Utilization and Products. In Encyclopedia of Dairy Sciences, 2nd ed.; Academic Press: New York, NY, USA, 2011; Volume 4, pp. 731–737. [Google Scholar]
- Krolczyk, J.B.; Dawidziuk, T.; Janiszewska-Turak, E.; Solowiej, B. Use of Whey and Whey Preparations in the Food Industry—A Review. Pol. J. Food Nutr. Sci. 2016, 66, 157–165. [Google Scholar] [CrossRef]
- Božanić, R.; Barukčić, I.; Lisak, K.; Jakopović, K.L.; Tratnik, L. Possibilities of Whey Utilisation. Austin J. Nutr. Food Sci. 2014, 2, 1036. [Google Scholar]
- Erichson, B.E. Acid Whey: Is the Waste Product an Untapped Gold Mine? Chem. Eng. News 2017, 95, 26–30. [Google Scholar]
- Barukcic, I.; Jakopovic, K.L.; Bozanic, R. Valorisation of Whey and Buttermilk for Production of Functional Beverages-An Overview of Current Possibilities. Food Technol. Biotech. 2019, 57, 448–460. [Google Scholar] [CrossRef] [PubMed]
- Mollea, C.; Marmo, L.; Bosco, F. Valorisation of Cheese Whey, a By-Product from the Dairy Industry. In Food Industry; Mazzalupo, I., Ed.; InTECH: Vienna, Austria, 2013; pp. 549–588. Available online: http://dx.doi.org/10.5772/53159 (accessed on 30 May 2020).
- Iglesias-Figueroa, B.F.; Espinoza-Sánchez, E.A.; Siqueiros-Cendón, T.S.; Rascón-Cruz, Q. Lactoferrin as a Nutraceutical Protein from Milk, an overview. Int. Dairy J. 2019, 89, 37–41. [Google Scholar] [CrossRef]
- Gonzalez-Chavez, S.A.; Arevalo-Gallegos, S.; Rascon-Cruz, Q. Lactoferrin: Structure, Function and Applications. Int. J. Antimicrob. Agents 2009, 33, 301–308. [Google Scholar] [CrossRef]
- Demmelmair, H.; Prell, C.; Timby, N.; Lonnerdal, B. Benefits of Lactoferrin, Osteopontin and Milk Fat Globule Membranes for Infants. Nutrients 2017, 9, 817. [Google Scholar] [CrossRef] [PubMed]
- Hassoun, L.A.; Sivamani, R.K. A Systematic Review of Lactoferrin Use in Dermatology. Crit. Rev. Food Sci. Nutr. 2017, 57, 3632–3639. [Google Scholar] [CrossRef] [PubMed]
- Chen, L.; Guo, C.; Guan, Y.P.; Liu, H.Z. Isolation of Lactoferrin from Acid Whey by Magnetic Affinity Separation. Sep. Purif. Technol. 2007, 56, 168–174. [Google Scholar] [CrossRef]
- Noh, K.H.; Rhee, M.S.; Imm, J.Y. Separation of Lactoferrin from Model Whey Protein Mixture by Reverse Micelles Formed by Cationic Surfactant. Food Sci. Biotechnol. 2005, 14, 131–136. [Google Scholar]
- Almashikhi, S.A.; Lichan, E.; Nakai, S. Separation of Immunoglobulins and Lactoferrin from Cheese Whey by Chelating Chromatography. J. Dairy Sci. 1988, 71, 1747–1755. [Google Scholar] [CrossRef]
- Yoshida, A.; Wei, Z.; Shinmura, Y.; Fukunaga, N. Separation of Lactoferrin-a and -b from Bovine Colostrum. J. Dairy Sci. 2000, 83, 2211–2215. [Google Scholar] [CrossRef]
- Andersson, J.; Mattiasson, B. Simulated Moving Bed Technology with a Simplified Approach for Protein Purification-Separation of Lactoperoxidase and Lactoferrin from Whey Protein Concentrate. J. Chromatogr. A 2006, 1107, 88–95. [Google Scholar] [CrossRef]
- Lu, R.R.; Xu, S.Y.; Wang, Z.; Yang, R.J. Isolation of Lactoferrin from Bovine Colostrum by Ultrafiltration Coupled with Strong Cation Exchange Chromatography on a Production Scale. J. Membr. Sci. 2007, 297, 152–161. [Google Scholar] [CrossRef]
- Alvarez-Guerra, E.; Irabien, A. Extraction of Lactoferrin with Hydrophobic Ionic Liquids. Sep. Purif. Technol. 2012, 98, 432–440. [Google Scholar] [CrossRef]
- Adam, V.; Zitka, O.; Dolezal, P.; Zeman, L.; Horna, A.; Hubalek, J.; Sileny, J.; Krizkova, S.; Trnkova, L.; Kizek, R. Lactoferrin Isolation Using Monolithic Column Coupled with Spectrometric or Micro-Amperometric Detector. Sensors 2008, 8, 464–487. [Google Scholar] [CrossRef] [PubMed]
- Teepakorn, C.; Fiaty, K.; Charcosset, C. Comparison of Membrane Chromatography and Monolith Chromatography for Lactoferrin and Bovine Serum Albumin Separation. Processes 2016, 4, 31. [Google Scholar] [CrossRef]
- Nuijens, J.H.; Van Veen, H.H. Isolation of Lactoferrin from Milk. U.S. Patent 19960693274, 1996. [Google Scholar]
- Fee, C.J.; Chand, A. Capture of Lactoferrin and Lactoperoxidase from Raw whole Milk by Cation Exchange Chromatography. Sep. Purif. Technol. 2006, 48, 143–149. [Google Scholar] [CrossRef]
- Zmak, P.M.; Podgornik, H.; Jancar, J.; Podgornik, A.; Strancar, A. Transfer of gradient Chromatographic Methods for Protein Separation to Convective Interaction Media Monolithic Columns. J. Chromatogr. A 2003, 1006, 195–205. [Google Scholar] [CrossRef]
- Kete, M.; Štrancar, A.; Lokar, B.; Zupančič Justin, M. Method for Manufacturing Highly Purified Lactoferrin and Lactoperoxidase from Milk, Colostrum and Acid or Sweet Whey. EP Patent 18204674.8, 2018. [Google Scholar]
- Ito, S.; Ikuta, K.; Kato, D.; Shibusa, K.; Niizeki, N.; Tanaka, H.; Addo, L.; Toki, Y.; Hatayama, M.; Inamura, J.; et al. Non-Transferrin-Bound Iron Assay System Utilizing a Conventional Automated Analyzer. Clin. Chim. Acta 2014, 437, 129–135. [Google Scholar] [CrossRef] [PubMed]
- Poklar, N.; Vesnaver, G. Thermal Denaturation of Proteins Studied by UV Spectroscopy. J. Chem. Educ. 2000, 77, 380–382. [Google Scholar] [CrossRef]
- Borzouee, F.; Mofid, M.R.; Varshosaz, J.; Samsam Shariat, S.Z. Purification of Lactoperoxidase from Bovine Whey and Investigation of Kinetic Parameters. Adv. Biomed. Res. 2016, 5, 189. [Google Scholar] [PubMed]
- Kussendrager, K.D.; van Hooijdonk, A.C.M. Lactoperoxidase: Physico-Chemical properties, Occurrence, Mechanism of Action and Applications. Brit. J. Nutr. 2007, 84. [Google Scholar] [CrossRef] [PubMed]
- Du, Q.Y.; Lin, D.Q.; Xiong, Z.S.; Yao, S.J. One-Step Purification of Lactoferrin from Crude Sweet Whey Using Cation-Exchange Expanded Bed Adsorption. Ind. Eng. Chem. Res. 2013, 52, 2693–2699. [Google Scholar] [CrossRef]
- Wu, M.B.; Xu, Y.J. Isolation and Purification of Lactoferrin and Immunoglobulin G from bovine Colostrum with Serial Cation-Anion Exchange Chromatography. Biotechnol. Bioproc. Eng. 2009, 14, 155–160. [Google Scholar] [CrossRef]
- Voswinkel, L.; Kulozik, U. Fractionation of All Major and Minor Whey Proteins with Radial Flow Membrane Adsorption Chromatography at Lab and Pilot Scale. Int. Dairy J. 2014, 39, 209–214. [Google Scholar] [CrossRef]
- Sreedhara, A.; Kaul, P.; Flengsrud, R.; Vegarud, G.E.; Langsrud, T.; Prakash, V. Structural Characteristic, pH and Thermal Stabilities of Apo and Holo Forms of Caprine and Bovine Lactoferrins. Biometals 2010, 23, 1159–1170. [Google Scholar] [CrossRef] [PubMed]
- Sreedhara, A.; Flengsrud, R.; Prakash, V.; Krowarsch, D.; Langsrud, T.; Kaul, P.; Devold, T.G.; Vegarud, G.E. A Comparison of Effects of pH on the Thermal Stability and Conformation of Caprine and Bovine Lactoferrin. Int. Dairy J. 2010, 20, 487–494. [Google Scholar] [CrossRef]
- Harrington, J.P. Spectroscopic Analysis of the Unfolding of Transition Metal-Ion Complexes of Human Lactoferrin and Transferrin. Int. J. Biochem. 1992, 24, 275–280. [Google Scholar] [CrossRef]
- Sánchez, L.; Peiró, J.M.; Castillo, H.; Pérez, M.D.; Ena, J.M.; Calvo, M. Kinetic-Parameters for Denaturation of Bovine-Milk Lactoferrin. J. Food Sci. 1992, 57, 873–879. [Google Scholar] [CrossRef]
- Baker, E.N.; Baker, H.M. A Structural Framework for Understanding the Multifunctional Character of Lactoferrin. Biochimie 2009, 91, 3–10. [Google Scholar] [CrossRef] [PubMed]
- Sui, Q.; Roginski, H.; Williams, R.P.W.; Versteeg, C.; Wan, J. Effect of Pulsed Electric Field and thermal Treatment on the Physicochemical Properties of Lactoferrin with Different Iron Saturation Levels. Int. Dairy J. 2010, 20, 707–714. [Google Scholar] [CrossRef]
- Abe, H.; Saito, H.; Miyakawa, H.; Tamura, Y.; Shimamura, S.; Nagao, E.; Tomita, M. Heat Stability of Bovine Lactoferrin at Acidic pH. J. Dairy Sci. 1991, 74, 65–71. [Google Scholar] [CrossRef]
- Kawakami, H.; Tanaka, M.; Tatsumi, K.; Dosako, S. Effects of Ionic Strength and pH on the Thermostability of Lactoferrin. Int. Dairy J. 1992, 2, 287–298. [Google Scholar] [CrossRef]
- Chen, P.W.; Jheng, T.T.; Shyu, C.L.; Mao, F.C. Antimicrobial Potential for the Combination of Bovine Lactoferrin or Its Hydrolysate with Lactoferrin-Resistant Probiotics Against Foodborne Pathogens. J. Dairy Sci. 2013, 96, 1438–1446. [Google Scholar] [CrossRef]
- Rybarczyk, J.; Kieckens, E.; Vanrompay, D.; Cox, E. In Vitro and In Vivo Studies on the Antimicrobial Effect of Lactoferrin Against Escherichia coli O157:H7. Vet. Microbiol. 2017, 202, 23–28. [Google Scholar] [CrossRef]
- Aguila, A.; Herrera, A.G.; Morrison, D.; Cosgrove, B.; Perojo, A.; Montesinos, I.; Pérez, J.; Sierra, G.; Gemmell, C.G.; Brock, J.H. Bacteriostatic Activity of Human Lactoferrin Against Staphylococcus aureus is a Function of its Iron-Binding Properties and is not Influenced by Antibiotic Resistance. FEMS Immunol. Med. Microbiol. 2001, 31, 145–152. [Google Scholar] [CrossRef]
- Murdock, C.A.; Cleveland, J.; Matthews, K.R.; Chikindas, M.L. The Synergistic Effect of Nisin and Lactoferrin on the Inhibition of Listeria monocytogenes and Escherichia coli O157:H7. Lett. Appl. Microbiol. 2007, 44, 255–261. [Google Scholar] [CrossRef]
- Ellison, R.T.; Giehl, T.J.; Laforca, F.M. Damage of the Outer Membrane of Enteric Gram-Negative Bacteria by Lactoferrin and Transferrin. Infect. Immun. 1988, 56, 11. [Google Scholar] [CrossRef]
- Conesa, C.; Rota, C.; Castillo, E.; Pérez, M.D.; Calvo, M.; Sánchez, L. Effect of Heat Treatment on the Antibacterial Activity of Bovine Lactoferrin Against Three Foodborne Pathogens. Int. J. Dairy Technol. 2010, 63, 209–215. [Google Scholar] [CrossRef]


© 2020 by the authors. Licensee MDPI, Basel, Switzerland. This article is an open access article distributed under the terms and conditions of the Creative Commons Attribution (CC BY) license (http://creativecommons.org/licenses/by/4.0/).