Approaches in Design of Laboratory-Scale UASB Reactors


Abstract
1. Introduction
- Higher removal of contaminants;
- Higher biogas production rate;
- Shortening of adaptation period; and
- Resilience (robustness) of sludge.
- Organic Loading Rate (OLR) and Hydraulic Retention Time (HRT);
- Recycle ratio of effluent;
- Regulation of pH;
- Retention of biomass; and
- Granulation enhancement.
2. Review of Existing Solutions across Various Published Works
- used interchangeably (equally)
- ‘sludge bed’ refers to a layer of sludge at the bottom, where it is concentrated and visually seems to be a packed layer, while ‘sludge blanket’ refers to a part of the reactor where sludge is swimming as flocs above the ‘sludge bed’
- ‘sludge bed’ refers to a bottom layer of sludge, and uses ‘transition zone’ instead of a ‘sludge blanket’
3. Discussion
3.1. Volume of Reactor
3.2. Material of the Reactor
3.3. Heating of Reactor
3.4. Inoculum: Preparation, Adaptation, and Seeding
3.5. Substrate Adjustment
3.6. Granulation Stimulation
3.7. Start-up Feeding
3.8. Infrastructure of UASB Reactor
3.8.1. pH Adjusting and Alkalinity
3.8.2. Feeding and Recycling
- Granular sludge + soluble wastewater: 3 continuous, up to 6 peak for a couple of hours per day;
- Granular sludge + partially insoluble water: 1–1.25 , up to 2 peak for a couple of hours per day; and
- Flocculent sludge: 0.5 continuous, up to 2 peak.
3.8.3. Manual Injection Port
- urgent (emergency) injection of solution for managing pH, coagulation/flocculation, or granulation agent problems;
- testing an enhancement of inoculant via injection of specific microbial culture(s); and
- sampling of substrate which is supplied to a reactor after all mixing procedures.
3.8.4. Biogas Collection and Counting
- drop of the ambient temperature and, consequently, gas compression in gas lines according to the combined gas law;
- at the beginning of UASB operation, when substrate gradually fills the reactor and gas tubes have residual air. The oxygen from residual air is consumed and thus the volume shrinks.
- ingress of liquid from reactor to a gas line, which potentially grabs the foam and clogs the pipeline.
- if water displacement gas counter is used: backflow of liquid from counter back to a reactor.
3.9. Tracking Operational Parameters
4. Conclusions
Author Contributions
Funding
Conflicts of Interest
Abbreviations
| AD | Anaerobic Digestion | sCOD | Soluble COD |
| BOD | Biological Oxygen Demand | SRT | Solids Retention Time |
| COD | Chemical Oxygen Demand | TA | Total Alkalinity |
| CSTR | Continuous Stirred-Tank Reactor | TKN | Total Kjeldahl Nitrogen |
| EPS | Exocellular Polymeric Substances | TOC | Total Organic Carbon |
| GLSS | Gas–Liquid–Solids Separator | TS | Total Solids |
| HRT | Hydraulic Retention Time | TSS | Total Suspended Solids |
| ID | Inner diameter | UASB | Up-flow Anaerobic Sludge Blanket |
| OD | Outer diameter | UPVC | Unplasticized Polyvinyl Chloride |
| OLR | Organic Loading Rate | VFA | Volatile Fatty Acids |
| PMMA | Polymethyl methacrylate | VS | Volatile Solids |
| PVC | PolyVinyl Chloride | VSS | Volatile Suspended Solids |
References
- Saleh, M.M.A.; Mahmood, U.F. UASB/EGSB Applications for Industrial Wastewater Treatment. In Proceedings of the Seventh International Water Technology Conference Egypt, Cairo, Egypt, 1–3 April 2003; pp. 335–344. [Google Scholar]
- Seghezzo, L.; Zeeman, G.; Van Lier, J.B.; Hamelers, H.V.M.; Lettinga, G. A review: The anaerobic treatment of sewage in UASB and EGSB reactors. Bioresour. Technol. 1998, 65, 175–190. [Google Scholar] [CrossRef]
- Yoochatchaval, W.; Ohashi, A.; Harada, H.; Yamaguchi, T.; Syutsubo, K. Characteristics of granular sludge in an EGSB reactor for treating low strength wastewater. Int. J. Environ. Res. 2008, 2, 319–328. [Google Scholar]
- Mutombo, D.T. Internal circulation reactor: Pushing the limits of anaerobic industrial effluents treatment technologies. In Proceedings of the 2004 Water Institute of Southern Africa (WISA) Biennial Conference, Cape Town, South Africa, 2–6 May 2004; pp. 608–616. [Google Scholar]
- Xu, F.; Miao, H.-F.; Huang, Z.-X.; Ren, H.-Y.; Zhao, M.-X.; Ruan, W.-Q. Performance and dynamic characteristics of microbial communities in an internal circulation reactor for treating brewery wastewater. Environ. Technol. 2013, 34, 2881–2888. [Google Scholar] [CrossRef] [PubMed]
- Habets, L.H.A. Introduction of the IC Reactor in the Paper Industry; Technical Report; Paques BV: Balk, The Netherlands, 1999. [Google Scholar]
- Fang, H.H.P.; Chui, H.K.; Li, Y.Y. Microbial structure and activity of UASB granules treating different wastewaters. Water Sci. Technol. 1994, 30, 87–96. [Google Scholar] [CrossRef]
- Fang, H.H.P. Microbial distribution in UASB granules and its resulting effects. Water Sci. Technol. 2000, 42, 201–208. [Google Scholar] [CrossRef]
- Look, H.P. The Phenomenon of Granulation of Anaerobic Sludge. Ph.D. Thesis, Agricultural University, Wageningen, The Netherlands, 1989. [Google Scholar]
- Lettinga, G.; Hulshoff Pol, L.W. UASB-process design for various types of wastewaters. Water Sci. Technol. 1991, 24, 87–107. [Google Scholar] [CrossRef]
- Pol, L.W.H.; Dezeeuw, W.J.; Velzeboer, C.T.M.; Lettinga, G. Granulation in UASB-reactors. Water Sci. Technol. 1983, 15, 291–304. [Google Scholar]
- Kosaric, N.; Blaszczyk, R.; Orphan, L.; Valladarfs, J. The characteristics of granules from upflow anaerobic sludge blanket reactors. Water Res. 1990, 24, 1473–1477. [Google Scholar] [CrossRef]
- Novaes, R.F.V. Microbiology of anaerobic digestion. Water Sci. Technol. 1986, 18, 1–14. [Google Scholar] [CrossRef]
- Shivayogimath, C.B.; Ramanujam, T.K. Treatment of distillery spentwash by hybrid UASB reactor. Bioprocess Eng. 1999, 21, 255–259. [Google Scholar] [CrossRef]
- Owusu-Agyeman, I.; Eyice, Ö.; Cetecioglu, Z.; Plaza, E. The study of structure of anaerobic granules and methane producing pathways of pilot-scale UASB reactors treating municipal wastewater under sub-mesophilic conditions. Bioresour. Technol. 2019, 290, 121733. [Google Scholar] [CrossRef] [PubMed]
- Kong, Z.; Li, L.; Li, Y.-Y. Characterization and variation of microbial community structure during the anaerobic treatment of N, N-dimethylformamide-containing wastewater by UASB with artificially mixed consortium. Bioresour. Technol. 2018, 268, 434–444. [Google Scholar] [CrossRef] [PubMed]
- Dolfing, J.; Griffioen, A.; Van Neerven, A.R.W.; Zevenhuizen, L.P.T.M. Chemical and bacteriological composition of granular methanogenic sludge. Can. J. Microbiol. 1985, 31, 744–750. [Google Scholar] [CrossRef]
- Schmidt, J.E.; Ahring, B.K. Granular sludge formation in upflow anaerobic sludge blanket (UASB) reactors. Biotechnol. Bioeng. 1996, 49, 229–246. [Google Scholar] [CrossRef]
- Pereboom, J.H.F. Size distribution model for methanogenic granules from full scale UASB and IC reactors. Water Sci. Technol. 1994, 30, 211–221. [Google Scholar] [CrossRef]
- Jijai, S.; Srisuwan, G.; O-Thong, S.; Ismail, N.; Siripatana, C. Effect of Granule Sizes on the Performance of Upflow Anaerobic Sludge Blanket (UASB) Reactors for Cassava Wastewater Treatment; Elsevier B.V.: Amsterdam, The Netherlands, 2015; Volume 79. [Google Scholar]
- Dolfing, J. Granulation in UASB reactors. Water Sci. Technol. 1986, 18, 15–25. [Google Scholar] [CrossRef]
- Wu, J.; Lu, Z.Y.; Hu, J.C.; Feng, L.; Huang, J.D.; Gu, X.S. Disruption of granules by hydrodynamic force in internal circulation anaerobic reactor. Water Sci. Technol. 2006, 54, 9–16. [Google Scholar] [CrossRef]
- Liu, Y.-Q.; Liu, Y.; Tay, J.-H. The effects of extracellular polymeric substances on the formation and stability of biogranules. Appl. Microbiol. Biotechnol. 2004, 65, 143–148. [Google Scholar] [CrossRef]
- Sayed, S.; Dezeeuw, W.; Lettinga, G. Anaerobic treatment of slaughterhouse waste using a flocculant sludge UASB reactor. Agric. Wastes 1984, 11, 197–226. [Google Scholar] [CrossRef]
- Trulli, E.; Torretta, V. Influence of feeding mixture composition in batch anaerobic co-digestion of stabilized municipal sludge and waste from dairy farms. Environ. Technol. 2015, 36, 1519–1528. [Google Scholar] [CrossRef] [PubMed]
- Koster, I.W.; Lettinga, G. Application of the upflow anaerobic sludge bed (UASB) process for treatment of complex wastewaters at low-temperatures. Biotechnol. Bioeng. 1985, 27, 1411–1417. [Google Scholar] [CrossRef] [PubMed]
- Fang, H.H.P.; Chui, H.-K.; Li, Y.-Y. Anaerobic degradation of butyrate in a UASB reactor. Bioresour. Technol. 1995, 51, 75–81. [Google Scholar] [CrossRef]
- Kida, K.; Tanemura, K.; Sonoda, Y.; Hikami, S. Anaerobic treatment of distillery wastewater from barley-Shochu making by UASB. J. Ferment. Bioeng. 1994, 77, 90–93. [Google Scholar] [CrossRef]
- España-Gamboa, E.I.; Mijangos-Cortés, J.O.; Hernández-Zárate, G.; Maldonado, J.A.D.; Alzate-Gaviria, L.M. Methane production by treating vinasses from hydrous ethanol using a modified UASB reactor. Biotechnol. Biofuels 2012, 5, 82. [Google Scholar] [CrossRef]
- Caixeta, C.E.T.; Cammarota, M.C.; Xavier, A.M.F. Slaughterhouse wastewater treatment: Evaluation of a new three-phase separation system in a UASB reactor. Bioresour. Technol. 2002, 81, 61–69. [Google Scholar] [CrossRef]
- Hutňan, M.; Drtil, M.; Mrafková, L.; Derco, J.; Buday, J. Comparison of startup and anaerobic wastewater treatment in UASB, hybrid and baffled reactor. Bioprocess Eng. 1999, 21, 439–445. [Google Scholar] [CrossRef]
- Ten Brummeler, E.; Hulshoff Pol, L.W.; Dolfing, J. Methanogenesis in an upflow anaerobic sludge blanket reactor at pH 6 on an acetate-propionate mixture. Appl. Environ. Microbiol. 1985, 49, 1472–1477. [Google Scholar] [CrossRef] [PubMed]
- Feng, Q.; Song, Y.C.; Yoo, K.; Kuppanan, N.; Subudhi, S.; Lal, B. Polarized electrode enhances biological direct interspecies electron transfer for methane production in upflow anaerobic bioelectrochemical reactor. Chemosphere 2018, 204, 186–192. [Google Scholar] [CrossRef]
- Zhao, Z.; Zhang, Y.; Chen, S.; Quan, X.; Yu, Q. Bioelectrochemical enhancement of anaerobic methanogenesis for high organic load rate wastewater treatment in a up-flow anaerobic sludge blanket (UASB) reactor. Sci. Rep. 2015, 4, 6658. [Google Scholar] [CrossRef]
- Alimahmoodi, M.; Mulligan, C.N. Anaerobic bioconversion of carbon dioxide to biogas in an upflow anaerobic sludge blanket reactor. J. Air Waste Manag. Assoc. 2008, 58, 95–103. [Google Scholar] [CrossRef]
- Gong, D.; Qin, G. Treatment of oilfield wastewater using a microbial fuel cell integrated with an up-flow anaerobic sludge blanket reactor. Desalin. Water Treat. 2012, 49, 272–280. [Google Scholar] [CrossRef]
- De Mendonça, H.V.; Ometto, J.P.H.B.; Otenio, M.H.; Delgado Dos Reis, A.J.; Marques, I.P.R. Bioenergy recovery from cattle wastewater in an UASB-AF hybrid reactor. Water Sci. Technol. 2017, 76, 2268–2279. [Google Scholar] [CrossRef] [PubMed]
- Gupta, S.K.; Gupta, S.K. Morphological study of the granules in UASB and hybrid reactors. Clean Technol. Environ. Policy 2005, 7, 203–212. [Google Scholar] [CrossRef]
- Ramakrishnan, A.; Surampalli, R.Y. Comparative performance of UASB and anaerobic hybrid reactors for the treatment of complex phenolic wastewater. Bioresour. Technol. 2012, 123, 352–359. [Google Scholar] [CrossRef] [PubMed]
- Halalsheh, M.M.; Muhsen, H.H.; Shatanawi, K.M.; Field, J.A. Improving solids retention in upflow anaerobic sludge blanket reactors at low temperatures using lamella settlers. J. Environ. Sci. Heal. Part A Toxic Hazard. Subst. Environ. Eng. 2010, 45, 1054–1059. [Google Scholar] [CrossRef]
- Lettinga, G.; Van Velsen, A.F.M.; Hobma, S.W.; De Zeeuw, W.; Klapwijk, A. Use of the upflow sludge blanket (USB) reactor concept for biological wastewater treatment, especially for anaerobic treatment. Biotechnol. Bioeng. 1980, 22, 699–734. [Google Scholar] [CrossRef]
- Selvamurugan, M.; Doraisamy, P.; Maheswari, M.; Nandakumar, N.B. Comparative study on startup performance of UAHR and UASB reactors in anaerobic treatment of distillery spentwash. Int. J. Environ. Res. 2012, 6, 235–244. [Google Scholar]
- Selvamurugan, M.; Doraisamy, P.; Maheswari, M. High-rate anaerobic treatment of distillery spentwash using UASB and UAHR. Int. J. Environ. Eng. 2014, 6, 273–286. [Google Scholar] [CrossRef]
- Patyal, V. Study of biogas generation in treatment of distillery wastewater by UASB method. Int. J. Eng. Res. 2016, V5, 634–639. [Google Scholar]
- Tandukar, M.; Ohashi, A.; Harada, H. Performance comparison of a pilot-scale UASB and DHS system and activated sludge process for the treatment of municipal wastewater. Water Res. 2007, 41, 2697–2705. [Google Scholar] [CrossRef]
- Buzzini, A.P.; Patrizzi, L.J.; Motheo, A.J.; Pires, E.C. Preliminary evaluation of the electrochemical and chemical coagulation processes in the post-treatment of effluent from an upflow anaerobic sludge blanket (UASB) reactor. J. Environ. Manag. 2007, 85, 847–857. [Google Scholar] [CrossRef] [PubMed]
- Sponza, D.T. Anaerobic granule formation and tetrachloroethylene (TCE) removal in an upflow anaerobic sludge blanket (UASB) reactor. Enzym. Microb. Technol. 2001, 29, 417–427. [Google Scholar] [CrossRef]
- Das, S.; Sarkar, S.; Chaudhari, S. Modification of UASB reactor by using CFD simulations for enhanced treatment of municipal sewage. Water Sci. Technol. 2018, 77, 766–776. [Google Scholar] [CrossRef]
- Kettunen, R.H.; Rintala, J.A. Performance of an on-site UASB reactor treating leachate at low temperature. Water Res. 1998, 32, 537–546. [Google Scholar] [CrossRef]
- Elmitwalli, T.A.; Shalabi, M.; Wendland, C.; Otterpohl, R. Grey water treatment in UASB reactor at ambient temperature. Water Sci. Technol. 2007, 55, 173–180. [Google Scholar] [CrossRef] [PubMed]
- Dos Santos, S.L.; Chaves, S.R.M.; Van Haandel, A. Influence of temperature on the performance of anaerobic treatment systems of municipal wastewater. Water SA 2018, 44, 211–222. [Google Scholar] [CrossRef]
- Sousa, J.; Santos, K.; Henrique, I.; Brasil, D.; Santos, E. Anaerobic digestion and the denitrification in UASB reactor. J. Urban Environ. Eng. 2008, 2, 63–67. [Google Scholar] [CrossRef]
- Del Nery, V.; Alves, I.; Zamariolli Damianovic, M.H.R.; Pires, E.C. Hydraulic and organic rates applied to pilot scale UASB reactor for sugar cane vinasse degradation and biogas generation. Biomass Bioenergy 2018, 119, 411–417. [Google Scholar] [CrossRef]
- El-Seddik, M.M.; Galal, M.M.; Radwan, A.G.; Abdel-Halim, H.S. Fractional-order model (FOM) for high-strength substrate biodegradation in conventional UASB reactor. Biochem. Eng. J. 2018, 133, 39–46. [Google Scholar] [CrossRef]
- Yangin-Gomec, C.; Pekyavas, G.; Sapmaz, T.; Aydin, S.; Ince, B.; Akyol, Ç.; Ince, O. Microbial monitoring of ammonia removal in a UASB reactor treating pre-digested chicken manure with anaerobic granular inoculum. Bioresour. Technol. 2017, 241, 332–339. [Google Scholar] [CrossRef]
- Fang, H.H.P.; Chui, H.K. Maximum COD loading capacity in UASB reactors at 37 °C. J. Environ. Eng. 1993, 119, 103–119. [Google Scholar] [CrossRef]
- Harshan, K.G.; Gana, V.B. Characterization of sewage, design of laboratory scale UASB reactor for its treatment and its performance evaluation. Int. J. Res. Sci. Innov. 2018, V, 37–43. [Google Scholar]
- Shi, R.; Zhang, Y.; Xu, H.; Zhang, Z.; Zhang, C. Pretreatment of distillery wastewater from vitamin C synthesis industry by upflow anaerobic sludge blanket (UASB) reactor. Environ. Eng. Sci. 2007, 24, 1333–1337. [Google Scholar] [CrossRef]
- Saner, A.B.; Mungray, A.K.; Mistry, N.J. Treatment of distillery wastewater in an upflow anaerobic sludge blanket (UASB) reactor. Desalin. Water Treat. 2016, 57, 4328–4344. [Google Scholar] [CrossRef]
- Harada, H.; Uemura, S.; Chen, A.-C.; Jayadevan, J. Anaerobic treatment of a recalcitrant distillery wastewater by a thermophilic UASB reactor. Bioresour. Technol. 1996, 55, 215–221. [Google Scholar] [CrossRef]
- Kwong, T.S.; Fang, H.H.P. Anaerobic degradation of cornstarch in wastewater in two upflow reactors. J. Environ. Eng. 1996, 122, 9–17. [Google Scholar] [CrossRef]
- Bakraoui, M.; Karouach, F.; Ouhammou, B.; Aggour, M.; Essamri, A.; El Bari, H. Biogas production from recycled paper mill wastewater by UASB digester: Optimal and mesophilic conditions. Biotechnol. Rep. 2020, 25, e00402. [Google Scholar] [CrossRef] [PubMed]
- Moe, N.S.; Aung, E.M. A laboratory scale up-flow anaerobic sludge blanket (UASB) reactor for distillery wastewater treatment. Int. J. Sci. Eng. Technol. Res. 2014, 3, 4050–4055. [Google Scholar]
- Sosa-Villalobos, C.A.; Rustrián, E.; Houbron, E. Anaerobic digestion of vinasse cane alcohol: The influence of OLR by a UASB reactor. Int. J. Mod. Eng. Res. 2014, 4, 37–42. [Google Scholar]
- Gao, M.; She, Z.; Jin, C. Performance evaluation of a mesophilic (37 °C) upflow anaerobic sludge blanket reactor in treating distiller’s grains wastewater. J. Hazard. Mater. 2007, 141, 808–813. [Google Scholar] [CrossRef]
- El-Sheikh, M.A.; Saleh, H.I.; Flora, J.R.; AbdEl-Ghany, M.R. Biological tannery wastewater treatment using two stage UASB reactors. Desalination 2011, 276, 253–259. [Google Scholar] [CrossRef]
- Tejasen, S.; Taruyanon, K. Modelling of Two-stage anaerobic treating wastewater from a molasses-based ethanol distillery with the IWA anaerobic digestion model No.1. Eng. J. 2010, 14, 25–36. [Google Scholar] [CrossRef]
- Molina, F.; Ruiz-Filippi, G.; García, C.; Roca, E.; Lema, J.M. Winery effluent treatment at an anaerobic hybrid USBF pilot plant under normal and abnormal operation. Water Sci. Technol. 2007, 56, 25–31. [Google Scholar] [CrossRef] [PubMed]
- Colleran, E.; Concannon, F.; Golden, T.; Geoghegan, F.; Crumlish, B.; Killilea, E.; Henry, M.; Coates, J. Use of methanogenic activity tests to characterize anaerobic sludges, screen for anaerobic biodegradability and determine toxicity thresholds against individual anaerobic trophic groups and species. Water Sci. Technol. 1992, 25, 31–40. [Google Scholar] [CrossRef]
- Hussain, A.; Dubey, S.K. Specific methanogenic activity test for anaerobic degradation of influents. Appl. Water Sci. 2017, 7, 535–542. [Google Scholar] [CrossRef]
- Angelidaki, I.; Alves, M.; Bolzonella, D.; Borzacconi, L.; Campos, J.L.; Guwy, A.J.; Kalyuzhnyi, S.; Jenicek, P.; Van Lier, J.B. Defining the biomethane potential (BMP) of solid organic wastes and energy crops: A proposed protocol for batch assays. Water Sci. Technol. 2009, 59, 927–934. [Google Scholar] [CrossRef]
- Borja, R.; Alba, J.; Banks, C.J. Anaerobic digestion of wash waters derived from the purification of virgin olive oil using a hybrid reactor combining a filter and a sludge blanket. Process Biochem. 1996, 31, 219–224. [Google Scholar] [CrossRef]
- Lettinga, G.; Hobma, S.W.; Hulshoff Pol, L.W.; De Zeeuw, W.; De Jong, P.; Grin, P.; Roersma, R. Design operation and economy of anaerobic treatment. Water Sci. Technol. 1983, 15, 177–195. [Google Scholar] [CrossRef]
- Lettinga, G.; Pol, L.W.H.; Koster, I.W.; Wiegant, W.M.; Dezeeuw, W.J.; Rinzema, A.; Grin, P.C.; Roersma, R.E.; Hobma, S.W. High-rate anaerobic wastewater-treatment using the uasb reactor under a wide-range of temperature conditions. Biotechnol. Genet. Eng. Rev. 1984, 2, 253–284. [Google Scholar] [CrossRef]
- Rizvi, H.; Ahmad, N.; Abbas, F.; Bukhari, I.H.; Yasar, A.; Ali, S.; Yasmeen, T.; Riaz, M. Start-up of UASB reactors treating municipal wastewater and effect of temperature/sludge age and hydraulic retention time (HRT) on its performance. Arab. J. Chem. 2015, 8, 780–786. [Google Scholar] [CrossRef]
- Baird, R.B.; Eaton, A.D.; Rice, E.W.; Bridgewater, L. Standard Methods for the Examination of Water and Wastewater, 23rd ed.; American Public Health Association: Washington, DC, USA; American Water Works Association: Denver, CO, USA; Water Environment Federation: Alexandria, VA, USA, 2017; ISBN 9780875532875. [Google Scholar]
- Manyuchi, M.M.; Mbohwa, C.; Muzenda, E. Anaerobic treatment of opaque beer wastewater with enhanced biogas recovery through Acti-zyme bio augmentation. S. Afr. J. Chem. Eng. 2018, 26, 74–79. [Google Scholar] [CrossRef]
- Chamarro, E. Use of fenton reagent to improve organic chemical biodegradability. Water Res. 2001, 35, 1047–1051. [Google Scholar] [CrossRef]
- Metcalf and Eddy. Wastewater Engineering: Treatment and Resource Recovery; McGraw-Hill: New York, NY, USA, 2014; ISBN 9780073401188. [Google Scholar]
- Tomašić, V.; Zelić, B. (Eds.) Environmental Engineering; De Gruyter: Berlin, Germany; Boston, MA, USA, 2018; ISBN 9783110468038. [Google Scholar]
- Contreras, S.; Rodrı́guez, M.; Momani, F.A.; Sans, C.; Esplugas, S. Contribution of the ozonation pre-treatment to the biodegradation of aqueous solutions of 2,4-dichlorophenol. Water Res. 2003, 37, 3164–3171. [Google Scholar] [CrossRef]
- Zheng, C.; Zhao, L.; Zhou, X.; Fu, Z.; Li, A. Treatment technologies for organic wastewater. In Water Treatment; InTech: London, UK, 2013. [Google Scholar]
- Li, H.; Zhou, S.; Sun, Y.; Feng, P.; Li, J. Advanced treatment of landfill leachate by a new combination process in a full-scale plant. J. Hazard. Mater. 2009, 172, 408–415. [Google Scholar] [CrossRef]
- Czajkowska, J.; Hawer-Strojek, P.; Reczek, L.; Bugajski, P.; Michel, M.; Gajewska, M.; Siwiec, T.; Jóźwiakowski, K.; Gut, B. Correlations between organic pollution indicators in municipal wastewater. Arch. Environ. Prot. 2018, 44, 50–57. [Google Scholar]
- Govahi, S.; Karimi-Jashni, A.; Derakhshan, M. Treatability of landfill leachate by combined upflow anaerobic sludge blanket reactor and aerated lagoon. Int. J. Environ. Sci. Technol. 2012, 9, 145–151. [Google Scholar] [CrossRef]
- Choi, Y.; Ryu, J.; Lee, S.R. Influence of carbon type and carbon to nitrogen ratio on the biochemical methane potential, pH, and ammonia nitrogen in anaerobic digestion. J. Anim. Sci. Technol. 2020, 62, 74–83. [Google Scholar] [CrossRef]
- Wang, X.; Lu, X.; Li, F.; Yang, G. Effects of temperature and carbon-nitrogen (C/N) ratio on the performance of anaerobic co-digestion of dairy manure, chicken manure and rice straw: Focusing on ammonia inhibition. PLoS ONE 2014, 9, e97265. [Google Scholar] [CrossRef]
- Wang, X.; Yang, G.; Feng, Y.; Ren, G.; Han, X. Optimizing feeding composition and carbon–nitrogen ratios for improved methane yield during anaerobic co-digestion of dairy, chicken manure and wheat straw. Bioresour. Technol. 2012, 120, 78–83. [Google Scholar] [CrossRef]
- Bouallagui, H.; Lahdheb, H.; Ben Romdan, E.; Rachdi, B.; Hamdi, M. Improvement of fruit and vegetable waste anaerobic digestion performance and stability with co-substrates addition. J. Environ. Manag. 2009, 90, 1844–1849. [Google Scholar] [CrossRef]
- Yen, H.W.; Brune, D.E. Anaerobic co-digestion of algal sludge and waste paper to produce methane. Bioresour. Technol. 2007, 98, 130–134. [Google Scholar] [CrossRef] [PubMed]
- Soboh, Y.M.; Sorensen, D.L.; Sims, R.C. Upflow anaerobic sludge blanket reactor codigestion of algae and acetate to produce methane. Water Environ. Res. 2016, 88, 2094–2103. [Google Scholar] [CrossRef] [PubMed]
- Sievers, D.M.; Brune, D.E. Brune carbon/nitrogen ratio and anaerobic digestion of swine waste. Trans. ASAE 1978, 21, 537–541. [Google Scholar] [CrossRef]
- Matin, H.A. The influence of microbial consortium and C/N ratio to biogas production from rice husk waste by using solid state anaerobic digestion (SS-AD). In Proceedings of the E3S Web Conference, Semarang, Indonesia, 15–16 August 2017; Volume 73, p. 01018. [Google Scholar]
- Scherer, P.; Lippert, H.; Wolff, G. Composition of the major elements and trace elements of 10 methanogenic bacteria determined by inductively coupled plasma emission spectrometry. Biol. Trace Elem. Res. 1983, 5, 149–163. [Google Scholar] [CrossRef]
- Arne Alphenaar, P.; Sleyster, R.; De Reuver, P.; Ligthart, G.-J.; Lettinga, G. Phosphorus requirement in high-rate anaerobic wastewater treatment. Water Res. 1993, 27, 749–756. [Google Scholar] [CrossRef]
- Gil, A.; Siles, J.A.; Serrano, A.; Chica, A.F.; Martín, M.A. Effect of variation in the C/[N+P] ratio on anaerobic digestion. Environ. Prog. Sustain. Energy 2019, 38, 228–236. [Google Scholar] [CrossRef]
- Wilkie, A.; Goto, M.; Bordeaux, F.M.; Smith, P.H. Enhancement of anaerobic methanogenesis from napiergrass by addition of micronutrients. Biomass 1986, 11, 135–146. [Google Scholar] [CrossRef]
- Zandvoort, M.H.; Van Hullebusch, E.D.; Gieteling, J.; Lettinga, G.; Lens, P.N.L. Effect of sulfur source on the performance and metal retention of methanol-fed UASB reactors. Biotechnol. Prog. 2005, 21, 839–850. [Google Scholar] [CrossRef] [PubMed]
- Fricke, K.; Santen, H.; Wallmann, R.; Hüttner, A.; Dichtl, N. Operating problems in anaerobic digestion plants resulting from nitrogen in MSW. Waste Manag. 2007, 27, 30–43. [Google Scholar] [CrossRef]
- Ranalli, P. (Ed.) Improvement of Crop Plants for Industrial End Uses; Springer Netherlands: Dordrecht, The Netherlands, 2007; ISBN 978-1-4020-5485-3. [Google Scholar]
- Fang, H.H.P.; Zhang, T. Anaerobic Biotechnology: Environmental Protection and Resource Recovery; Imperial College Press: London, UK, 2015; ISBN 978-1-78326-790-3. [Google Scholar]
- Speece, R.E. Anaerobic Biotechnology for Industrial Wastewaters; Archae Press: Nashville, TN, USA, 1996; ISBN 0965022609. [Google Scholar]
- Metcalf, L.; Eddy, H.P.; Burton, F.L.; Stensel, H.D.; Tchobanoglous, G. Wastewater Engineering: Treatment and Reuse; McGraw Hill: New York, NY, USA, 2003; ISBN 0071122508. [Google Scholar]
- Hamza, R.A.; Iorhemen, O.T.; Tay, J.H. Anaerobic-aerobic granular system for high-strength wastewater treatment in lagoons. Adv. Environ. Res. 2016, 5, 169–178. [Google Scholar] [CrossRef]
- Droste, R.L.; Dehr, R.L. Theory and Practice of Water and Wastewater Treatment, 2nd ed.; John Wiley & Sons, Inc.: Hoboken, NJ, USA, 2019; ISBN 9781119312376. [Google Scholar]
- Araujo, D.J.; Rocha, S.M.S.; Cammarota, M.C.; Xavier, A.M.F.; Cardoso, V.L. Anaerobic treatment of wastewater from the household and personal products industry in a hybrid bioreactor. Braz. J. Chem. Eng. 2008, 25, 443–451. [Google Scholar] [CrossRef]
- Bashaar, Y.A. Nutrients requirements in biological industrial wastewater treatment. African J. Biotechnol. 2004, 3, 236–238. [Google Scholar] [CrossRef]
- Hussain, A.; Dubey, S.K. Specific methanogenic activity test for anaerobic treatment of phenolic wastewater. Desalin. Water Treat. 2014, 52, 7015–7025. [Google Scholar] [CrossRef]
- Aiyuk, S.; Amoako, J.; Raskin, L.; van Haandel, A.; Verstraete, W. Removal of carbon and nutrients from domestic wastewater using a low investment, integrated treatment concept. Water Res. 2004, 38, 3031–3042. [Google Scholar] [CrossRef] [PubMed]
- Annachhatre, A.P. Anaerobic treatment of industrial wastewaters. Resour. Conserv. Recycl. 1996, 16, 161–166. [Google Scholar] [CrossRef]
- Gujer, W.; Zehnder, A.J.B. Conversion processes in anaerobic digestion. Water Sci. Technol. 1983, 15, 127–167. [Google Scholar] [CrossRef]
- Appels, L.; Baeyens, J.; Degreve, J.; Dewil, R. Principles and potential of the anaerobic digestion of waste-activated sludge. Prog. Energy Combust. Sci. 2008, 34, 755–781. [Google Scholar] [CrossRef]
- Suryawanshi, P.C.; Chaudhari, A.B.; Kothari, R.M. Thermophilic anaerobic digestion: The best option for waste treatment. Crit. Rev. Biotechnol. 2010, 30, 31–40. [Google Scholar] [CrossRef]
- Zickefoose, C.; Hayes, R.B. Anaerobic Sludge Digestion: Operations Manual; Environmental Protection Agency: Washington, DC, USA, 1976. [Google Scholar]
- The Microbiology of Anaerobic Digesters; Gerardi, M.H., Ed.; Wastewater Microbiology Series; John Wiley & Sons, Inc.: Hoboken, NJ, USA, 2003; Volume 6, ISBN 0471206938. [Google Scholar]
- Mahoney, E.M.; Varangu, L.K.; Cairns, W.L.; Kosaric, N.; Murray, R.G.E. The effect of calcium on microbial aggregation during UASB reactor start-up. Water Sci. Technol. 1987, 19, 249–260. [Google Scholar] [CrossRef]
- Yu, H.; Tay, J.H.; Fang, H.H.P. The roles of calcium in sludge granulation during uasb reactor start-up. Water Res. 2001, 35, 1052–1060. [Google Scholar] [CrossRef]
- Cail, R.G.; Barford, J.P. The development of granulation in an upflow floc digester and an upflow anaerobic sludge blanket digester treating cane juice stillage. Biotechnol. Lett. 1985, 7, 493–498. [Google Scholar] [CrossRef]
- Cunha, J.R.; Morais, S.; Silva, J.C.; Van der Weijden, R.D.; Hernández Leal, L.; Zeeman, G.; Buisman, C.J.N. Bulk pH and carbon source are key factors for calcium phosphate granulation. Environ. Sci. Technol. 2019, 53, 1334–1343. [Google Scholar] [CrossRef] [PubMed]
- Schmidt, J.E.; Ahring, B.K. Effects of magnesium on thermophilic acetate-degrading granules in upflow anaerobic sludge blanket (UASB) reactors. Enzym. Microb. Technol. 1993, 15, 304–310. [Google Scholar] [CrossRef]
- Speece, R.E. Anaerobic biotechnology for industrial wastewater treatment. Environ. Sci. Technol. 1983, 17, 416A–427A. [Google Scholar] [CrossRef]
- Isik, M.; Sponza, D.T. Effects of alkalinity and co-substrate on the performance of an upflow anaerobic sludge blanket (UASB) reactor through decolorization of Congo Red azo dye. Bioresour. Technol. 2005, 96, 633–643. [Google Scholar] [CrossRef]
- Bina, B.; Amin, M.M.; Pourzamani, H.; Fatehizadeh, A.; Ghasemian, M.; Mahdavi, M.; Taheri, E. Biohydrogen production from alkaline wastewater: The stoichiometric reactions, modeling, and electron equivalent. MethodsX 2019, 6, 1496–1505. [Google Scholar] [CrossRef]
- Choi, J.; Ahn, Y. Biohydrogen fermentation from sucrose and piggery waste with high levels of bicarbonate alkalinity. Energies 2015, 8, 1716–1729. [Google Scholar] [CrossRef]
- Lützhøft, H.C.H.; Boe, K.; Fang, C.; Angelidaki, I. Comparison of VFA titration procedures used for monitoring the biogas process. Water Res. 2014, 54, 262–272. [Google Scholar] [CrossRef]
- Anderson, G.K.; Yang, G. Determination of bicarbonate and total volatile acid concentration in anaerobic digesters using a simple titration. Water Environ. Res. 1992, 64, 53–59. [Google Scholar] [CrossRef]
- Lahav, O.; Morgan, B.E. Titration methodologies for monitoring of anaerobic digestion in developing countries—A review. J. Chem. Technol. Biotechnol. 2004, 79, 1331–1341. [Google Scholar] [CrossRef]
- Arne Alphenaar, P.; Visser, A.; Lettinga, G. The effect of liquid upward velocity and hydraulic retention time on granulation in UASB reactors treating wastewater with a high sulphate content. Bioresour. Technol. 1993, 43, 249–258. [Google Scholar] [CrossRef]
- Visser, A.; Gao, Y.; Lettinga, G. Effects of pH on methanogenesis and sulphate reduction in thermophilic (55 °C) UASB reactors. Bioresour. Technol. 1993, 44, 113–121. [Google Scholar] [CrossRef]
- Mahmoud, N.; Zeeman, G.; Gijzen, H.; Lettinga, G. Solids removal in upflow anaerobic reactors, a review. Bioresour. Technol. 2003, 90, 1–9. [Google Scholar] [CrossRef]
- Al-Shayah, M.; Mahmoud, N. Start-up of an UASB-septic tank for community on-site treatment of strong domestic sewage. Bioresour. Technol. 2008, 99, 7758–7766. [Google Scholar] [CrossRef] [PubMed]
- Halalsheh, M.; Sawajneh, Z.; Zubi, M.; Zeeman, G.; Lier, J.; Fayyad, M.; Lettinga, G. Treatment of strong domestic sewage in a 96 m UASB reactor operated at ambient temperatures: Two-stage versus single-stage reactor. Bioresour. Technol. 2005, 96, 577–585. [Google Scholar] [CrossRef] [PubMed]
- Mahmoud, N.; Zeeman, G.; Gijzen, H.; Lettinga, G. Anaerobic sewage treatment in a one-stage UASB reactor and a combined UASB-Digester system. Water Res. 2004, 38, 2348–2358. [Google Scholar] [CrossRef] [PubMed]
- Zeng, T.; Rene, E.R.; Hu, Q.; Lens, P.N.L. Continuous biological removal of selenate in the presence of cadmium and zinc in UASB reactors at psychrophilic and mesophilic conditions. Biochem. Eng. J. 2019, 141, 102–111. [Google Scholar] [CrossRef]
- Ismail, S.B.; De La Parra, C.J.; Temmink, H.; Van Lier, J.B. Extracellular polymeric substances (EPS) in upflow anaerobic sludge blanket (UASB) reactors operated under high salinity conditions. Water Res. 2010, 44, 1909–1917. [Google Scholar] [CrossRef] [PubMed]
- Wang, W.; Yang, K.; Sierra, J.M.; Zhang, X.; Yuan, S.; Hu, Z. Potential impact of methyl isobutyl ketone (MIBK) on phenols degradation in an UASB reactor and its degradation properties. J. Hazard. Mater. 2017, 333, 73–79. [Google Scholar] [CrossRef]
- Díaz-Báez, M.C.; Valderrama-Rincon, J.D. Rapid restoration of methanogenesis in an acidified UASB reactor treating 2,4,6-trichlorophenol (TCP). J. Hazard. Mater. 2017, 324, 599–604. [Google Scholar] [CrossRef]


| Unit to Incorporate into UASB | Resulting Reactor Name | Purpose of Incorporation | Reference |
|---|---|---|---|
| Electrolysis cell | Up-flow Anaerobic BioElectroChemical reactor (UABE) | Increase the methane production via partial capture of dissolved carbon dioxide | [33,34,35,36] |
| Anaerobic Filter | UASB-AF | Increase retention of solids inside of a reactor and prevent washout of active biomass | [37] |
| Anaerobic hybrid reactor (AHR) | [14,31,38,39] | ||
| Lamella settler | No Name | Increase solids retention time (SRT) | [40] |
| # | Substrate | Operating Conditions | Used Type of Reactor, Material, Inoculum, and Seeding | Constructional Geometry | Reference |
|---|---|---|---|---|---|
| 1. | Hydrous ethanol vinasse COD: 121,000 pH: 4 Ethanol: 21,007 Acetic acid: 2237 Propionic acid: 4304 | HRT: 6 … 15 OLR: 7.27 … 22.16 Start-up OLR: Days 1–6: 0.34 with synthetic wastewater Days 7–8: 5.9 with substrate | Type: Figure 1b with added extra high rate settler above gas collecting part Material: Acrylic Inoculum: taken from already functioning UASB reactor treating vinasse of banana waster. | Cylindrical part diameter: 11 cm Cylindrical part height: 35 cm Settler basement square side: 17 Settler height: 21 Settler is installed on top of cylindrical part. Settler plates incline: 45° Operational Volume: 3 No sampling ports | [29] |
| 2. | Distillery Spentwash pH: 3.8 … 4.2 COD: 122,000 TS: 121,020 | HRT: 10 days OLR: 11.75 | Type: Figure 1a Material: Acrylic Inoculum: Laboratory enriched sludge from ongoing reactor by cow dung slurry. Seeding: Seeding by filling the 50% of volume with sludge mixture and multiple dilution by wastewater sample. | Digestion zone: 10 × 10 × 98 cm Transition zone: 10 × 10 × 6 cm GLS zone: 19.2 × 19.2 × 25 cm Digester volume: 16.75 L Settler volume: 7.15 L GLS opening angle: 53 °C 8 sampling ports with 10 cm spacing | [42,43] |
| 3. | Spent wash of distillery plant COD: 90,000 … 100,000 BOD: 30,000 … 50,000 pH: 3.5 … 4.5 | pH is adjusted to 6.5 … 7.5 with lime (Ca(OH)2) Dilution of substrate applied OLR: 5.63 … 9.5 Temperature: 36 … 40 °C Suggests to adjust the ratio COD:N:P as 300:5:1 with urea and diammonium phosphate | Type: Figure 1a Material: Acrylic Inoculum: active sludge from anaerobic reactor Inoculation: 3 L of sludge per reactor | Operational Volume: 10 L Tube I: 11.7 cm Full height: 97 cm Digestion Zone: 78 cm Several sampling ports as 5, 19, and 57 cm levels Extra Sludge washing port Deflectors angle: 55 °C GLS opening angle: 55 °C | [44] |
| 4. | Municipal sewage | Temperature: 9…32 °C HRT: 6 h OLR: 2.4 | Type: Figure 1a Pre-existing functioning UASB reactor | Full Volume: 1148 L Height: 4 m | [45] |
| 5. | Synthetic wastewater based on unbleached pulp mill COD: 1400 pH: 6.3 … 8.3 | Temperature: 30 ± 1°C HRT: 30 h | Type: Figure 1b Inoculum: granulated sludge from UASB reactor treating poultry slaughterhouse effluent | Total volume: 15 L Digestion compartment: ID: 15 cm Height: 52 cm Settler cylindrical and conical compartment: ID: 15 cm Height: 30 cm | [46] |
| 6. | Vanderbilt mineral medium with tetrachloroethylene COD: 3500 | Temperature: 35 ± 2 °C OLR: 10.5 HRT: 0.4 day | Type: Figure 1a Material: Stainless steel Inoculant: Flocculent anaerobic biomass from anaerobic Continuous Stirring-Tank Reactor (CSTR) Seeding: 350 mL of sludge, equal to 8 g/L of TSS | Total Volume: 2 Liters ID: 9 cm Total Height: 100 cm GLS height: 15 cm Equipped with 5 sampling ports and inner heater | [47] |
| 7. | Municipal sewage COD: 97 … 196 pH: 6.8 … 7.2 | Ambient temperature: 24… 28 °C | Type: Figure 1a Material: Acrylic Sheets | Total volume: 62 L Total height: 270 cm Non-cylindrical form Sludge bed: height: 80 cm Square cross-section: 16 cm Gas collector slope: 60° | [48] |
| 8. | Municipal landfill leachate COD: 1.5 … 3.2 pH: 6.5 … 7.0 | Ambient temperature: 13–23 °C OLR: 1.2 … 4 HRT: 35 … 15 h Added NaHCO3 as 0.5 g/L for neutralization purpose and no extra pH adjustment was done Recycle ratio: 3.5:1 Reports escape of methane with effluent | Type: Figure 1a Material: Stainless steel with PVC tubing and insulated with poly-urethane sheets Inoculum: Mesophilic anaerobic sludge from sewage treatment plant | Height: 295 cm Diameter: 13.5 GLS height: 50 cm Total Volume: 40 L Recycle ratio: 3.5:1 (feed to recycle) 2 sampling ports Contained the heater | [49] |
| 9. | Grey water from sewer pipe COD: 647 … 681 | HRT: 8 … 20 h Ambient temperature: 14 … 24.5 °C | Type: Figure 1a Material: not specified Inoculum: sludge from anaerobic digester treating primary and secondary sludge | Full volume: 7 L Diameter: 7 cm Total height: 200 cm GLS height: 50 cm Reactor sludge filling: 100 cm | [50] |
| 10. | Municipal wastewater COD: 672 … 698 | HRT: 2.4 … 4 h Temperature: set of reactors operating in range 12 … 25 °C as water bath made of PVC pipe Ø30 cm | Type: Figure 1c Material: PVC Inoculum: not specified | Full volume: 25 L Height: 1.35 m ID: 15 cm Inclined arm angle: 45° 4 sampling ports | [51] |
| 11. | Sanitary waste + aerated filter effluent COD: 351 ± 166 | HRT: 6 h Experiment duration of 120 days | Type: Figure 1a Material: not specified, but either PVC or PMMA, based on provided images Inoculum: not specified | Cylindrical (tubular) shape Full volume: 7.8 L Total height: 60 cm Diameter: 14.8 cm 2 sampling ports GLSS opening angle: ~60° Height from top to baffles: 15 cm | [52] |
| 12. | Municipal wastewater COD: 176 … 224 | Temperature: 20 … 28 °C HRT: 3 h OLR: 0.014 or 0.009 | Type: Figure 1a Material: Not specified Already existing and functioning reactors | Total Height: 3.85 m Total volume: 2.5 3 sampling ports Separate preheater of substrate before inlet point | [15] |
| 13. | Sugar cane vinasse COD: 19,220 sCOD: 15,300 pH: 5.2 | Temperature: 22 ± 3 °C OLR: 0.5 … 32.4 Up-flow velocities: 0.008 … 0.292 HRT: 33.33 … 0.86 days Recycling ratio: 1:3 Added 0.3 g NaHCO3 per 1 g of COD to adjust the pH and alkalinity. | Type: Figure 1c Material: PVC Inoculum: Granular sludge from UASB treating poultry slaughterhouse Seeding: 60 L of granular sludge of VVS content 37 g/L | Total volume: 120 L Reaction zone volume: 60 L Total height: 4 m Reaction Zone Height: 2 m Diameter: 19.5 mm 8 sampling ports | [53] |
| 14. | Mix of domestic waste with molasses (0.5:785 mix ratio) COD: 6597 BOD: 3197 TSS: 4500 | OLR: 6 (1.5 start-up) Temperature: 15…25 °C HRT: 10–12 h Vertical velocity: 0.5–0.7 m/h | Type: Figure 1a Material: UPVC Pre-existing reactors | Diameter: 25 cm Height: 2 m 4 sampling ports Volume: 98 L | [54] |
| 15. | Pre-digested chicken manure pH: ~8.0 COD: 807 ± 215 sCOD: 295 ± 46 | Feed rate; 500 mL/day/reactor + dilution with tap water HRT: 13 days Semi-continuous operation | Type: Figure 1a Material: plexiglass Inoculum: sludge for internal circulation reactor treating paper/cardboard industry waste Seeding: 1.3 L sludge per reactor (20% of working volume) | Digestion zone height: 1 m Diameter: 90 mm Volume: 6.5 L Extra sampling ports | [55] |
| 16. | Synthetic wastewater with butyrate as a main substrate pH: 6.0–6.5 COD: 2100–15,500 | Temperature: 37 °C OLR: 4–83 HRT: 12.5–4.5 With water-jacket pH: 7.1–7.9 by addition of NaHCO3 | Type: Figure 1a Inoculum: flocculant sludge from anaerobic sludge digester, partially granulated in pilot-scale reactor for 2 month growing on sucrose Seeding: 1.5 L of adapted sludge per reactor | Digestion zone height: 50 cm Digestion zone diameter: 8.4 cm Digestion zone volume = 2.8 L Settler zone height: 25 cm Settler zone diameter: 11.4 cm Settler zone volume: 2.0 L 5 sampling ports | [27] |
| 17. | Synthetic wastewater COD: 6000–20,000 pH: 7.1–7.8 (caused by buffers in WW) | HRT at beginning: 12–1.8 h OLR: 18–260 Increasing OLR by 50% after each achieving of removal rate of 80% Preheating of substrate: 37 °C Alkalinity spiked with NaHCO3 Volumetric loads calculated per digestion zone volume only | Type: Figure 1a Inoculum: anaerobic digester treating municipal wastewater Seeding: 6.5 L of inoculum (1.% VSS and 1.3 TSS) | Volume: 8.5 L Digestion (+ 5 L of GLS) Digestion zone ID: 104 mm Digestion zone H: 1000 mm GLS: ID 144 mm GLS: H 300 mm 7 evenly distributed sampling ports | [56] |
| 18. | Municipal sewage pH: 4.4 COD: 531 BOD: 359 | Temperature: 25…35 (ambient) Feed rate: 28 L/day Up-flow velocity: 0.116 m/h OLR: 1.062 pH adjusted with NaOH up to 6.7 ± 0.1 Reported granulation on 20th day for main experiment. | Type: Figure 1a Material: Glass sheets Inoculum: adjusted cow dung manure Inoculum adaptation: 9 L of inoculum + 1 L of nutrients, grow for 120 days growing on sucrose with (NH4)2HPO4. Remove undigested residuals via filtering through the 3 mm mesh. Seeding: 4 L of filtered sludge from adaptation per reactor | Working volume: 14 L Length to height ration: 1:14 Height: 140 cm (it is not cylindrical) Length of base: 10 cm Area of reactor: 100 cm2 | [57] |
| 19. | Distillery effluent from fermentation-based vitamin C production plant COD: 6000 … 38,000 BOD5: 2000 … 14,000 pH: 4.5–6.2 | 35 ± 2 °C (constant temperature room) OLR: 6 … 11.8 Upflow velocity: 0.52 m/h HRT < 10 h 252 days of total experiment 100 days of start-up Adjusted COD:N:P as 300–600:5:1 with urea and KH2PO4 pH adjusted with NaOH up to 7.2 | Type: Figure 1a Material: stainless steel Inoculum: sludge (VSS 31.0 g/L) from anaerobic digester treating the municipal wastewater | Active volume: 2.3 m3 Height: 5.90 m Inner diameter: 0.8 m Conical shape of bottom 5 sampling ports Recycle line active | [58] |
| 20. | High-strength distillery wastewater pH: 3.42–5.84 TS: 31,520–126,240 TSS: 1040–26,640 COD: 68,000–100,000 BOD: 21,600–35,000 | HRT: 4 … 2d Temperature: 37 °C with water jacket OLR: 15.34 Experiment duration: 635 days Start-up: 65 days with HRT: 47.11 h | Type: Figure 1a Material: borosilicate glass Inoculum: the sludge from UASBR treating distillery wastewater Seeding: ~30% of reactor volume | Inner diameter: 92.1 mm Total Height: 79.6 cm Digestion zone: 59.97 cm Digestion volume: 5 L Water jacket ID: 132.10 mm Sampling ports: 6 GLSS opening angle: 70° (flipped funnel) | [59] |
| 21. | Distillery wastewater COD: 107,000 TOC: 39,200 | Temperature: 37 °C Flow rate: 2.2 … 3.3 L/d Recycle: 50% of influent flow NaHCO3 added as 3 g/L to adjust pH to 7 OLR: up to 3 | Type: Figure 1a Seeding: 500 mL of inoculum per reactor, + 3 L of glucose-based synthetic wastewater and nutrients, including Ca2+ and PO43− to stimulate granulation | Total Height: 1.35 m Fluidization part volume: 3 L Fluidization part H: 1.05 m Fluidization part ID: 5.9 cm Settling part volume: 3 L | [28] |
| 22. | Cane molasses vinasse COD: 10 pH: 4.1 COD: 120 BOD: 30 TS: 100 TS: 50 | Temperature: 55 °C with water jacket OLR: up to 28 Experiment duration: 430 days Added 5 g/L of NaHCO3 to maintain 7.3 pH all-over experiment. | Type: Figure 1b with extra settler above gas collector Material: Stainless steel Inoculum: sludge (12 g VS/L) from suspended growth type digester treating distillery wastewater Seeding: 87 L of sludge per reactor | Volume: 140 L (126 L digestion + extra for GLSS) Digestion par: 20 cm ID × 4 m height Solids separator was made of inclined plates: 60° | [60] |
| 23. | Wastewater with high corn-starch content pH: 6.8–7.9 COD: 3000–75,000 | Temperature: 37 °C with pre-heater HRT: 24–12 and OLR: 3 … 150 Experiment duration: 510 days OLR is calculated on the volume of digestion zone only. pH adjusted with NaHCO3 equal to COD, but < 8 g/L to prevent toxicity of Na+. Reports pH of effluent as 6.8 at the highest OLR | Type: Figure 1a Inoculum: Sludge from anaerobic digester treating sewage wastewater Seeding: 6.5 L of sludge per reactor | Volume: 8.5 L of digestion zone + 5.0 L GLSS Digestion ID: 104 mm Digestion Height: 1000 mm GLS ID: 144 mm GLS Height: 300 mm | [61] |
| 24. | Recycled paper mill wastewater pH: 7.4 COD: 5330.5 TS: 32.99 VS: 27.28 | Temperature: 37 ± 2 °C with helix heat exchanger Feed: 0.5–4.5 l/h, increment by 0.5 l/d OLR: 1–10 Load calculations per digestion zone! | Type:Figure 1a Inoculum: sludge from full-scale UASB Seeding: 25 L of sludge per reactor | Volume: 70 L (digestion zone: 53 L) Height: 1 m (30 cm of which is GLS) Diameter: 30 cm | [62] |
| 25. | Distillery wastewater COD: 40.389 pH: 3.2 … 3.8 | Flowrate: 18 Vertical up-flow velocity: 0.0925 HRT: 15.6 ORL: 53.75 (digestion zone) pH: 6.7 ± 0.1 with NaOH Extra mixing pump inside of reactor | Type: Figure 1a Material: PVC Inoculum: 18 L of cow dung and 2 L of substrate and aged for 3 weeks and filtered through 3 mm mesh. | ID: 10.16 cm (4in) Height: 142.24 cm (56 in) + 14.2 cm of GLSS Effective volume: 15.4 L D: H ratio: 1:14 5 sample ports Gas collection funnel opening angle: 55° | [63] |
| 26. | Vinasse cane alcohol wastewater pH 4.03 … 4.44 COD: 57.59 … 128.63 TS: 17.85 … 113.98 VS: 11.81 … 58.11 | Temperature: 35 ± 2 °C OLR: varied 1 …6 HRT: 109 … 25 days Up-flow velocity: 2 … 3 Biogas cleaned with 3N NaOH solution | Type: Figure 1a Material: Glass Inoculum: sludge from wastewater treatment plant treating mix of urban and industrial wastewater Seeding: 600 mL of inoculum resulting in 10.63 g VS/L in reactor | Digestion part: 53 cm H × 7.5 cm ID Digestion part volume: 2.3 L 6 sampling ports | [64] |
| 27. | Distiller’s grains wastewater COD 16,500–22,520 pH 3.3–4.3 VFA: 3000–3600 VSS 190–640 | pH: ~7 with NaHCO3 OLR: 3.2 … 48.3 (33.3 was optimal) No reactor heater, the substrate was preheated to 37 °C before entering the reactor Start-up OLR: Linear increase from 0.42 to 5.6 for 27 days | Type: Figure 1a with second level of gas collectors as on Figure 1b Material: acrylic Inoculum: Sludge from mesophilic anaerobic digester in sewage treatment plant Seeding: Seeded with 5.2 L of sludge with VSS content of 12.3 g/L, degassed by auto-incubation at 37 °C for three weeks. | 6 sampling ports with spacing of 20 cm in between. Inner diameter of Tube: 8.2 cm Height: 190 cm (total), 155 cm (reaction zone) Total volume: 8.18 L Inner diameter of GLS: 14 cm OD of gas harvesting funnel: 10 cm Funnel opening angle (60°) Duration of experiment: 420 days | [65] |
| # | Substrate | Operating Conditions | Type, Material, Inoculum, Seeding | Geometry | Reference |
|---|---|---|---|---|---|
| 1. | Distillery spent wash pH: 4 … 4.5 COD: 80,000…12,000 TS: 60,000…85,000 BOD5: 35,000…45,000 | Temperature: 20…40 °C (ambient) pH: ~7 with NaHCO3 Substrate COD:N:P as 100:5:1 with NaH2PO4 and Urea OLR: 1.0 … 8.0 (start-up), 36 HRT: 6 … 48 h Observed granulation at day 50. | Type: Figure 1a with packing materials. So called Hybrid UASB reactor Material: PMMA Inoculum: flocculent sludge from anaerobic digester of sewage treatment plant Seeding: sieved through 1 mm mesh, loaded as 15 g VSS/L (2.5 L per reactor) | Operational liquid volume—5 L (45 cm of total height) Diameter: 10 cm Overall height: 77 cm GLS separator was replaced with packing, taking 19 cm of total height (volume 1.5 L) | [14] |
| 2. | Tannery wastewater COD: 8600 … 14,100 pH: 2.8 … 3.7 | Temperature: 17 … 38 °C (ambient) Substrate was diluted to COD value of 5400 … 9400 Experiment duration of 52 weeks Equalization tank (600 L) prior to 1st stage UASB Start-p OLR: 24 HRT: 5 … 24 | Type: two reactors as Figure 1a in line Material: UPVC | Volume: 94 L Total height: 325 cm Digestion zone height: 240 cm Tube ID: 20 cm 5 sampling ports every 55 cm Funnel overlap on baffles: 1.5 cm per side | [66] |
| 3. | Molasses-based ethanol distillery wastewater | HRT: 70 h, treating as 2nd stage after CSTR Feed flow: 3.4 L/d Temperature: ambient | Type: Figure 1a | Digestion Volume: 10 L Digestion ID: 0.08 m Digestion Height: 1.5 m | [67] |
| Criteria | Options/Area of Application/Observations |
|---|---|
| Height | No constraints on height. The smallest found reactor was 30 cm tall, the largest as above 4 m. Perhaps, limited only by the available space in a laboratory. |
| Volume | Small volumes are 0.5, 0.75, 1, and 2–2.4 L. Larger volumes of 14 and 55 L were also found. Usually, reactors with volume greater than 1 m3 are referred as pilot-scale. |
| Height: Diameter (H:D) ratio | Since the substrate has an up-flow velocity, the reaction part of UASB reactor in some degree functions as a sedimentation or coagulation column, where ratio H:D should help preventing the biomass washout [19]. This parameter is very rarely reported, and reporting of it can be confusing due to not clear geometry reference. There are reports of H:D ratio as a diameter of a reactor to either a total height of a reactor or to the height of a reactor without GLS. We see reasonable to calculate it as a diameter of reactor to the height without GLSS, since the goal of GLSS is to create a chamber for gas capture above the reaction tube of a reactor. From review studies, such ratio for majority of cases is in range from 8 to 14. However, there are also extreme cases as 3.5 or 23. |
| Construction material | For small volumes (up to couple liters): Borosilicate glass For small and medium sizes: PVC and PMMA For pilot scale: Stainless steel. |
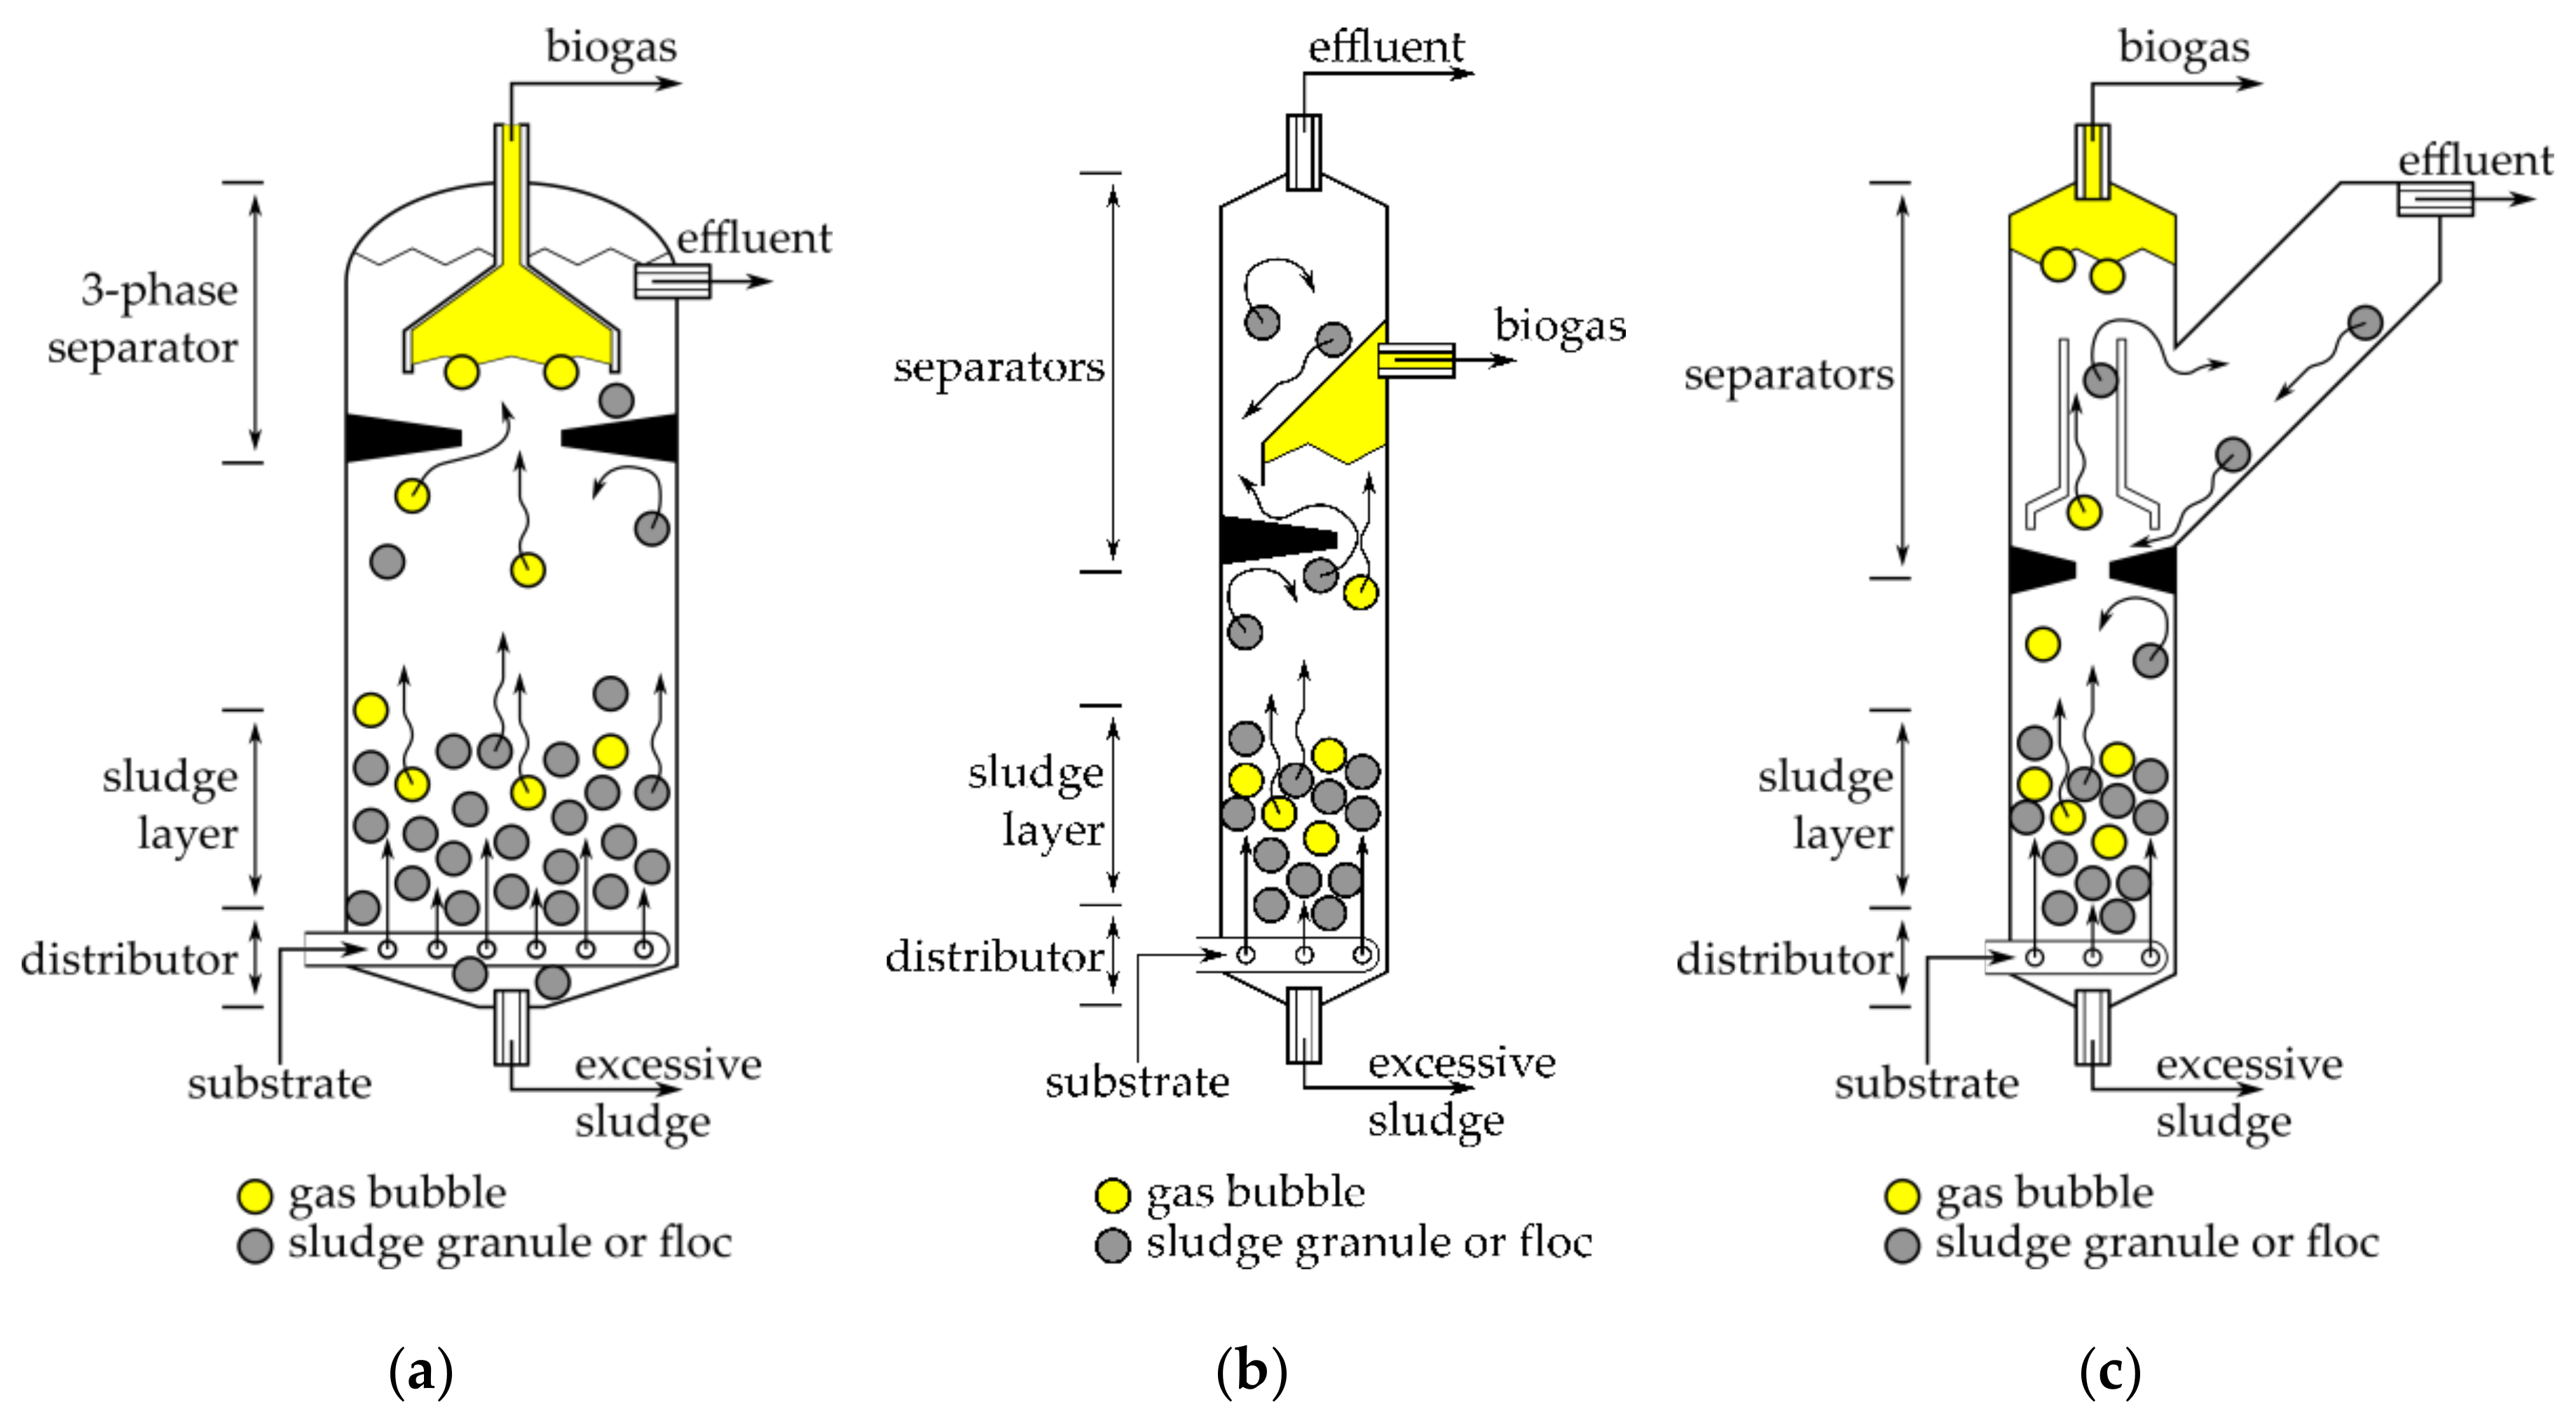
| Gas–Solid–Liquid Separator (GLSS, Three-Phase Separator) | The particular design varies with the concept of the reactor itself, and options can be split into: Implementation of baffles Gas collection For tubular reactor designs, the deflectors are typically made as an O-rings with a triangular cross-section. For rectangular reactors, a series of inclined baffles are installed to narrow a main liquid flow. For smaller reactors, baffles are sometimes omitted, probably, because it’s difficult to implement those in smaller volumes. Another case when deflectors were noticed to be omitted is when GLSS is represented by a separate part (either tube or funnel), wider than the major reaction tube, and a diameter of a gas collector is close to a diameter of a reaction tube. Gas collector is usually represented by a flipped upside-down funnel for smaller reactors. For larger ones, it can be a separate compartment. Y-shaped reactors do not have any specific structure inside. |
| Heating | Among the reviewed designs the following heating systems were noticed: Heating pads or tapes Water jacket No heating Inner heaters (helix shaped) Water jacket is the most common option for smaller designs but it complicates the placement/insertion of sensors (like pH, ORP, temperature, etc.) into a reactor. Larger reactors usually use heating pads or a combination of heating pads with thermal insulation material. |
| Temperature ranges | Mesophilic: 35 ± 2 °C or 37 ± 1 °C Thermophilic: 55 ± 1 °C Ambient temperature Ambient temperature with thermostat to prevent overcooling |
| Inoculum material | No constraints: Granular or flocculated sludge from another UASB Non-granulated anaerobic or active sludge Adjusted inoculum from non-sludge sources, like animal manure |
| Seeding (inoculating) | Across the reviewed studies, this was the most inconsistent parameter, which was not even always reported. The process was reported as: (a) filling reactor with raw sludge up to a certain percentage of height; (b) volumetric load of sludge per reactor, sometimes mentioning its VSS and/or TSS equivalent; and (c) final concentration of sludge in reactor as TSS or VSS. Also, few studies suggested to sieve the sludge through 1–3 mm mesh to remove any undigested particulate or residuals before seeding. |
| Substrate preparation, feeding and pH management | Few studies considered the adjustment of substrate based on ratio COD:N:P. However, the final ratio does not match across publications and varies for COD parameter 300–600:5:1. Surprisingly, no-one mentioned adjusting the C:N ratio, which is recommended for anaerobic treatment in general. Only one publication mentioned the addition of compounds to stimulate granulation. |
| Substrate pH management | Researchers use either pH adjustment in substrate directly or pumping pH adjusting solution to the reactor. Used adjusting compounds are either hydroxides or bicarbonates. Interesting fact: addition of 0.5–3 g of NaHCO3 per 1 L of substrate was sufficient to maintain a stable effluent pH around 7. In some extreme cases 8 g per 1 L of substrate were sufficient to work with OLR 150 . |
| OLR and HRT | HRT and OLR are interdependent values and both are optimization points in research. Researchers aim to increase OLR and decrease HRT. These parameters are points of inconsistent reporting: Some sources report OLR and HRT as referred to the total volume of the reactor (both reaction tube and GLSS) Some sources report OLR and HRT as referred to the volume of the reactor without the volume of GLSS Higher limit for OLR is not specified, since it depends on chemical composition of influent wastewater and its strength. |
| Substrate distribution system | Typically is not reported, but where it is mentioned it’s either: a circular tube with evenly distributed outlet holes and an inlet from the side through the wall of reactor an inlet into conical-shaped bottom of reactor a side inlet through the wall into bottom compartment with inclined bottom |
| Material | Pros | Cons |
|---|---|---|
| PMMA | Less expensive than glass Almost no film formation (unless scratched) Optically clear, may have some UV-protective coating Stronger that glass Machinable with mechanical tools (CNC/lathe/mill/drill) Cracks can be fixed with either solvent treatment, epoxy of UV-curable resin in short time frame | Needs machining equipment If sterilization is needed: consider chemical sterilization Easily scratchable |
| Glass | Optically clear Non-UV degradable, chemically inert (under conditions of AD) Washable Autoclavable | Expensive In case of cracks becomes sensitive to vibrations and not usable Requires specialist (glass blower) to build or repair/fix Fragile |
| PVC | Clear, but not optically. Has blueish color Machinable, but melts easily Relatively cheap and available on the market, has a wide set of existing fittings for quick assembly | Degrades over time, becomes fragile Non-UV-stable, becomes yellowish over long-term expose to light containing UV spectrum (sunlight) Microorganisms form biofilm on its surface |
| Parameter | Measurement For | Used For |
|---|---|---|
| COD | Influent Effluent | Calculate the degradability rate of substrate Calculate corrected OLR Reference for energy yield calculation and substrate utilization rate |
| pH | Influent Effluent Reactor entrance | Estimation how favorable are conditions for methanogenesis Tracking the changes of substrate : The actual pH value in a sludge layer if recycle line is used |
| Gas | Yield volume Content | Estimation of yield per unit of substrate Calculation of energy recovery Balancing COD on biomass growth |
| Flowrate | Feed rate Recycle rate | Calculation of OLR, HRT, up-flow velocity |
| Parameter | Equation | |
|---|---|---|
| Substrate utilization rate | (1) | |
| Removal efficiency | (2) | |
| Hydraulic retention time (HRT) | (3) | |
| Organic Loading rate (space load) | (4) | |
| Organic loading rate (sludge load) | (5) | |
| Up-flow velocity | (6) | |
| Parameter | Equation | |
|---|---|---|
| Hydrolysis | (7) | |
| Acidification | (8) | |
| Methanogenesis | (9) | |
| COD mass balance | (10) | |
© 2020 by the authors. Licensee MDPI, Basel, Switzerland. This article is an open access article distributed under the terms and conditions of the Creative Commons Attribution (CC BY) license (http://creativecommons.org/licenses/by/4.0/).
Share and Cite
Pererva, Y.; Miller, C.D.; Sims, R.C. Approaches in Design of Laboratory-Scale UASB Reactors. Processes 2020, 8, 734. https://doi.org/10.3390/pr8060734
Pererva Y, Miller CD, Sims RC. Approaches in Design of Laboratory-Scale UASB Reactors. Processes. 2020; 8(6):734. https://doi.org/10.3390/pr8060734
Chicago/Turabian StylePererva, Yehor, Charles D. Miller, and Ronald C. Sims. 2020. "Approaches in Design of Laboratory-Scale UASB Reactors" Processes 8, no. 6: 734. https://doi.org/10.3390/pr8060734
APA StylePererva, Y., Miller, C. D., & Sims, R. C. (2020). Approaches in Design of Laboratory-Scale UASB Reactors. Processes, 8(6), 734. https://doi.org/10.3390/pr8060734