Article

Applying Differential Neural Networks to Characterize Microbial Interactions in an Ex Vivo Gastrointestinal Gut Simulator

by
Misael Sebastián Gradilla-Hernández
1,*,
Alejandro García-González
2,*,
Anne Gschaedler
3,
Enrique J. Herrera-López
3,
Marisela González-Avila
4,
Ricardo García-Gamboa
4,
Carlos Yebra Montes
5 and
Rita Q. Fuentes-Aguilar
1
1
Tecnologico de Monterrey, Escuela de Ingenieria y Ciencias, Av. General Ramon Corona 2514, Nuevo Mexico, Zapopan CP 45138, Jalisco, Mexico
2
Tecnologico de Monterrey, Escuela de Medicina y Ciencias de la Salud, Av. General Ramon Corona 2514, Nuevo Mexico, Zapopan CP 45138, Jalisco, Mexico
3
Centro de Investigación y Asistencia en Tecnología y Diseño del Estado de Jalisco, A. C. Camino Arenero 1227, El Bajío, Zapopan CP 45019, Jalisco, Mexico
4
Centro de Investigación y Asistencia en Tecnología y Diseño del Estado de Jalisco, A. C. Normalistas 800, Colinas de la Normal, Guadalajara CP 44270, Jalisco, Mexico
5
ENES León, Universidad Nacional Autónoma de México, Blvd. UNAM 2011, Predio el Saucillo y El Potrero, León CP 37684, Guanajuato, Mexico
*
Authors to whom correspondence should be addressed.
Processes 2020, 8(5), 593; https://doi.org/10.3390/pr8050593
Submission received: 1 April 2020 / Revised: 20 April 2020 / Accepted: 12 May 2020 / Published: 16 May 2020
(This article belongs to the Section Advanced Digital and Other Processes)

Abstract

:
The structure of mixed microbial cultures—such as the human gut microbiota—is influenced by a complex interplay of interactions among its community members. The objective of this study was to propose a strategy to characterize microbial interactions between particular members of the community occurring in a simulator of the human gastrointestinal tract used as the experimental system. Four runs were carried out separately in the simulator: two of them were fed with a normal diet (control system), and two more had the same diet supplemented with agave fructans (fructan-supplemented system). The growth kinetics of Lactobacillus spp., Bifidobacterium spp., Salmonella spp., and Clostridium spp. were assessed in the different colon sections of the simulator for a nine-day period. The time series of microbial concentrations were used to estimate specific growth rates and pair-wise interaction coefficients as considered by the generalized Lotka-Volterra (gLV) model. A differential neural network (DNN) composed of a time-adaptive set of differential equations was applied for the nonparametric identification of the mixed microbial culture, and an optimization technique was used to determine the interaction parameters, considering the DNN identification results and the structure of the gLV model. The assessment of the fructan-supplemented system showed that microbial interactions changed significantly after prebiotics administration, demonstrating their modulating effect on microbial interactions. The strategy proposed here was applied satisfactorily to gain quantitative and qualitative knowledge of a broad spectrum of microbial interactions in the gut community, as described by the gLV model. In the future, it may be utilized to study microbial interactions within mixed cultures using other experimental approaches and other mathematical models (e.g., metabolic models), which will yield crucial information for optimizing mixed microbial cultures to perform certain processes—such as environmental bioremediation or modulation of gut microbiota—and to predict their dynamics.

1. Introduction

1.1. Microbial Interactions

Mixed microbial cultures are widely present in nature and participate in important processes, such as environmental bioremediation and wastewater treatment; production of solvents, hydrogen and bioplastics from waste; food production by fermentation; and, remarkably, they play a critical role in facilitating human metabolism, contributing to the regulation of host physiology [1,2,3,4,5]. Mixed cultures are more versatile, tolerant and adaptable and can carry out many functions that pure cultures cannot [2,3,4]. Evidence shows that microscale interactions between and within populations affect the macroscale properties of the mixed culture, such as resistance to perturbations, substrate consumption efficiency and biomass production yield [6].
The interactions between microorganisms in a mixed culture may have a positive, negative or neutral impact on each of them. Interactions can be bidirectional (→←), unidirectional (→) or nondirectional (←→). Bidirectional relationships may be mutualistic (if the impact is mutually positive, +/+); competitive (if the impact is mutually negative, −/−) or antagonistic (positive on one side but negative on the other, +/−). In unidirectional relationships, the impact on one of the two is neutral, regardless of whether the impact on the other is positive (commensalism, +/0) or negative (amensalism, −/0). In nondirectional relationships, the impact they have on each other is negligible (neutralism, 0/0) [7,8]. Interactions can be caused by direct mechanisms, as a result of physical contact, or by indirect mechanisms, when the physical or chemical properties caused in the environment by one strain triggers a response in another strain or when a compound produced by one strain is metabolized by another (i.e., cross-feeding) [8,9,10,11]. Furthermore, taxon interactions are not equally stable and may vary in their strength over time [12].

1.2. Microbial Interactions in the Human Colon

In comparison to other regions of the gastrointestinal tract, the four sections of the colon host a large and diverse community of microorganisms known as the gut microbiota, which includes all three domains of life (Archaea, Bacteria and Eukarya) [13,14]. The gut microbiota regulates the metabolic output of various nutrients that have important effects on human physiology [15]. Moreover, it aids in the development of the immune system [16]. The concentration of bacteria in the different sections of the gastrointestinal tract is dependent on several factors, such as acidic condition, presence of bile or pancreatic enzymes, bacterial adhesion, nutrient availability and diet, among others [17].
Interactions between colonic microbes directly influence the structure and evolution of the resident gut microbial community. Colonic microbes survive and grow by consuming diet-derived and host-derived chemical compounds. Including the import of metabolic nutrients and export of metabolic byproducts in the model gives rise to both competition and cooperation. Microbial groupings commonly assemble in communities called biofilms. There are two types of cooperative relationships within these networks: (i) interspecies cross-feeding, wherein a metabolic byproduct of one microbe is a nutrient for another microbe, and (ii) macromolecule degradation, wherein a microbe degrades macromolecules and releases products into the environment that benefits both it and the rest of the members [18]. Additionally, microbial residents exhibit interactions that result in shared benefits (such as enhanced protection from host defenses and nutrient acquisition). Community-wide changes in gene expression are driven by quorum sensing—a communication process that allows bacterial cells to coordinate cooperative behaviors—which involves the production, detection and response to signaling molecules called autoinducers [19].
Prebiotics have been traditionally defined as nondigestible but fermentable foods that beneficially affect the host by selectively stimulating the growth and activity of a limited number of health-promoting species of bacteria residing in the colon—especially, but not exclusively, Bifidobacterium spp. and Lactobacillus spp. [20,21]. More recently, this definition has been expanded to “any substrate that is selectively utilized by host microorganisms conferring a health benefit,” and it has been recognized that prebiotic effects probably extend beyond Lactobacillus spp. and Bifidobacterium spp. [22].
The prebiotic effect of fructans has been documented by several authors [23,24]. The most researched and widespread type of fructans are inulin-type fructans [25]. Inulin-type fructans are soluble dietary fibers that are linear and characterized by β (2→1) linkages between fructose molecules and may have different degrees of polymerization [24,26,27]. Prebiotics synthesized by agave plants are characterized by having fructoses linked by β- (2→1) and β- (2→6) glucosidic bonds [28]. It has been reported that prebiotics can modulate the intestinal microbiota differently depending on the degree of polymerization [27,29]. Fructans with a high degree of polymerization can be easily metabolized by species of the genus Lactobacillus spp. [24,30], while low-polymerization fructans have shown the so called “bifidogenic effect” [31].
The effect of fructans on the growth of gut microorganisms has been studied in well-controlled in vivo human studies, which are well-suited for testing prebiotic functionality [32], but they do not allow for the monitoring of microbial growth and activity over a period of time in different regions of the colon [27,33]. In vitro experiments are suited for observing the growth of different species or genus within pure and mixed cultures; however, only mixed cultures make it possible to acquire detailed knowledge of the microorganisms’ growth and behavior in the presence of other microorganisms [33]. In vitro models inoculated with human microbiota, referred also as ex vivo systems, such as the TNO In Vitro Model of the Colon (TIM-2) [34], the Simulation of the Human Intestinal Microbial Ecosystem (SHIME) [27] and Automatic Robotic Intestinal System (ARIS) [35,36], seek to reproduce the conditions of the human gastrointestinal tract as closely as possible under well-controlled conditions [33], where the growth of the microorganisms, substrates and metabolites in the different sections of the colon can be quantified, allowing for the analysis of community dynamics under controlled conditions.

1.3. Mathematical Models Describing Microbial Interactions

In its standard form, the generalized Lotka-Volterra model describes the temporal evolution of microbial abundances as a function of growth rates and interaction strengths between community members, while ignoring the mechanisms behind microbial interactions such as the exchange of metabolites [33,34,35,36,37,38]. The limitations of the gLV model were thoroughly described by Gonze et al. [38]. In an effort to develop a more realistic version of the gLV model, Vet et al. [36] included coefficients to model the concentration of input nutrients and taxon-specific death rates and demonstrated qualitative agreement between the extended gLV and the Chemostat model, as they both captured the occurrence of interactions such as mutualism and competition. Mechanistic counterparts of the gLV model have also been applied or developed to provide better insight into the dynamics of the human colon. For instance, Muñoz-Tamayo et al. [39] developed a mechanistic model for carbohydrate degradation in the human colon derived from mass-balance equations incorporating the physiology of the intestine, metabolic reactions and transport phenomena. Additionally, D’hoe et al. [33] validated a mechanistic model for a mixed culture using mono-, bi- and tricultures composed of human strains typical of adult gut microbiota under in vitro conditions.

1.4. Differential Neural Networks for Model Approximation

Artificial neural networks (ANNs) are mathematical tools that can approximate the underlying relationships between independent and dependent variables adapting to the behavior of a system through training. ANNs can handle the uncertainty and variability found when analyzing the growth of microorganisms [40,41]. They can be classified as static (feedforward) or dynamic (recurrent or differential). Static networks, such as other machine learning algorithms, have some disadvantages: slow learning rates, high sensitivity to the function that approximates the training data and the possibility of overfitting or underfitting approximation, for example. This last issue involves the incorrect selection of the model structure based on the available training dataset, failing to fit additional data or failing to predict future observations reliably [42]. Strategies for cross-validation, such as the k-fold algorithm, can be used to reduce overfitting [43]. Differential neural networks (DNNs), which are a type of dynamic neural networks, can overcome these challenges, because their structure incorporates feedback [44]. The main advantage of DNNs is their ability to approximate the behavior of dynamic nonlinear systems by using time-adaptable nonlinear differential equations (for continuous time) or difference equations (for discrete time). This kind of neural network structure, known as Hopfield’s Neural Network [45], is an approach that transforms the original function approximation problem into a nonlinear robust adaptive feedback design. DNNs make it possible to circumvent issues related to a global extremum search—which are common when using classical algorithms to train neural networks—and to transform the learning process into an adequate feedback design derived by Lyapunov’s second method for stability [46]. DNNs reduce the risk of overfitting and underfitting by the continuous-time adaptation of their inner synaptic weights, the learning laws of which are also a set of continuous differential equations. In DNNs, there is not a training stage but, rather, a constant adaptation of dynamic datasets [45]. ANNs have been applied to mixed culture systems already. As an example, Kana et al. [47] modeled and optimized biogas production by mixed cultures that utilized mixed substrates; additionally, Jorjani et al. [48] predicted the reduction of organic and inorganic sulfur from coal using a mixed culture. More recently, Gradilla-Hernández et al. [49] applied a DNN for the nonparametric identification of a mixed microbial culture system with two genera. As of this writing, DNNs have not been utilized as a means to determine the parameters in more complex mixed culture systems

1.5. The Objective of the Study

The present work aimed to characterize microbial interactions (e.g., mutualism) occurring between the community members of the human gut microbiota in a gastrointestinal tract simulator. To that end, a DNN was applied for nonparametric identification of the dynamic behavior of the microbial consortium, followed by an optimization estimation technique based on the comparison of the error between the trained DNN and the gLV model structure to determine the parameters. This method was applied to gain quantitative and qualitative knowledge of the microbial interactions between particular populations as a subsample of the microbial gut community. Additionally, the effect of the continuous administration of agave fructans on microbial interactions was evaluated.
This study analyzed the dynamics of a subsample of the human gut microbiota, including four genera—Lactobacillus spp., Bifidobacterium spp., Salmonella spp. and Clostridium spp.—as it is difficult to track each member of the community in fecal samples. There are studies that demonstrate that the alteration in number and composition of bacteria belonging to the genus Lactobacillus spp. [50] and Bifidobacterium spp. [51] play an important role in the health or disease of the host. Likewise, bacterial species of the Salmonella spp. genera [52] and the Clostridium spp. genera [51] also have significant effects. While these genera are representative of gut microbiota, the dynamics of other important populations within the community were not observed.
The strategy proposed here, combining a nonparametric system identification and an optimization technique, was applied satisfactorily to gain quantitative and qualitative knowledge of a broad spectrum of microbial interactions in the gut community as described by the gLV model. Future studies should seek to apply this strategy in conjunction with high-throughput sequencing in order to infer microbial metabolic interactions in the human gut.
A modeling-based approach is an effective way to study the gut microbial metabolic interactions [53]. Metabolic models that integrate transcriptomics, proteomics and metabolomics data have been developed to describe microbial cultures that integrate microbe-metabolite associations, including macromolecule degradation reactions, as well as the resulting products [18,53]. However, because of the complexity of the gut microbiome, where numerous microbe–microbe and microbe–host interconnections weave together a complex ecological network, most current metabolic models have not yet reached the scale of diversity existing in the human gut community [18]. Furthermore, metabolic models require a finite number of parameters to be determined in order to define the model. These parameters may have biological significance (e.g., specific growth rate or reaction rate constants) or may be coefficients or other constants in a functional relationship that describes a biological process. The strategy proposed here to determine these parameters within metabolic models (including the DNN identifier and the optimization algorithm) could be applied to extend the study of metabolic interactions. Lastly, further efforts using this strategy should study the metabolic interactions of simpler communities of known compositions created from monocultures using representative members of the colonic microbial community.

2. Results and Discussion

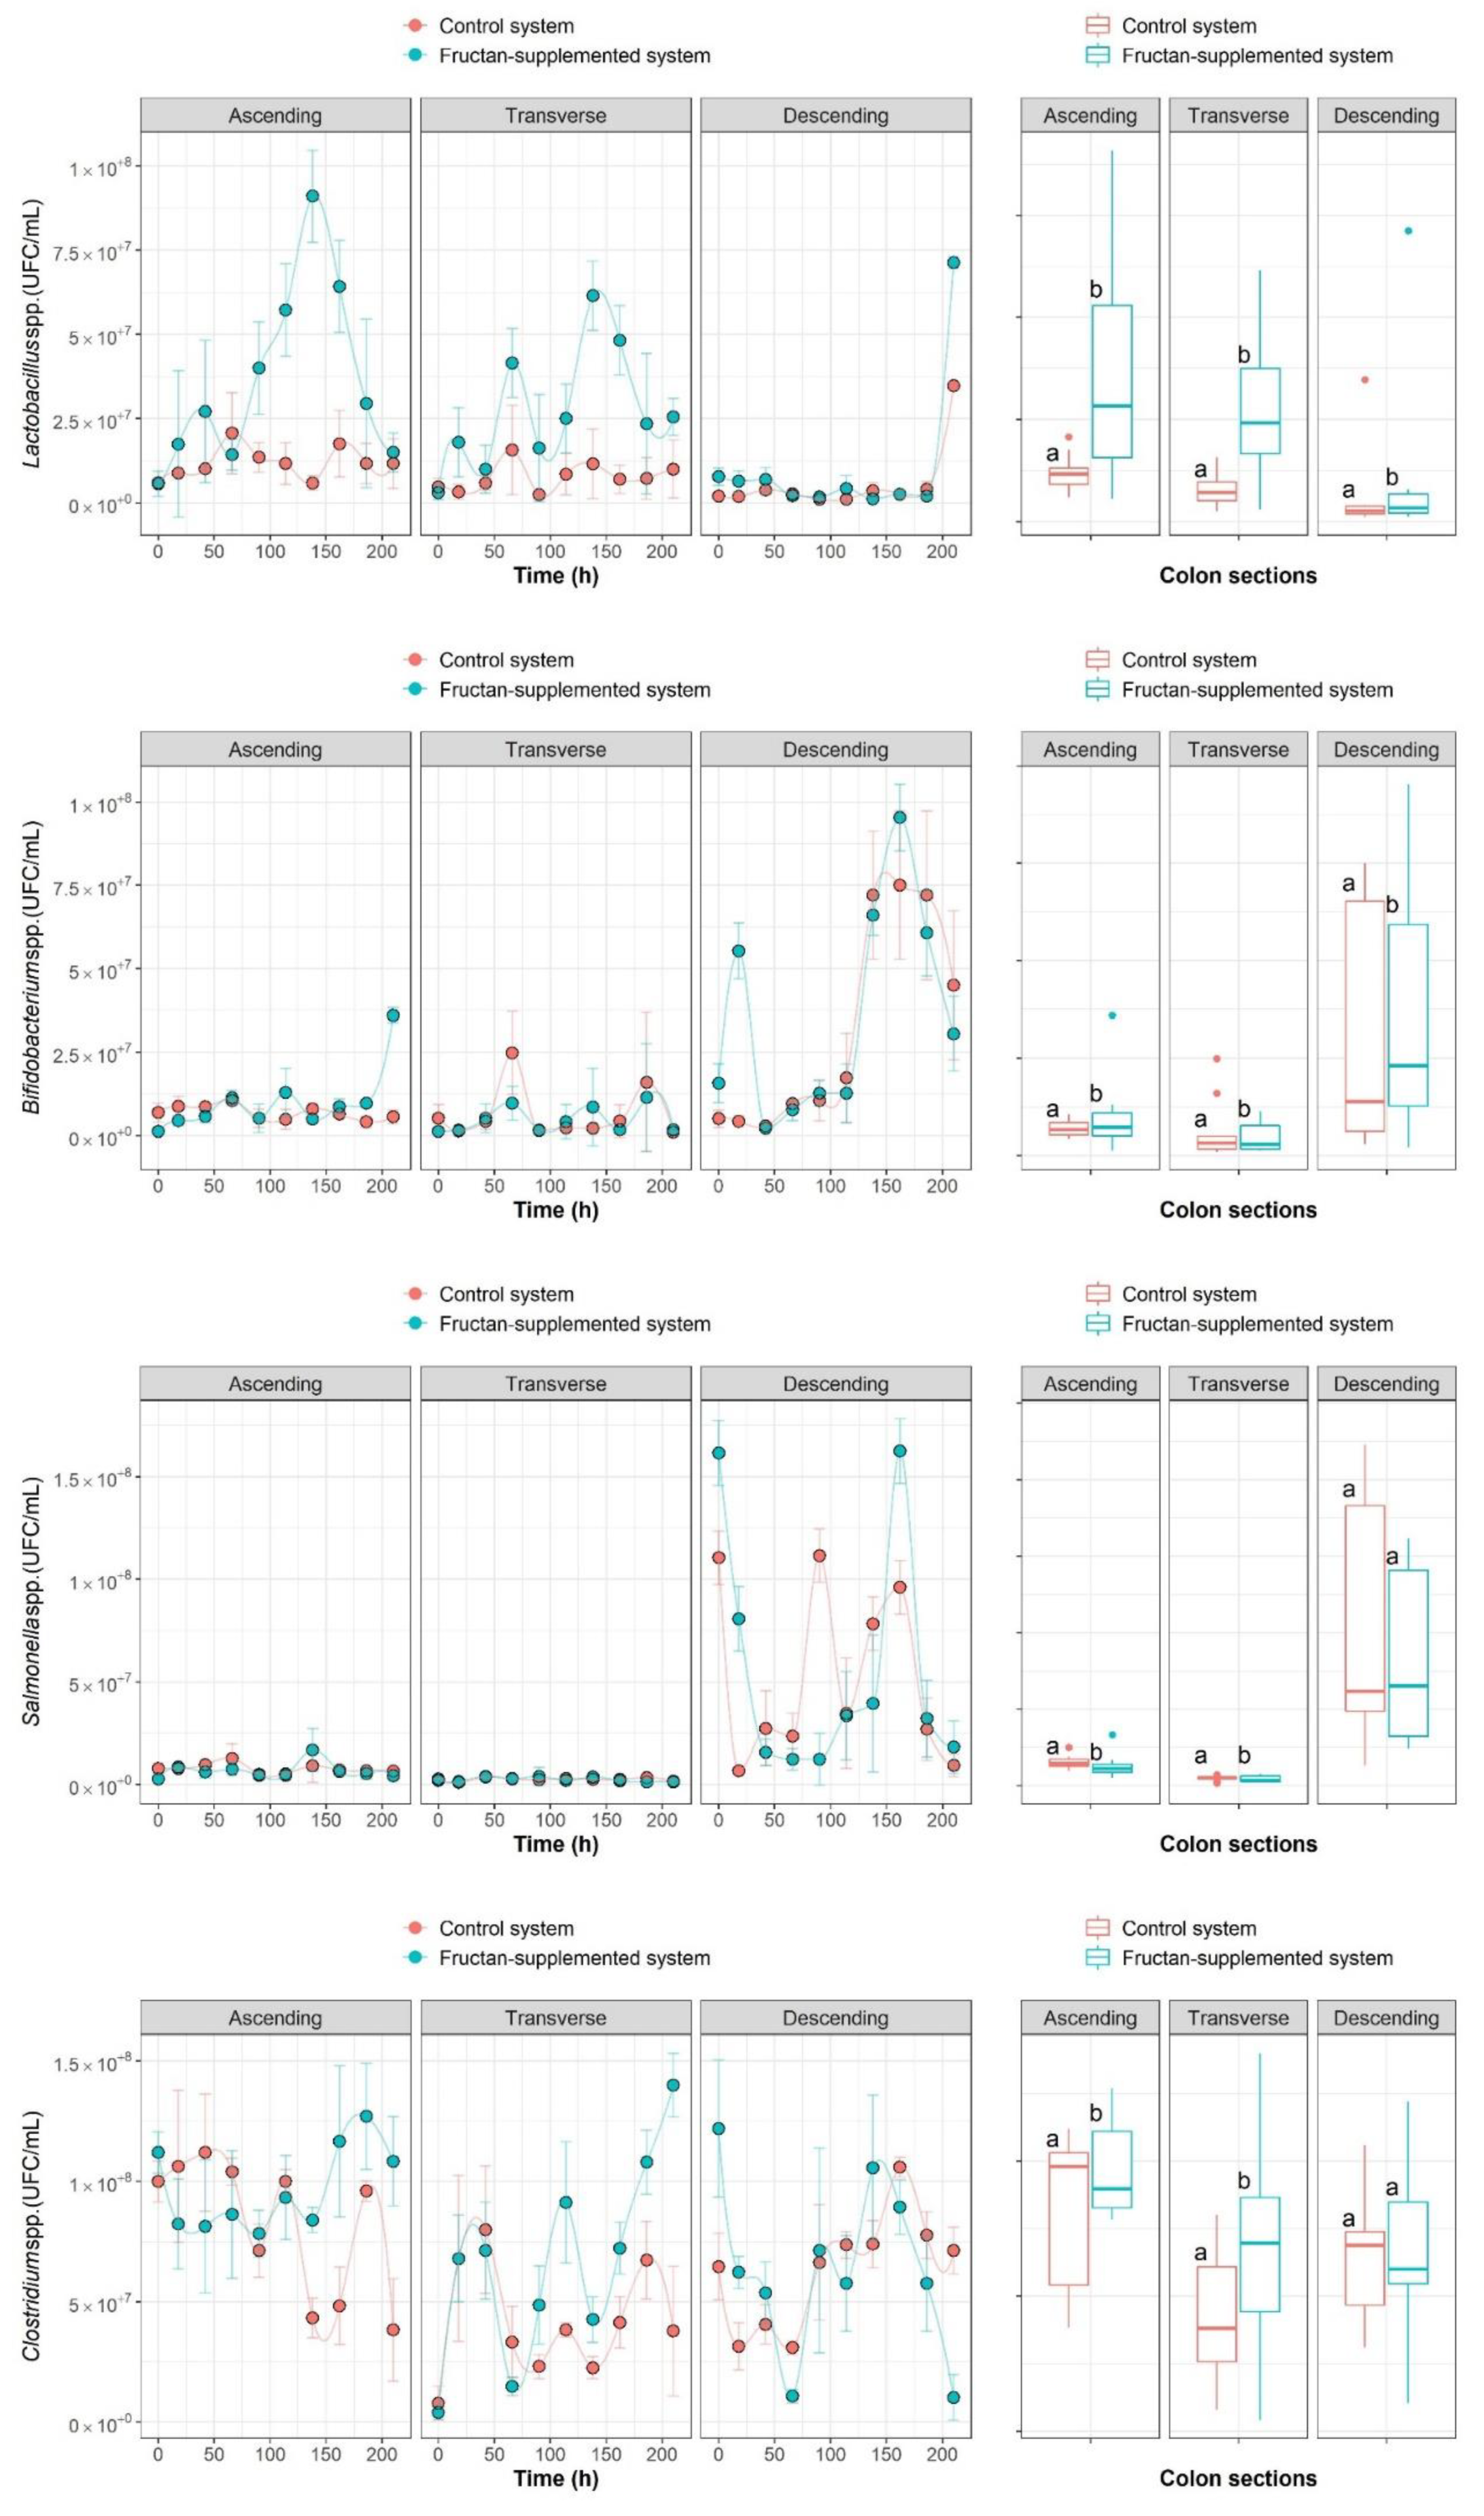
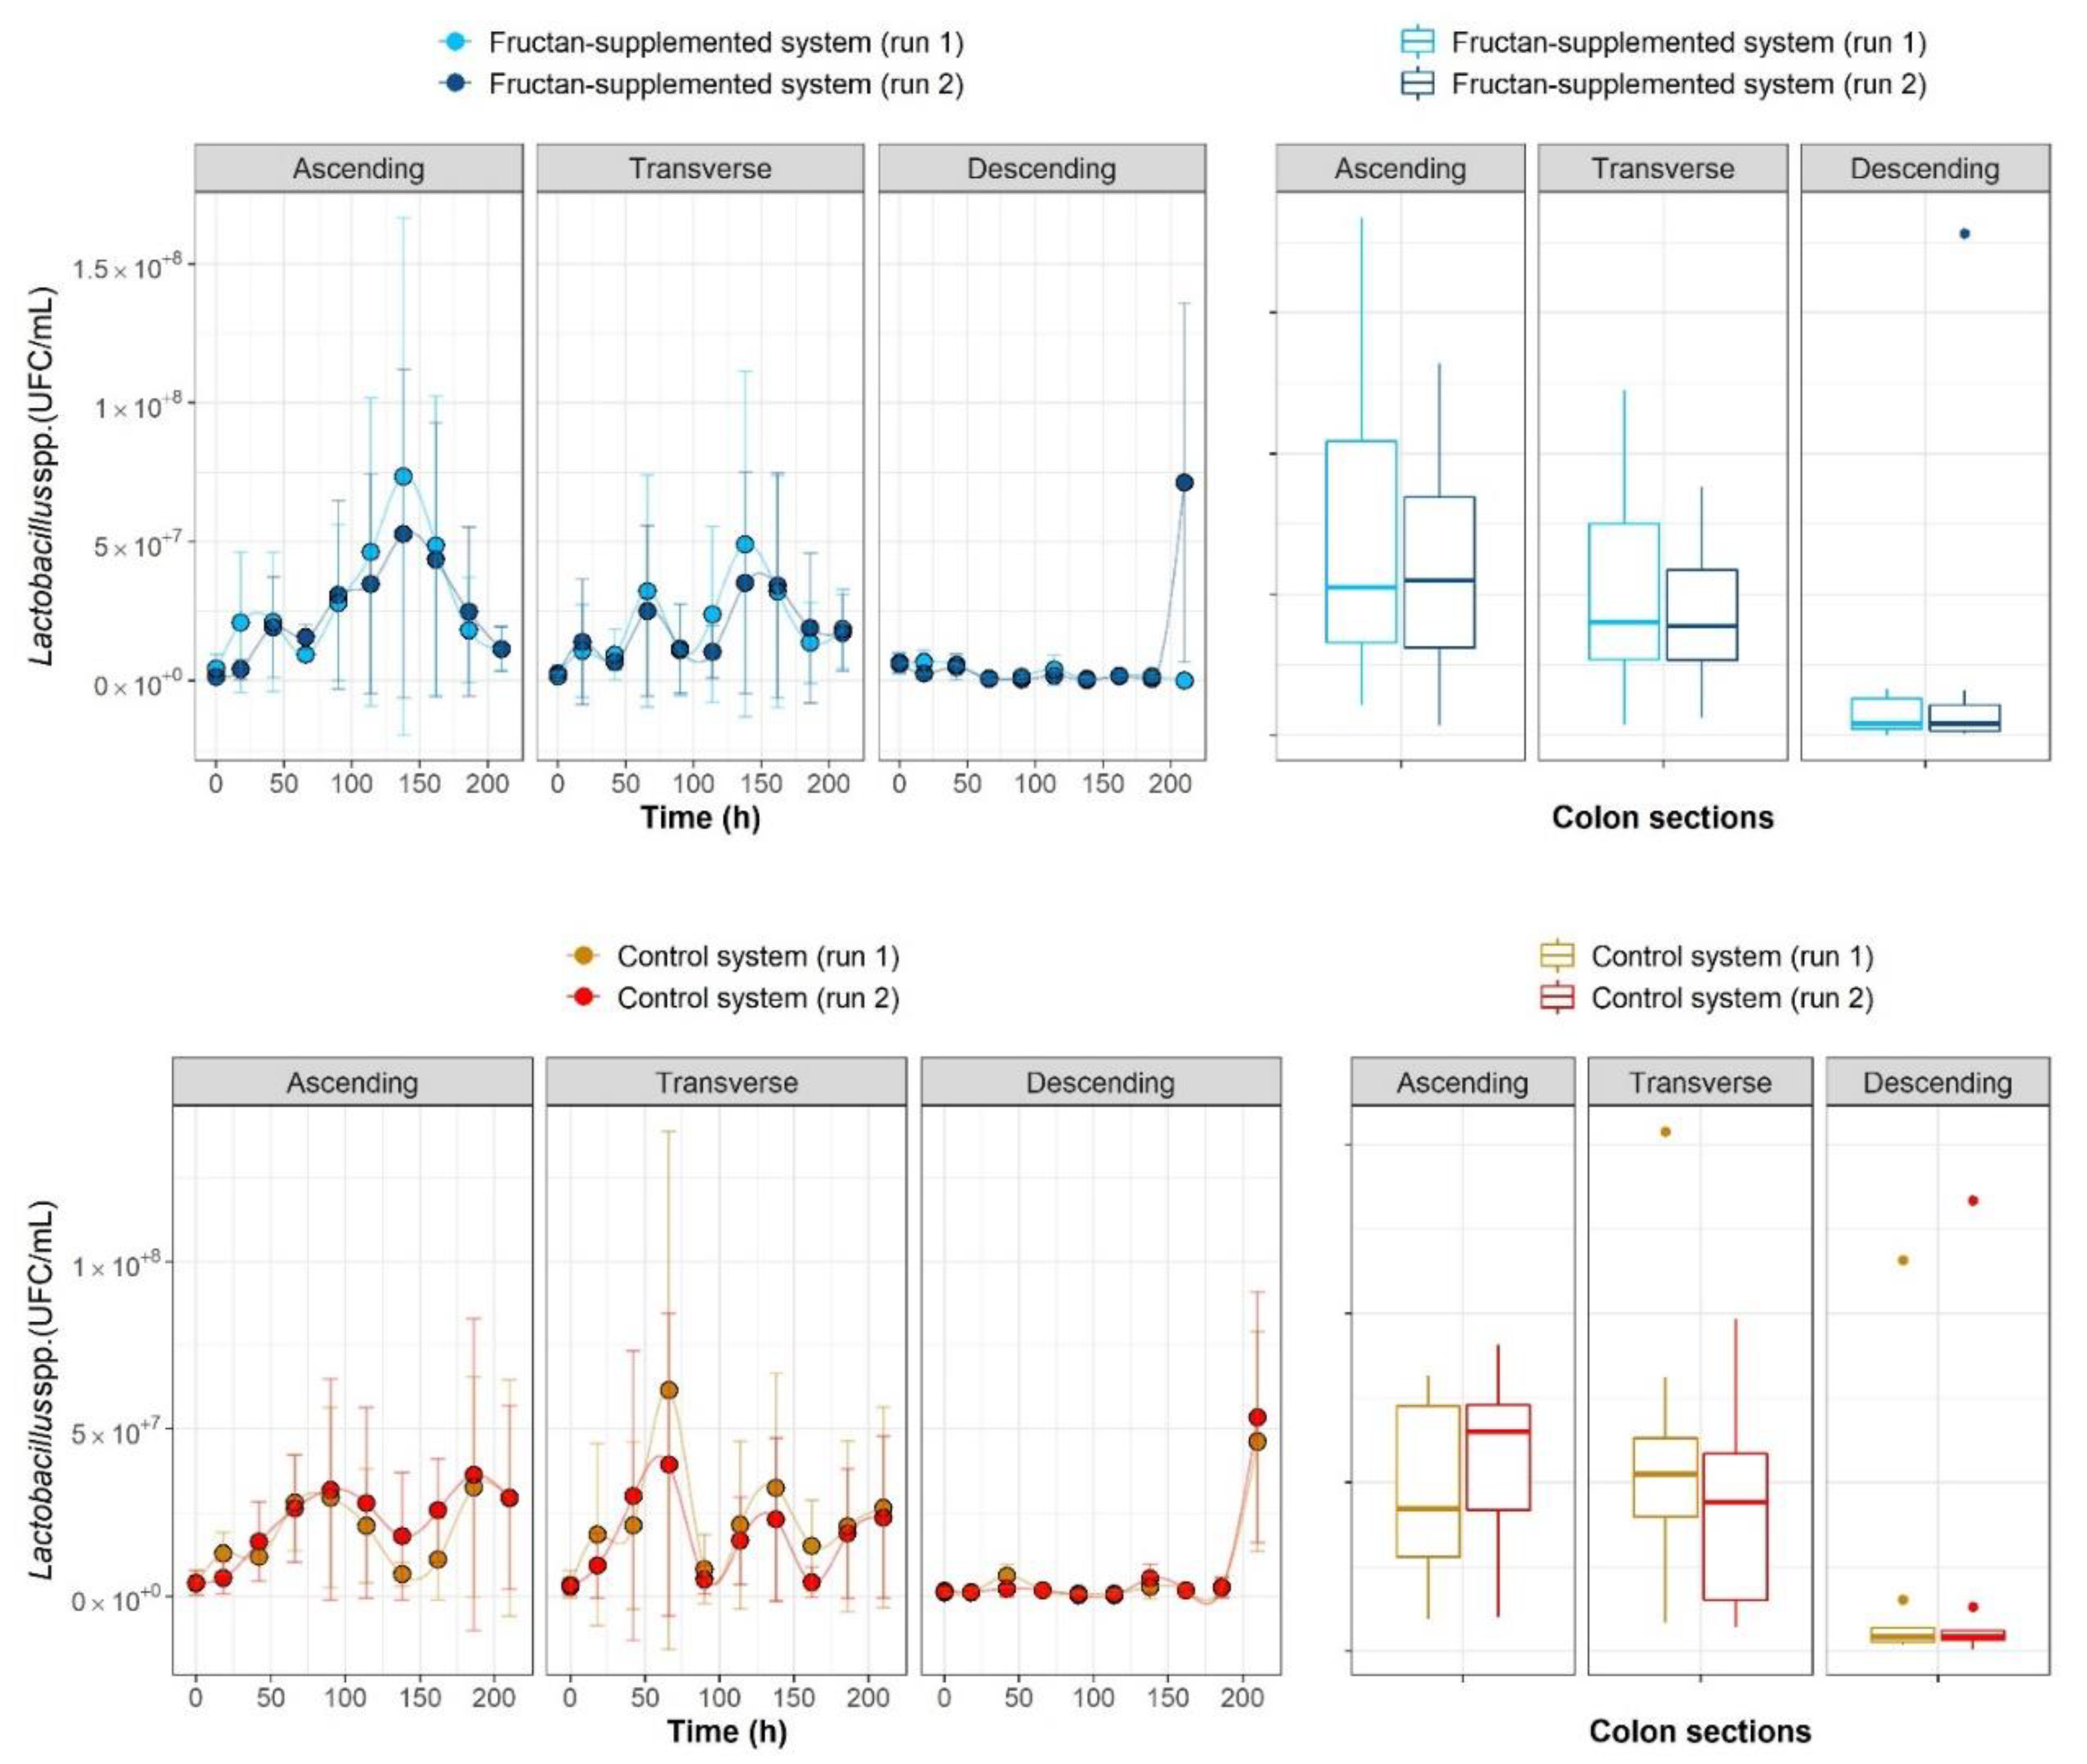
2.1. The Growth Kinetics of Four Microbial Populations

Within-run reproducibility and between-run repeatability of the ARIS system were tested by carrying out four runs in twin systems (two supplemented with fructans and two using the control setup). Additionally, all plate counts (within a system) were performed in triplicate. As shown in Figure 1, comparable results were obtained between runs when calculating the average value for the plate count replicates within systems for all the compartments (ascending colon, transverse colon and descending colon), and initial counts were proven to be comparable.
The time-series data obtained provided a snapshot of the composition of the community at discrete points in time. Figure 2 shows the growth curves of Lactobacillus spp., Bifidobacterium spp., Salmonella spp. and Clostridium spp., and the box plots of the time-series data. The results suggest stimulation of Lactobacillus spp. following agave fructans administrations in all colon sections, as significantly higher counts were observed in all colon sections of the fructan-supplemented system compared to the control system (p < 0.05). García-Gamboa et al. [54] reported a colon section-specific modulating effect, as Lactobacillus spp. increased in the ascending and in the transverse colon sections following the administration of fructans with intermediate polymerization degree fructans (10–22 fructose molecules) using the same experimental system. It is also worth noting that the fructans administered showed a limited effect in the stimulation of Lactobacillus spp., which was not extended throughout the entire administration period, as the numbers of Lactobacillus spp. in the fructan-supplemented system decreased in the ascending and the transverse colon sections after reaching a peak at time = 138 h (Figure 2). Furthermore, the counts of Lactobacillus spp. in the ascending colon section of the fructans-supplemented system were comparable to those of the control system at the final measurement (time = 210 h). Similar results were found by Cardarelli et al. [55], who reported on the numbers of Lactobacillus spp. during fermentations inoculated with human fecal samples in the presence of fructooligosaccharides. These results have implications for assessing the longevity of prebiotic effects.
Higher counts of Bifidobacterium spp. were also observed in the ascending and transverse colon sections of the fructan-supplemented system in comparison to the control system (p < 0.05). Inulin-type fructans are known for their so-called bifidogenic effect [56], due to the tendency to selectively increase the number of Bifidobacterium spp. in the human colon, as they are able to ferment this type of fructans [57,58]. The study performed by García-Gamboa et al. [54] using the ARIS ex vivo system also demonstrated a bifidogenic response specific to the colon sections, as Bifidobacterium spp. counts increased in the ascending and descending colon sections after the administration of higher polymerization degree fructans (22–60 fructose molecules). As shown in Figure 2, changes in the population sizes of Lactobacillus spp. and Bifidobacterium spp. did not last for the full duration of the intervention.
Salmonella spp., on the other hand, presented higher counts in the ascending and transverse colon sections (p < 0.05) of the control system in comparison to the fructan-supplemented system, showing that the fructans did not stimulate the growth of this genus. Clostridium spp. was stimulated by fructan administrations, as higher counts of it were observed in the fructan-supplemented system in the ascending and transverse colon sections. These results match the definition of prebiotics, since fructans stimulated Lactobacillus spp. and Bifidobacterium spp. in the experimental system, while the growth of pathogenic Salmonella spp. was not stimulated [59]. Nevertheless, it is important to mention that the results of this study suggest there was also stimulation of Clostridium spp. following fructan administrations. Research has shown that Clostridium spp., traditionally considered a pathogenic genus, is involved in the production of butyrate and propionate from lactate, which are beneficial to human health through cross-feeding interactions [60].
Gibson [21] also reported the evolution of the Lactobacillus spp., Bifidobacterium spp. and Clostridium spp. mixed culture after inulin-type fructans were administered. They reported a marked increase in Bifidobacterium spp. and a decrease in Clostridium spp., whereas Lactobacillus spp. remained unchanged. Different results may be expected because a different prebiotic was used, and the study performed by Gibson [21] used an in vivo experimental approach using a mixed culture with a completely know composition, while the present study analyzed only four genera within the fecal microbial community, and the remaining populations that were not observed might also impact community dynamics.

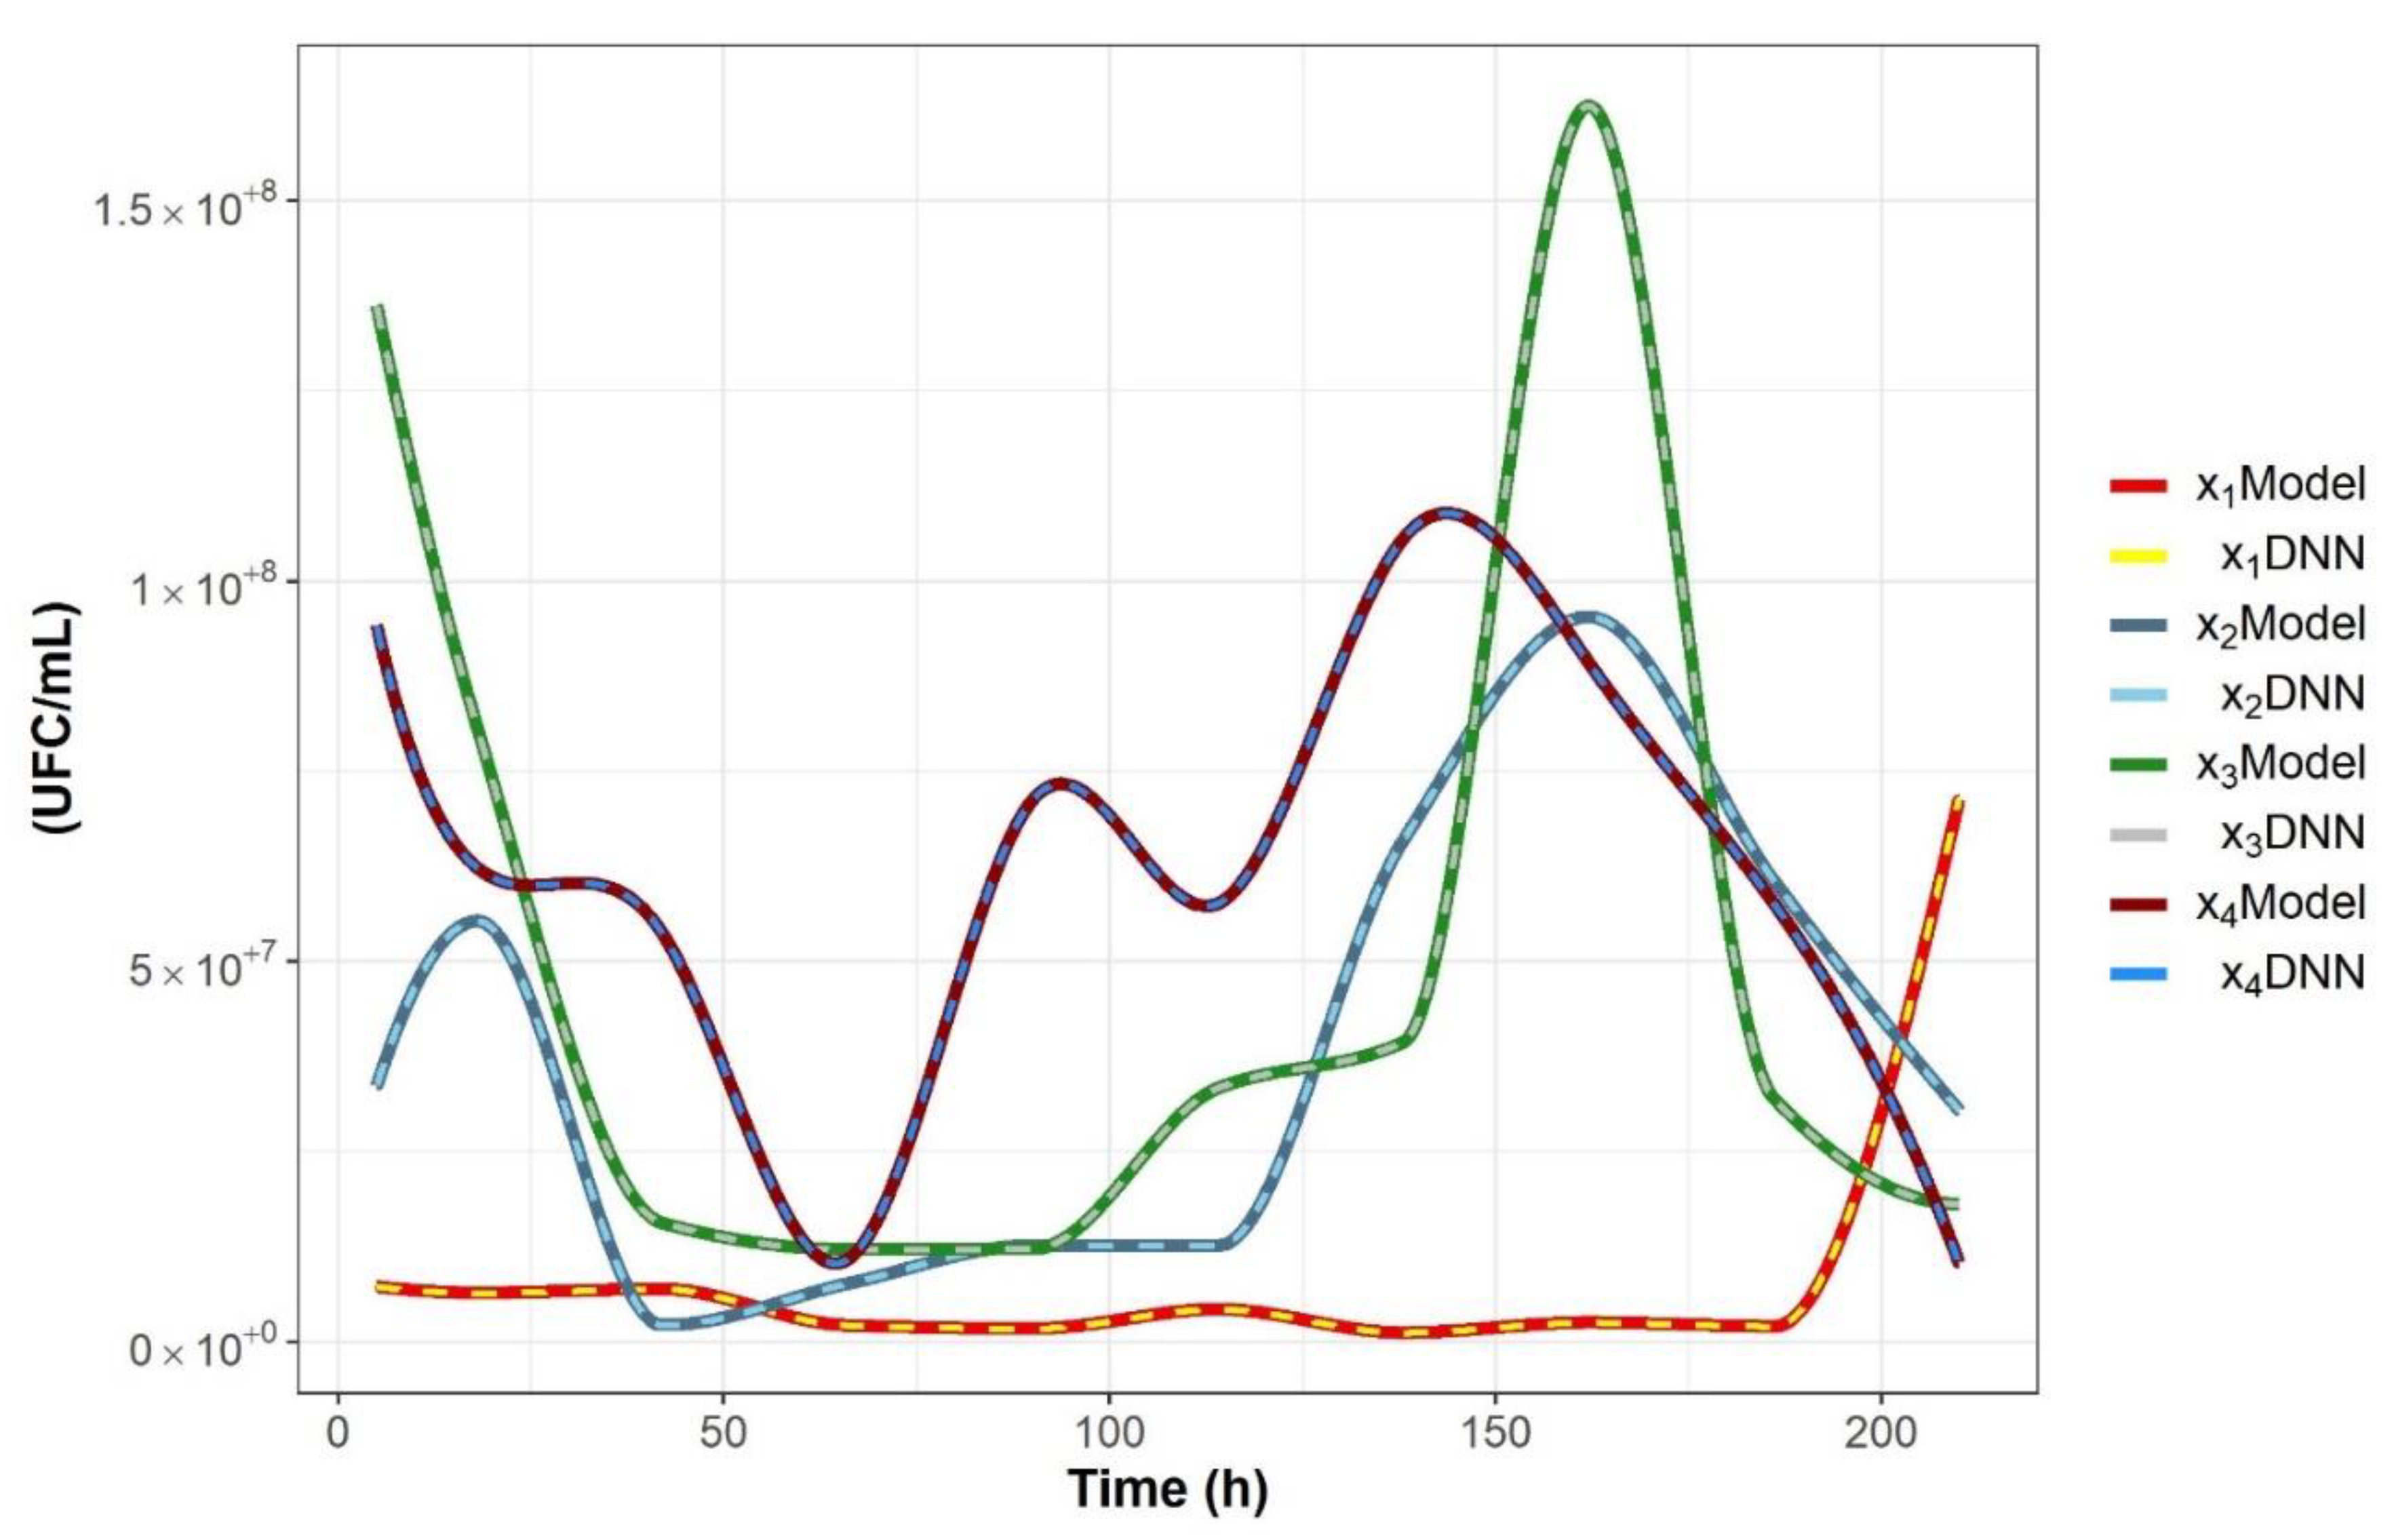
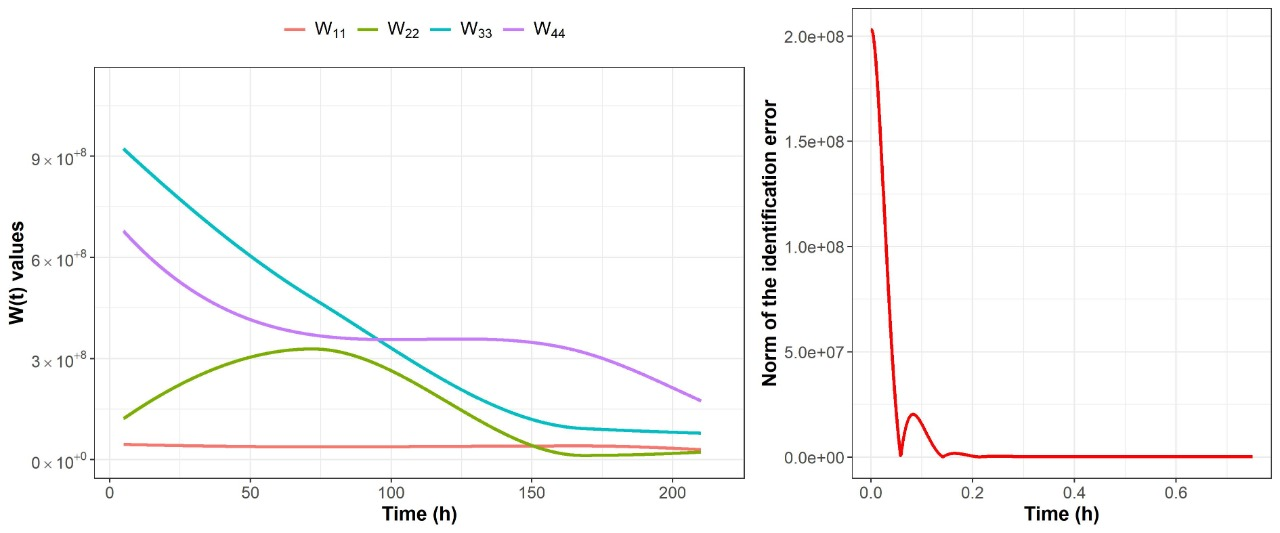
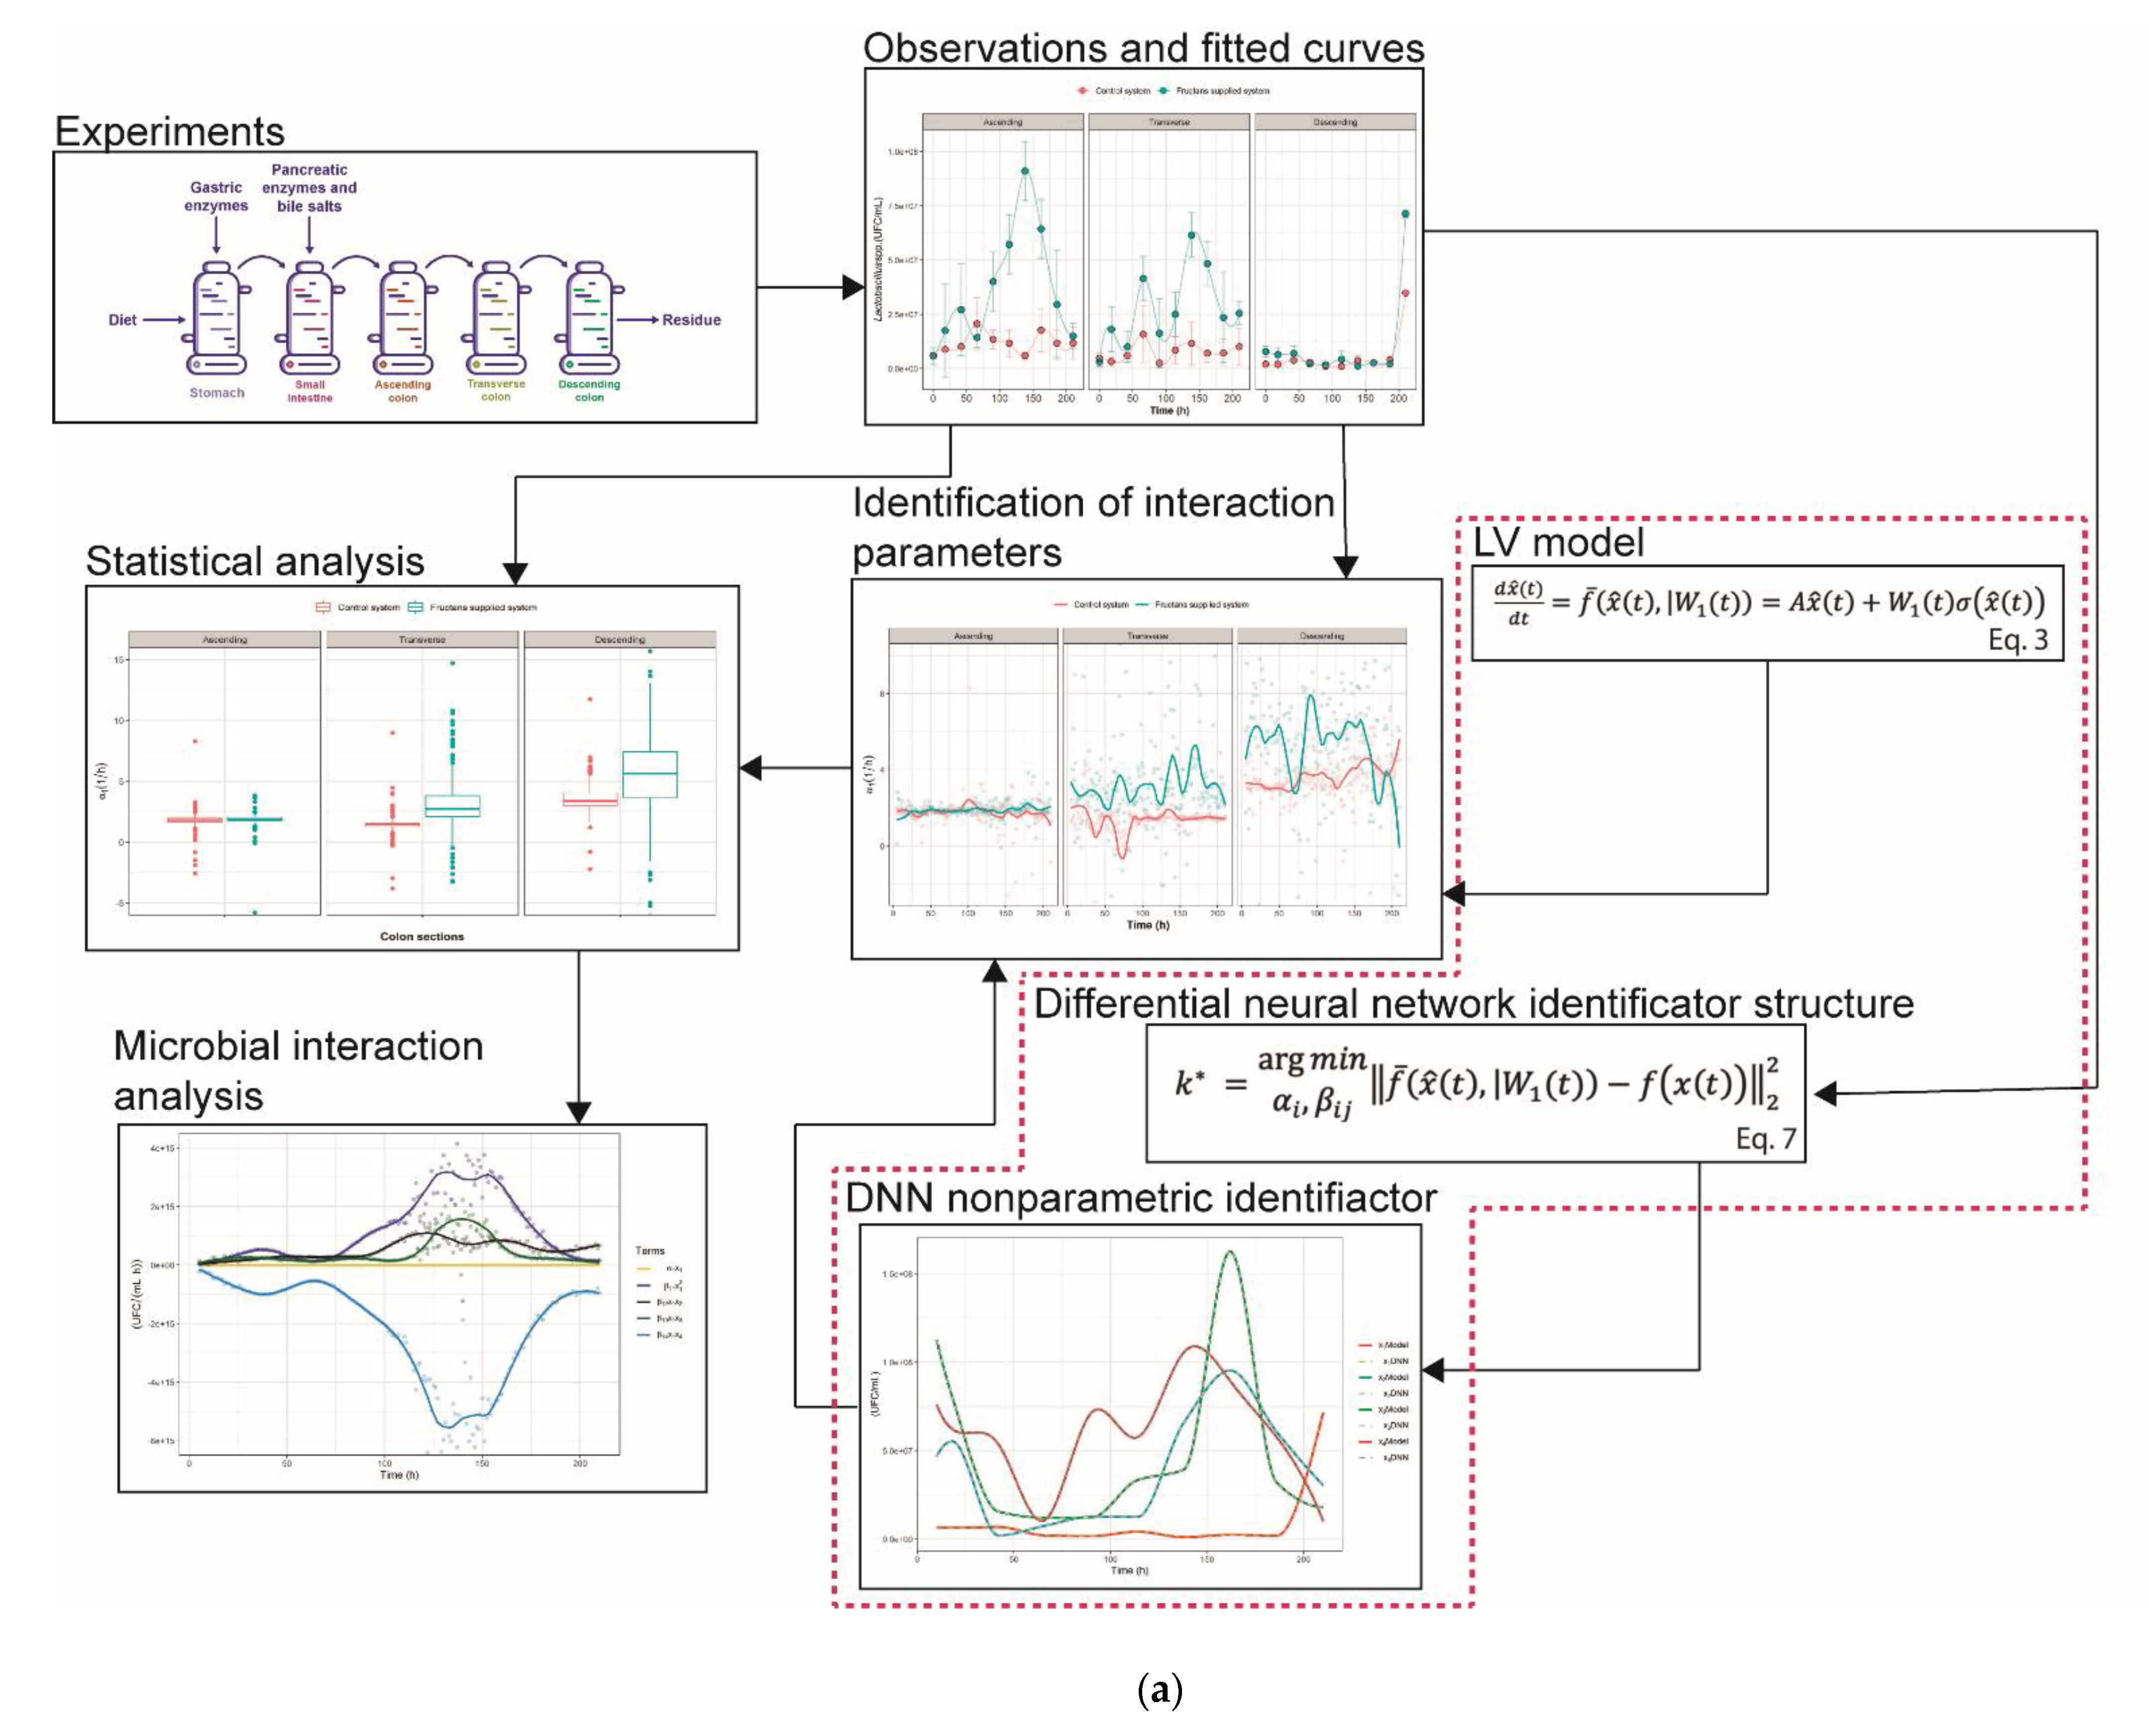
2.2. Nonparametric Identification of the Experimental Data by the DNN Identifier

For the nonparametric identification, the fitted time series of each component was used to define the state vector x ( t ) with the following components: x 1 ( t ) = Lactobacillus spp. abundance, x 2 ( t ) = Bifidobacterium spp. abundance, x 3 ( t ) = Salmonella spp. abundance and x 4 ( t ) = Clostridium spp. abundance. Considering the DNN identifier in Equation (3) and its adaptation law in Equation (4), the set of ordinary differential equations d x ^ ( t ) d t ϵ 4 , with components d x ^ 1 ( t ) d t , d x ^ 2 ( t ) d t , d x ^ 3 ( t ) d t   and   d x ^ 4 ( t ) d t corresponding to the identified rate of change of the abundance of Lactobacillus spp., Bifidobacterium spp., Salmonella spp. and Clostridium spp. were obtained, respectively. The set of parameters for the DNN identifier are selected as: linear part A = 60 × I 4 × 4 , the adaptable weight matrix as a diagonal array W 1 ( t ) = [ w 11 ( t )   0   0   0 ; 0   w 22 ( t )   0   0 ; 0   0   w 33 ( t )   0   ;   0   0   0   w 44 ( t ) ] and the vector of sigmoid functions σ ( x ^ ( t ) ) = [ σ 1 ( x ^ 1 ( t ) )   σ 2 ( x ^ 2 ( t ) )   σ 3 ( x ^ 3 ( t ) )   σ 4 ( x ^ 4 ( t ) ) ] ; then, the particular nonparametric identification structure for every experiments is:
[ d x ^ 1 ( t ) d t d x ^ 2 ( t ) d t d x ^ 3 ( t ) d t d x ^ 4 ( t ) d t ] = [ 60 0 0 0 0 60 0 0 0 0 60 0 0 0 0 60 ]   [ x ^ 1 ( t ) x ^ 2 ( t ) x ^ 3 ( t ) x ^ 4 ( t ) ] + [ w 11 ( t ) 0 0 0 0 w 22 ( t ) 0 0 0 0 w 33 ( t ) 0 0 0 0 w 44 ( t ) ]   [ σ 1 ( x ^ 1 ( t ) ) σ 2 ( x ^ 2 ( t ) ) σ 3 ( x ^ 3 ( t ) ) σ 4 ( x ^ 4 ( t ) ) ]
The rate of learning P in the adaptation law given by Equation (4) was fixed as P = 100 × I 4 × 4 . This structure is used for each segment of the colon; trajectories of adaptable weights W ( t ) are the difference between each section of the colon. Figure 3 shows the comparison between the original data and the identified system in the case of the descending colon section of the fructan-supplemented system. Figure 4 shows the trajectories of the adaptable weights as well as the norm of the nonparametric identification error for the descending colon section fed with the fructan-supplemented diet. Equivalent results were obtained for each segment of the colon.
Given that the objective of this study was to determine the microbial indication parameters as described by the gLV model structure applying the DNN for nonparametric identification of the dynamic behavior of the microbial consortium, the identified set of equations d x ^ ( t ) d t = f ¯ ( x ^ ( t ) , | W 1 ( t ) ) and considering the structure of the gLV in Equation (6), the optimization problem given in Equation (7) was solved for each colon segment and for both the control and the fructan-supplemented system, at point in time (t), creating a time series for the estimated parameters α i ( t ) , β i j ( t ) . A solution for the optimization problem was found for every integer value of time t of the experiment; therefore, 211 solutions were found for the 210 h of the experiment for each colon segment and for both the control and the fructan-supplemented system (See Table 1).

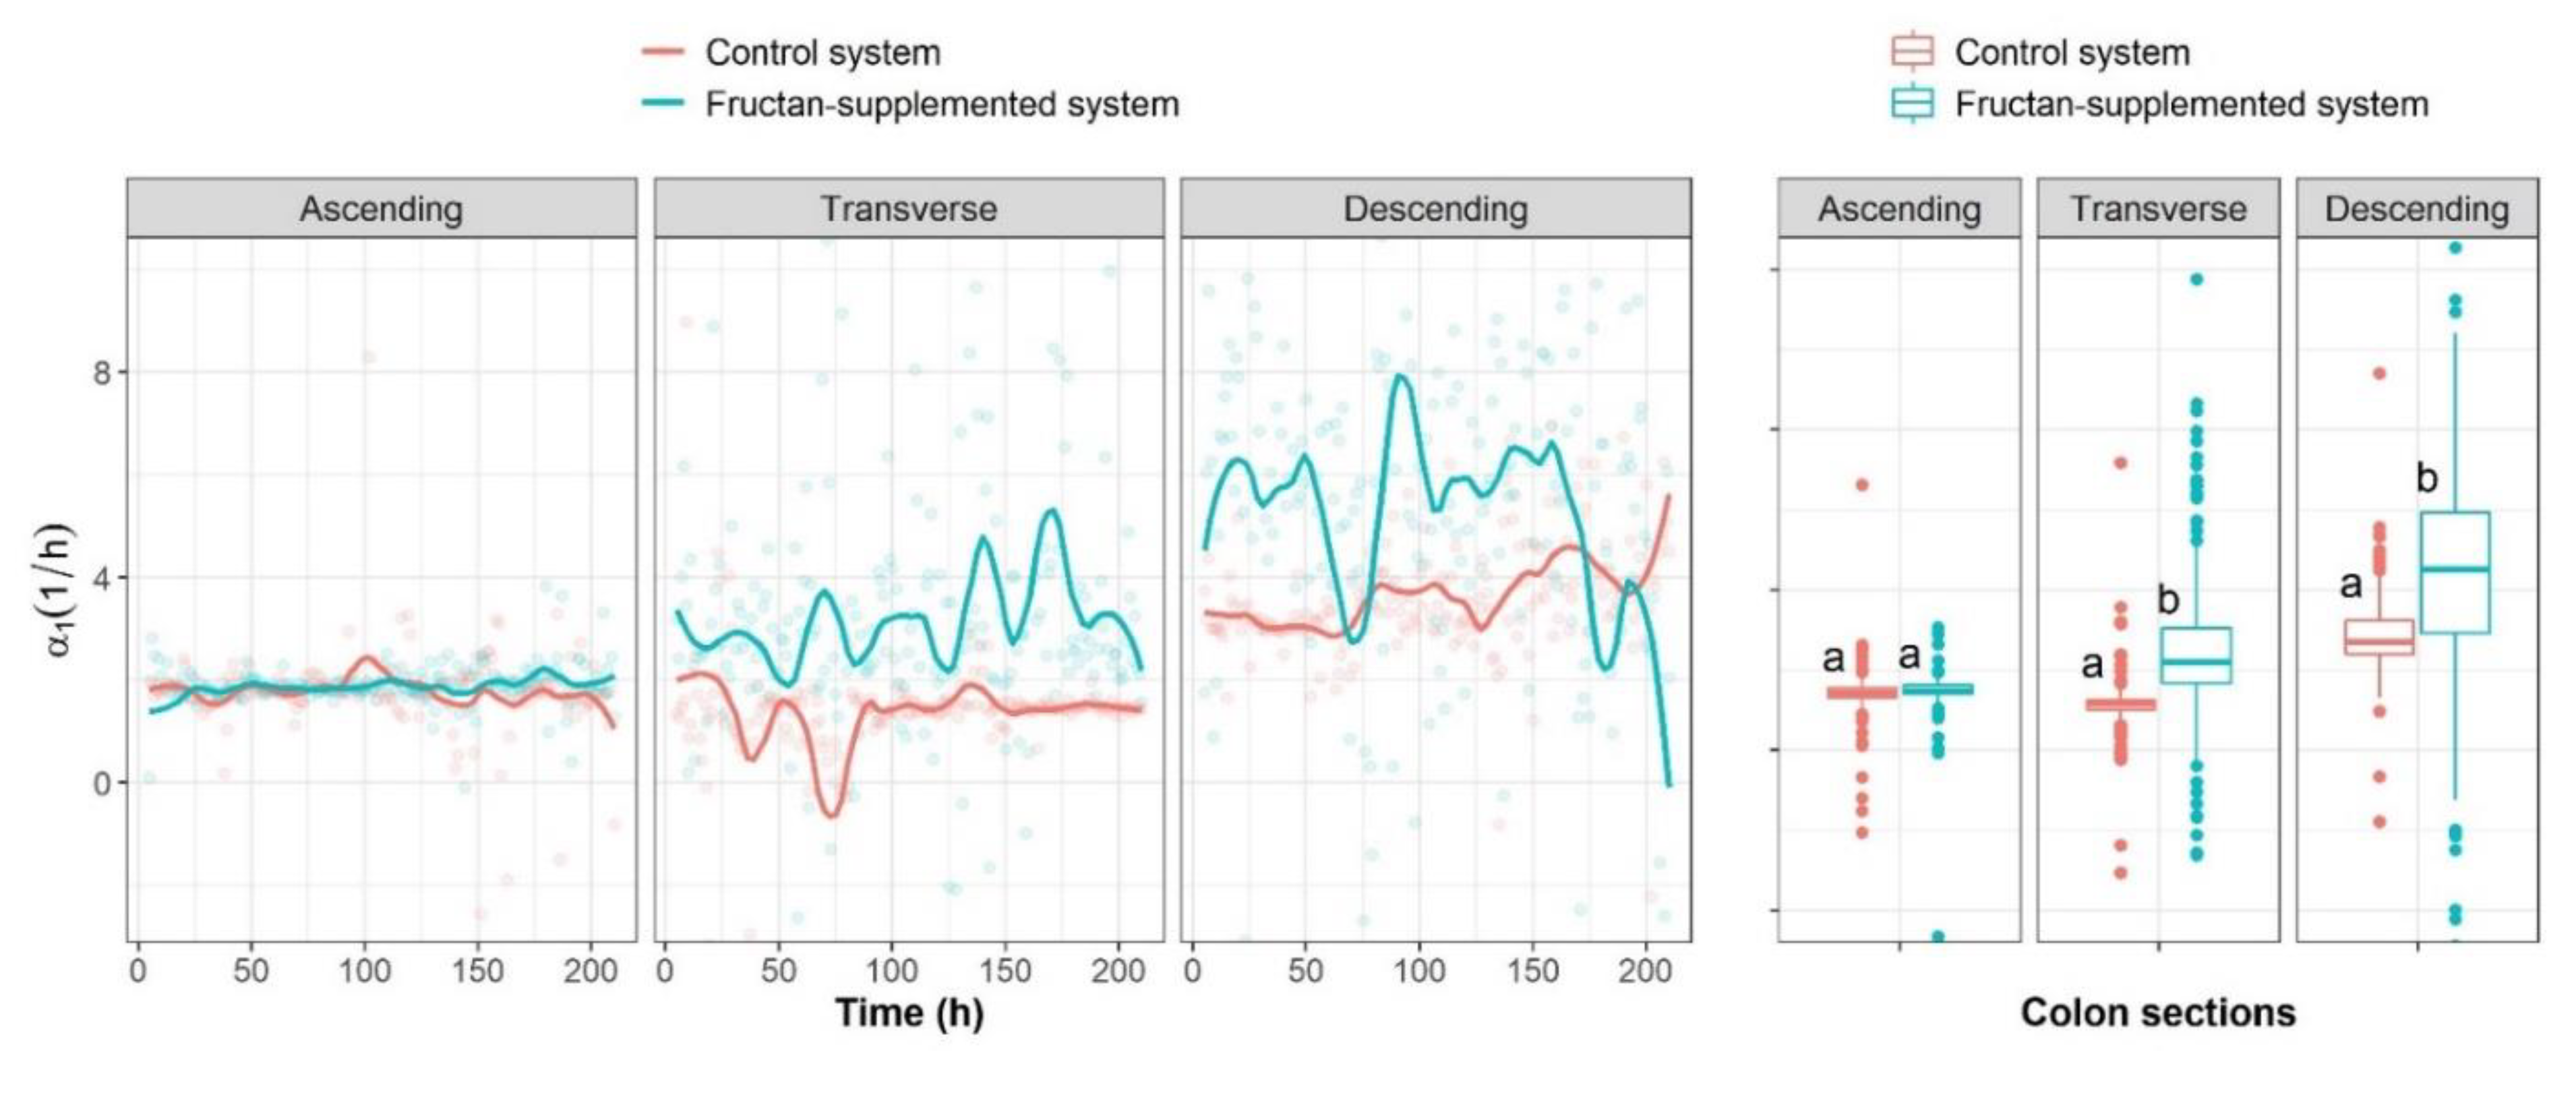
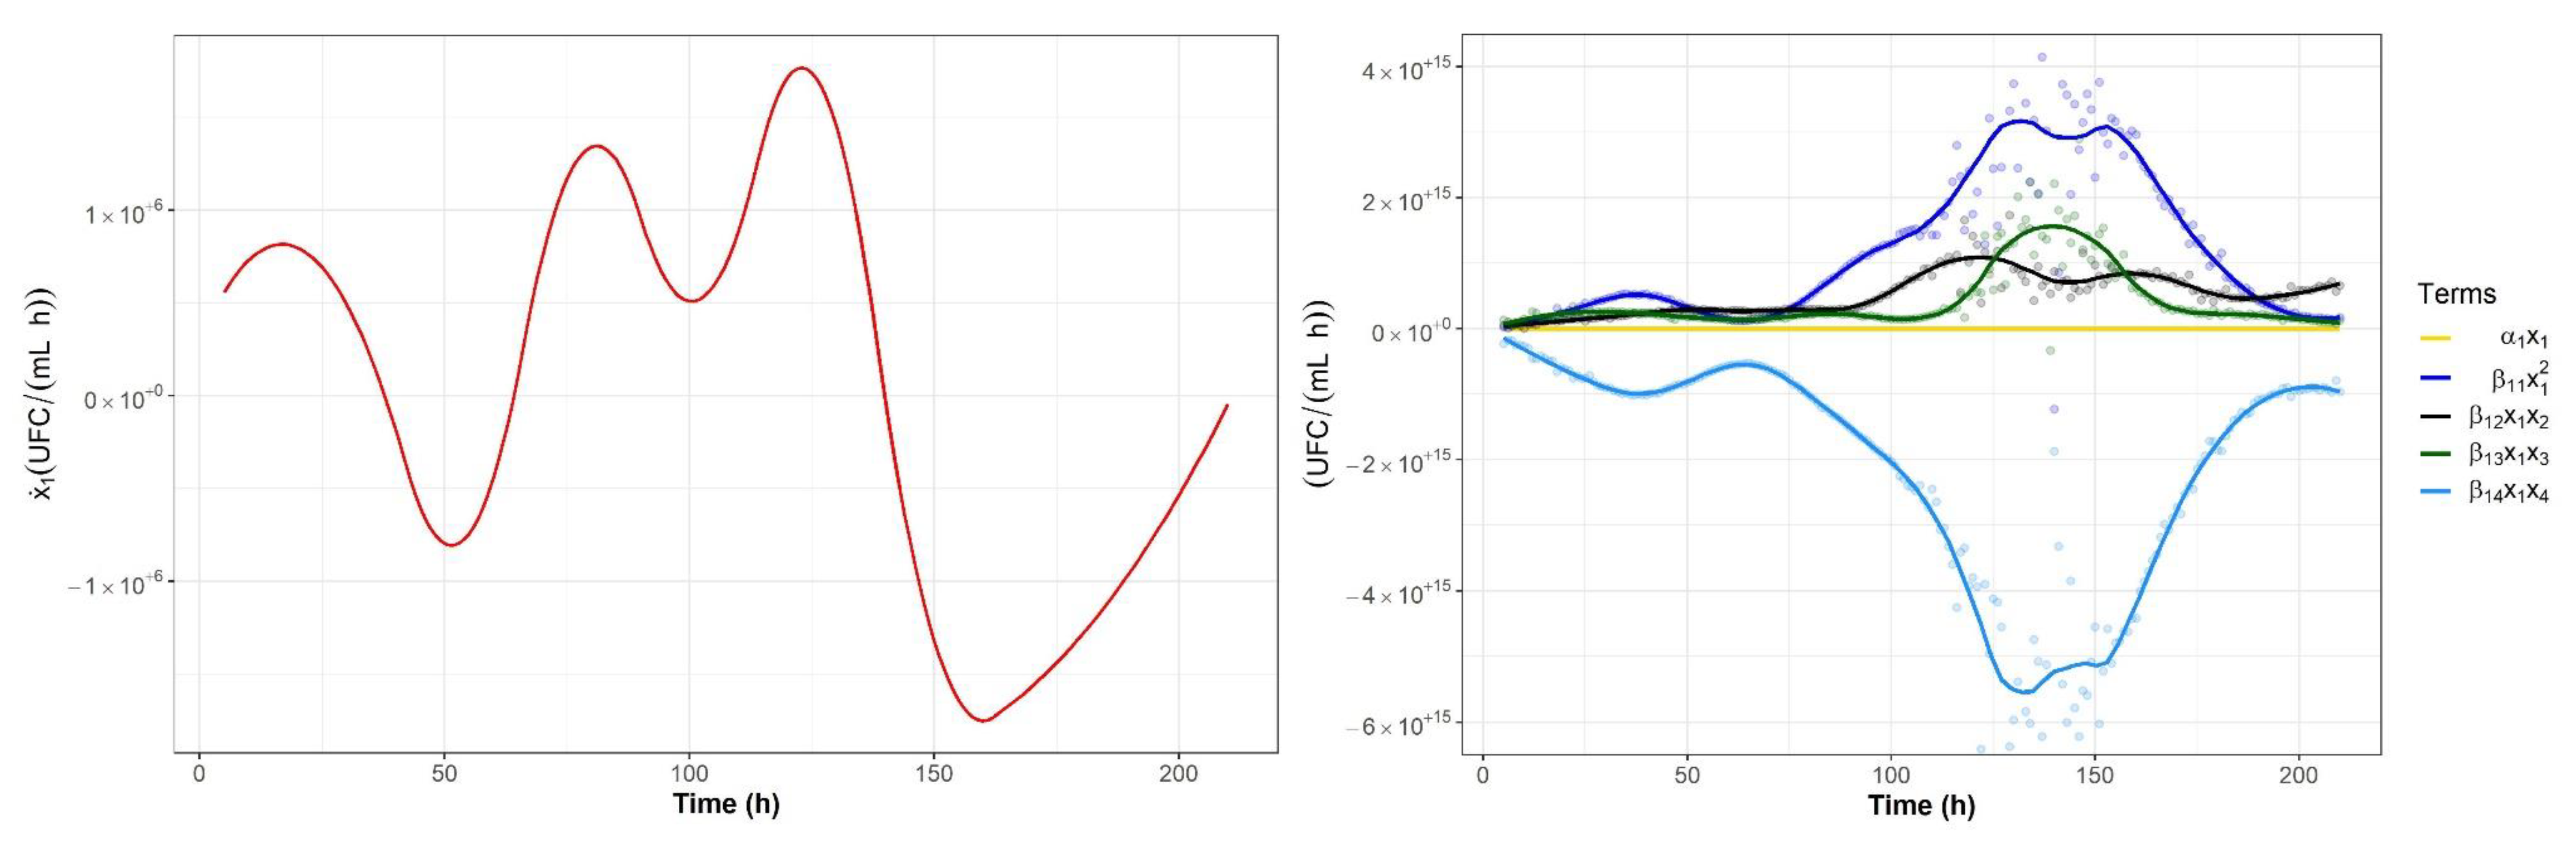
2.3. Analysis of Microbial Interaction Parameters

As stated above, the parameters were determined as time series vectors. Table 1 shows the mean values for the time series vectors of the estimated taxon-specific growth rates αi, as well as the intraspecific (βii) and interspecific (βij) gLV impact coefficients for all genera analyzed. Different values were observed for the gLV model coefficients when agave fructans were administered; therefore, prebiotics not only stimulated the growth of probiotics but also modulated microbial interactions, as previously suggested by Medina et al. [61].
Section 2.3.1 focusses on the evolution of the gLV coefficients for Lactobacillus spp. and examines unidirectional impacts of the four genera on Lactobacillus spp. (the β1j for j = 1,2,3,4) as an example, as well as analyzing the modulating effect of agave fructans on these microbial interactions. Specifically, Figure 4 exemplifies the variation of the gLV coefficients over time by presenting the evolution trend and the box plot of the specific growth rates (αi) for Lactobacillus spp. for the different colon sections of the control system and the fructan-supplemented system.
Since the gLV model considers the impact of one population on another using pairwise unidirectional impact coefficients but cannot explicitly capture the type of interaction occurring between community members, Section 2.3.2 presents the analysis of bidirectional microbial interactions by comparing the respective βij and βji coefficients (Table 2) in order to determine the type of interaction between genera.
Section 2.3.3 presents a graphical representation of bidirectional interactions between Lactobacillus spp. and the other genera (Bifidobacterium spp., Salmonella spp. and Clostridium spp.). As an example, each of the five terms of the gLV differential equation describing the growth of Lactobacillus spp. in the ascending colon section following the administration of inulin-type fructans are presented.

2.3.1. Unidirectional Impact Analysis

The mean specific growth rates of Lactobacillus spp. α1 were significantly higher (p < 0.05) in the transverse and descending colon sections of the fructan-supplemented system in comparison to the control system, as shown in Figure 5. The mean specific growth rates of Lactobacillus spp. for all colon sections were within the range of 1.788 < α1 < 3.642 1 when no fructans were supplied and within the range 1.864 1 < α1 < 5.201 when fructans were supplied (Table 2). Higher values were obtained when agave fructans were administered, meaning that, in the absence of interactions, a higher growth rate can be expected for Lactobacillus spp. following fructan administrations. These results match what is set out in the literature reporting the prebiotic effect of inulin-type fructans [23] and agave fructans [34].
The analysis of the β11 coefficients revealed that Lactobacillus spp. experienced intraspecific cooperation, since β11 > 0 for all cases (Table 2), although the strength of intraspecific cooperation in all colon sections was observed to be significantly higher (p < 0.05) for the control system (0.553 < β11 < 1.459) in comparison to the fructan-supplemented system (0.008 < β11 < 1.039). Inulin-type fructans are known to have a prebiotic effect, as they selectively stimulate the growth of Lactobacillus spp. and Bifidobacterium spp. [23]. Therefore, a lower intraspecific cooperation strength would be expected when these carbohydrates are added to a mixed culture where they have a specific colonic fermentation directed toward these genera.
The gLV impact coefficients also showed Bifidobacterium spp. having a positive impact on Lactobacillus spp., as shown by the values of β12 > 0 in Table 1. The impact of Bifidobacterium spp. on Lactobacillus spp. was significantly higher in the ascending colon section for the fructan-supplemented system in comparison with the control system (p < 0.05). Conversely, this impact was higher in the transverse and descending colon sections of the control system in comparison to the fructan-supplemented system (p < 0.05). It has been suggested that Bifidobacterium spp. shows no degradation of long-chain inulin-type fructans, and Lactobacillus spp. might be responsible for the degradation of such fructans, leading to the extracellular accumulation of shorter fractions that can then be degraded by Bifidobacterium spp. [30]. In this sense, most of the fermentative metabolism that took place in the ascending colon was associated with Lactobacillus spp., which in turn degraded the longer chain fructans for further metabolization by Bifidobacterium spp.
The impact that Salmonella spp. had on Lactobacillus spp. was positive (β13 > 0) and close to neutral, in some cases (β13 ≈ 0). A significantly stronger impact β13 (p < 0.05) was found for the fructan-supplemented system in comparison to the control system in the ascending colon section, while the opposite was found for the transverse colon. No significant differences were found when comparing the descending colon section in the control and experimental systems. The impact of Clostridium spp. on Lactobacillus spp. was negative, according to the values of β14 < 0, although a more neutral impact (closer to 0) was observed as the digestion progressed along the colon sections when agave fructans were administered. The transverse and descending colon sections of the fructan-supplemented system presented lower (negative) impacts (β14) in comparison to those observed for the control system (p < 0.05).

2.3.2. Analysis of Bidirectional Microbial Interactions for the Fructan-Supplemented System

The analysis of the difference between pair-wise interaction coefficients, β12 and β21, revealed a mutualistic relationship (+/+) between Lactobacillus spp. and Bifidobacterium spp. for the ascending and transverse colon sections of the fructan-supplemented experimental system (Table 2). No negative impacts were observed for this pair of genera in any colon section as shown by the values of β12 and β21. This mutualistic relationship has been previously suggested for this pair of genera that have been reported to cooperate for the degradation of inulin-type fructans and carry out cross-feeding interactions [30,62]. The ability of specific strains of Lactobacillus spp. to degrade inulin-type fructans has been suggested to be an important competitive advantage for surviving in the colon environment [30,63,64]. It has also been suggested that Bifidobacterium spp. are able to break down and utilize inulin-type fructans because they possess the β-fructofuranosidase enzyme, which provides a competitive advantage in a mixed culture environment such as the human gut [25]. This might be the reason why, in this study, as the digestion progressed along the colon sections, the mutualistic interaction between Lactobacillus spp. and Bifidobacterium spp. became more neutral.
A mutualistic relationship (+/+) was also found between Lactobacillus spp. and Salmonella spp., and between Bifidobacterium spp. and Salmonella spp., in the ascending colon section of the fructan-supplemented system—as shown by the differences β1331 and β2332 (Table 2)—although these interactions evolved into neutralism (0/0) as digestion progressed throughout the colon sections. Therefore, agave fructans modulated microbial interaction to foster conditions that were less favorable for Salmonella spp. proliferation. Other studies have suggested that specific strains of Lactobacillus spp. and Bifidobacterium spp. exert an antagonistic pressure against intestinal pathogens [65,66,67,68,69]. Similarly, the antagonistic relationship (+/−) exerted by Clostridium spp. on Lactobacillus spp. and Bifidobacterium spp. was modulated to commensalism (+/0), which affects the growth of the probiotic Lactobacillus spp. and Bifidobacterium spp. genera to a lesser degree.
The results obtained here may vary from those found in the literature, because in this study, a more complex mixed culture was used (microbiota present in human feces), but only four particular populations and the interactions between them were analyzed, whereas the cited studies used cocultures of only two species. As suggested by Smid and Lacroix [4] and Garcia [1], more complex mixed cultures perform more complex activities as compared to less complex cultures, as a result of the intricate interactions among the community members.
While microbial interactions are one of the primary factors shaping the structure, function and dynamics of microbial communities, these are mediated by complex mechanisms [35]. The analysis of interaction mechanisms was outside the scope of this study. However, the mechanisms used by Lactobacillus spp. and Bifidobacterium spp. to produce antimicrobial gastrointestinal activity against pathogenic Salmonella spp. and Clostridium spp. have been suggested to be multifactorial, including mediation by metabolites such as acetic and lactic acid (which modify the pH of the gastrointestinal environment), modification of the oxidation-reduction potential, production of bacteriocin-like inhibitory substances, competitive inhibition of epithelial and mucosal adherence and competition for substrates, among others [67,68,69,70].

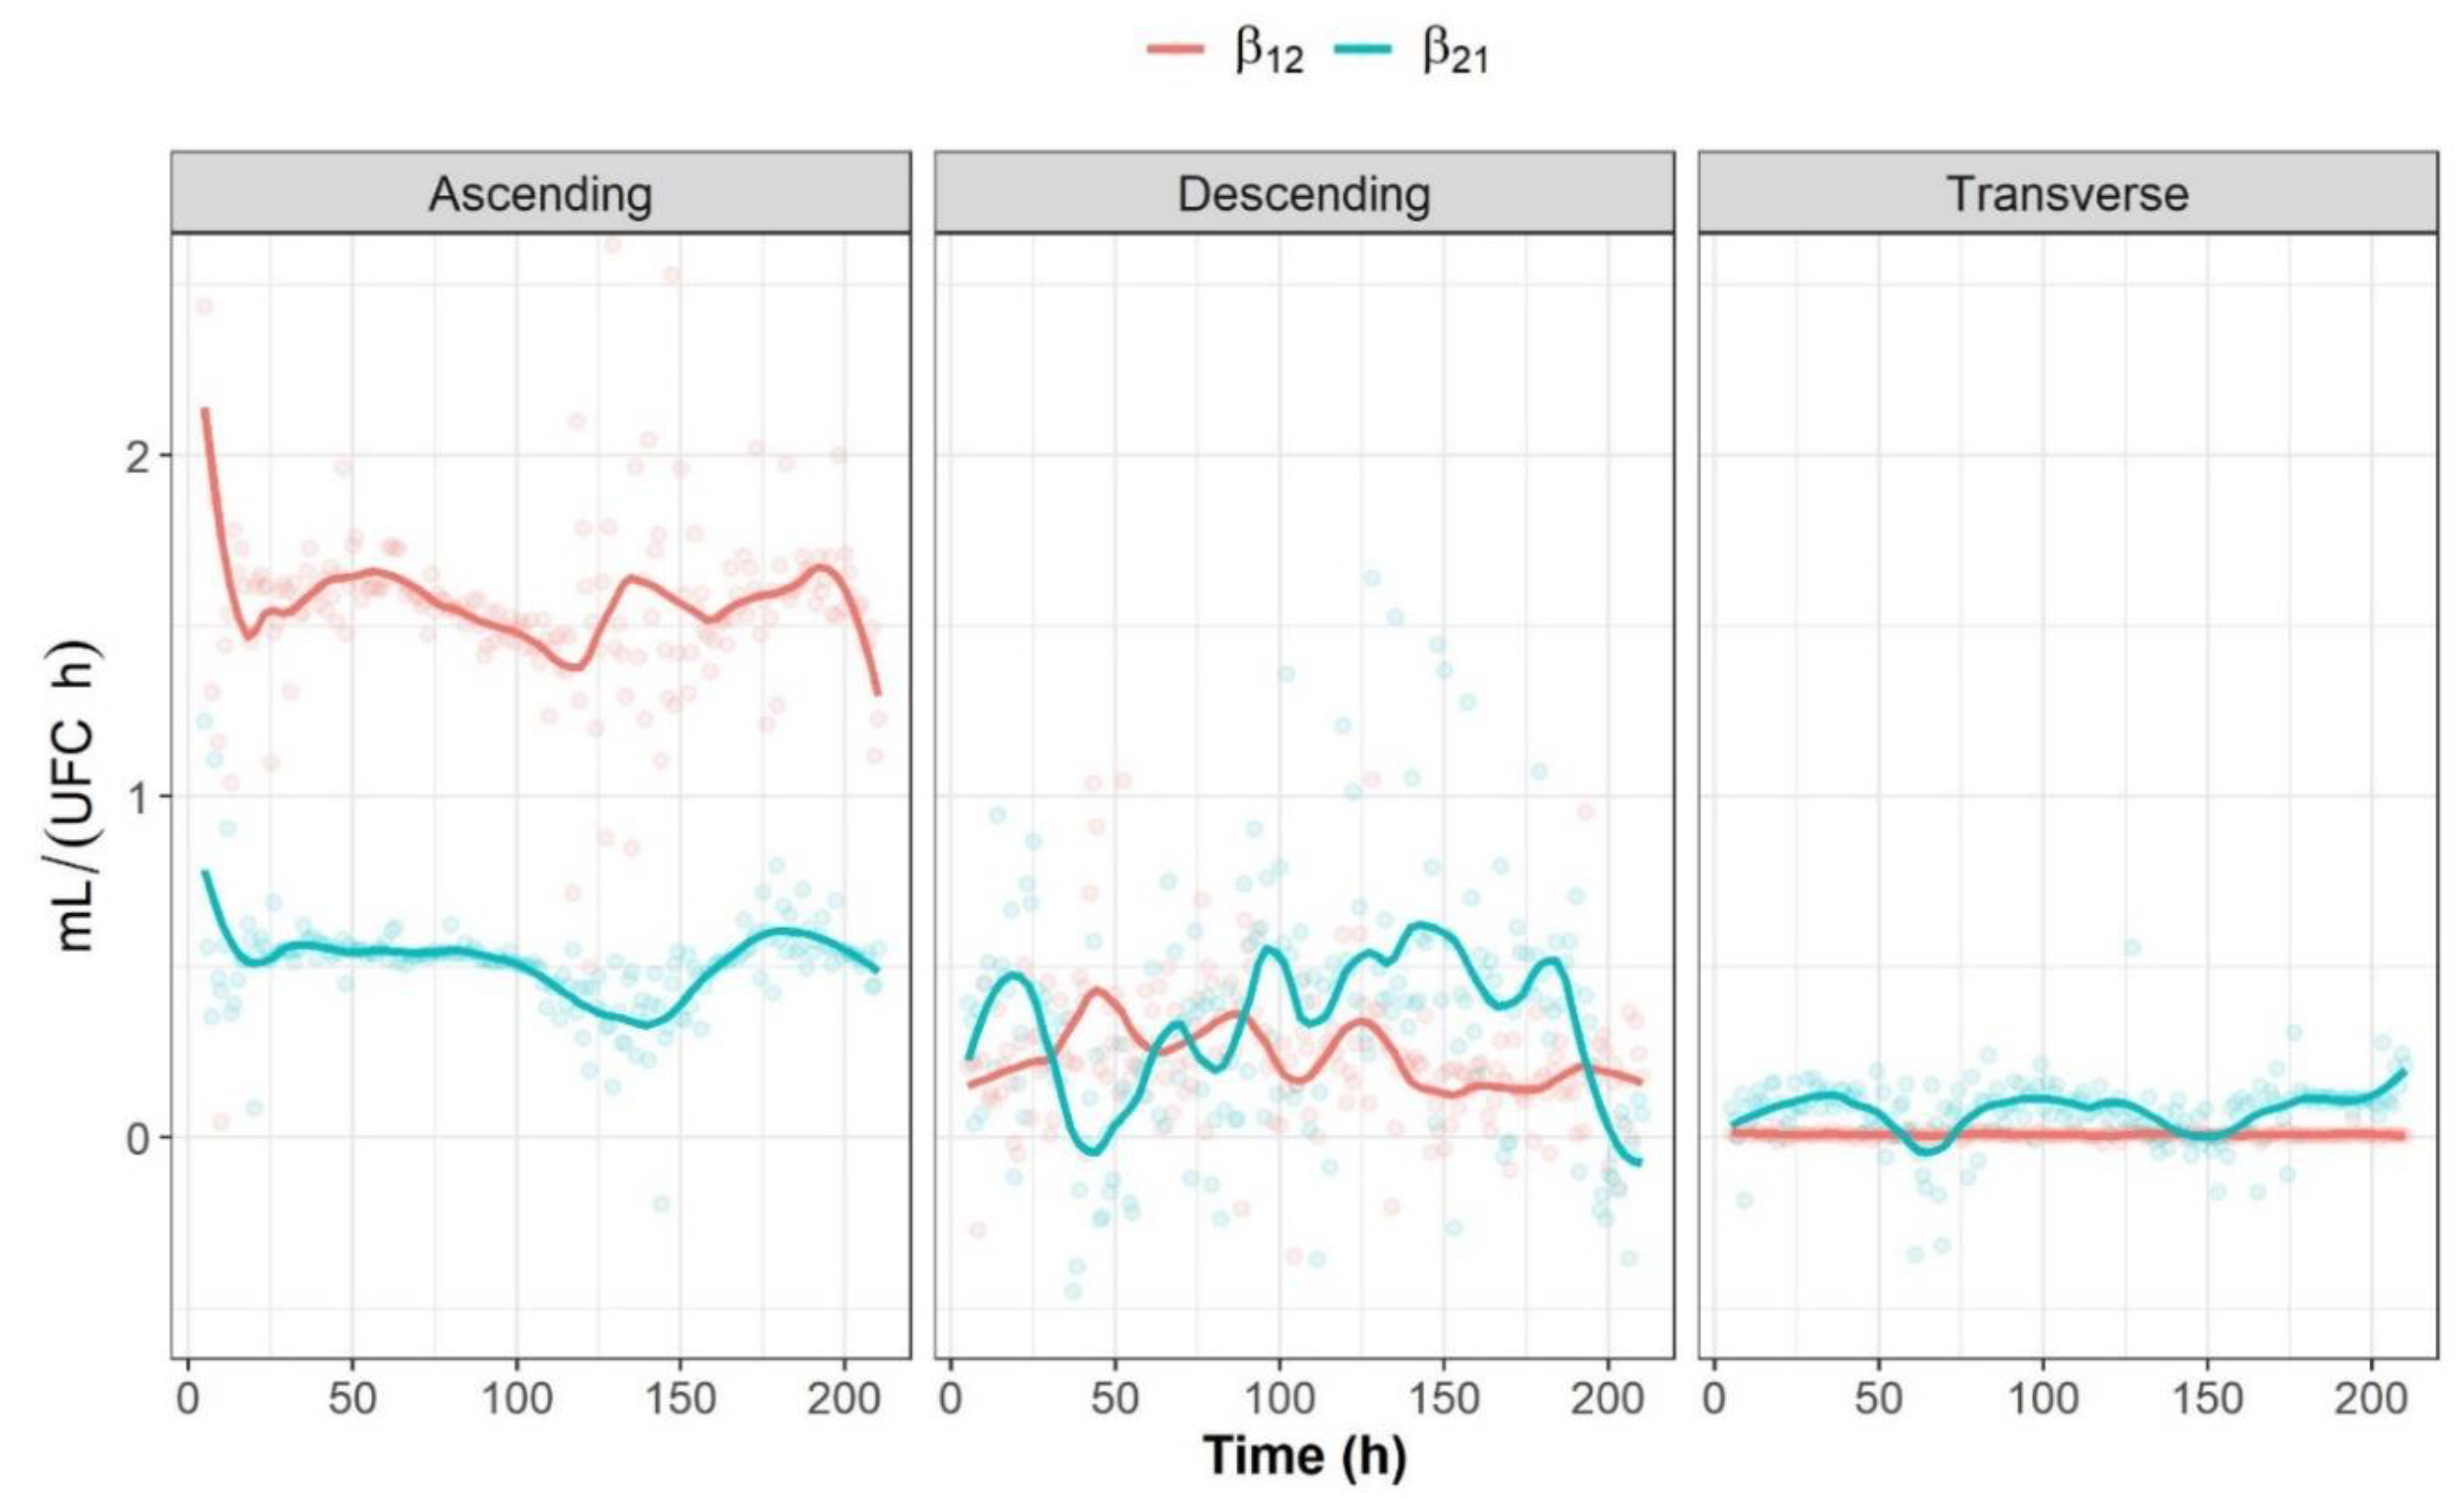
2.3.3. Graphical Representation of Bidirectional Interactions

As an example of a bidirectional interaction, Figure 6 shows the evolution of parameters β12 and β21, which are the interspecific interaction parameters representing the effect of Bifidobacterium spp. on Lactobacillus spp. and the effect of Bifidobacterium spp. on Lactobacillus spp. in the fructan-supplemented system, respectively. Both parameters are generally greater than 0 throughout the full experimental period in all colon sections (β12 and β21 > 0); therefore, there was a mutualistic relationship, although Bifidobacterium spp. was found to have a higher positive impact on Lactobacillus spp. (β12 > β21) in the ascending colon section. The opposite was found for the transverse and descending colons, where Lactobacillus spp. had a higher positive impact on Bifidobacterium spp. (β21 > β12). These findings might be related to the fact that fructan fractions with higher degrees of polymerization are more likely to reach the transverse and descending colon section than fructans with lower degrees of polymerization. It has been suggested that Lactobacillus spp. is useful in increasing substrate availability for Bifidobacterium spp., as the latter displays no degradation of long-chain inulin-type fructans [30].
Figure 7 shows the evolution of the different terms of the nonlinear differential equation that together describe the population dynamics of the Lactobacillus spp. counts over time for each of the analyzed genera and for all colon sections of the fructan-supplemented experimental system. Each of the five terms has a simple and intuitive interpretation: they represent the specific growth of genera i ( α i x i ), the intraspecific interactions ( β i i x i x i ) and the interspecific interactions ( β i j x i x j ). This graphical representation illustrates how the growth dynamics are significantly impacted by microbial interactions.
The specific growth rate was found to have the smallest contribution to the population growth dynamics of Lactobacillus spp. The intraspecific cooperation of Lactobacillus spp. ( β 11 x 1 x 1 ) had a higher contribution to the change in abundance of Lactobacillus spp. than the interspecific cooperation between Lactobacillus spp. and Bifidobacterium spp. ( β 12 x 1 x 2 ) and the interspecific cooperation between Lactobacillus spp. and Salmonella spp. ( β 13 x 1 x 3 ) ( β 11 x 1 x 1 > β 12 x 1 x 2 > β 13 x 1 x 3 ). Additionally, Figure 7 shows the contribution of the antagonistic interaction between Lactobacillus spp. and Clostridium spp. ( β 14 x 1 x 4 ).
d x 1 ( t ) d t = α 1 x 1 ( t ) + β 11 ( x 1 ( t ) ) 2 + β 12 x 1 ( t ) x 2 ( t ) + β 13 x 1 ( t ) x 3 ( t ) + β 14 x 1 ( t ) x 4 ( t )

3. Materials and Methods

3.1. Agave Fructans

Agave fructans from Agave tequilana Weber var. azul (Nutriagaves de México SA de CV, Guadalajara, Mexico) were used in this study. Olifructine is a mixture of 67% fructans with a degree of polymerization of 16% and 23% fructooligosaccharides. The remaining 10% consists of monosaccharides (8%) and disaccharides (2%).

3.2. Conditioning the Experimental System

The gastrointestinal tract simulator ARIS (Automatic and Robotic Intestinal System) was used to examine the microbial interactions (Figure 8). It consists of five reactors representing the different sections of the digestive tract: stomach, small intestine, ascending colon, transverse colon and descending colon [54]. The pH was adjusted before the evaluation and throughout the whole experiment for all five reactors of the system, as previously described by García-Gamboa et al. [54]. The system was conditioned by adjusting the pH in each section with 3-M NaOH or 0.5-M HCL. The temperature was kept at 37 °C, and the vessels were stirred magnetically at 120 rpm.
Fresh fecal microbiota from 20 healthy volunteers between 18 and 55 years of age was inoculated to the ascending, transverse and descending colon sections of the ARIS system. The volunteers had no history of antibiotic treatment within the three months preceding sample collection. Samples were processed and inoculated into each reactor vessel of the colon sections, as previously described by García-Gamboa et al. [54]. Since the microbial community had to differentiate in each colon section according to its environmental conditions, a two-week stabilization period was allowed after inoculation [54].
Reactor volumes and residence times in each section were established according to human physiology [27,44,54,71]. All conditions are shown in Figure 8.
The stability of the various compartments was maintained throughout the whole experiment. Heating plates were used to keep all vessels at a constant 37 °C, and agitation was carried out using magnetic stirring. The stomach section was continuously stirred at 120 rpm, and pH was adjusted to a range of 2.0–2.5. For the small intestine, the pH was adjusted to 5.0–5.5 and continuously stirred at 60 rpm. For the three following sections (ascending colon, transverse colon and descending colon), pH was adjusted to the ranges of 5.5–6.0, 6.0–6.5 and 6.5, respectively. Stirring in these sections was at 120 rpm. [54,71,72,73].

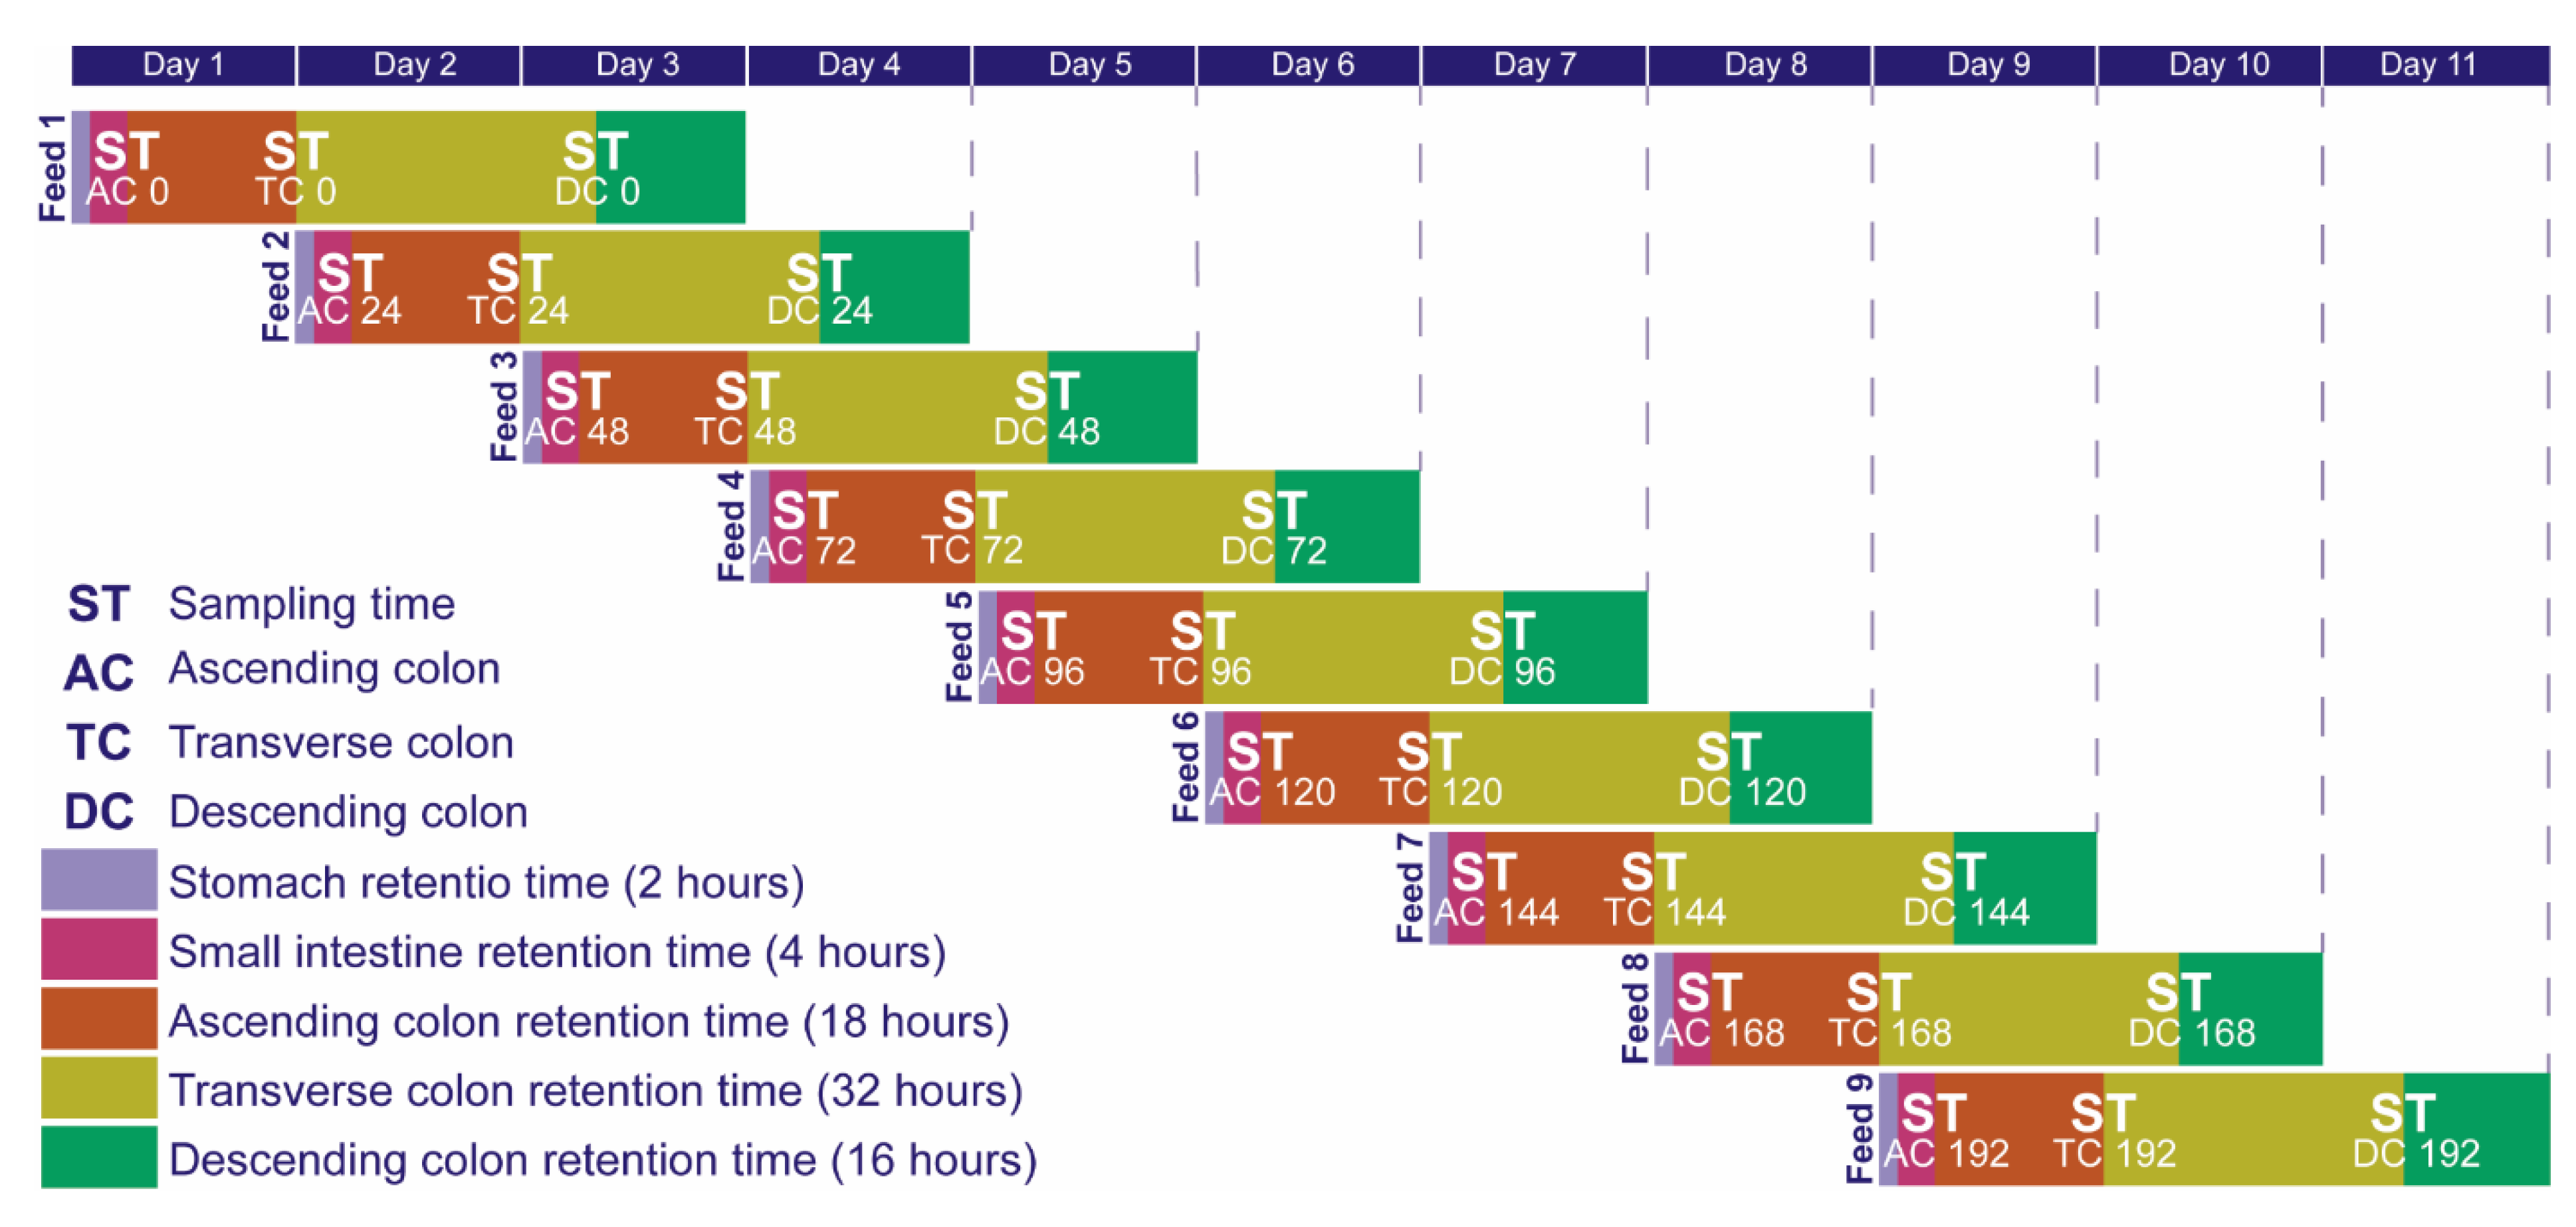
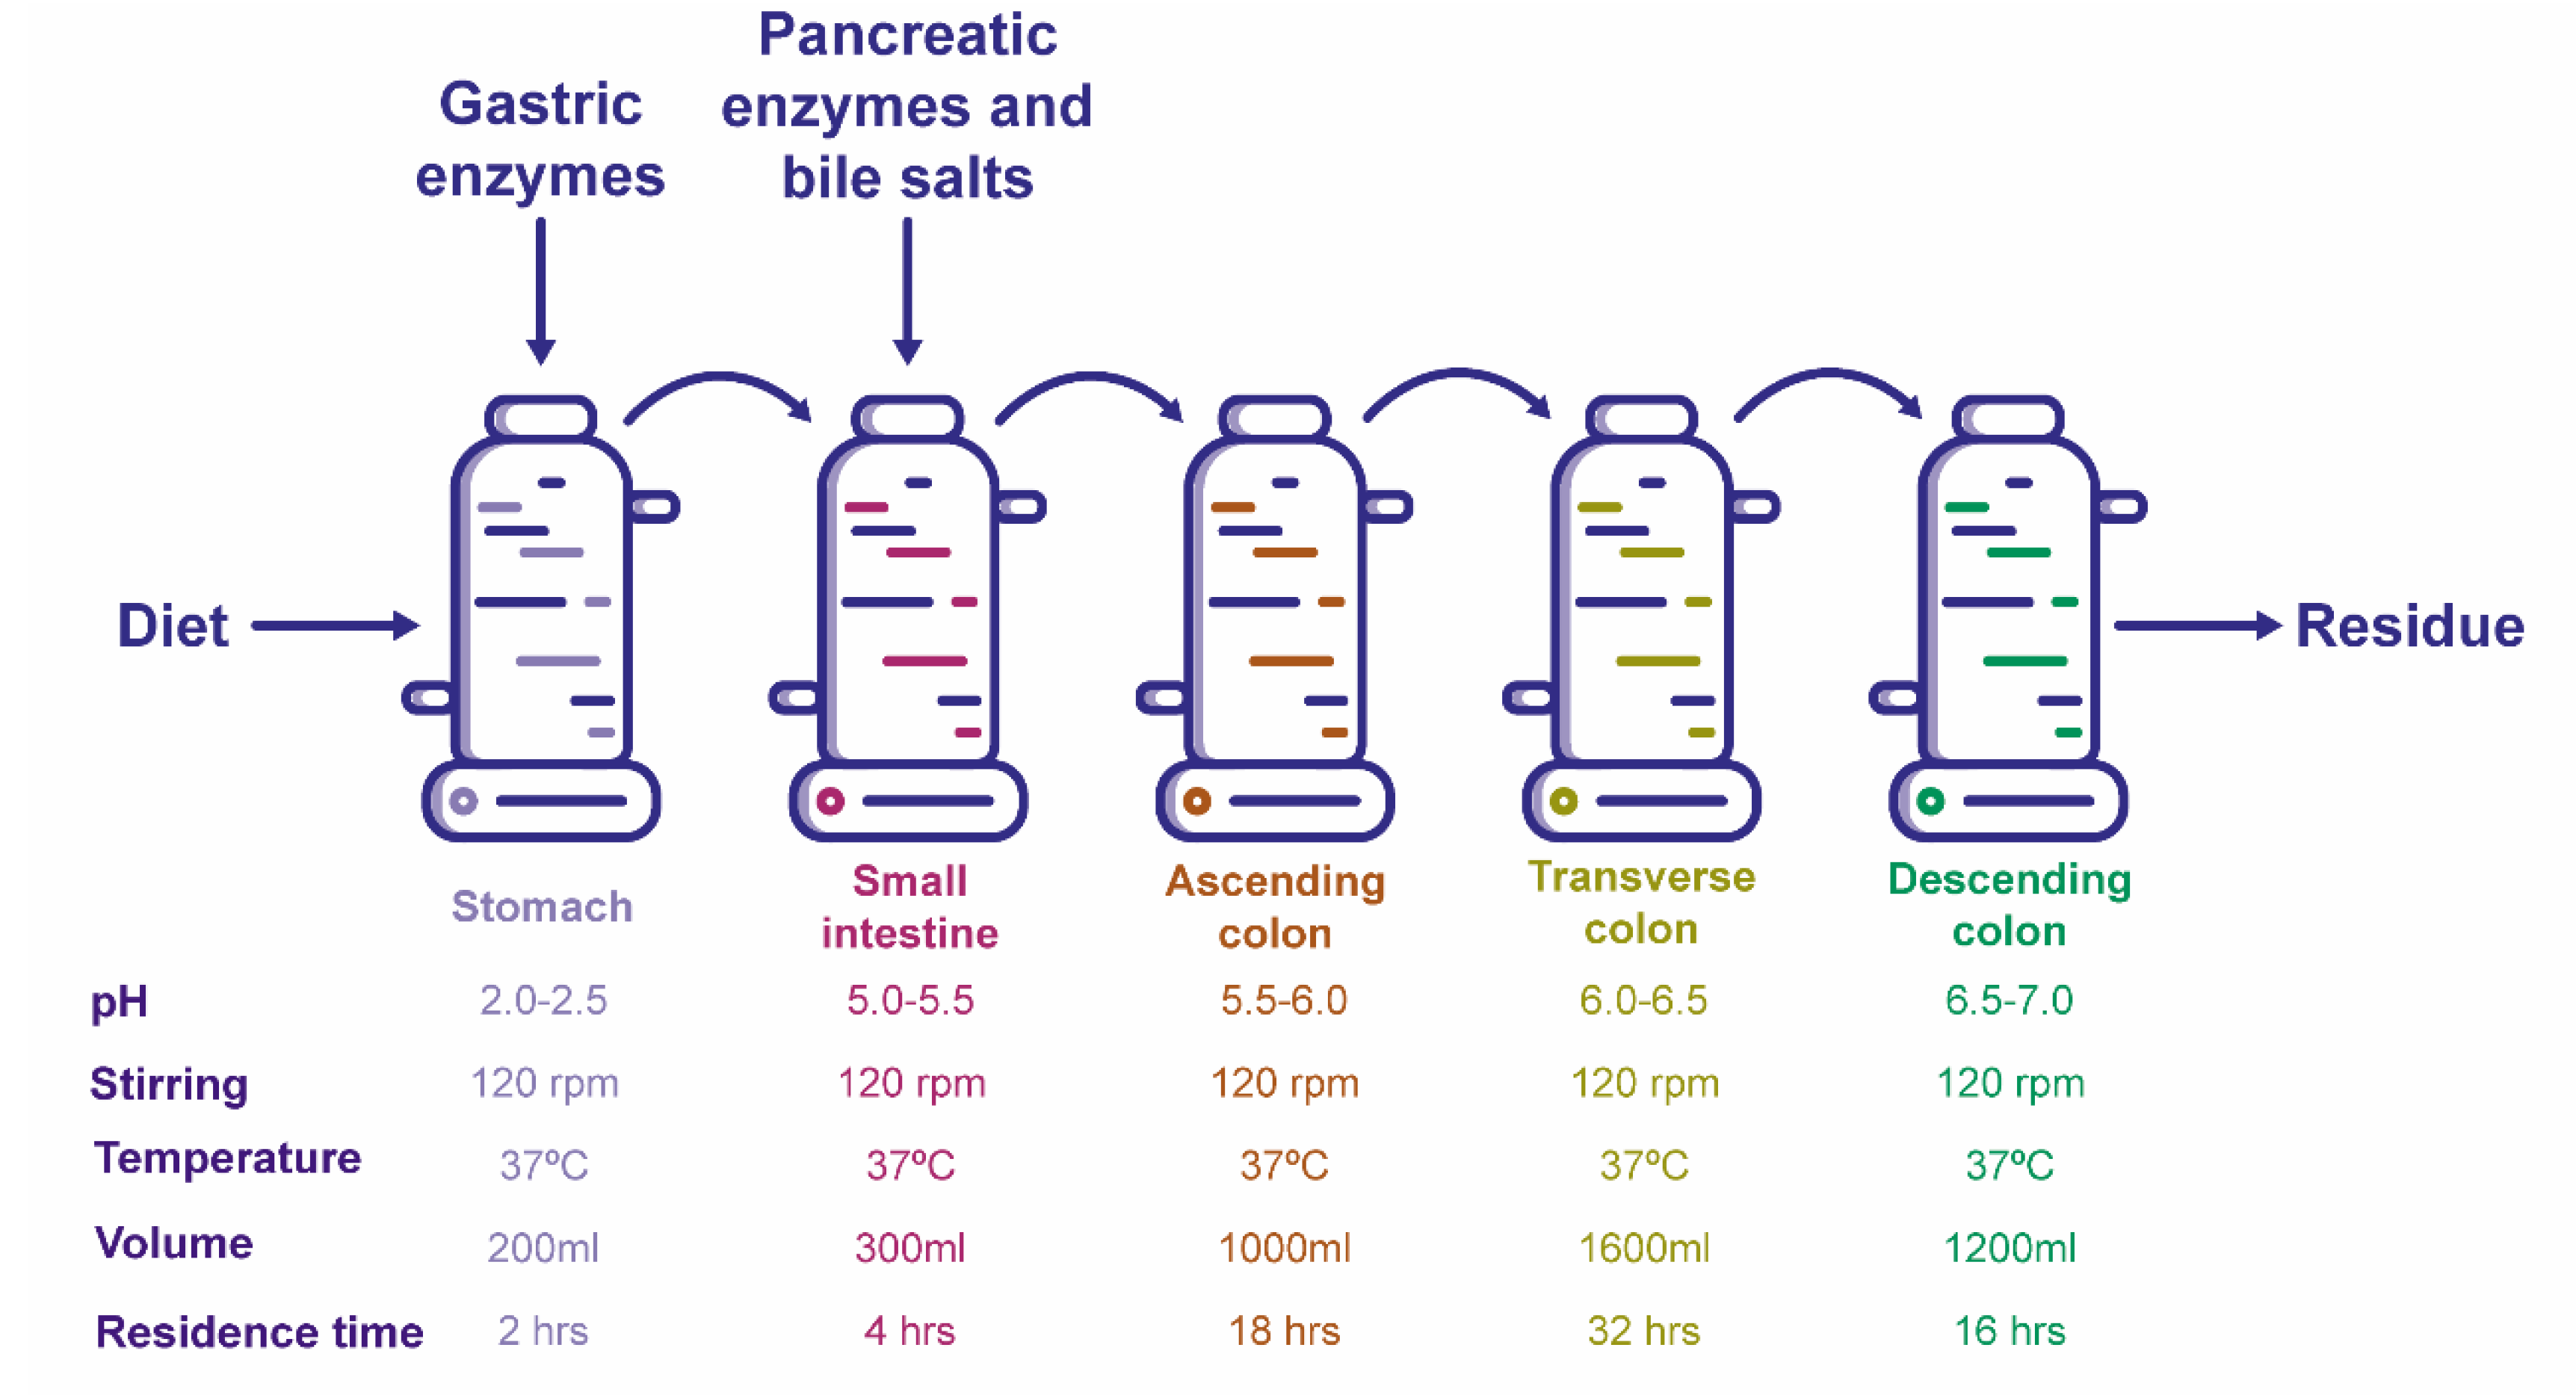
3.3. Ex-Vivo Simulations

To evaluate the within-run reproducibility, as well as the between-run repeatability of the ARIS system, two runs (biological replicates) fed with a standard diet (200 mL/day; control system) and two more runs fed with the standard diet supplemented with agave fructans (1 g/day; fructan-supplemented system) were carried out in parallel in four twin systems, and all plate counts were performed in triplicate (technical replicates). To ensure the results would be comparable across the four different runs, reactors were inoculated with bacteria from the same fecal sample, respectively (ascending colon, transverse colon and descending colon), and initial counts were carried out to establish comparable initial conditions.
The composition of the standard diet was 65% carbohydrates (50% sucrose and 50% corn starch), 15% protein (casein peptone) and 20% lipids (corn oil), as previously reported by García-Gamboa et al. [54].
Both the control system and the fructan-supplemented system were fed every 24 h. Both the standard diet (in the case of the control system) and the standard diet supplemented with fructans (for the experimental system) were fed to the stomach reactor together with a pepsin solution (0.33-g porcine gastric enzyme/200-mL feed; Sigma-Aldrich, St. Louis, MO, USA) to start the digestion process in the stomach; there, the sample was continually stirred for two hours. When the digestion in the stomach was completed, its contents were fed to the small intestine reactor together with 100 mL of a solution of pancreatic enzyme mixture (0.0001-g lipase/200-mL feed and 0.19-g protease/200-mL feed; Sigma Aldrich, St. Louis, MO, USA) and 1 g of bile salts extract/200-mL feed (Sigma Aldrich, St. Louis, MO, USA). The mixture was stirred for 4 h. Afterward, the contents of the small intestine were administered to the colon sections. The complete digestion lasted 72 h [38]. Nine complete digestions were carried out for each experimental run. The reactors—the ascending, transverse and descending colon sections—were kept on a fed-batch regime, since the feed was added to each fermenter every 24 h throughout the whole fermentation process. Every 24 h, 300 mL of the culture suspension were removed. The volumes of these reactors were kept constant throughout the whole experiment, as the amount of feed was equal to the effluent (300 mL). Samples were taken every 24 h from the ascending, transverse and descending colons for 216 h (9 days) just before each reactor was fed. The entire experiment lasted 11 days. The sampling procedure is shown in Figure 9.
The gut microbiota subsystem that was analyzed consisted of four microbial genera; therefore, there are four time series vectors (×1, ×2, ×3 and ×4), each with a length of 10 values, resulting from the growth experiments for each colonic section and for both the control system and the fructan-supplemented system. In total, 24 vectors were obtained. The colony-forming units (CFU) of bacteria of the genera Lactobacillus spp., Bifidobacterium spp., Salmonella spp. and Clostridium spp. were quantified by doing plate counts. Selective or differential medium was used for all cases, as previously reported by García-Gamboa et al. [38]. In the case of Lactobacillus spp., bacterial counts were done using DeMan, Rogosa and Sharpe (MRS) media (BIOXON) (24 h, microaerophilic). For Bifidobacterium spp. counts, selective medium was used (BSM) (Sigma Aldrich) (48 h, anaerobic). In the case of Salmonella spp., the medium used was lysine iron agar (LIA) (Sigma Aldrich) (24 h, microaerophilic). Finally, tryptose Sulfite cycloserine (TSC) (Sigma Aldrich) was used for Clostridium spp. (48 h, anaerobic). Each plate count was performed in triplicate, and the mean value of six measurements (three replicates for each of the duplicate fermentations) was reported.

3.4. Analysis of Microbial Interactions

This section describes the procedure for applying a DNN for the nonparametric identification of the gLV model for the microbial genera. First, the class of nonparametric continuous nonlinear system is presented. Then, the common DNN identifier structure depending on an adaptation law is given, in order to obtain an approximation of the state x ^ ( t ) (the populations at time t) and its respective derivative d x ^ ( t ) d t (the growth rate or dynamic behavior). The gLV model is then considered to describe the microbial dynamics by means of a set of interaction coefficients that are estimated using the Nelder-Mead optimization algorithm.

3.4.1. General Dynamic System Structure for the Dynamic Microbiota

For the nonparametric identification of the dynamic microbial interactions, the gut microbiota subsystem was represented by the general class of continuous nonlinear systems, set out by the following set of ordinary differential equations:
d x ( t ) d t = f ( x ( t ) ,   u ( t ) ) + ξ ( t ) y ( t ) = C x ( t ) + η ( t )
With a given initial condition x ( t 0 ) and where x ( t ) ϵ n is the state vector at time t t 0 , for our case, x ( t ) ϵ 4 with components, x 1 ( t ) = Lactobacillus spp. abundance, x 2 ( t ) = Bifidobacterium spp. abundance, x 3 ( t ) = Salmonella spp. abundance and x 4 ( t ) = Clostridium spp. abundance, at current time t . For the general case (fed-batch and continuous configurations), u ( t ) ϵ r ( r n ) is the input vector and belongs to the admissible set U a d m = { u ( t ) : u ( t ) Υ u < } . In the case reported in this study, the experimental set-up corresponds to a batch culture, where no input-output flow was considered; as has been explained, the volume was kept constant, as the feed was equal to the effluent (300 mL) exclusively at t 0 at the feed time of each section according to the procedure set out in Figure 8. For that reason, we have set u ( t ) 0     t , considering measurable the initial conditions of state vector x ( t 0 ) . The ξ ( t ) ϵ n is an additive bounded vector of deterministic noise affecting the state vector. y ( t ) ϵ m is the system output, with known matrix C ϵ m × n defining the state-output transformation, and η ( t ) ϵ m is an additive noise affecting the output. In the case of the nonparametric identification of this system, the full state vector was available after the experiment; then, C = I ϵ 4 × 4 , where I is the identity matrix.

3.4.2. Nonparametric System Identification of the Dynamic Microbial Behavior by a Differential Neural Network

Nonparametric identification by a differential neural network approach implies that the right-hand side f ( x ( t ) ,   u ( t ) ) of the nonlinear dynamic system (Equation (3)) can be approximated by f ¯ ( x ( t ) ,   u ( t ) | W ( t ) ) , where f ϵ ¯ n defines the approximation mapping depending on the time-varying parameters W ( t ) (weights), which must be adjusted by a concrete adaptation law. This approximation of f ¯ ( x ( t ) ,   u ( t ) | W ( t ) ) involves two parts: the first one is approximated by a Hurwitz matrix, A ϵ n × n , with constant components, and W 1 ( t ) σ ( x ( t ) ) are variable time parameters, W 1 ( t ) , with sigmoid multipliers σ ( x ( t ) ) ; and the second part is approximated by variable time parameters, W 2 ( t ) ; with multipliers, φ ( x ( t ) ) [45], this is:
f ¯ ( x ( t ) ,   u ( t ) | W 1 , 2 ( t ) ) A x ( t ) + W 1 ( t ) σ ( x ( t ) ) + W 2 ( t ) φ ( x ( t ) ) u ( t )
where A ϵ n × n , W 1 ( t ) ϵ n × p , σ ( ) ϵ p × 1 , W 2 ( t ) ϵ n × q and φ ( ) ϵ q × r . The activation vector function σ ( ) and matrix-function φ ( ) are usually selected as functions with sigmoid-type components; however, different families of orthogonal functions can be considered. The constant parameters A , as well as the time-varying parameters W i ( t ) ,   i = 1 , 2 , should be properly adjusted to guarantee a correct state approximation. For the case of our experimental setup (batch), considering u ( t ) 0 and x ^ ( t ) ϵ 4 ,   the DNN identifier has the following structure:
d x ^ ( t ) d t = f ¯ ( x ^ ( t ) , | W 1 ( t ) ) = A x ^ ( t ) + W 1 ( t ) σ ( x ^ ( t ) )
where x ^ ( t ) ϵ 4 is the identified state vector, where each element is the identification of the current abundance at time t for each microorganism. Matrix, W 1 ( t ) , provides the adaptation of the nominal dynamics and is given by the solution of the following set of differential equations (adaptation law). Such a structure is derived by the stability analysis of identification error [74].
W ˙ 1 ( t ) = ( 2 k ) 1 P Ω 1 ( x ^ ( t ) , x ^ ( t h ( t ) ) ) σ ( x ^ ( t ) ) + ( 2 k ) 1 W ^ 1 ( t ) Ω 1 ( x ^ ( t ) , x ^ ( t h ( t ) ) ) = 2 δ ( t h ( t ) ) + W ^ 1 ( t )   σ ( x ^ ( t ) )
where δ ( t ) x ^ ( t ) x ( t ) is the identification error, W ^ 1 ( t ) = W 1 ( t ) W ^ 1 , for a given constant W ^ 1 , the adaptation rates k > 0 ϵ and P ϵ n × n ,   P = P .

3.4.3. Study of Microbial Interactions with Generalized Lotka-Volterrra Model

The generalized Lotka-Volterra model Equation (7) was used to model the changes of genera abundances over time, as its structure makes it possible to analyze microbial community interactions.
d x i ( t ) d t = x i ( t ) ( α i + j = 1 n β i j x j ( t ) )
The αi coefficients denote the taxon-specific growth rate functions of genus i in the absence of the effects of other microbial genera. The βii coefficients express the impacts of genera i on other members of the same genera. The βij impact coefficients express the impact of genus j on genus i (between genera), thus representing the impact of the presence of one genus on the growth of another [75]. The set of coefficients ( α i , β i j ) were derived from the experimental data, following the approach implemented by Gradilla-Hernández et al. [49].

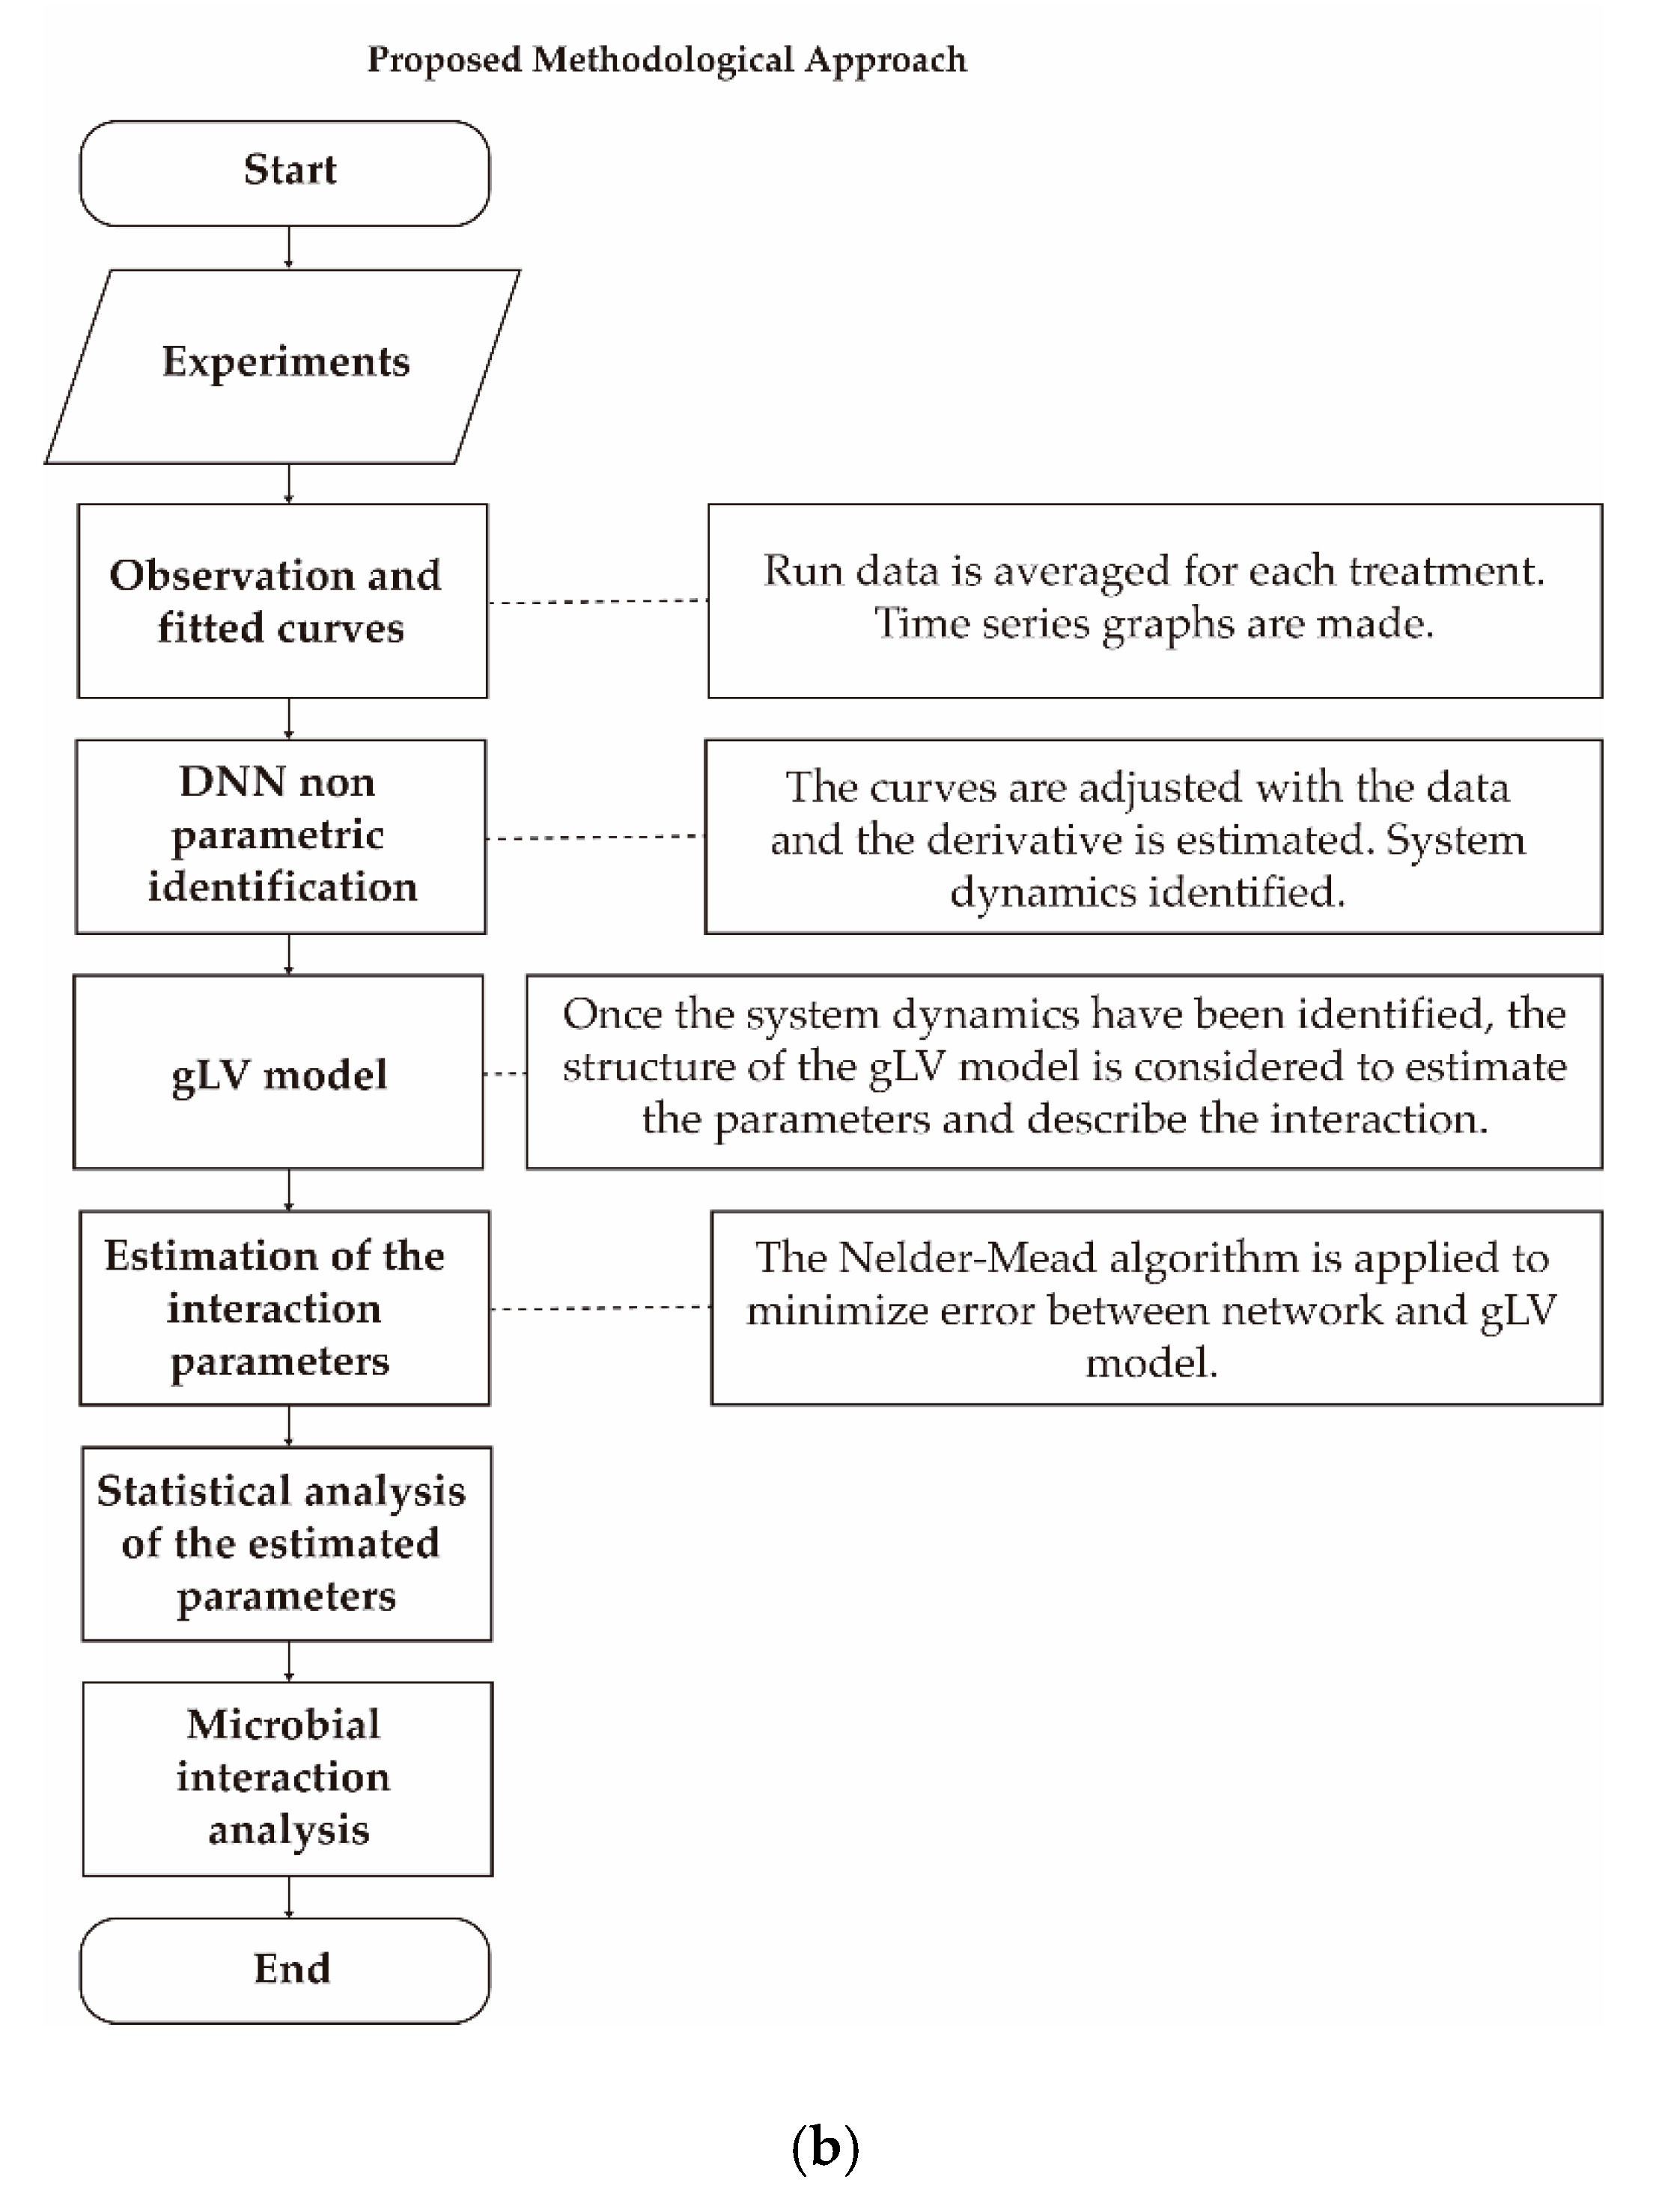
3.4.4. Identification of the gLV Model Parameters Applying the DNN Identifier and the Nelder-Mead Optimization Algorithm

Experimental time series representing the genera abundances were used for the DNN identification. After the process given by Equation (5) and the adaptation law given by Equation (4), the following set of differential equations representing the dynamic change of abundances were obtained:
d x ^ ( t ) d t = f ¯ ( x ^ ( t ) , | W 1 ( t ) ) .
As can be seen, the gLV model satisfies the general dynamic system structure set out by Equation (1); considering u ( t ) 0 and noise absence ξ ( t ) = 0 , this is:
f ( x ( t ) ) = x i ( t ) ( α i + j = 1 n β i j x j ( t ) )
In order to obtain the set of parameters ( α i , β i j ) , the following optimization problem was set:
k * = arg m i n α i , β i j f ¯ ( x ^ ( t ) , | W 1 ( t ) ) f ( x ( t ) ) 2 2
where k * is the vector of the estimated parameters. To solve the optimization problem, the Nelder-Mead algorithm was applied. This algorithm has been widely used to solve parameter estimation problems, since it minimizes a nonlinear function of n variables. It has proved to be a robust method with respect to the local minima and has reasonable convergence speed [76,77].

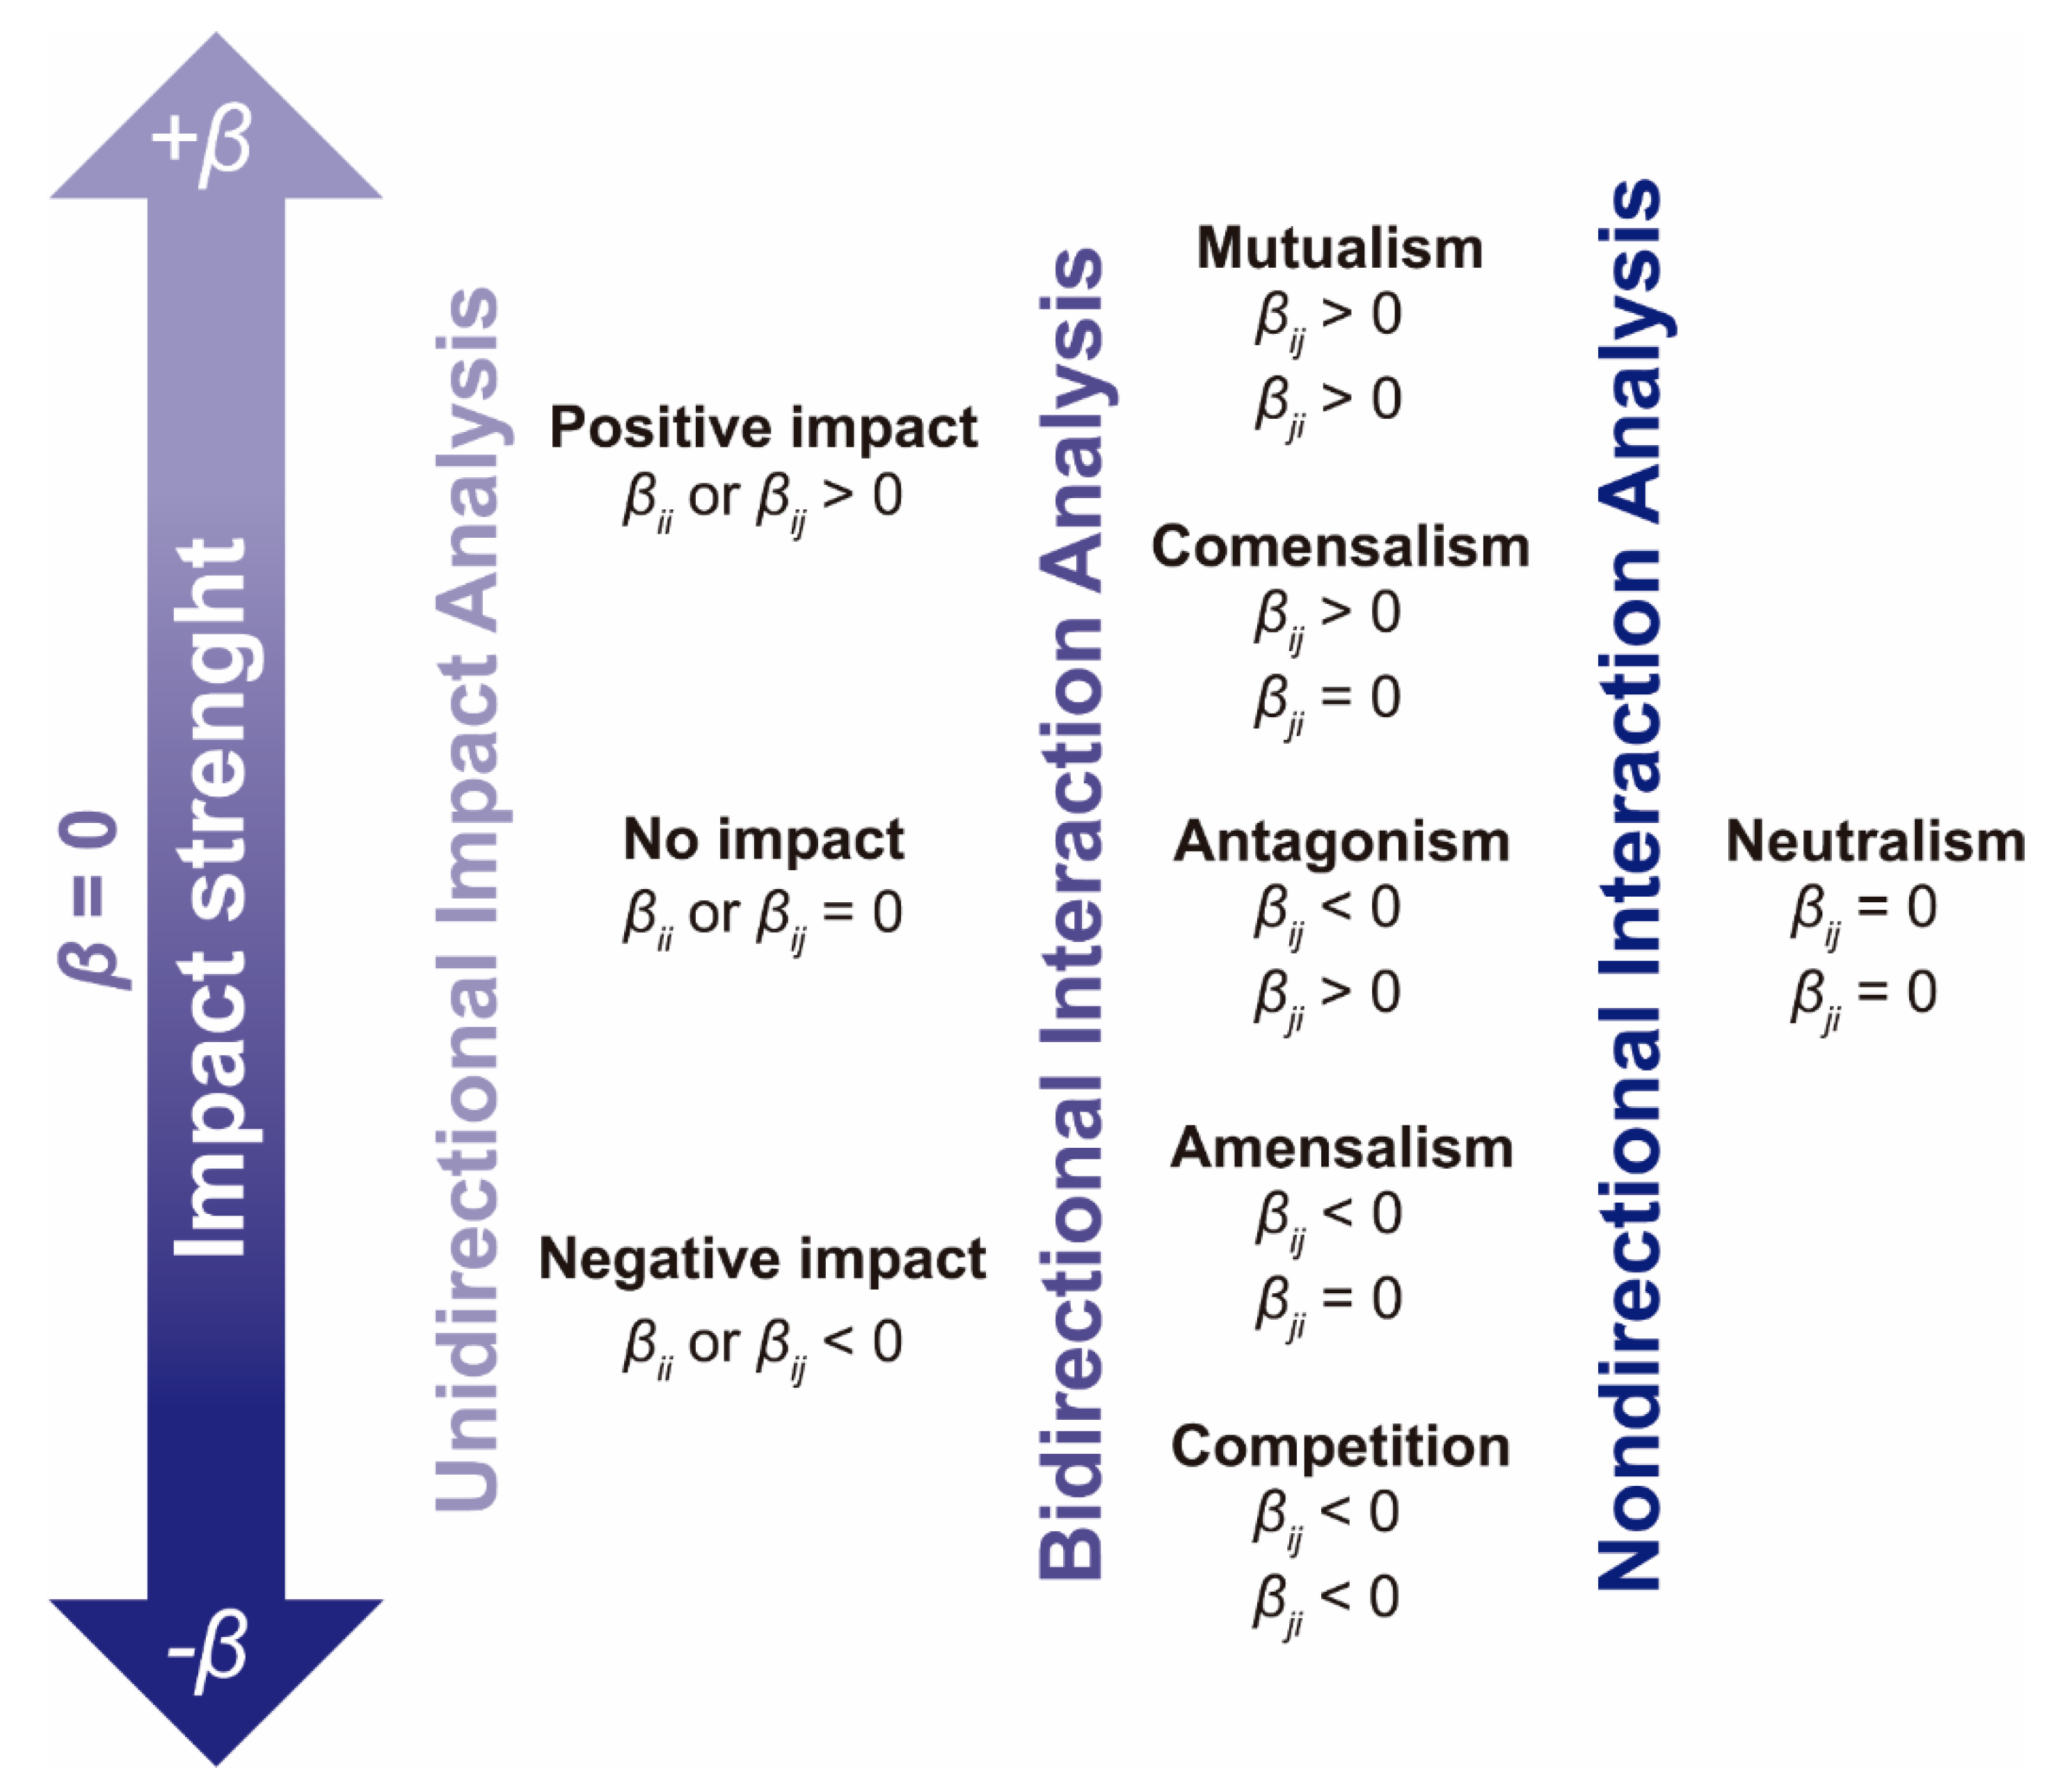
3.4.5. Unidirectional Impact Analysis

The gLV model coefficients were estimated for both the control system and the fructan-supplemented system for each of the colon sections. This method allowed for the quantification of unidirectional microbial impacts that describe community dynamics. These interaction coefficients characterize the impact of genera j on i. Specifically, βij > 0 stands for stimulation, and βij < 0 stands for inhibition [75]. A neutral or negligible impact is indicated by βij = 0. In this study, whenever the βij mean values were below 0.1 in the absolute value, the impact was regarded as neutral.

3.4.6. Bidirectional Interaction Analysis

Mutual impacts—βij and βij—were analyzed in conjunction in order to determine the types of bidirectional interaction occurring in the mixed culture (mutualism, competition, commensalism, amensalism or antagonism). Whenever the mean values of βij and βji were both below 0.1 (in the absolute value), the relationship was regarded as neutralism (0/0). Conversely, if only one of these coefficients was higher than 0.1 (in absolute value) and the other one was below 0.1 (in absolute value), the association was regarded as unidirectional: (commensalism +/0 or amensalism −/0). If both βij and βij were higher than 0.1 (in absolute value), the interaction was regarded as bidirectional, and the average difference between coefficients βij and βij was used to determine which of the genus benefitted the most from a mutualistic (+/+) relationship or was most affected by a competitive (−/−) relationship. Finally, if an antagonistic (+/−) interaction was found (βij > 0 and βji < 0 or vice versa), the genus that received the impact of greatest strength was identified. Figure 10 synthesizes the analysis performed for unidirectional impacts and bidirectional interactions.

3.4.7. Statistical Analysis

Time paired t-tests were performed at two different moments during the overall analysis. First, plate counts were compared between the fructan-supplemented system and the control system for each genus and each colon section, and boxplots were used to visualize this comparison. Then, bidirectional microbial interactions were compared using the βij and βji time-paired values (i, j = 1,2,3,4 Ij) for all genera. These coefficients were directly compared given that they multiply the same population species functions (xi(t) and xj(t)). To compare these time paired values, a t-test was performed assuming that the means of βij and βji were equal. The difference Dij = βijβji at each time was calculated, and Dij was assumed to be a random variable normally distributed with mean 0. The hypothesis about this mean value was then tested using a one-sample t-test.
MATLAB R2019a was used to fit the growth curve for each genus (using the Curve Fitting toolbox), as well as to develop the DNN algorithm (using the Simulink toolbox) and to estimate interaction parameters (using the fminsearch function). The statistical analysis was performed using R version 3.6.2 and RStudio version 1.2.5033 (using the RcmdrMisc, dplyr, ggplot2 and tidyverse packages). A personal computer (Intel i7-4500 CPU at 2.4 GHz, RAM 8GB) was used.
In order to reach the numerical solution of the system involved in the DNN identifier Equations (3) and (4), the Runge-Kutta 4th order method was used, with a fixed step of size 0.001. The nonparametric identification of the system took on average two minutes for each colon section of the control and the fructan-supplemented system (giving a total of 6 DNN identifiers). For optimization, it took about 8 h for each of the 6 colon section-control system and colon section-fructan-supplemented system combinations. The time interval from 0.5 to 21 h was subdivided into 204 subintervals of length 0.1 in order to estimate the parameters at each moment in time. Figure 11 summarizes the complete experimental set-up and modeling approach for examining microbial interactions.

4. Conclusions

In this study, a novel strategy to characterize microbial community dynamics was proposed. The growth kinetics of four representative human gut genera were followed as a subsample of the gut microbiota, and their interactions were examined under controlled conditions in a gastrointestinal gut simulator. The strategy proposed here, combining a nonparametric system identification and an optimization technique, was applied satisfactorily to gain quantitative and qualitative knowledge of a broad spectrum of microbial interactions in the gut community, as described by the gLV model. Furthermore, this strategy makes it possible to ascertain that microbial interactions were modulated when agave fructans were administered.
This strategy for parameter estimation may be further used to gain knowledge of microbial interactions in mixed cultures—using the gLV model or other microbial interaction models and experimental approaches—as this information is crucial for optimizing mixed microbial cultures to perform certain processes, such as environmental bioremediation or modulation of gut microbiota, and to predict their dynamics.
Further studies using this strategy should also focus on the quantification of microbial abundances and metabolites and the application of mechanistic models based on material balances, like the Chemostat equations, which account for the underlying interaction mechanisms and describe more complex dynamic behavior. Additionally, the strategy proposed here could be used to estimate the parameters of metabolic models (e.g., specific growth rate or reaction rate constants).
This study analyzed the dynamics of a subsample of the human gut microbiota, as it is difficult to track each member of the community in fecal samples. While these genera are representative of gut microbiota, the dynamics of other important populations within the community were not observed. Additionally, this study worked at genera-level, and there is still a need to account for behavior at the species-level. Further efforts should use similar ex vivo approaches to fit the gLV model or other mathematical models for high-resolution time-series sequencing data and to investigate the dynamics of the gut microbial community in its entirety. Alternatively, future research should use similar strategies to examine microbial interactions within simpler communities of known composition created from monocultures using representative members of the colonic microbial community to gain more knowledge about the metabolic interactions of gut populations and how they shape the dynamics of the entire community.

Author Contributions

Conceptualization, M.S.G.-H. and A.G.-G.; methodology, M.S.G.-H., A.G.-G., M.G.-A., R.G.-G.; software, M.S.G.-H. and C.Y.M.; validation, A.G.-G., R.Q.F.-A., E.J.H.-L. and A.G.; formal analysis, M.S.G.-H., A.G.-G., E.J.H.-L. and A.G.; investigation, M.S.G.-H. and R.G.-G.; resources, A.G.-G., M.G.-A. and A.G.; data curation, M.S.G.-H., A.G.-G. and C.Y.M.; writing—original draft preparation, M.S.G.-H. and A.G.-G.; writing—review and editing,. M.S.G.-H., A.G.-G. and R.Q.F.-A.; visualization, M.S.G.-H., A.G.-G. and C.Y.M.; supervision, A.G.-G., E.J.H.-L. and A.G.; project administration, M.S.G.-H. and A.G.-G. All authors have read and agreed to the published version of the manuscript.

Funding

This research received no external funding.

Acknowledgments

The authors acknowledge the technical support of Diego Diaz, Gary Lara, Alberto Fernández del Castillo, Marycarmen Verduzco and Omar Perez and the administrative support from Instituto Tecnológico y de Estudios Superiores de Monterrey campus Guadalajara and Centro de Investigación y Asistencia en Tecnología y Diseño del Estado de Jalisco.

Conflicts of Interest

The authors declare no conflict of interest.

References

  1. Garcia, S.L. Mixed cultures as model communities: Hunting for ubiquitous microorganisms, their partners, and interactions. Aquat. Microb. Ecol. 2016, 77, 79–85. [Google Scholar] [CrossRef]
  2. Brenner, K.; You, L.; Arnold, F.H. Engineering microbial consortia: A new frontier in synthetic biology. Trends Biotechnol. 2008, 26, 483–489. [Google Scholar] [CrossRef] [PubMed]
  3. Kleerebezem, R.; Van Loosdrecht, M.C. Mixed culture biotechnology for bioenergy production. Curr. Opin. Biotechnol. 2007, 18, 207–212. [Google Scholar] [CrossRef] [PubMed]
  4. Smid, E.J.; Lacroix, C. Microbe–microbe interactions in mixed culture food fermentations. Curr. Opin. Biotechnol. 2013, 24, 148–154. [Google Scholar] [CrossRef] [PubMed]
  5. Kho, Z.Y.; Lal, S.K. The Human Gut Microbiome—A Potential Controller of Wellness and Disease. Front. Microbiol. 2018, 9. [Google Scholar] [CrossRef] [PubMed] [Green Version]
  6. Cordero, O.X.; Datta, M.S. Microbial interactions and community assembly at microscales. Curr. Opin. Microbiol. 2016, 31, 227–234. [Google Scholar] [CrossRef] [Green Version]
  7. Song, H.-S.; Cannon, W.R.; Beliaev, A.S.; Konopka, A. Mathematical Modeling of Microbial Community Dynamics: A Methodological Review. Processes 2014, 2, 711–752. [Google Scholar] [CrossRef] [Green Version]
  8. Faust, K.; Raes, J. Microbial interactions: From networks to models. Nat. Rev. Microbiol. 2012, 10, 538–550. [Google Scholar] [CrossRef]
  9. Ivey, M.; Massel, M.; Phister, T.G. Microbial Interactions in Food Fermentations. Annu. Rev. Food Sci. Technol. 2013, 4, 141–162. [Google Scholar] [CrossRef]
  10. Kedia, G.; Wang, R.; Patel, H.; Pandiella, S.S. Use of mixed cultures for the fermentation of cereal-based substrates with potential probiotic properties. Process Biochem. 2007, 42, 65–70. [Google Scholar] [CrossRef]
  11. Sieuwerts, S.; Bok, F.A.M.; De Hugenholtz, J.; Vlieg, J.E.T.; Van Hylckama Vlieg, J.E. Unraveling Microbial Interactions in Food Fermentations: From Classical to Genomics Approaches. Appl. Environ. Microbiol. 2008, 74, 4997–5007. [Google Scholar] [CrossRef] [PubMed] [Green Version]
  12. Faust, K.; Lahti, L.; Gonze, D.; de Vos, W.M.; Raes, J. Metagenomics meets time series analysis: Unraveling microbial community dynamics. Curr. Opin. Microbiol. 2015, 25, 56–66. [Google Scholar] [CrossRef] [PubMed] [Green Version]
  13. Donaldson, G.P.; Lee, S.M.; Mazmanian, S.K. Gut biogeography of the bacterial microbiota. Nat. Rev. Microbiol. 2016, 14, 20–32. [Google Scholar] [CrossRef] [PubMed] [Green Version]
  14. Falony, G.; Vandeputte, D.; Caenepeel, C.; Vieira-Silva, S.; Daryoush, T.; Vermeire, S.; Raes, J. The human microbiome in health and disease: Hype or hope. Acta Clin. Belg. 2019, 74, 53–64. [Google Scholar] [CrossRef] [Green Version]
  15. Gentile, C.L.; Weir, T.L. The gut microbiota at the intersection of diet and human health. Science 2018, 362, 776–780. [Google Scholar] [CrossRef] [Green Version]
  16. Jakobsson, H.E.; Rodríguez-Piñeiro, A.M.; Schütte, A.; Ermund, A.; Boysen, P.; Bemark, M.; Sommer, F.; Bäckhed, F.; Hansson, G.C.; Johansson, M.E. The composition of the gut microbiota shapes the colon mucus barrier. EMBO Rep. 2015, 16, 164–177. [Google Scholar] [CrossRef]
  17. Dieterich, W.; Schink, M.; Zopf, Y. Microbiota in the Gastrointestinal Tract. Med. Sci. 2018, 6. [Google Scholar] [CrossRef] [Green Version]
  18. Sung, J.; Kim, S.; Cabatbat, J.J.T.; Jang, S.; Jin, Y.-S.; Jung, G.Y.; Chia, N.; Kim, P.-J. Global metabolic interaction network of the human gut microbiota for context-specific community-scale analysis. Nat. Commun. 2017, 8, 1–12. [Google Scholar] [CrossRef] [Green Version]
  19. Proal, A.D.; Lindseth, I.A.; Marshall, T.G. Microbe-Microbe and Host-Microbe Interactions Drive Microbiome Dysbiosis and Inflammatory Processes. Discov. Med. 2017, 23, 51–60. [Google Scholar]
  20. Quigley, E.M.M. Prebiotics and probiotics; Modifying and mining the microbiota. Pharmacol. Res. 2010, 61, 213–218. [Google Scholar] [CrossRef]
  21. Gibson, G.R. Dietary Modulation of the Human Gut Microflora Using the Prebiotics Oligofructose and Inulin. J. Nutr. 1999, 129, 1438S–1441S. [Google Scholar] [CrossRef] [PubMed] [Green Version]
  22. Gibson, G.; Hutkins, R.; Sanders, M.; Prescott, S.; Reimer, R.; Salminen, S.; Scott, K.; Stanton, C.; Swanson, K.; Cani, P.; et al. The International Scientific Association for Probiotics and Prebiotics (ISAPP) Consensus Statement on the Definition and Scope of Prebiotics. Fac. Publ. Food Sci. Technol. 2017. [Google Scholar]
  23. Krumbeck, J.A.; Maldonado-Gomez, M.X.; Ramer-Tait, A.E.; Hutkins, R.W. Prebiotics and synbiotics: Dietary strategies for improving gut health. Curr. Opin. Gastroenterol. 2016, 32, 110–119. [Google Scholar] [CrossRef] [PubMed]
  24. García Gamboa, R.; Ortiz Basurto, R.I.; Calderón Santoyo, M.; Bravo Madrigal, J.; Ruiz Álvarez, B.E.; González Avila, M. In vitro evaluation of prebiotic activity, pathogen inhibition and enzymatic metabolism of intestinal bacteria in the presence of fructans extracted from agave: A comparison based on polymerization degree. LWT 2018, 92, 380–387. [Google Scholar] [CrossRef]
  25. Kolida, S.; Gibson, G.R. Prebiotic Capacity of Inulin-Type Fructans. J. Nutr. 2007, 137, 2503S–2506S. [Google Scholar] [CrossRef] [Green Version]
  26. De Vries, J.; Le Bourgot, C.; Calame, W.; Respondek, F. Effects of β-fructans fiber on bowel function: A systematic review and meta-analysis. Nutrients 2019, 11, 91. [Google Scholar] [CrossRef] [Green Version]
  27. Wiele, T.V.D.; Boon, N.; Possemiers, S.; Jacobs, H.; Verstraete, W. Inulin-type fructans of longer degree of polymerization exert more pronounced in vitro prebiotic effects. J. Appl. Microbiol. 2007, 102, 452–460. [Google Scholar] [CrossRef]
  28. Andrade, A.I.C.; Bautista, C.R.; Cabrera, M.A.R.; Guerra, R.E.S.; Chávez, E.G.; Ahumada, C.F.; Lagunes, A.G. Agave salmiana fructans as gut health promoters: Prebiotic activity and inflammatory response in Wistar healthy rats. Int. J. Biol. Macromol. 2019, 136, 785–795. [Google Scholar] [CrossRef]
  29. Biedrzycka, E.; Bielecka, M. Prebiotic effectiveness of fructans of different degrees of polymerization. Trends Food Sci. Technol. 2004, 15, 170–175. [Google Scholar] [CrossRef]
  30. Makras, L.; Acker, G.V.; Vuyst, L.D. Lactobacillus paracasei subsp. paracasei 8700:2 Degrades Inulin-Type Fructans Exhibiting Different Degrees of Polymerization. Appl. Environ. Microbiol. 2005, 71, 6531–6537. [Google Scholar] [CrossRef] [Green Version]
  31. Márquez-Aguirre, A.L.; Camacho-Ruiz, R.M.; Arriaga-Alba, M.; Padilla-Camberos, E.; Kirchmayr, M.R.; Blasco, J.L.; González-Avila, M. Effects of Agave tequilana fructans with different degree of polymerization profiles on the body weight, blood lipids and count of fecal Lactobacilli/Bifidobacteria in obese mice. Food Funct. 2013, 4, 1237–1244. [Google Scholar] [CrossRef] [PubMed]
  32. Gibson, G.R.; Fuller, R. Aspects of in vitro and in vivo research approaches directed toward identifying probiotics and prebiotics for human use. J. Nutr. 2000, 130, 391S–395S. [Google Scholar] [CrossRef] [PubMed]
  33. D’hoe, K.; Vet, S.; Faust, K.; Moens, F.; Falony, G.; Gonze, D.; Lloréns-Rico, V.; Gelens, L.; Danckaert, J.; De Vuyst, L.; et al. Integrated culturing, modeling and transcriptomics uncovers complex interactions and emergent behavior in a three-species synthetic gut community. eLife 2018, 7, e37090. [Google Scholar] [CrossRef] [PubMed]
  34. Faust, K.; Bauchinger, F.; Laroche, B.; De Buyl, S.; Lahti, L.; Washburne, A.D.; Gonze, D.; Widder, S. Signatures of ecological processes in microbial community time series. Microbiome 2018, 6, 120. [Google Scholar] [CrossRef] [PubMed] [Green Version]
  35. Zomorrodi, A.R.; Segrè, D. Synthetic Ecology of Microbes: Mathematical Models and Applications. J. Mol. Biol. 2016, 428, 837–861. [Google Scholar] [CrossRef] [Green Version]
  36. Vet, S.; Buyl, S.; De Faust, K.; Danckaert, J.; Gonze, D.; Gelens, L. Bistability in a system of two species interacting through mutualism as well as competition: Chemostat vs. Lotka-Volterra equations. PLoS ONE 2018, 13, e0197462. [Google Scholar] [CrossRef]
  37. Stein, R.R.; Bucci, V.; Toussaint, N.C.; Buffie, C.G.; Rätsch, G.; Pamer, E.G.; Sander, C.; Xavier, J.B. Ecological Modeling from Time-Series Inference: Insight into Dynamics and Stability of Intestinal Microbiota. PLOS Comput. Biol. 2013, 9, e1003388. [Google Scholar] [CrossRef]
  38. Gonze, D.; Lahti, L.; Raes, J.; Faust, K. Multi-stability and the origin of microbial community types. ISME J. 2017, 11, 2159–2166. [Google Scholar] [CrossRef] [Green Version]
  39. Muñoz-Tamayo, R.; Laroche, B.; Walter, É.; Doré, J.; Leclerc, M. Mathematical modelling of carbohydrate degradation by human colonic microbiota. J. Theor. Biol. 2010, 266, 189–201. [Google Scholar] [CrossRef]
  40. Jeyamkondan, S.; Jayas, D.S.; Holley, R.A. Microbial growth modelling with artificial neural networks. Int. J. Food Microbiol. 2001, 64, 343–354. [Google Scholar] [CrossRef]
  41. Becker, T.; Enders, T.; Delgado, A. Dynamic neural networks as a tool for the online optimization of industrial fermentation. Bioprocess Biosyst. Eng. 2002, 24, 347–354. [Google Scholar] [CrossRef]
  42. Zhang, C.; Vinyals, O.; Munos, R.; Bengio, S. A Study on Overfitting in Deep Reinforcement Learning. arXiv 2018, arXiv:180406893. [Google Scholar]
  43. Vega, R.; Hernandez-Reynoso, A.G.; Linn, E.K.; Fuentes-Aguilar, R.Q.; Sanchez-Ante, G.; Santos-Garcia, A.; Garcia-Gonzalez, A. Hemodynamic Pattern Recognition During Deception Process Using Functional Near-infrared Spectroscopy. J. Med. Biol. Eng. 2016, 36, 22–31. [Google Scholar] [CrossRef] [PubMed] [Green Version]
  44. Hopkins, M.; Cummings, J.; Macfarlane, G. Inter-species differences in maximum specific growth rates and cell yields of bifidobacteria cultured on oligosaccharides and other simple carbohydrate sources. J. Appl. Microbiol. 1998, 85, 381–386. [Google Scholar] [CrossRef]
  45. Poznyak, A.S.; Sanchez, E.N.; Yu, W. Differential Neural Networks for Robust Nonlinear Control: Identification, State Estimation and Trajectory Tracking; World Scientific: Singapore, 2001; ISBN 978-981-02-4624-2. [Google Scholar]
  46. Gupta, M.; Jin, L.; Homma, N. Static and Dynamic Neural Networks: From Fundamentals to Advanced Theory; John Wiley & Sons: Hoboken, NJ, USA, 2004; ISBN 978-0-471-46092-3. [Google Scholar]
  47. Gueguim Kana, E.B.; Oloke, J.K.; Lateef, A.; Adesiyan, M.O. Modeling and optimization of biogas production on saw dust and other co-substrates using Artificial Neural network and Genetic Algorithm. Renew. Energy 2012, 46, 276–281. [Google Scholar] [CrossRef]
  48. Jorjani, E.; Chehreh Chelgani, S.; Mesroghli, S. Prediction of microbial desulfurization of coal using artificial neural networks. Miner. Eng. 2007, 20, 1285–1292. [Google Scholar] [CrossRef]
  49. Gradilla-Hernández, S.J.; Herrera-López, E.; Gschaedler, A.; González-Avila, M.; Fuentes-Aguilar, R.; Garcia-Gonzalez, A. Differential neural network identifier for parameter determination of a mixed microbial culture model. IFAC-Pap. 2018, 51, 479–484. [Google Scholar] [CrossRef]
  50. Heeney, D.D.; Gareau, M.G.; Marco, M.L. Intestinal Lactobacillus in health and disease, a driver or just along for the ride? Curr. Opin. Biotechnol. 2018, 49, 140–147. [Google Scholar] [CrossRef] [Green Version]
  51. Tojo, R.; Suárez, A.; Clemente, M.G.; De los Reyes-Gavilán, C.G.; Margolles, A.; Gueimonde, M.; Ruas-Madiedo, P. Intestinal microbiota in health and disease: Role of bifidobacteria in gut homeostasis. World J. Gastroenterol. 2014, 20, 15163–15176. [Google Scholar] [CrossRef]
  52. Ferreira, R.B.R.; Gill, N.; Willing, B.P.; Antunes, L.C.M.; Russell, S.L.; Croxen, M.A.; Finlay, B.B. The Intestinal Microbiota Plays a Role in Salmonella-Induced Colitis Independent of Pathogen Colonization. PLoS ONE 2011, 6. [Google Scholar] [CrossRef]
  53. Ji, B.; Nielsen, J. From next-generation sequencing to systematic modeling of the gut microbiome. Front. Genet. 2015, 6. [Google Scholar] [CrossRef] [PubMed] [Green Version]
  54. García-Gamboa, R.; Gradilla-Hernández, M.S.; Ortiz-Basurto, R.I.; García-Reyes, R.A.; González-Avila, M. Assessment of intermediate and long chains agave fructan fermentation on the growth of intestinal bacteria cultured in a gastrointestinal tract simulator. Rev. Mex. Ing. Quím. 2020, 19, 827–838. [Google Scholar] [CrossRef] [Green Version]
  55. Cardarelli, H.R.; Martinez, R.C.; Albrecht, S.; Schols, H.; Franco, B.D.G.M.; Saad, S.M.I.; Smidt, H. In vitro fermentation of prebiotic carbohydrates by intestinal microbiota in the presence of Lactobacillus amylovorus DSM 16998. Benef Microbes 2016, 7, 119–133. [Google Scholar] [CrossRef]
  56. Salazar, N.; Dewulf, E.M.; Neyrinck, A.M.; Bindels, L.B.; Cani, P.D.; Mahillon, J.; De Vos, W.M.; Thissen, J.-P.; Gueimonde, M.; De los Reyes-Gavilán, C.G.; et al. Inulin-type fructans modulate intestinal Bifidobacterium species populations and decrease fecal short-chain fatty acids in obese women. Clin. Nutr. 2015, 34, 501–507. [Google Scholar] [CrossRef] [PubMed]
  57. Roberfroid, M.B.; Van Loo, J.A.E.; Gibson, G.R. The Bifidogenic Nature of Chicory Inulin and Its Hydrolysis Products. J. Nutr. 1998, 128, 11–19. [Google Scholar] [CrossRef] [PubMed] [Green Version]
  58. Loo, J.V.; Cummings, J.; Delzenne, N.; Englyst, H.; Franck, A.; Hopkins, M.; Kok, N.; Macfarlane, G.; Newton, D.; Quigley, M.; et al. Functional food properties of non-digestible oligosaccharides: A consensus report from the ENDO project (DGXII AIRII-CT94-1095). Br. J. Nutr. 1999, 81, 121–132. [Google Scholar] [CrossRef] [PubMed] [Green Version]
  59. Rastall, R.A.; Gibson, G.R. Recent developments in prebiotics to selectively impact beneficial microbes and promote intestinal health. Curr. Opin. Biotechnol. 2015, 32, 42–46. [Google Scholar] [CrossRef]
  60. Barroso, E.; Sánchez-Patán, F.; Martín-Alvarez, P.J.; Bartolomé, B.; Moreno-Arribas, M.V.; Peláez, C.; Requena, T.; Van de Wiele, T.; Martínez-Cuesta, M.C. Lactobacillus plantarum IFPL935 favors the initial metabolism of red wine polyphenols when added to a colonic microbiota. J. Agric. Food Chem. 2013, 61, 10163–10172. [Google Scholar] [CrossRef] [Green Version]
  61. Medina, D.A.; Pinto, F.; Ovalle, A.; Thomson, P.; Garrido, D. Prebiotics Mediate Microbial Interactions in a Consortium of the Infant Gut Microbiome. Int. J. Mol. Sci. 2017, 18, 2095. [Google Scholar] [CrossRef] [Green Version]
  62. Moens, F.; De Vuyst, L. Inulin-type fructan degradation capacity of Clostridium cluster IV and XIVa butyrate-producing colon bacteria and their associated metabolic outcomes. Benef. Microbes 2017. [Google Scholar] [CrossRef]
  63. Perrin, S.; Warchol, M.; Grill, J.P.; Schneider, F. Fermentations of fructo-oligosaccharides and their components by Bifidobacterium infantis ATCC 15697 on batch culture in semi-synthetic medium. J. Appl. Microbiol. 2001, 90, 859–865. [Google Scholar] [CrossRef]
  64. Meulen, R.V.; Der Avonts, L.; Vuyst, L.D. Short Fractions of Oligofructose Are Preferentially Metabolized by Bifidobacterium animalis DN-173 010. Appl. Environ. Microbiol. 2004, 70, 1923–1930. [Google Scholar] [CrossRef] [PubMed] [Green Version]
  65. Vuyst, L.D.; Makras, L.; Avonts, L.; Holo, H.; Yi, Q.; Servin, A.; Fayol-Messaoudi, D.; Berger, C.; Zoumpopoulou, G.; Tsakalidou, E.; et al. Antimicrobial potential of probiotic or potentially probiotic lactic acid bacteria, the first results of the international European research project PROPATH of the PROEUHEALTH cluster. Microb. Ecol. Health Dis. 2004, 16, 125–130. [Google Scholar] [CrossRef] [Green Version]
  66. De Keersmaecker, S.C.J.; Verhoeven, T.L.A.; Desair, J.; Marchal, K.; Vanderleyden, J.; Nagy, I. Strong antimicrobial activity of Lactobacillus rhamnosus GG against Salmonella typhimurium is due to accumulation of lactic acid. FEMS Microbiol. Lett. 2006, 259, 89–96. [Google Scholar] [CrossRef] [PubMed] [Green Version]
  67. Bielecka, M.; Biedrzycka, E.; Biedrzycka, E.; Smoragiewicz, W.; Smieszek, M. Interaction of Bifidobacterium and Salmonella during associated growth. Int. J. Food Microbiol. 1998, 45, 151–155. [Google Scholar] [CrossRef]
  68. Fayol-Messaoudi, D.; Berger, C.N.; Coconnier-Polter, M.-H.; Moal, V.L.-L.; Servin, A.L. pH-, Lactic Acid-, and Non-Lactic Acid-Dependent Activities of Probiotic Lactobacilli against Salmonella enterica Serovar Typhimurium. Appl. Environ. Microbiol. 2005, 71, 6008–6013. [Google Scholar] [CrossRef] [Green Version]
  69. Servin, A.L. Antagonistic activities of lactobacilli and bifidobacteria against microbial pathogens. FEMS Microbiol. Rev. 2004, 28, 405–440. [Google Scholar] [CrossRef] [Green Version]
  70. Gibson, G.R. Dietary modulation of the human gut microflora using prebiotics. Br. J. Nutr. 1998, 80, S209–S212. [Google Scholar] [CrossRef] [Green Version]
  71. Molly, K.; Vande Woestyne, M.; Verstraete, W. Development of a 5-step multi-chamber reactor as a simulation of the human intestinal microbial ecosystem. Appl. Microbiol. Biotechnol. 1993, 39, 254–258. [Google Scholar] [CrossRef]
  72. Santiaguín-Padilla, A.J.; Peña-Ramos, E.A.; Pérez-Gallardo, A.; Rascón-Chu, A.; González-Ávila, M.; González-Ríos, H.; González-Noriega, J.A.; Islava-Lagarda, T. In vitro Digestibility and Quality of an Emulsified Meat Product Formulated With Animal Fat Encapsulated With Pectin. J. Food Sci. 2019, 84, 1331–1339. [Google Scholar] [CrossRef]
  73. Gutiérrez-Zamorano, C.; González-Ávila, M.; Díaz-Blas, G.; Smith, C.T.; González-Correa, C.; García-Cancino, A. Increased anti-Helicobacter pylori effect of the probiotic Lactobacillus fermentum UCO-979C strain encapsulated in carrageenan evaluated in gastric simulations under fasting conditions. Food Res. Int. Ott. Ont 2019, 121, 812–816. [Google Scholar] [CrossRef]
  74. García, A.; Luviano-Juárez, A.; Chairez, I.; Poznyak, A.; Poznyak, T. Projectional dynamic neural network identifier for chaotic systems: Application to Chua’s circuit. Int. J. Artif. Intell. 2011, 6, 1–18. [Google Scholar]
  75. Bucci, V.; Xavier, J.B. Towards Predictive Models of the Human Gut Microbiome. J. Mol. Biol. 2014, 426, 3907–3916. [Google Scholar] [CrossRef] [PubMed] [Green Version]
  76. Barati Reza Parameter Estimation of Nonlinear Muskingum Models Using Nelder-Mead Simplex Algorithm. J. Hydrol. Eng. 2011, 16, 946–954. [CrossRef]
  77. Dochain, D. Automatic Control of Bioprocesses; John Wiley & Sons: Hoboken, NJ, USA, 2013; ISBN 978-1-118-62391-6. [Google Scholar]
Figure 1. Within-run reproducibility and between-run repeatability of the Automatic Robotic Intestinal System (ARIS) system.
Processes 08 00593 g001
Figure 2. Growth curves and box plots for Lactobacillus spp., Bifidobacterium spp., Salmonella spp. and Clostridium spp. for each colon section of the experimental system and the control system (ascending, transverse and descending).
Processes 08 00593 g002
Figure 3. Comparison between the experimental state vector x(t) and the differential neural network (DNN) identifier state vector x ^ ( t ) for the descending colon fed with the fructan-supplemented diet.
Processes 08 00593 g003
Figure 4. Trajectories of the adaptable weights and of the norm of the identification error for the descending colon for the fructan-supplemented system; convergence was obtained in a period shorter than 0.25 h.
Processes 08 00593 g004
Figure 5. Evolution trends of the specific growth rates (αi) of Lactobacillus spp. for the different colon sections of the control system and the fructan-supplemented system.
Processes 08 00593 g005
Figure 6. β12 (blue) and β21 (red) parameter trends.
Processes 08 00593 g006
Figure 7. Population dynamics of the Lactobacillus spp. counts over time in the ascending colon section. The derivatives obtained after the DNN nonparametric identification are presented on the left-hand side, and the curve representing the evolution of the five terms of the generalized Lotka-Volterra (gLV) model is shown on the right-hand side.
Processes 08 00593 g007
Figure 8. Experimental setup of the ARIS system.
Processes 08 00593 g008
Figure 9. Sampling procedure.
Processes 08 00593 g009
Figure 10. Unidirectional impact and bidirectional interaction analysis.
Processes 08 00593 g010
Figure 11. (a) Summary of the experimental set-up and modeling approach. (b) Summary of the experimental set-up and modeling approach.
Processes 08 00593 g011aProcesses 08 00593 g011b
Table 1. Mean values for the estimated taxon-specific growth rates αi, as well as the intraspecific (βii) and interspecific (βij) interaction coefficients of the generalized Lotka-Volterra (gLV) model.
Colon SectionAscending ColonTransverse ColonDescending Colon
TreatmentControlFructansControlFructansControlFructans
Lactobacillus spp.α11.788 ± 0.7971.864 ± 0.6671.331 ± 1.3043.142 ± 2.962 *3.642 ± 1.2655.201 ± 4.747 *
β110.929 ± 0.281 *0.620 ± 0.1410.553 ± 0.280 *0.008 ± 0.0151.459 ± 0.4390.039 ± 1.928 *
β121.318 ± 0.9131.565 ± 0.325 *1.576 ± 1.645 *0.010 ± 0.0080.406 ± 0.132 *0.237 ± 0.202
β131.163 ± 0.5161.328 ± 0.290 *2.362 ± 2.296 *0.029 ± 0.3370.188 ± 0.0510.170 ± 0.190
β14−0.374 ± 0.125 *−0.493 ± 0.136−0.452 ± 0.182−0.001 ± 0.018 *−0.379 ± 0.130−0.079 ± 0.151 *
Bifidobacterium spp.α21.152 ± 0.3802.068 ± 0.6122.158 ± 1.1023.317 ± 4.2952.743 ± 0.7703.295 ± 3.542
β211.064 ± 0.3130.511 ± 0.1290.681 ± 0.3920.077 ± 0.0921.555 ± 0.4370.336 ± 0.368
β221.218 ± 0.3791.461 ± 0.3361.085 ± 0.5230.279 ± 0.3160.252 ± 0.0680.066 ± 0.118
β231.109 ± 0.3641.209 ± 0.3151.453 ± 0.5330.861 ± 1.1930.167 ± 0.0620.097 ± 0.060
β24−0.378 ± 0.143−0.430 ± 0.125−0.350 ± 0.144−0.083 ± 0.069−0.312 ± 0.075−0.023 ± 0.050
Salmonella spp.α31.869 ± 0.6972.313 ± 0.7381.051 ± 0.6352.800 ± 9.0052.052 ± 0.7532.678 ± 4.782
β310.936 ± 0.2940.227 ± 0.0890.567 ± 0.2770.094 ± 0.0841.709 ± 0.4970.121 ± 0.708
β321.226 ± 0.3831.382 ± 0.3100.452 ± 0.1740.198 ± 0.8220.369 ± 0.1010.051 ± 0.045
β331.203 ± 0.3531.382 ± 0.4291.203 ± 0.5531.452 ± 1.5570.193 ± 0.0570.043 ± 0.082
β34−0.372 ± 0.119−0.322 ± 0.104−0.246 ± 0.140−0.176 ± 0.137−0.400 ± 0.1060.013 ± 0.018
Clostridium spp.α41.607 ± 1.6072.302 ± 0.5922.657 ± 0.9662.665 ± 3.1242.802 ± 0.7822.088 ± 4.116
β411.326 ± 0.0.5540.865 ± 0.3661.063 ± 0.4580.360 ± 0.6791.827 ± 0.5610.341 ± 0.810
β421.894 ± 0.6221.399 ± 0.4490.831 ± 0.5231.674 ± 1.9860.776 ± 0.2470.510 ± 0.921
β430.944 ± 0.4691.417 ± 0.3961.208 ± 0.5441.465 ± 3.2790.518 ± 0.1540.489 ± 0.583
β44−0.481 ± 0.0.194−0.336 ± 0.158−0.370 ± 0.160−0.451 ± 0.459−0.015 ± 0.259−0.685 ± 0.517
αi are reported in h−1, and βii and βij are reported in mL UFC−1 h−1. * Significant difference between the mean estimated parameter when fructans WERE administered, and the mean estimated parameter when fructans WERE NOT administered for a specific colon section. * denotes the largest parameter in absolute values.
Table 2. Average difference of the parameters βij- βji between every pair of genera i and j in each colon section, type of bidirectional interaction and the genus that was most benefited or affected by the interaction.
Colon SectionAscending ColonTransverse ColonDescending Colon
Interaction Parameters DifferenceAverage DifferenceInteractionObservationAverage DifferenceInteractionObservationAverage DifferenceInteractionObservation
β12211.054 *Mutualism
(+/+)
Lactobacillus spp. (most benefited)−0.067 *Neutralism
(0/0)
Both effects are negligible <0.1−0.099 *Mutualism
(+/+)
Bifidobacterium spp. (most benefited)
β13311.101 *Mutualism
(+/+)
Lactobacillus spp. (most benefited)−0.084 *Neutralism
(0/0)
Both effects are negligible <0.1−0.049Neutralism
(+/+)
Equally benefitted
14|-β41−0.372 *Antagonism
(−/+)
Clostridium spp. (is benefited)−0.359 *Commensalism
(0/+)
Clostridium spp. (is benefited)−0.262 *Commensalism
(0/+)
Clostridium spp. (is benefited)
β2332−0.173 *Mutualism
(+/+)
Salmonella spp. (most benefited)0.663 *Mutualism
(+/+)
Bifidobacterium spp. (most benefited)0.046 *Neutralism
(0/0)
Both effects are negligible <0.1
24|-β42−0.969 *Antagonism
(−/+)
Clostridium spp. (is benefited)−1.591 *Commensalism
(0/+)
Clostridium spp. (is benefited)−0.487 *Commensalism
(0/+)
Clostridium spp. (is benefited)
34|-β43−1.095 *Antagonism
(−/+)
Clostridium spp. (is benefited)−1.289 *Antagonism
(−/+)
Clostridium spp. (is benefited)−0.476 *Commensalism
(0/+)
Clostridium spp. (is benefited)
* Significant differences determined by the time-paired t-test.

