Article

Enhanced Specific Heat Capacity of Liquid Entrapped between Two Solid Walls Separated by a Nanogap

1
Department of Mechanical Science and Engineering, University of Illinois at Urbana-Champaign, Urbana, IL 61801, USA
2
Department of Mechanical Engineering, Bangladesh University of Engineering and Technology, Dhaka 1000, Bangladesh
3
Department of Mathematical Sciences, University of South Carolina Aiken, Aiken, SC 29801, USA
*
Author to whom correspondence should be addressed.
Processes 2020, 8(4), 459; https://doi.org/10.3390/pr8040459
Submission received: 10 March 2020 / Revised: 6 April 2020 / Accepted: 9 April 2020 / Published: 13 April 2020
(This article belongs to the Section Materials Processes)

Abstract

:
Size and thermal effect on molar heat capacity of liquid at constant volume (Cv) on a nanometer scale have been investigated by controlling the temperature and density of the liquid domain using equilibrium molecular dynamics (EMD) simulations. Lennard-Jones (LJ) type molecular model with confinement gap thickness (h) 0.585 nm to 27.8 nm has been used with the temperature (T) ranging from 100 K to 140 K. The simulation results revealed that the heat capacity of the nanoconfined liquid surpasses that of the bulk liquid within a defined interval of gap thickness; that the temperature at which maximum heat capacity occurs for a nanoconfined liquid vary with gap thickness following a power law, TCv,max = 193.4 × (h/a)−0.3431, ‘a’ being the lattice constant of Argon (solid) at 300 K; and that for a specified gap thickness and temperature, the confined liquid can exhibit a heat capacity that can be more than twice the heat capacity of the bulk liquid. The increase in heat capacity is underpinned by an increase in non-configurational (phonon and anharmonic modes of vibration) and configurational (non-uniform density distribution, enhanced thermal resistance, guided molecular mobility, etc.) contributions.

1. Introduction

The fast-growing demand in processing and synthesis of novel materials having nanometer sized structures as the building block has given rise to the need for an intense scientific understanding of nanoscale energy transport. Examples encompass thermoelectric energy conversion and storage devices [1], photonic and optoelectronic devices [2], intricate memory devices [3], biomedical devices [3], thermal management of novel electronic devices [4], etc.
In many devices like laser diodes or memory devices, it is not desirable to retain the generated heat for a long time. These systems need mechanisms pertaining to the low heat capacity of their constituent materials. In some systems like localized thermoelectric coolers or thermal barriers, it is required to retain the heat as long as possible. Heat capacity should be high enough for these systems [5,6]. Hence, extensive research on nanoscale thermal transport especially on the heat capacity of materials at nanometer size scales has become a game changer.
When dimensions shrink, unique properties can result so that the fundamentals of thermo-physical processes deviate from traditional macroscopic behavior [7,8,9]. That is why, the traditional Einstein–Debye phonon model cannot explain the experimental evidence of the unusual high heat capacity of nanoclusters [10]. Avramov and Michailov [11] have extended this model for solid nanoclusters incorporating the size and temperature dependence of heat capacity, which can eventually explain why nanoclusters have a higher specific heat capacity than their bulk counterparts [10]. In practice, there are well-defined theories pertaining to heat capacity of solids and gases. However, the system specific anisotropic behavior of liquid molecules have hindered the development of any straight-forward mathematical formulation of the heat capacity of liquid—not even for the bulk case [11], although extensive experimental works in this field are readily available.
Previous works of Tombari et al. [12] and Nagoe et al. [13] on confined water in silica nanopores confirmed an increase in its heat capacity (heat capacity is about 40% higher than its bulk counterpart for 2-nm radius pores), which reveals the size dependence of heat capacity of nanoconfined water. Tombari et al. [12] attributed it to the vibrational and configurational contributions of the confined water. Solveyra et al. [3] reported a structural, dynamic and phase behavioral change of such confined water in nanopores made of TiO2 with diameters 1.3, 2.8 and 5.1 nm. Recently, Khler et al. [4] have shown that for wider nanopores, the size dependence is less relevant once the fluid structure is bulk-like. Leng [14] reported a 5 to 16-fold viscosity of water confined in 0.7–1.35 nm nanopores compared to its bulk counterpart. Heat Capacity is related to the viscosity (µ) via Prandtl Number (Pr) and Prandtl Number can be correlated with the reciprocal of the reduced temperature (Tr = T/Tc) [15]. Hence a qualitative enhancement of heat capacity of liquid due to confinement is expected [16] although the magnitude may vary quantitatively.
Experimental works carried out by Tombari et al. [12,17] provide an evidence of enhancement in heat capacity and drop in enthalpy and entropy of confined liquid water within 4 nm nanopores made of Vycor glass at 253–360 K. This eventually supports that heat capacity of nanoconfined liquid water depends on its temperature. Tombari et al. [12], and Mochizuki and Koga [18] corroborated this phenomenon with ice-water equilibrium at intergranular spacing and a structural change of water within the nanopores. Recent studies carried out by Nomura et al. [5] and Abbaspour et al. [19] have reported phase transition phenomena in nanoconfined water at different densities and pressures respectively.
Not only for water but also for other liquids, changes in orientation, structure and dynamics of molecules and consequently, variations in heat capacity of the nanoconfined liquid have been reported in the literature [7,8,20]. Recently, Kucheyev and Lenhardt [20] studied H2 within polymeric norbornene aerogel and reported its freezing behavior. They have reported a greater effective heat capacity of H2 inside a norbornene-based aerogel than its bulk counterpart up to a certain range of temperature (0−300 K). They attributed it to a thermodynamic effect instead of the kinetic behavior of the entrapped H2 molecules [7]. Earlier, Cleve et al. [21] reported temperature dependencies of heat capacity of Hydrogen and Deuterium within the silica aerogel for a variety of filling fractions which actually indicates size- and temperature-dependent heat capacity of nanoconfined Hydrogen and Deuterium.
Liang and Tsai [22] studied the thermal conduction across thin liquid Argon (Ar) film trapped between two solid Silver (Ag) particles for different film thickness. They reported that the interfacial thermal resistance (RSF) between the solid–liquid thin film drops by one order of magnitude compared to its bulk counterpart when the liquid consists of only one layer. However, as soon as the film thickness increases, RSF increases rapidly towards RSL. They explained it with the difference in vibrational density of states (VDOS) of the nanolayer and the solid walls. However, they failed to provide a concrete explanation regarding why the solid-film thermal boundary resistance increases insignificantly after a few layers and finally approaches a constant value [23].
This gap has recently been filled by Wang et al. [23]. They worked on a similar system comprising of liquid Ar trapped between two parallel solid Cu walls. They observed the effect of the variation of liquid height on thermal boundary resistance of the solid–liquid interface for a variety of wettability conditions. Their results indicated that with the increase in the separation distance beyond one molecular layer, there was a dramatic increase in the thermal boundary resistance at the beginning, afterwards it increased slightly for the next few layers and finally approached a constant value asymptotically. They explained it by analyzing the VDOS and atom exchange of the nanolayer and the constituent liquid atoms. Morshed et al. [24] studied thermal transport of nanoconfined liquid Ar entrapped between two parallel solid Cu plates at different gap thickness and varying temperature. Their works revealed that thermal resistance follows an inverse relation with the temperature and gap thickness for a liquid under nanoscale confinement. As heat retaining capacity of the liquid is directly related to the thermal resistance it undergoes, this explains the strange behavior of the heat capacity of nanoconfined liquid.
However, none of the previous researchers have explored the effect of variation of confinement of size and temperature of the entrapped liquid on heat capacity of liquid under nanoscale confinement. Inspired by the work of Liang and Tsai [22], Wang et al. [23] and Morshed et al. [24]; in this research work, equilibrium molecular dynamics (EMD) simulations in canonical and microcanonical ensemble have been carried out on an analogous system composed of liquid Ar molecules entrapped between two adjustable Solid Cu walls. Confinement induced the enhancement of heat capacity (Cv) of liquid Ar at different liquid film thickness (h) and temperature (T) has been studied. Finally, non-configurational and configurational contributions of the entrapped liquid have been analyzed to explain this behavioral anomaly of nanoconfined liquid.
We envisage that the numerical studies presented here will provide a new insight to the systematic studies of thermal transport of liquid entrapped in nanoscale confinement. The extraordinary high heat capacity studied here can pave the way of highly efficient engineering processes like robust on-chip-cooling, high performance molecular and thermal computing, intricately patterned thermophotovoltaic energy conversion systems, and compact thermal energy storage processes. These can eventually lead to a breakthrough in high-speed, high-capacity memory technologies like the state of the art 3D Xpoint technology, NAND Flash memory, and other non-volatile memory technology, and energy conversion devices like thermophotovoltaic cells, fuel cells, etc. where both the effective storage and dissipation of thermal energy are of a major challenge.

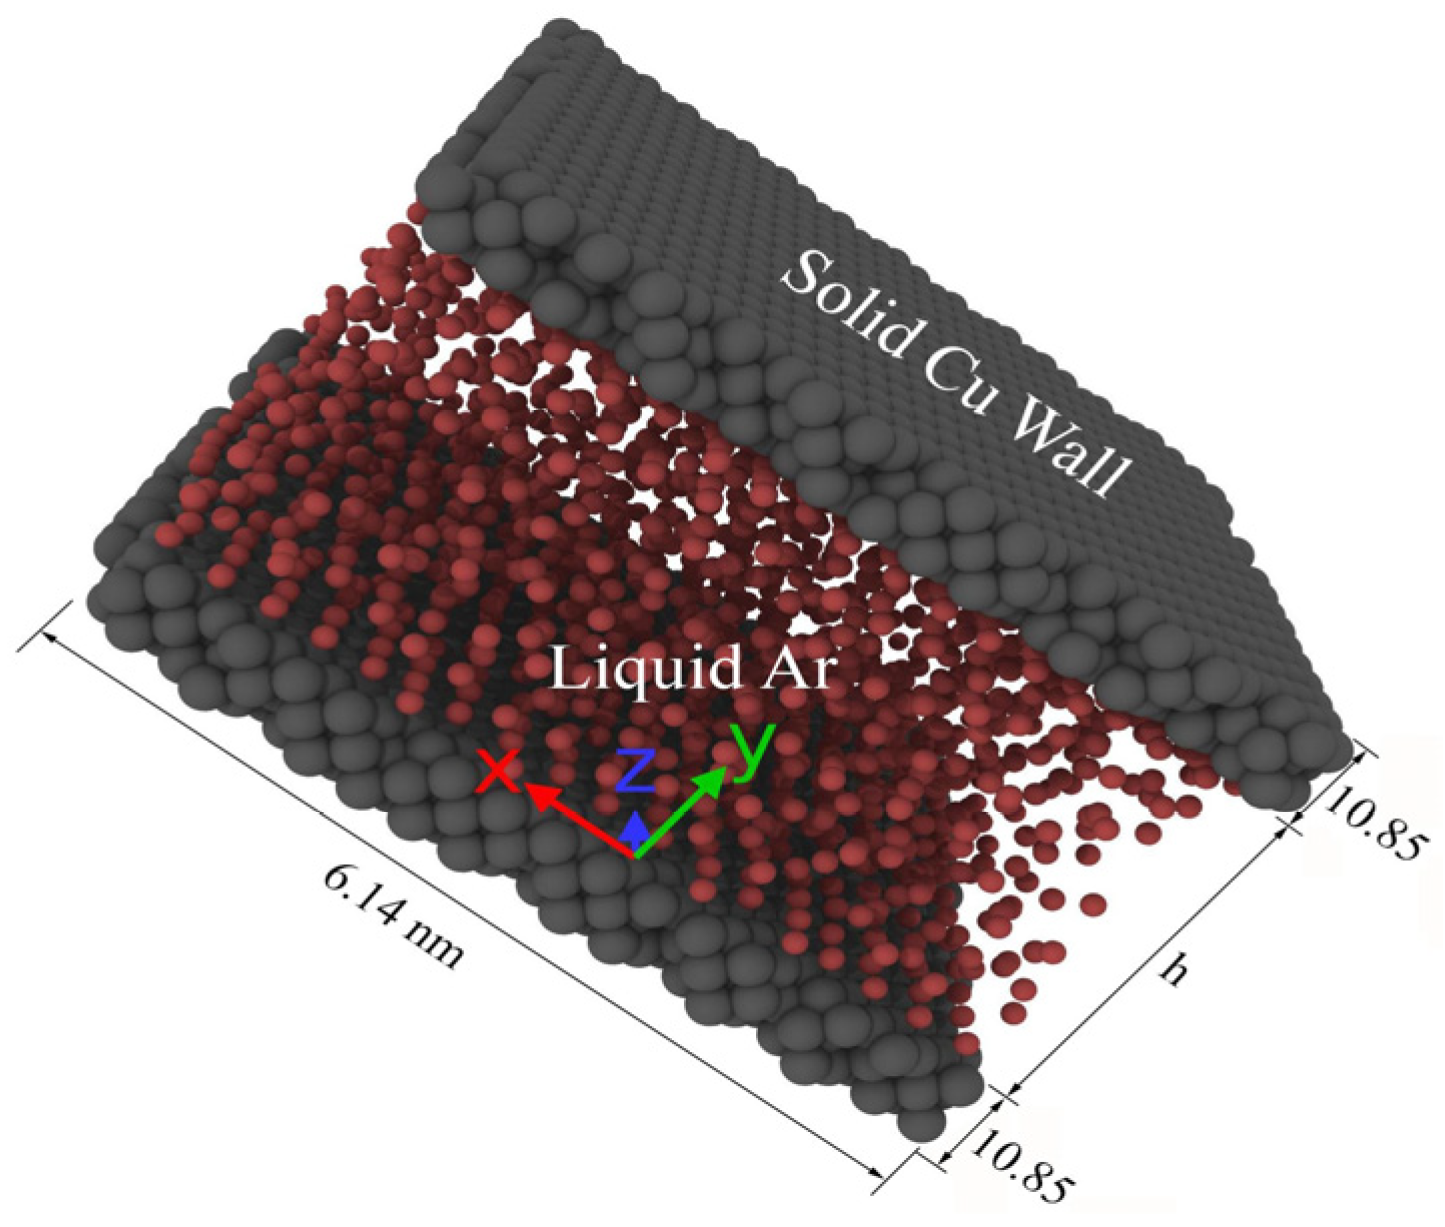
2. Modeling and Simulation Procedures

The simulation domain consists of a slab of liquid Argon (Ar) (1320 kg/m3) bounded by two solid Copper (Cu) (8960 kg/m3) plates as can be seen from Figure 1. There are three monolayers of solid Cu at each plate. The simulation box is 6.14 × h × 6.14 nm3. Each monolayer consists of 578 molecules of Cu and is in FCC (100) crystal structure. A cutoff distance (rc) of 2.5σ is used considering the computation cost which is also supported by previous studies carried on similar systems [23,24]. (For rc = 2.5σ, the resulting error in the number density profile of liquid Ar is ≤2%). The truncated Lennard-Jones (LJ) potential as shown in Equation (1) is used to mimic the Van der Waals interactions between liquid–liquid and solid–solid system. The interaction parameters for solid-liquid interface has been determined using the Lorentz–Berthelot mixing rule [25].
ϕ t r u n c a t e d ( r i j ) = 4 ϵ [ ( ( σ r i j ) 12 ( σ r i j ) 6 ) ( ( σ r c ) 12 ( σ r c ) 6 ) ]
The length and energy parameters associated with the LJ potential used for this simulation are tabulated in Table 1 [24]:
The equations of motion have been integrated using the velocity-verlet algorithm with timestep, t = 5 fs. Periodic boundary conditions have been imposed laterally (x-z) and fixed boundary condition is used in the other direction (y). A spring force of 57 σ / ϵ 2 is applied to each molecule of the top and bottom wall so that the molecules can vibrate with respect to their corresponding fixed positions. At the very beginning, the Nose–Hoover thermostat is set to 100 K and the entire simulation is run for 1 ns. After that the thermostat is switched off. The entire simulation is run for another 1 ns in that state. After these two steps, when the system is in equilibrium, the average total energy and temperature of the liquid Ar film (ensemble average) are calculated for a time-span of 2 ns.
To figure out the contributions of molecular motion in energy transfer and to evaluate the overall and interfacial thermal resistances, heat flux under temperature gradient is required. Hence, at the end of the relaxation period, the lower and upper wall was set to 90 K and 110 K respectively using Nose–Hoover thermostat. After confirming the liquid phase (Figure S1) and equilibrium state (Figure S2) of the confined Ar molecules, the average total energy was calculated for 2 ns using Equations (2) and (3). The overall thermal resistance (Roverall) and liquid region’s thermal resistance, (Rliquid) were calculated using Equations (4) and (5) respectively [24].
Δ E c o l d / h o t = ± 1 2 m ( v n e w 2 v o l d 2 )
Δ E a v g = | Δ E c o l d | + | Δ E h o t | 2
R o v e r a l l = 1 k o v e r a l l = A τ δ T Δ E a v g H
R l i q u i d = 1 k l i q u i d = A τ T x Δ E a v g
The simulation, at first, was completed for initial gap thickness to lattice spacing ratio, h/a = 1.0. Then, the same process was applied for a gradual increase in h/a ratios starting from 1.5 to 47.5. Initially, the temperature was kept constant at 100 K. Then, the entire procedure was repeated for temperature ranging from 110 K to 140 K. The simulations performed in this research were done with the Open Source Software, LAMMPS (LAMMPS/20190807, Open Source, 2019) [26], To visualize the simulation results, another Open Source Software OVITO (OVITO 3.0, Open Source, 2019) [27] is used.
Heat capacity in a canonical and grand canonical system is directly related to its energy fluctuations [28]. Although the average values of some quantities in such a system remain fixed at equilibrium, the fluctuations may vary largely [25]. Statistical thermodynamics can be used to utilize this synergetic fluctuation to extract thermal transport properties like heat capacity of the system as shown by Equation (7).
C v = v a r ( E T ) K B T 2 = σ 2 ( E T ) K B T 2
C v = ( Q T ) V , N = ( E T T ) V , N
where, ‘ET’ denotes the total energy of liquid Ar, ‘KB’ is the Boltzmann constant and ‘T’ is the absolute temperature of liquid Ar.
Heat capacity of bulk liquid Ar at different temperatures have been determined using the fluctuation formula and compared with the experimental results (Figure S3). The excellent match between the experimental and theoretical results [29] of heat capacity of bulk liquid Ar at different temperatures validates using the same approach to calculate the heat capacity of nanoconfined liquid Ar at different temperatures and liquid film thickness, for which as far as the authors know, no published data are available.

3. Results and Discussions

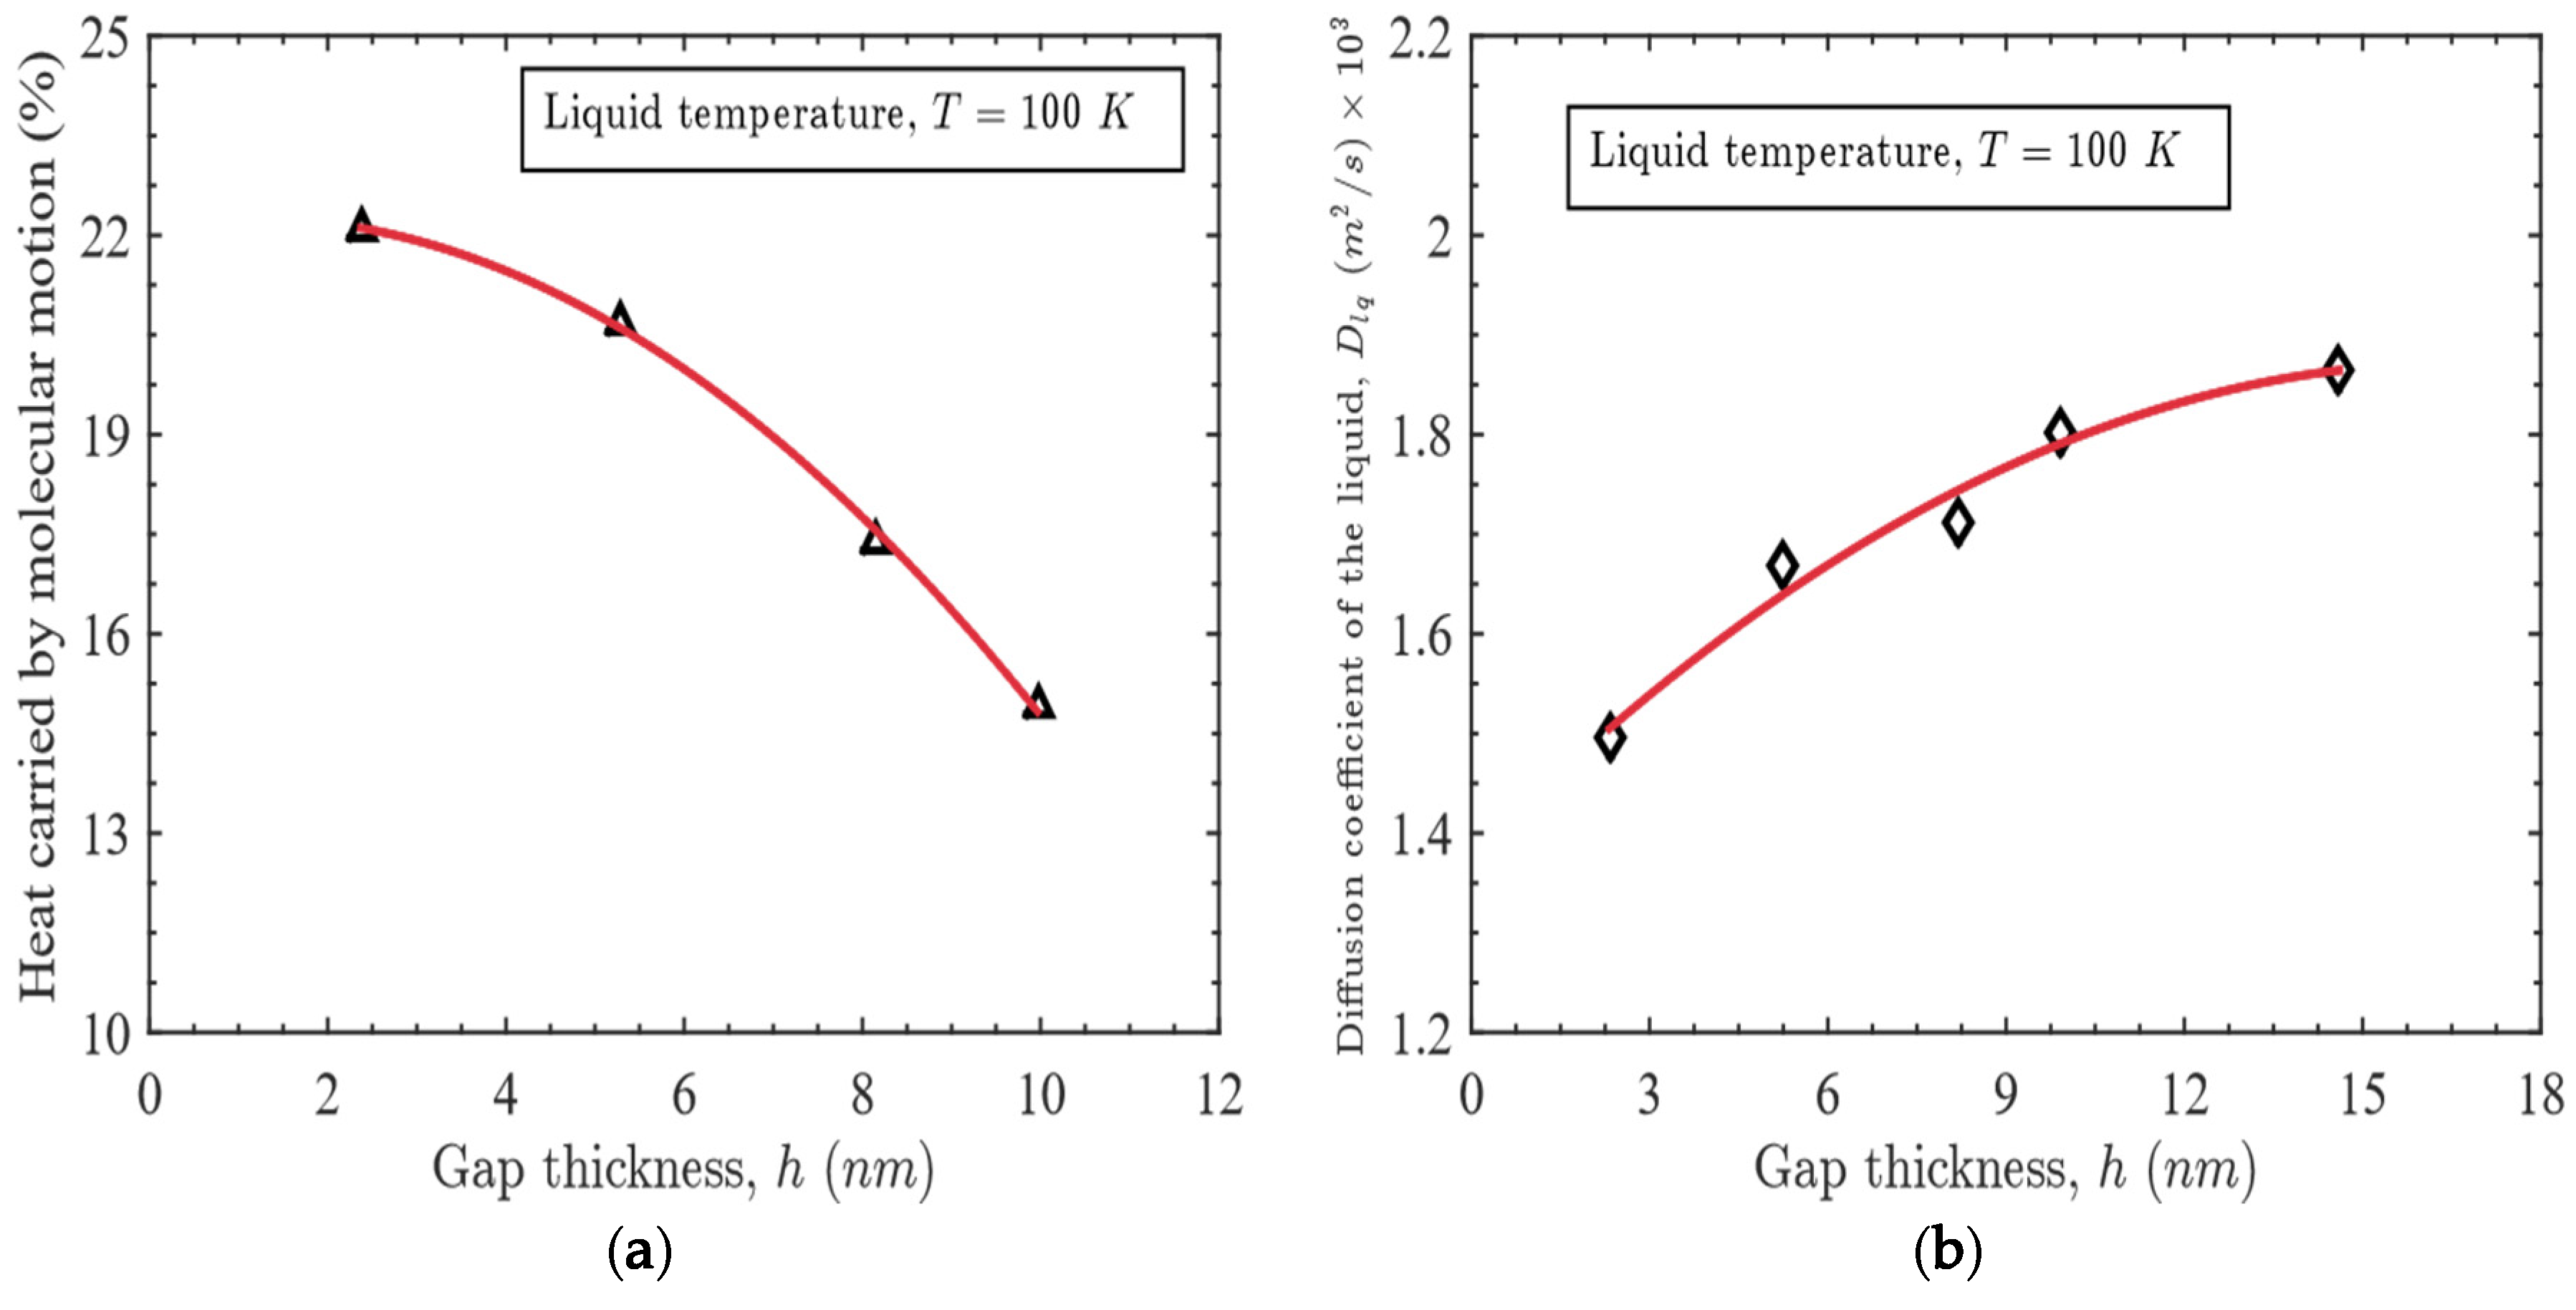
3.1. Effect of Gap Thickness on Heat Capacity

From Figure 2, it is evident that for a specific range of gap thickness (h/a = 10.5 to 1.5 i.e., a gap thickness varying from 6.14 nm to 0.88 nm) and a fixed temperature (T = 100 K for this case), the Cv of the nanoconfined liquid significantly enhanced, beyond which, this enhancement suddenly vanished approaching Cv to its bulk value. For instance, the Cv of the confined liquid Ar started to increase from its bulk value (19.95 J/mol.K) when h/a decreased beyond 10.5 (gap thickness 6.14 nm). At h/a = 7.0 (gap thickness 4.1 nm), the Cv became the maximum with a value of 44.36 J/mol.K. Quantitatively, this value is about 2.3 times greater in magnitude than its bulk equivalence at 100 K. If the wall separation distance is lowered further, Cv descends from its apex. Interestingly, when h/a = 1.5 (gap thickness 0.88 nm), the Cv of the nanoconfined liquid again followed the value of its bulk counterpart. The increased heat capacity of liquid Ar was observed to be consistent with the experimental results reported earlier for water under molecular scale confinement [12,13,14,16,17].
The enhancement in heat capacity of the confined liquid was attributed to an increase in non-configurational and configurational contributions [17]. The non-configurational contribution can be viewed as a combination of two effects–firstly, the vibrational (phonon) contribution and secondly, the anharmonic modes contribution that increases in proportion with the temperature [17].
The configurational contribution arises preliminarily due to the changes in both the average coordination (size effect) and short-range order in liquid’s structure (depends on its temperature and pressure) [17]. It can be viewed as the sum of three effects: non-uniform density distribution, energy transfer due to molecular motion and guided molecular mobility of the confined liquid. The non-configurational and configurational contributions are interdependent. They are a direct function of the volume and structure of the constituent liquid since the higher energetic configurational states can endure lower phonon frequency with enhanced anharmonic phonons [12].
Although currently there is no straight-forward mathematical formulation of the heat capacity of liquid, phonon theory has been devised recently to bypass the problem of system-specific interactions of liquid molecules [11,29]. Usually, when the liquid film thickness is large enough compared to the phonon mean free path (MFP), phonon travels diffusively which is driven by frequent phonon collisions [9,30]. Heat capacity of the confined liquid in such cases resembles the bulk value as shown in Figure 2 for h/a > 10.5. However, as soon as the liquid film thickness becomes commensurate with the phonon MFP, ballistic transport starts to dominate the thermal energy transportation process [9]. In such cases, the heat retaining capability of a nanodevice strongly depends on the boundary scattering dynamics. Consequently, the effect of its geometric size and shape comes into play [9]. Hence, the ability of a nanodevice to retain thermal energy is strongly influenced by the scattering dynamics at the boundary and its geometrical size and shape [9]. Phonon MFP was calculated [28] using Equation (8):
l = v ¯ z = K B T 2 σ p = K B T 2 ( π d 2 ) p
where, ‘d’ denotes the hypothetical collision diameter whose value is 0.33 nm for Ar [28], ‘σ’ is the collision cross section which is 0.342 nm for Ar [28], ‘z’ presents the frequency of collision and ‘v’ is the magnitude of average velocity of thermal phonon.
This results in a phonon MFP of 6 nm when the liquid Ar is at 100 K whereas the anomaly in heat capacity starts to be pronounced below h/a = 10.5 i.e., below a liquid Ar film thickness of 6.14 nm. This explains why Cv of nanoconfined liquid deviates from Cv of the bulk liquid after a certain gap thickness.
As soon as h/a becomes closer to a certain critical value at which the maximum heat capacity occurs (denoted by (h/a)*; (h/a) = 7 for Figure 2), ballistic transport starts to dominate across the thin film [31,32]. The Umklapp scattering starts to take the lead over normal scattering of thermal phonons leading to a lower than usual transmission of thermal phonon [33]. Consequently, an increase in Cv of the nanoconfined liquid results in when h/a approaches (h/a)* as depicted in Figure 2.
When the wall separation distance is further lowered beyond the critical gap thickness, some long phonon wavelength propagation modes are suppressed. Joshi and Majumder [34] introduced transient ballistic and diffusive phonon heat transfer for this kind of thin film earlier. The reduced frequency of thermal phonons produces a larger phonon MFP leading to a greater phonon transmission rate [30]. Eventually, Cv of the nanoconfined liquid drops when the film thickness goes beyond the critical gap thickness. Liang and Tsai [22] observed a similar incident in a nanogap confined liquid consisting of a variety of crystalline and liquid thin film.
However, Figure 2 indicates that when h/a < 1.5 i.e., when there is only one nanolayer, heat capacity of the entrapped liquid is lower than its bulk counterpart. Wang et al. [23] have explained it satisfactorily. They reported that for a confined monolayer of liquid, the thermal boundary resistance dropped by one order of magnitude compared to larger gap thickness [23], which was also supported by the earlier works of Liang and Tsai [22] and Cui et al. [35]. A smaller thermal boundary resistance perpetuates easy flow of thermal energy, decreasing its heat capacity compared to the bulk counterpart. Israelachvili and Gourdon [36] explained it in a different fashion. According to their research, when there is only one nanolayer of liquid in the entrapped volume, a structural change of the liquid layer occurs. Depending on the mismatch of the walls and the confined liquid molecules, the liquid film rearranges itself to a ‘structure’ that might be more solid-like, ordered or crystalline in nature. As the heat capacity of the solid is considerably less than its liquid counterpart, heat capacity is observed to drop beyond h/a = 1.5 (gap thickness, h = 0.88 nm).
Nonuniform density distribution primarily contributes to the configurational change of a nanoconfined liquid. The number density profile of liquid Ar as presented in Figure 3b exhibits a strong oscillation of liquid density near the wall extending about 2 nm from the surface of the wall after which nearly constant density of liquid Ar results. This is attributed to the force-field effects of the wall and the local interactions among the liquid atoms [24]. To calculate the number density of liquid Ar, the values have been binned spatially depending on its present coordinates and averaged over longer timescales. Severe density fluctuations result in almost no molecules within a few bins near the confinement.
Many previous MD studies have reported similar behavior where the wall adjacent liquid atoms are absorbed and form an atomic scale nanolayer [22,23,24]. This absorbed liquid layer, with much lower mobility compared to the rest of the liquid molecules, is termed as a ‘Solid-like-liquid’ region as indicated in Figure 3a. Cui et al. [35] have reported an entirely different microstructure of such layers absorbed onto the solid walls compared to the bulk liquid. They showed that these layers were more ordered, and close enough to that of the solid material. The different behaviors of the ‘Solid-like-liquid’ region adjacent to two solid walls (the leftmost and rightmost portions of Figure 3b) can be attributed to the randomly vibrating surrounding liquid molecules, which act as a vibration dampener of these solid-like-liquid molecules.
At lower temperatures, the effect of solid-liquid wall interactions on the dynamics of liquid molecules are non-negligible [31]. The solid-to-liquid phase transition, which takes place within the confined liquid leads to a more intricate phenomena involving the dislocation induced forcing out of the layers [36]. These things play as precursors for the unusual behavior of the heat retaining capability of the confined liquid.
A change in the mode of energy transfer influences the configurational contribution of nanoconfined liquid as all the possible modes of energy transfer (Equation (9)) governs the mobility of its constituent molecules [24].
J y = 1 V [ i ( 1 2 m v i 2 + ϕ i ) v i , y + 1 2 i j > i [ F i j ( v i + v j ) ] y i j ]
where, ‘Jy’ denotes the thermal energy flux of ‘V’ volume of atoms each having velocity ‘vi’ and potential energy ‘φi’, ‘Fij’ represents the force of interactions between atom ‘i’ and ‘j’ separated by a distance ‘yij’.
The equation has two parts. The first part represents the energy transport as a result of molecular motion. The second portion of the equation denotes energy transfer because of the molecular interaction. For a bulk liquid under equilibrium, a molecular interaction governs the energy transfer process, while for a confined liquid the molecular motion dominates the whole process. This was observed in Figure 4a. In stochastic thermodynamics, one approach to quantify the random walks of the molecules is to calculate the self-diffusion coefficient (D). In this work, Einstein’s formula [25] was employed to calculate D using Equation (10).
D = l i m t 1 6 t N i = 1 , N ( | r i ( t ) r i ( 0 ) | 2 )
The entrapped liquid in nanoscale confinement has a lesser value of this self-diffusion coefficient. With the decrease in wall separation distance, its value reduces further as shown in Figure 4b. This is due to the presence of an immobile liquid layer adjacent to the wall surface and strong interaction between the solid and the liquid molecules. Reduction in heat diffusion capability and number of molecules transporting the thermal energy indicates an increase in heat capacity as h/a approaches (h/a)*.
Depending on the size of the confinement, the direction of molecules’ motion changes. Confinement reduces the random walk of the liquid molecules to a guided well-defined path when the size effect comes into being as shown in Figure 5b. Due to a more ordered and structured movement, transportation of heat in confined liquid is lesser than the bulk resulting in an increase in heat capacity of the confined liquid [25].
On a free-standing slab or in a confinement with a larger gap thickness, a guided well-defined path i.e., an increase in Cv could also be expected. However, actually in these cases, Cv remains the same as that of the bulk liquid because the effect of the slab or confinement is actually nullified by the natural tendency of the liquid molecules to follow a disordered path within their unconstrained larger portions. Figure 5a,c supports this hypothesis.
The simultaneous contribution of all these parameters plays the key role for increasing the heat capacity at a nanometer length scale.

3.2. Effect of Temperature on Heat Capacity

The variation of heat capacity (Cv) with the confinement gap thickness (h) has been extended from 100 K to 140 K. This range is selected to ensure a subcooled liquid phase considering the critical temperature of Ar to be 150.687 K at a density of 1320 kg/m3 [37]. The observed results represent the effect of nanogap confinement on heat capacity, which is valid up to a specific range of gap thickness that is strongly a function of temperature of the entrapped liquid beyond which Cv of the nanogap confined liquid approximates to Cv of the bulk liquid. As an example, the unusual behavior of the heat capacity occurs up to h/a ∼ 10.5, 8.0 and 6.0 for T = 100 K, 110 K and 120 K respectively as observed in Figure 2 and Figure 6. For T = 130 K and 140 K, this variation of Cv is observed up to h/a ∼ 5.5 as can be seen from Figure 6. This leads to the conclusion that as the temperature increases, the range of gap thickness where the unusual behavior of heat capacity takes place gets narrower. Additionally, from Figure 6, it is evident that for all these cases, when h/a < 1.5, lower than usual value of the heat capacity occurs which was explained earlier.
Figure 7 illustrates that heat capacity of a nanoconfined liquid that shows distinct peaks at different temperatures that move to lower liquid film thickness at a higher temperature. Analogous behavior of nanoconfined water was reported earlier [38] where the distinct peaks of C p = d H d T of the confined water was found to move to a lower temperature on compression which was attributed to the structural transformation into a four-coordinated liquid [38]. For instance, Figure 7a shows that Cv,max occurs at h/a ∼ 7.0, 5.5, 4.0, 3.5 and 3.0 for T = 100 K to 140 K indicating that for a higher temperature, Cv,max occurs at a lower film thickness. From Figure 2 and Figure 6, it is evident that the maximum value of heat capacity is 44.36, 33.4387, 29.71, 27.68 and 26.57 J/mol.K for T = 100 K to 140 K. This leads to the hypothesis that the higher the temperature of the confined liquid, the lower the value of its maximum heat capacity.
Another significant finding is that although the range of gap thickness where Cv of nanoconfined liquid is greater than its bulk counterpart and the maximum heat capacity (Cv,max) is a function of temperature, in all the cases, the positive and negative slopes were almost equal in magnitude as illustrated in Figure 7. This actually proposes that up to a critical value of the h/a ratio, denoted as (h/a)*, the change in heat capacity is independent of the gap thickness.
The simultaneous effects of factors like—higher phonon transport, premature damping of the density oscillation, increased heat carrying molecules in the liquid region, enhanced molecular mobility, change in thermal resistance, etc. govern this temperature-dependent heat capacity of the nanoconfined liquid.
A higher temperature leads to a higher rate of transport of thermal phonons [32]. These phonons are associated with lesser frequencies i.e., the transport moves to the ballistic regime with higher wavelengths [39]. This results in an easier thermal transport and consequently a lower heat capacity at higher temperatures.
Density oscillation is affected by the variation of liquid temperature [24]. Figure 8a shows that the oscillation in liquid’s density relaxes quickly when the temperature is higher, which eventually increases the number of liquid molecules in the liquid region. As a result, at higher temperatures, the liquid has a lower than usual heat capacity [24].
Heat, temperature and the motion of molecules, are all inter-related. The addition of thermal energy causes faster vibration of the atoms and molecules in a substance. Mean squared displacement (MSD) is a measure of the spatial extent of this stochastic random movement [24] that is usually expressed in the generic formula as in Equation (11),
M S D ( τ ) = Δ r ( τ ) 2 = [ r ( t + τ ) r ( t ) ] 2
where, 〈r(t)〉 is the ensemble average of the position at time t and τ is the lag time.
The variation of MSD per unit time with temperature of the confined liquid is depicted in Figure 9. It is evident that as the temperature increases, the slope becomes steeper. We relate the increase in MSD to the enhanced transportation of thermal energy of the confined liquid [25] resulting in a decrease in heat capacity with the increasing temperature.
During the flow of thermal energy from a solid to liquid or vice versa, at the junction, a thermal resistance is generated owing to interfacial phonon scattering. This interfacial thermal resistance (ITR) is known as Kapitza resistance [24]. ITR primarily depends on factors like the solid–liquid interaction strength, mismatch of thermal phonons’ vibration of the two sides, wettability of the mating surface and temperature at the interface [24,40]. It is observed in Figure 10a that ITR has a negative power-law relationship with temperature, RITR = 133.7 T−0.77. Such a phenomenon is supported by numerous earlier studies [24,41,42]. Previously Song and Min [41] showed that the ITR reduces with temperature in the form of RITRTα irrespective of the interface where ‘α’ is any nonzero positive number. This points out that with the increase in temperature, ITR decreases. This in turns allows easy transportation of thermal energy. As a result, the heat carrying capability of the medium decreases. It is evident from Figure 10b. However, this overall reduction of ITR is a function of the gap thickness. For example, when h/a = 4.0 i.e., h = 2.34 nm, ITR varies with T as a power of −0.90. However, when h/a = 25.0 i.e., h = 14.63 nm, ITR decreases as a power of −0.38. When the overall thermal resistance becomes lower, thermal energy transportation becomes easier. As a result, when the gap thickness is small, a lower temperature produces an enhanced heat capacity of the liquid.

3.3. Relation among Gap Thickness, Temperature and Heat Capacity

In general, both the confinement gap thickness (h) and temperature (T) affect the heat capacity of a confined liquid. As observed in Figure 11, the effect of confinement is valid up to a certain range of gap thickness which directly depends on temperature. Within this thickness band, confinement enhances heat capacity. Beyond this band, heat capacity of the confined liquid resembles its bulk counterpart. The effect of temperature is to decrease the heat capacity irrespective of gap thickness although its sensitivity is highly dependent on gap thickness.

3.4. Maximum Heat Capacity of the Confined Liquid

Relation between Gap Thickness and Temperature for Maximum Heat Capacity

As the maximum value of heat capacity (Cv,max) is occasionally of great interest in many physical processes, it is investigated separately. Actually, maximum heat capacity, the temperature and gap thickness at which it occurs–all are correlated. Maximum heat capacity occurs only at some specific gap thickness and temperature of the confined liquid as is presented in Figure 12a beyond which heat capacity deviates from its maximum value. This one leads to an anticipation that the temperature and gap thickness at which maximum heat capacity occurs for a nanogap confined liquid are correlated. As observed from Figure 12b, the temperature at which Cv,max occurs varies with gap thickness following a power law, TCv,max = 193.4(h/a)−0.3431. However, for the bulk liquid, it is only the temperature that influences its heat capacity and there is no influence of liquid film thickness on heat capacity of the bulk liquid.

4. Conclusions

This research work investigate the size and thermal effects on constant volume heat capacity (Cv) of nanogap confined liquid using equilibrium molecular dynamics simulation and a specified solid–liquid model. Key findings of the molecular simulations are:
  • Nanoconfinement increases the heat capacity of the liquid within a specific range of gap thickness and temperature beyond which heat capacity of the confined liquid approaches to that of its bulk counterpart. Dependence of heat capacity on pore size and temperature was reported earlier for different fluids including water, hydrogen, deuterium, etc. confined in cylindrical nanopores [12,16,20,38].
  • For a fixed temperature, as the gap thickness increases beyond one atomic layer, the heat capacity increases dramatically at first; reaches a maximum value at some specified gap thickness and eventually decreases to align to that of the bulk liquid;
  • This specific range of gap thickness depends directly on temperature. This range gets narrower with the increase in temperature;
  • Maximum heat capacity, gap thickness and temperature all are correlated. The temperature at which maximum heat capacity occurs for a nanoconfined liquid is observed to vary with gap thickness following the power law, T C v , m a x = 190.7 ( h a ) 0.3345 ;
  • The broad maximum in Cv against h/a plot for nanoconfined liquid shifts to a lower value at higher temperature i.e., the more the temperature of the confined liquid, the lower the value of its maximum heat capacity;
  • A heat capacity, almost two times larger than its bulk counterpart, is achievable for a predefined gap thickness and temperature (Cv,nc ≈ 2.3 × Cv,bulk for h = 4.1 nm and T = 100 K);
  • The enhanced heat capacity is attributed to the simultaneous effects of configurational and non-configurational contributions of the confined liquid.

Supplementary Materials

The following are available online at https://www.mdpi.com/2227-9717/8/4/459/s1, Figure S1: Physical State of the fluid, Figure S2: Equilibrium State of the fluid, Figure S3: Validation of the method used.

Author Contributions

Conceptualization, A.K.M.M.M.; Methodology, R.M.; Software, R.M.; Validation, R.M., A.K.M.M.M., and T.C.P.; Formal Analysis, R.M., A.K.M.M.M. and T.C.P.; Investigation, R.M.; Writing-Original Draft Preparation, R.M.; Writing-Review & Editing, A.K.M.M.M., T.C.P. and R.M.; Supervision, A.K.M.M.M. All authors have read and agreed to the published version of the manuscript.

Funding

This research received no external funding.

Acknowledgments

The authors would like to thank the Department of Mechanical Engineering, Bangladesh University of Engineering & Technology (BUET) for providing the necessary academic support.

Conflicts of Interest

The authors declare no conflict of interest.

References

  1. Shi, L.; Dames, C.; Lukes, J.R.; Reddy, P.; Duda, J.; Cahill, D.G.; Lee, J.; Marconnet, A.; Goodson, K.E.; Bahk, J.-H.; et al. Evaluating Broader Impacts of Nanoscale Thermal Transport Research. Nanoscale Microscale Thermophys. Eng. 2015, 19, 127–165. [Google Scholar] [CrossRef]
  2. Mosaddeghi, H.; Alavi, S.; Kowsari, M.H.; Najafi, B. Simulations of structural and dynamic anisotropy in nano-confined water between parallel graphite plates. J. Chem. Phys. 2012, 137, 184703. [Google Scholar] [CrossRef]
  3. Solveyra, E.G.; De La Llave, E.; Molinero, V.; Illia, G.J.S.; Scherlis, D.A. Structure, Dynamics, and Phase Behavior of Water in TiO2 Nanopores. J. Phys. Chem. C 2013, 117, 3330–3342. [Google Scholar] [CrossRef]
  4. Köhler, M.; Bordin, J.R.; Da Silva, L.B.; Barbosa, M.C. Structure and dynamics of water inside hydrophobic and hydrophilic nanotubes. Phys. A Stat. Mech. Its Appl. 2018, 490, 331–337. [Google Scholar] [CrossRef]
  5. Nomura, K.; Kaneko, T.; Bai, J.; Francisco, J.S.; Yasuoka, K.; Zeng, X.C. Evidence of low-density and high-density liquid phases and isochore end point for water confined to carbon nanotube. Proc. Natl. Acad. Sci. USA 2017, 114, 4066–4071. [Google Scholar] [CrossRef] [Green Version]
  6. Han, S.; Choi, M.; Kumar, P.; Stanley, H.E. Phase transitions in confined water nanofilms. Nat. Phys. 2010, 6, 685–689. [Google Scholar] [CrossRef] [Green Version]
  7. Gautam, S.; Liu, T.; Patankar, S.; Tomasko, D.; Cole, D. Location dependent orientational structure and dynamics of ethane in ZSM5. Chem. Phys. Lett. 2016, 648, 130–136. [Google Scholar] [CrossRef] [Green Version]
  8. Dhiman, I.; Bhowmik, D.; Shrestha, U.R.; Cole, D.; Gautam, S. Effect of molecular shape on rotation under severe confinement. Chem. Eng. Sci. 2018, 180, 33–41. [Google Scholar] [CrossRef]
  9. Calvo-Schwarzwälder, M.; Hennessy, M.G.; Torres, P.; Myers, T.; Alvarez, F. A slip-based model for the size-dependent effective thermal conductivity of nanowires. Int. Commun. Heat Mass Transf. 2018, 91, 57–63. [Google Scholar] [CrossRef]
  10. Avramov, I.; Michailov, M. Specific heat of nanocrystals. J. Phys. Condens. Matter 2008, 20, 295224. [Google Scholar] [CrossRef]
  11. Bolmatov, D.; Brazhkin, V.V.; Trachenko, K. The phonon theory of liquid thermodynamics. Sci. Rep. 2012, 2, 421. [Google Scholar] [CrossRef] [PubMed]
  12. Tombari, E.; Salvetti, G.; Ferrari, C.; Johari, G.P. Heat capacity of water in nanopores. J. Chem. Phys. 2005, 123, 214706. [Google Scholar] [CrossRef]
  13. Nagoe, A.; Kanke, Y.; Oguni, M.; Namba, S. Findings of C p Maximum at 233 K for the Water within Silica Nanopores and Very Weak Dependence of the T max on the Pore Size. J. Phys. Chem. B 2010, 114, 13940–13943. [Google Scholar] [CrossRef] [PubMed]
  14. Leng, Y. Hydration force and dynamic squeeze-out of hydration water under subnanometer confinement. J. Phys. Condens. Matter 2008, 20, 354017. [Google Scholar] [CrossRef]
  15. Sengers, J.V.; Klein, M. The technological importance of accurate thermophysical property information. In The Technological Importance of Accurate Thermophysical Property Information; Nat. Bur. Stand. (U.S.), Special Publication 590; U.S. Government Print: Washington, DC, USA, 1980. [Google Scholar]
  16. Bianco, V.; Franzese, G. Critical behavior of a water monolayer under hydrophobic confinement. Sci. Rep. 2014, 4, 4440. [Google Scholar] [CrossRef] [PubMed] [Green Version]
  17. Tombari, E.; Salvetti, G.; Ferrari, C.; Johari, G.P. Thermodynamic functions of water and ice confined to 2 nm radius pores. J. Chem. Phys. 2005, 122, 104712. [Google Scholar] [CrossRef] [PubMed]
  18. Mochizuki, K.; Koga, K. Solid-liquid critical behavior of water in nanopores. Proc. Natl. Acad. Sci. USA 2015, 112, 8221–8226. [Google Scholar] [CrossRef] [PubMed] [Green Version]
  19. Abbaspour, M.; Akbarzadeh, H.; Salemi, S.; Jalalitalab, E. Density-dependent phase transition in nano-confinement water using molecular dynamics simulation. J. Mol. Liq. 2018, 250, 26–34. [Google Scholar] [CrossRef]
  20. Kucheyev, S.O.; Lenhardt, J.M. Freezing Hydrogen in Nanoconfinement. Fusion Sci. Technol. 2018, 73, 293–297. [Google Scholar] [CrossRef]
  21. Van Cleve, E.; Worsley, M.A.; Kucheyev, S.O. Liquid–solid phase transition of hydrogen and deuterium in silica aerogel. J. Appl. Phys. 2014, 116, 163517. [Google Scholar] [CrossRef]
  22. Liang, Z.; Tsai, H.-L. Effect of molecular film thickness on thermal conduction across solid-film interfaces. Phys. Rev. E 2011, 83, 061603. [Google Scholar] [CrossRef] [PubMed] [Green Version]
  23. Wang, X.; Cheng, P.; Quan, X. Molecular dynamics simulations of thermal boundary resistances in a liquid between two solid walls separated by a nano gap. Int. Commun. Heat Mass Transf. 2016, 77, 183–189. [Google Scholar] [CrossRef]
  24. Morshed, A.M.; Paul, T.C.; Khan, J.A. Atomistic simulation of temperature dependent thermal transport across nanoconfined liquid. Phys. E Low-Dimens. Syst. Nanostruct. 2013, 47, 246–251. [Google Scholar] [CrossRef]
  25. Allen, M.P.; Tildesley, D.J. Computer Simulation of Liquids; Clarendon Press: New York, NY, USA; Oxford University Press: Oxford, UK, 1987. [Google Scholar]
  26. Plimpton, S. Computational limits of classical molecular dynamics simulations. Comput. Mater. Sci. 1995, 4, 361–364. [Google Scholar] [CrossRef]
  27. Stukowski, A. Visualization and analysis of atomistic simulation data with OVITO–the Open Visualization Tool. Model. Simul. Mater. Sci. Eng. 2009, 18, 15012. [Google Scholar] [CrossRef]
  28. Ladd, M. Introduction to Physical Chemistry; Cambridge University Press (CUP): Cambridge, UK, 1998. [Google Scholar]
  29. Iacobazzi, F.; Milanese, M.; Colangelo, G.; Lomascolo, M.; De Risi, A. An explanation of the Al2O3 nanofluid thermal conductivity based on the phonon theory of liquid. Energy 2016, 116, 786–794. [Google Scholar] [CrossRef]
  30. Li, X. Phonon Transport across Dissimilar Material Interfaces and in Nanostructured Materials. Ph.D. Thesis, University of Colorado Boulder, Boulder, CO, USA, April 2012. [Google Scholar]
  31. Shchepetov, A.; Prunnila, M.; Alzina, F.; Schneider, L.; Cuffe, J.; Jiang, H.; Kauppinen, E.I.; Torres, C.M.S.; Ahopelto, J. Ultra-thin free-standing single crystalline silicon membranes with strain control. Appl. Phys. Lett. 2013, 102, 192108. [Google Scholar] [CrossRef] [Green Version]
  32. Marconnet, A.; Asheghi, M.; Goodson, K.E. From the Casimir Limit to Phononic Crystals: 20 Years of Phonon Transport Studies Using Silicon-on-Insulator Technology. J. Heat Transf. 2013, 135, 061601. [Google Scholar] [CrossRef] [Green Version]
  33. Li, D.; Wu, Y.; Kim, P.; Shi, L.; Yang, P.; Majumdar, A. Thermal conductivity of individual silicon nanowires. Appl. Phys. Lett. 2003, 83, 2934–2936. [Google Scholar] [CrossRef]
  34. Joshi, A.A.; Majumdar, A. Transient ballistic and diffusive phonon heat transport in thin films. J. Appl. Phys. 1993, 74, 31–39. [Google Scholar] [CrossRef]
  35. Cui, W.; Shen, Z.; Yang, J.; Wu, S. Molecular dynamics simulation on the microstructure of absorption layer at the liquid–solid interface in nanofluids. Int. Commun. Heat Mass Transf. 2016, 71, 75–85. [Google Scholar] [CrossRef]
  36. Israelachvili, J. LIQUIDS: Putting Liquids under Molecular-Scale Confinement. Science 2001, 292, 867–868. [Google Scholar] [CrossRef]
  37. Thermophysical Properties. Available online: http://webbook.nist.gov/cgi/fluid.cgi?ID=C7440371&Action=Page (accessed on 11 April 2017).
  38. Xu, L.; Molinero, V. Is There a Liquid–Liquid Transition in Confined Water? J. Phys. Chem. B 2011, 115, 14210–14216. [Google Scholar] [CrossRef] [PubMed]
  39. McNutt, N.W.; Wang, Q.; Rios, O.; Keffer, D.J. Entropy-driven structure and dynamics in carbon nanocrystallites. J. Nanopart. Res. 2014, 16. [Google Scholar] [CrossRef]
  40. Shao, C.; Bao, H. A molecular dynamics investigation of heat transfer across a disordered thin film. Int. J. Heat Mass Transf. 2015, 85, 33–40. [Google Scholar] [CrossRef]
  41. Song, G.; Min, C. Temperature dependence of thermal resistance at a solid/liquid interface. Mol. Phys. 2013, 111, 903–908. [Google Scholar] [CrossRef]
  42. Gorelli, F.A.; Bryk, T.; Krisch, M.; Ruocco, G.; Santoro, M.; Scopigno, T. Dynamics and Thermodynamics beyond the critical point. Sci. Rep. 2013, 3, 1203. [Google Scholar] [CrossRef]
Figure 1. Atomistic model of the simulation domain.
Processes 08 00459 g001
Figure 2. Variation of heat capacity of nanoconfined liquid at different gap thickness (T = 100 K).
Processes 08 00459 g002
Figure 3. (a) The ’Solid-like-liquid’ region (Rendered from xz plane for gap thickness, h = 2 nm) (b) Number density distribution of the nanoconfined liquid.
Processes 08 00459 g003
Figure 4. (a) Contribution of molecular motion in total energy transfer, and (b) diffusion coefficient of entrapped liquid under varying thickness and constant temperature.
Processes 08 00459 g004
Figure 5. Trajectory of molecules’ displacement (T = 100 K) at a predefined time interval (Frame interval 0 to 1000) (a) Nanogap confined liquid with h/a = 12.5 i.e., h = 7.3 nm. (b) Nanogap confined liquid with h/a = 3.0 i.e., h = 1.8 nm. (c) Bulk liquid.
Processes 08 00459 g005
Figure 6. Heat capacity of nanoconfined liquid as a function of gap thickness at various temperatures (110 K to 140 K).
Processes 08 00459 g006
Figure 7. Size and temperature effect on heat capacity of nanogap confined liquid. (a) Actual, (b) normalized.
Processes 08 00459 g007
Figure 8. For different system temperatures (a) density profile of the liquid Ar near the Cu wall, (b) density profile of the liquid Ar far from the Cu wall.
Processes 08 00459 g008
Figure 9. Mean squared displacement of entrapped liquid Ar as a function of temperature.
Processes 08 00459 g009
Figure 10. Temperature dependence of (a) interface thermal resistance, (b) overall thermal resistance.
Processes 08 00459 g010
Figure 11. Heat capacity as a function of gap thickness and temperature.
Processes 08 00459 g011
Figure 12. (a) Combined effect of gap thickness and temperature for maximum heat capacity of nanoconfined liquid. (b) Relation between temperature and gap thickness for maximum heat capacity.
Processes 08 00459 g012
Table 1. Lennard-Jones interaction parameters.
Pair Interaction ϵ i j ( J ) σ i j ( nm )
Liquid-Liquid1.67 × 10−210.3405
Solid-Solid6.59 × 10−200.2340

