1. Introduction
Mammalian cell cultures have been widely studied over the last few decades [
1]. Currently, this technology is commonly used in order to synthesize various products of interest such as monoclonal antibodies (Mabs), proteins, vaccines, etc. [
2,
3]. In this context, the health authorities, as well as both the industrial and scientific communities aim at developing these cultures towards continuous and integrated operations [
4,
5,
6,
7]. The Food and Drug Administration (FDA) has developed a regulatory guidance called Process Analytical Technology (PAT) to “encourage the development and implementation of innovative pharmaceutical development, manufacturing, and quality assurance” and recognizes “the capability of process control strategies to prevent or mitigate the risk of producing a poor quality product” [
8]. Nevertheless, the control of cell cultures usually requires on-line probes, as well as a priori process knowledge under the form of mathematical models [
9]. Since a complete bioreactor instrumentation and the knowledge of reliable dynamic models are difficult to achieve in practice, the successful implementation of control strategies highly depends on the possibility to infer on-line information using robust software sensors and to control the process without explicitly requiring a detailed model and the delicate identification of its (possibly numerous) parameters.
Depending on the process inputs and outputs, different operation modes can be defined [
6,
10]. In batch culture (no input and no output), biomass growth develops until limitation and/or inhibition effects occur due to substrate depletion and/or a high concentration of inhibitory metabolites. In fed-batch processes, highly concentrated fresh medium is fed into the vessel in order to avoid substrate limitation and therefore support growth and production rates, increasing the culture volume over time. The operation lasts longer than in a simple batch process and can lead to high biomass concentrations and/or harvest rates [
11]. In continuous mode, “spent” medium can be continuously withdrawn. A popular operation is the chemostat, where fresh medium is fed at the same rate so that the bioreactor volume remains constant [
12]. In perfusion, the medium withdrawal is performed sequentially through a filtration device that allows retaining the biomass inside the culture vessel and reaching high cell densities [
2,
13,
14].
Continuous perfusion cultures are MIMO systems, which can be controlled via the dilution and perfusion rates. However, very few experimental implementations and validations of such control strategies have been reported in the open literature and are mostly based on SISO approaches, e.g., [
15,
16]. On the other hand, several simulation studies investigate the use of several manipulated variables (feed, perfusion, and bleed streams) to control biomass and metabolite concentrations simultaneously at suitable levels. For instance, the work in [
17] proposed an adaptive back-stepping control strategy based on a simple model to achieve this objective, and the work in [
18] developed a multivariable nonlinear predictive control based on a more realistic model.
Apparently, there is a gap between theory and industrial practice, which is explained by the difficulty in establishing reliable dynamic process models in a reasonable time span and with reasonable costs. Indeed, the metabolism of animal cells cultivated in bioreactors is complex and influenced by several mechanisms of metabolite activation, limitation, and inhibition, whose description is challenging. Furthermore, time and expertise are also needed to exploit the measurement information of the on-line and at-line sensors fully in an advanced control strategy.
With these challenges in view, we proposed in [
19] an original cascade control structure to regulate biomass and glucose concentrations at the desired levels. The motivation behind this structure is that biomass is a key indicator of the bioproduction, while glucose is a key indicator of the actual consumption of the culture medium. Adjusting these key variables would in principle allow regulating the bioproduction, while ensuring an efficient use of the culture medium. Indeed, manual operation of a continuous bioreactor could lead to a large amount of unspent medium wasted in the outflow. In this cascade structure, the inner loop implements a feedback linearization [
20,
21] using on-line estimates of the biomass growth rate and the glucose uptake rate. As the kinetics are hard to model accurately since they might involve various highly nonlinear phenomena (also triggered by unmeasured metabolites), they are preferably represented (or lumped) as time-varying parameters that can be reconstructed using adequate on-line estimation schemes. The linearized process can then be controlled by a relatively simple outer loop using PI controllers with autotuning [
22]. The cascade structure inherently provides increased robustness to perturbation and unmodeled dynamics [
23]. PID controllers are straightforward to implement in an industrial context and are widely accepted. The remaining challenge is to avoid the requirement of an accurate process model to estimate the biomass growth rate and the glucose uptake rate, as would be the case in model-based control strategies such as model predictive control (MPC) [
24]. Indeed, establishing a model requires experimental data, and in turn the realization of dedicated experiments, which are time- and resource-consuming. Moreover, the inherent model uncertainty, linked to the choice of a particular model structure and the parameter estimation errors, often entails the use of robust or adaptive control policies. In this work, this problem is alleviated using sliding mode observers [
25] that do not rely on any prior knowledge.
The proposed cascade strategy was extensively tested in simulation in [
19] using a nonlinear dynamic model to emulate the reality. The next logical step is the implementation of the strategy in a real-life bioprocess, and it is precisely the purpose of this article to report on the experimental validation of the former promising results on a lab-scale bioreactor. To this end, cultures of HEK cells are performed in perfusion mode, and various tests are performed to challenge and validate the controller. This experimental investigation leads to several modifications of the original scheme, notably the use of two glucose feeds with different concentration so as to improve process operability. This paper also shares practical details regarding the real-time implementation and various issues that occurred in the course of this experimental study.
The paper is organized as follows. The next section presents the principles of the original algorithm developed in [
19] and introduces the improvements that are brought to the algorithm.
Section 3 presents a model used in simulation to compare the efficiency of both the control versions and to set up the different parameters of the controllers.
Section 4 provides the reader with technical information about the culture conditions, but also about the materials used to achieve the experiment. Experimental results are presented and discussed in
Section 5. Conclusions and perspectives are drawn in the last section.
2. Cascade Control Strategy
The distinctive feature of our control strategy [
19] is to allow controlling independently biomass and glucose at specific setpoints during the course of the culture, the underlying idea being that cell density is related to the productivity objective, whereas glucose concentration is linked to the consumption of the culture medium. The latter could be a secondary objective, i.e., to achieve the targeted production while minimizing in some sense the waste of unused nutrients in the culture medium.
To meet these objectives, several manipulated variables are required (see
Figure 1), e.g., the perfused stream (
), which is ideally cell-free (assuming an ideal filtration device), and the bleed stream (
). The volume of the bioreactor is kept constant during the whole culture, such that the flow entering the vessel (
) must be equal to the one exiting the reactor (
), i.e.,
with the dilution rates defined as:
and the system dynamics is given by:
where
X and
represent the biomass and glucose concentrations,
is the biomass specific growth rate, and
the specific glucose consumption rate, both depending on the substrate
and product
concentration vectors. These variables represent the possibly limiting elements of the culture medium (for instance, glutamine), as well as the possibly inhibiting byproducts (for instance, lactate).
and
are nonlinear functions of these variables, which usually require some significant modeling efforts to be derived and validated, but in the framework of this study, we do not assume any prior knowledge or modeling effort.
The outlet flows are naturally constrained, imposing a dilution limit
, such as:
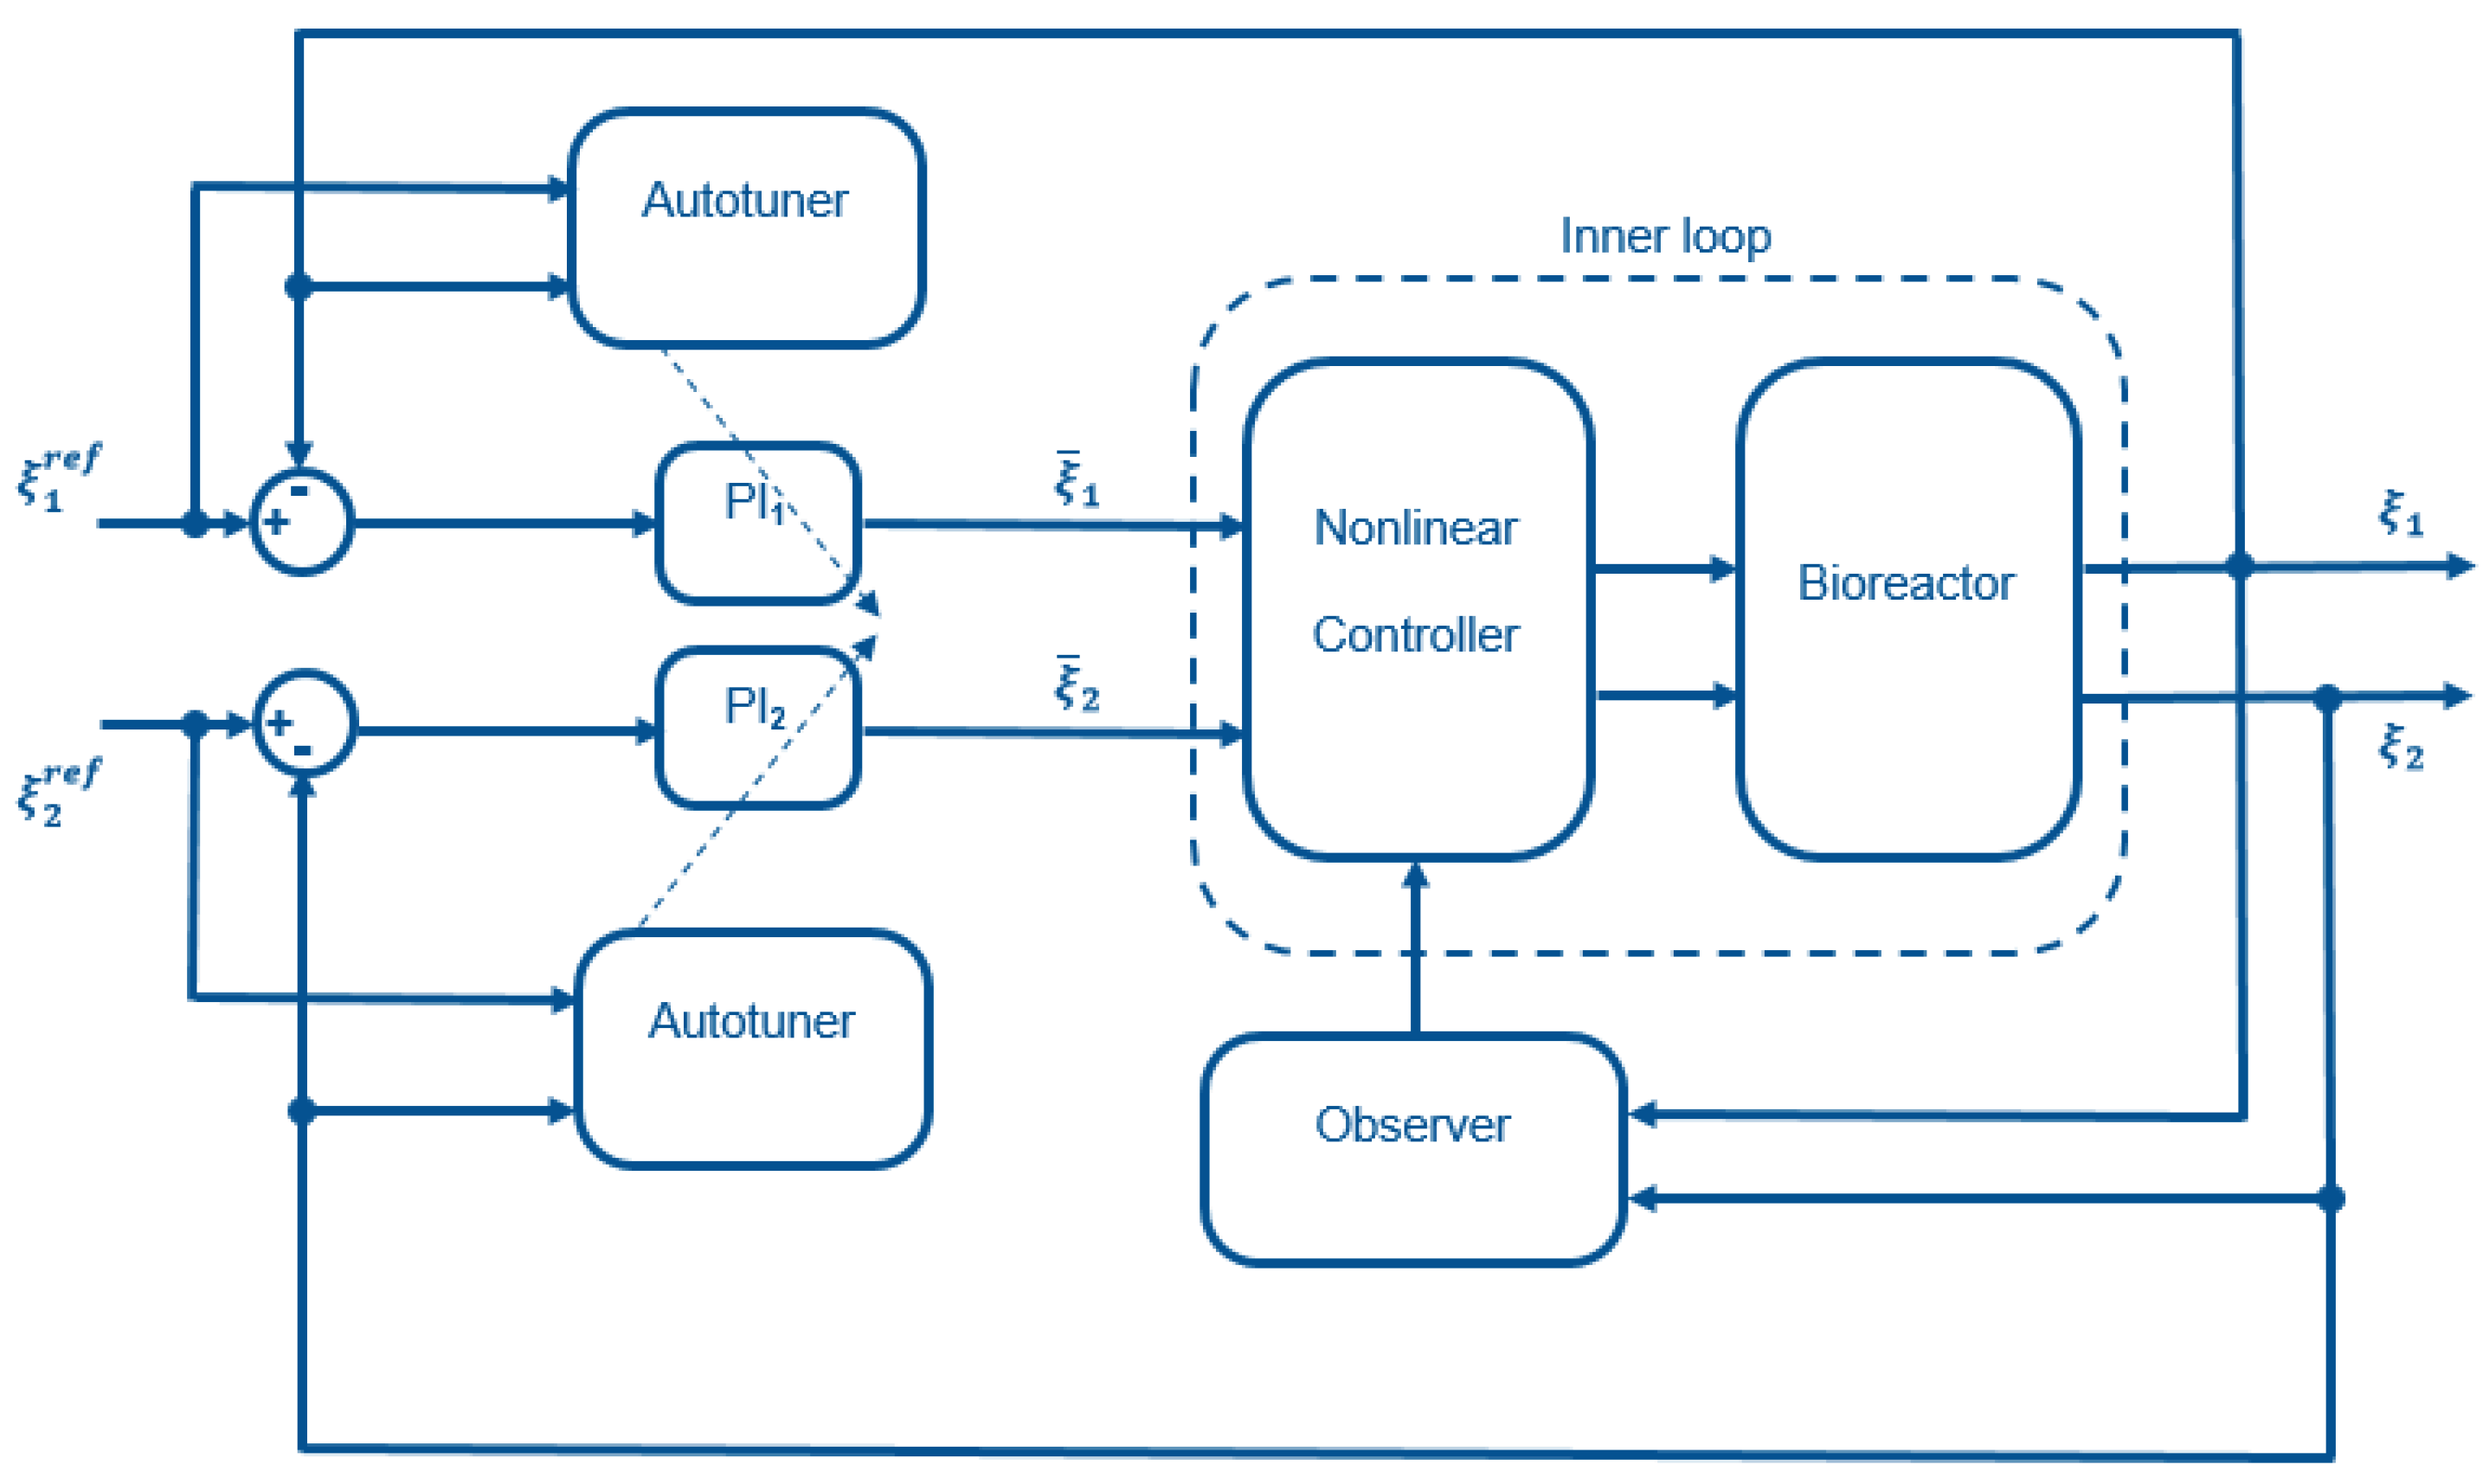
The cascade control structure (see
Figure 2) uses feedback linearization in the inner loop and simple decentralized PI controllers in the outer loop. To ensure plug and play operation, an autotuner can be added to the structure. The different controller components are described in the following.
2.1. Inner Loop: Feedback Linearization
In order to cope with the nonlinearities of System (
3), a classical approach [
10] is to use a nonlinear controller applying the following dilution rates:
so as to linearize System (
3) and impose the following dynamics:
where
and
are the design parameters of the nonlinear controller and variables
and
in (
5) are the PI controller outputs, which are described in more detail in an upcoming subsection.
This feedback linearization is only possible in two conditions:
The kinetic laws
and
are known or estimated. To avoid significant modeling efforts, this task will be achieved using Sliding Mode Observers (SMOs) as detailed in
Section 2.2.
The dilution rates calculated in Equation (
5) do not exceed the ranges defined in Equation (
4). If actuator saturation occurs, then feedback linearization is no longer effective. To alleviate this issue, it would be possible to apply an anti-windup strategy as proposed in [
26,
27]. In this study, we opt for another solution, which consists of avoiding the actuator saturation by varying the inlet substrate concentration. As the dilution rate is limited by physical constraints on the pump, an additional degree of freedom is indeed provided by the inlet concentration
. This concentration can be modulated using two feeding tanks, one with a low concentration and the other with a high concentration. This feeding strategy has additional advantages, which are detailed in
Section 2.4.
2.2. Estimation of the Kinetic Rates Using Sliding Mode Observers
The algorithm presented in [
25] is used to estimate the net growth rate and the glucose consumption rate based on the on-line measurements of biomass and glucose concentrations. This task is achieved using an on-line analyzer as described in the section dedicated to the experimental study.
The estimation of the two rates requires the design of of two distinct second-order SMOs. Each design is based on the consideration of a dynamic system (or subsystem) in the generic form [
28]:
The rates
and
are reconstructed in finite time with the following two SMOs:
with
and
, i.e., the structure of the kinetics is unknown, but an upper bound on the time variation is required.
In the first SMO, is a biomass estimate, while provides an estimate of the growth rate . is the biomass prediction error signal. and are observer parameters.
The second SMO has some specific features. While
is an estimate of the glucose concentration,
is an estimate of the kinetic signal
, which is not a direct estimate of glucose uptake rate
, but an image of it through the relation
(see the details in [
28]). Again,
is a prediction error signal, and
and
are observer parameters.
2.3. Outer Loop: PI Controllers
Two PI controllers are designed in order to track setpoint changes and to eliminate disturbances acting on the process. Their outputs constitute the inner-loop inputs and .
Using the notation
and
, the discrete-time control outputs are given by:
where
and
respectively represent the proportional gains and integral time constants,
is the sampling time,
are the setpoint deviations, and
k is the discrete time index (
).
An anti-windup mechanism is included (see for instance the book [
29] for an introduction to PID control and anti-windup), which consists of increasing the setpoint deviation at time
with the scaled difference between the admissible control
and the computed control
. Equation (
10) is therefore transformed into:
with:
As the process linearization carried out in the inner loop is not perfect, the PI parameters are not fixed for the whole course of the experiment, but adaptation is allowed using a Receding Horizon Optimization (RHO). A discrete-time representation of the inner loop (basically given by the discretization of Reference Model (
6)) is used to predict the future measurements over a horizon
,
, and the PI parameters are obtained by minimizing:
where
.
In order to avoid unnecessary computational efforts, parameter adaptation can be triggered when the setpoint deviations become larger than a specified threshold or in anticipation of a substantial reference change.
The reader is referred to [
19] for more details.
2.4. Additional Control Actions
With respect to the original control structure, two modifications of the control actions have been introduced as a result of the experimental observations:
The addition of an extra feed input has several advantages:
It improves process operability, i.e., when only one feed is available and when the bleed rate
calculated at time
k to control the biomass is larger than the global dilution rate
D, a compromise needs to be reached. Either
must be reduced to the value of
D or
D must be increased up to
, meaning that either
X or
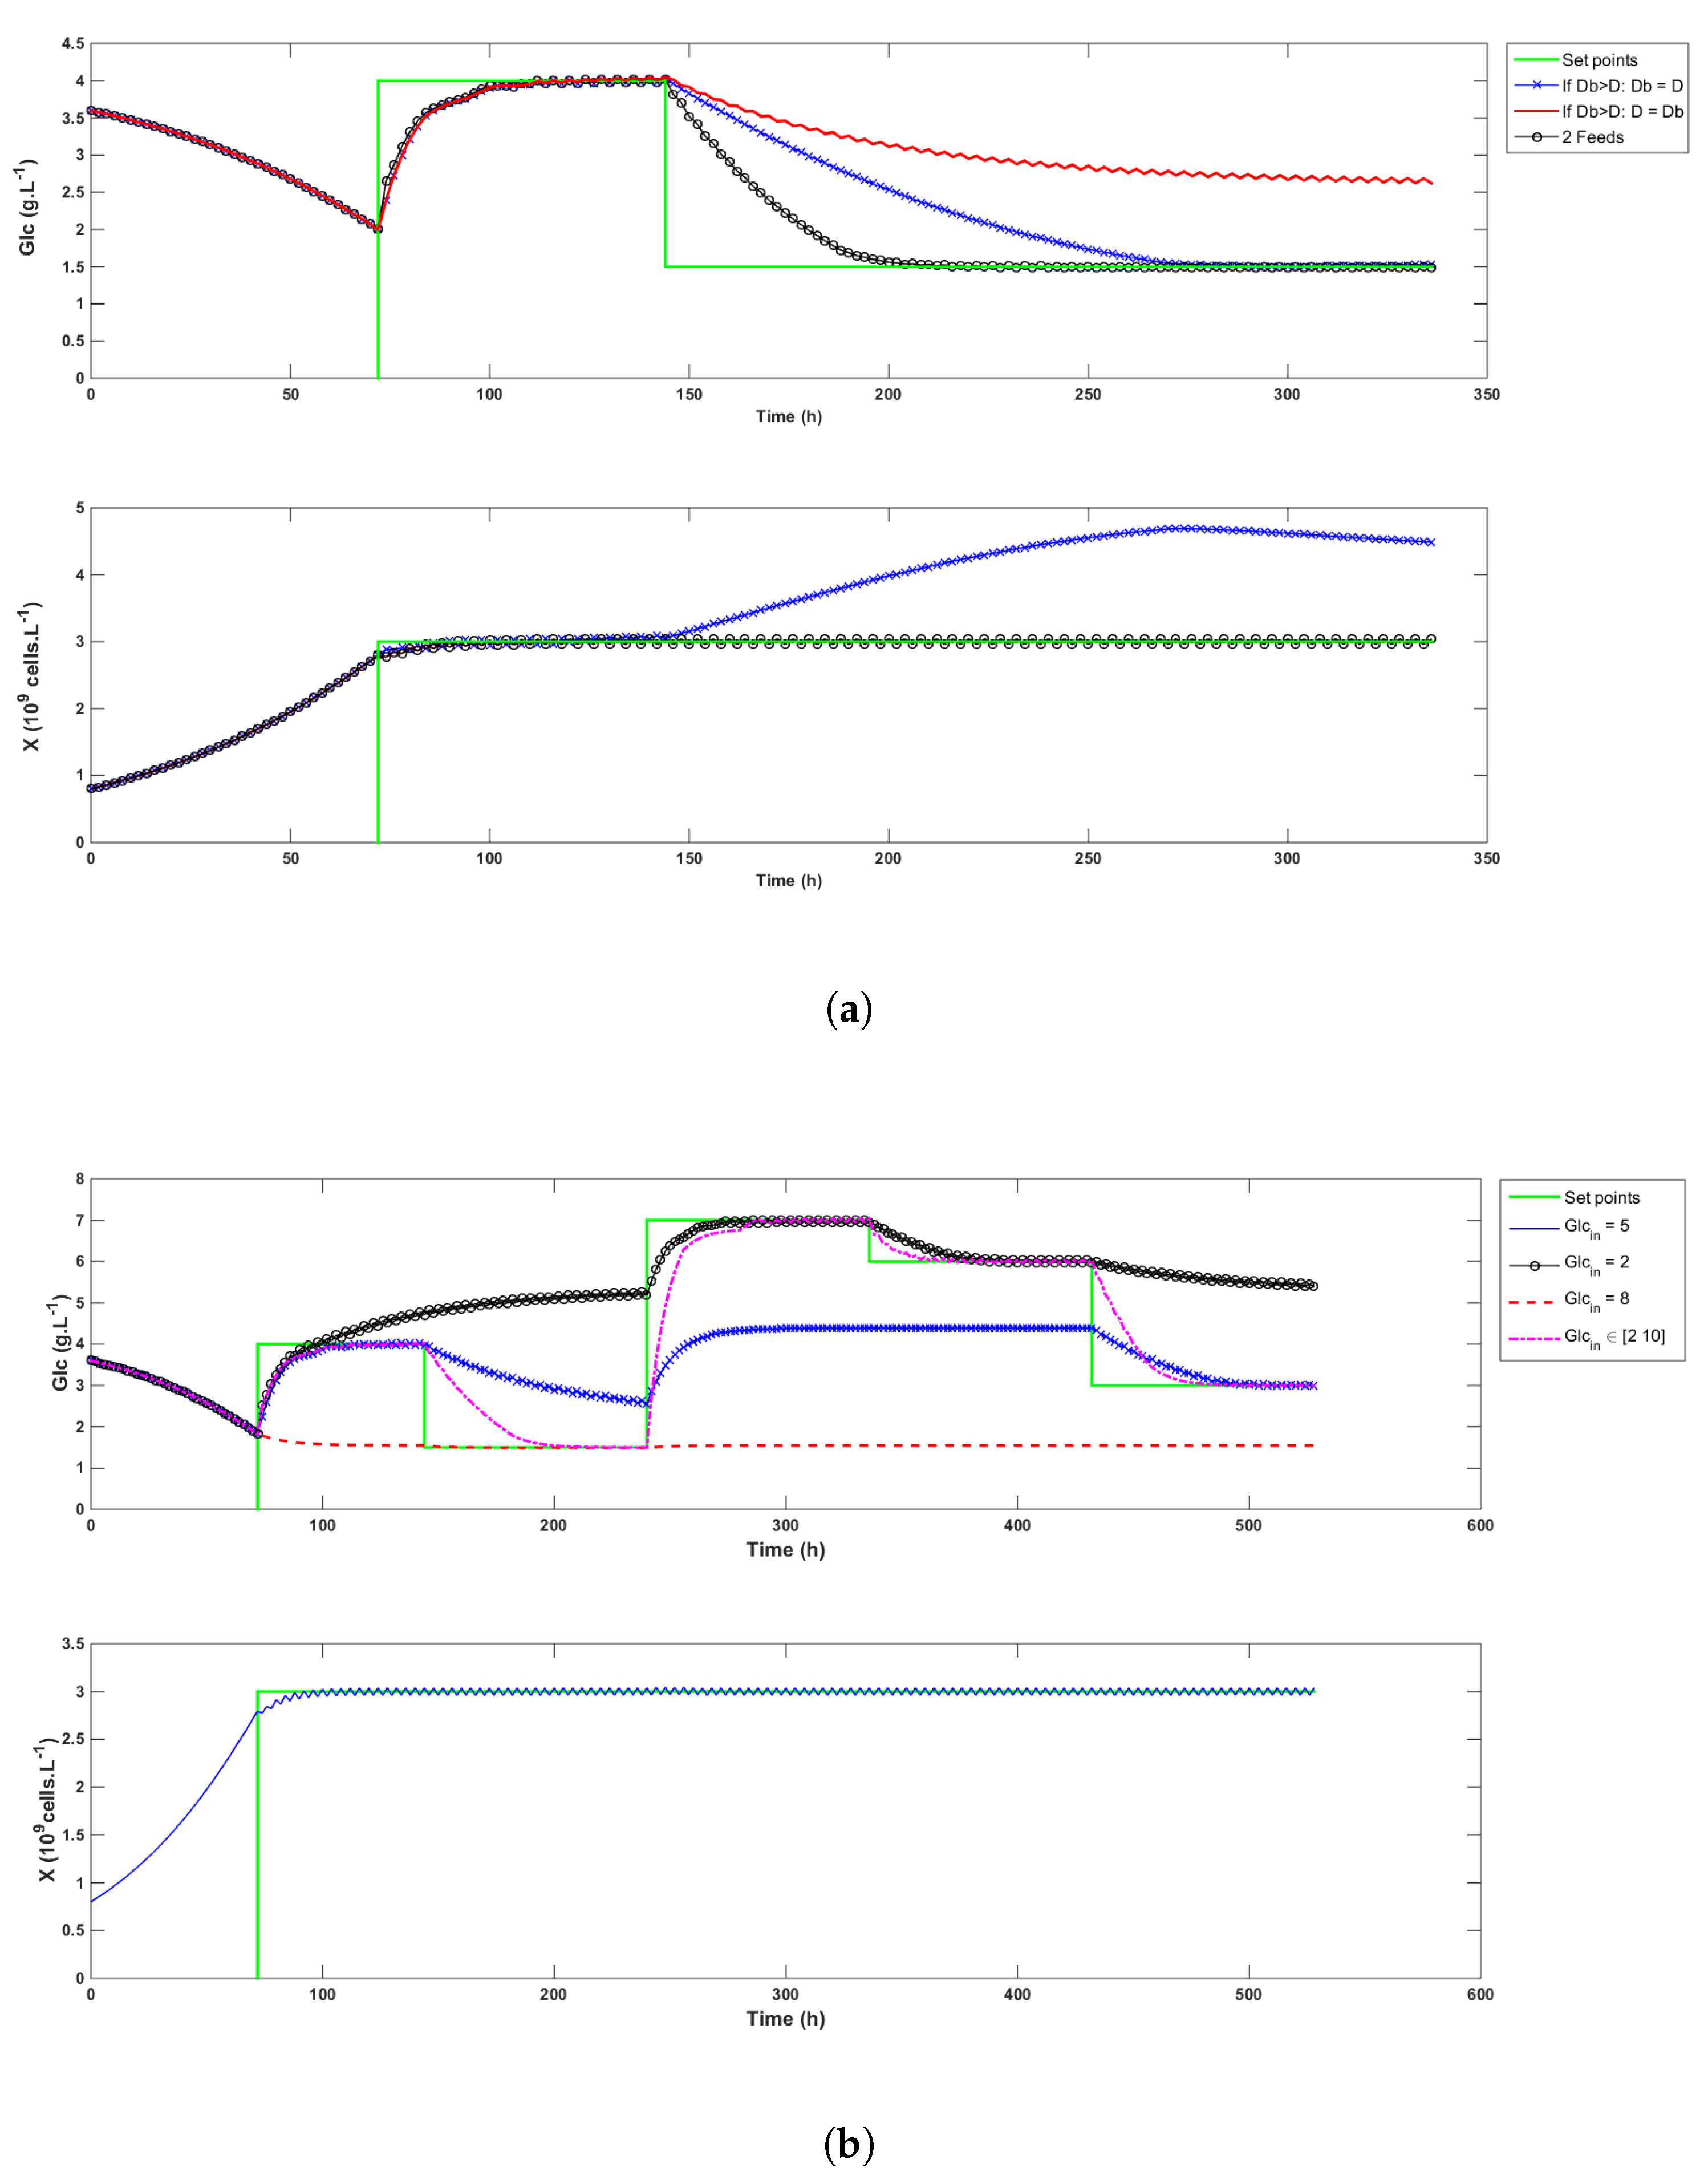
cannot be optimally controlled. When two feeds are available and the less concentrated medium has a sufficiently low concentration, this issue can be fixed by adapting the inlet glucose concentration so that the control of both species remains optimal. Examples of this behavior are illustrated in the simulation in
Figure 4a. When
is decreased to the same value as
D (the -x- blue curve), the biomass signal cannot be controlled. On the contrary, when
D is increased to match the value of
(the continuous red curve), glucose cannot reach the setpoint. These two situations are simulated using a feed medium concentration of 5 g/L. When 2 g/L and 10 g/L feeds are used (the -∘- black curve),
D can be increased up to
, and a mix of both feeds can be used to adapt the glucose concentration and allow the control of both variables. In this example, the convergence towards the glucose setpoint is even faster. Note that if the low concentration feed is chosen equal to 5 g/L, no improvement on the glucose control can be achieved, but the feed consumption is reduced from 23.4 L to 13.1 L (not shown in the figure).
In the same spirit, it improves reachability by extending the range of possible setpoints. As an example, it is of course not possible to reach a 5 g/L setpoint if the feed concentration has a glucose content of 4 g/L. When only one feed is used, the admissible setpoints are constrained within an interval that varies with the biomass concentration. The glucose setpoints must therefore be chosen carefully and according to the foreseen culture conditions. The addition of a second feed widens that interval.
Figure 4b illustrates the achievable setpoints with a 5 g/L feed (the -x- blue curve), a 2 g/L feed (the -∘- black curve), a 8 g/L feed (the dashed red curve), and when a mix varying from 2 to 10 g/L is used (the -·- magenta curve).
It significantly reduces the quantity of medium spent because the high concentration feed is always used, except when
is larger than
D. In this case,
D becomes equal to
, and the low concentration feed is partially or completely used to compensate this increase. Knowing an estimate of
, the mix concentration can be calculated by rewriting Equation (
5) as follows:
The proportion of low and high glucose media is given by:
where
and
are respectively the concentrations of glucose in the low glucose and the high glucose media. The volumes of fed medium in the simulation runs of
Figure 4b are given in
Table 1, which shows that for the same set of targets, the fed volume increases when the feed concentration decreases. Moreover, all the setpoints can only be reached when two different media are used. In this case, the total perfused volume is the lowest among all cases and composed of 73% of high and 27% of low glucose medium, respectively.
With regard to the constraint on the minimum dilution rate, it has been observed experimentally that biomass sometimes needs a minimum flow of perfused medium in order to keep on growing even though the glucose concentration is sufficient (not shown in this study). This might be due to the need for other additive elements in the culture medium (an effect that is completely unmodeled, even in the preliminary study). Whenever the calculated dilution rate
D is lower than
,
D becomes equal to
, and the glucose concentration of the feed is redefined according to Equation (
14).
2.5. A Rough Dynamic Model
Even though the proposed control strategy alleviates the need for an extensive modeling study, it is very useful to know the order of magnitude of the main parameters before starting the control tests. A rough model can also be used to test the controller in simulation in some preliminary tests. The model used to draw the results of
Figure 4a,b is the following:
with:
Among the model parameters, only
and
a were adjusted so as to roughly reproduce the data from previous batch cultures of HEK-293 cells. The other parameters were chosen within intervals, in agreement with information found in the literature, grossly adjusted to obtain qualitative fits to the considered data. The parameter values are listed in
Table 2.
3. Materials and Methods
For the sake of the confidentiality agreements with the industrial partner, limited details on the culture operating conditions can be provided.
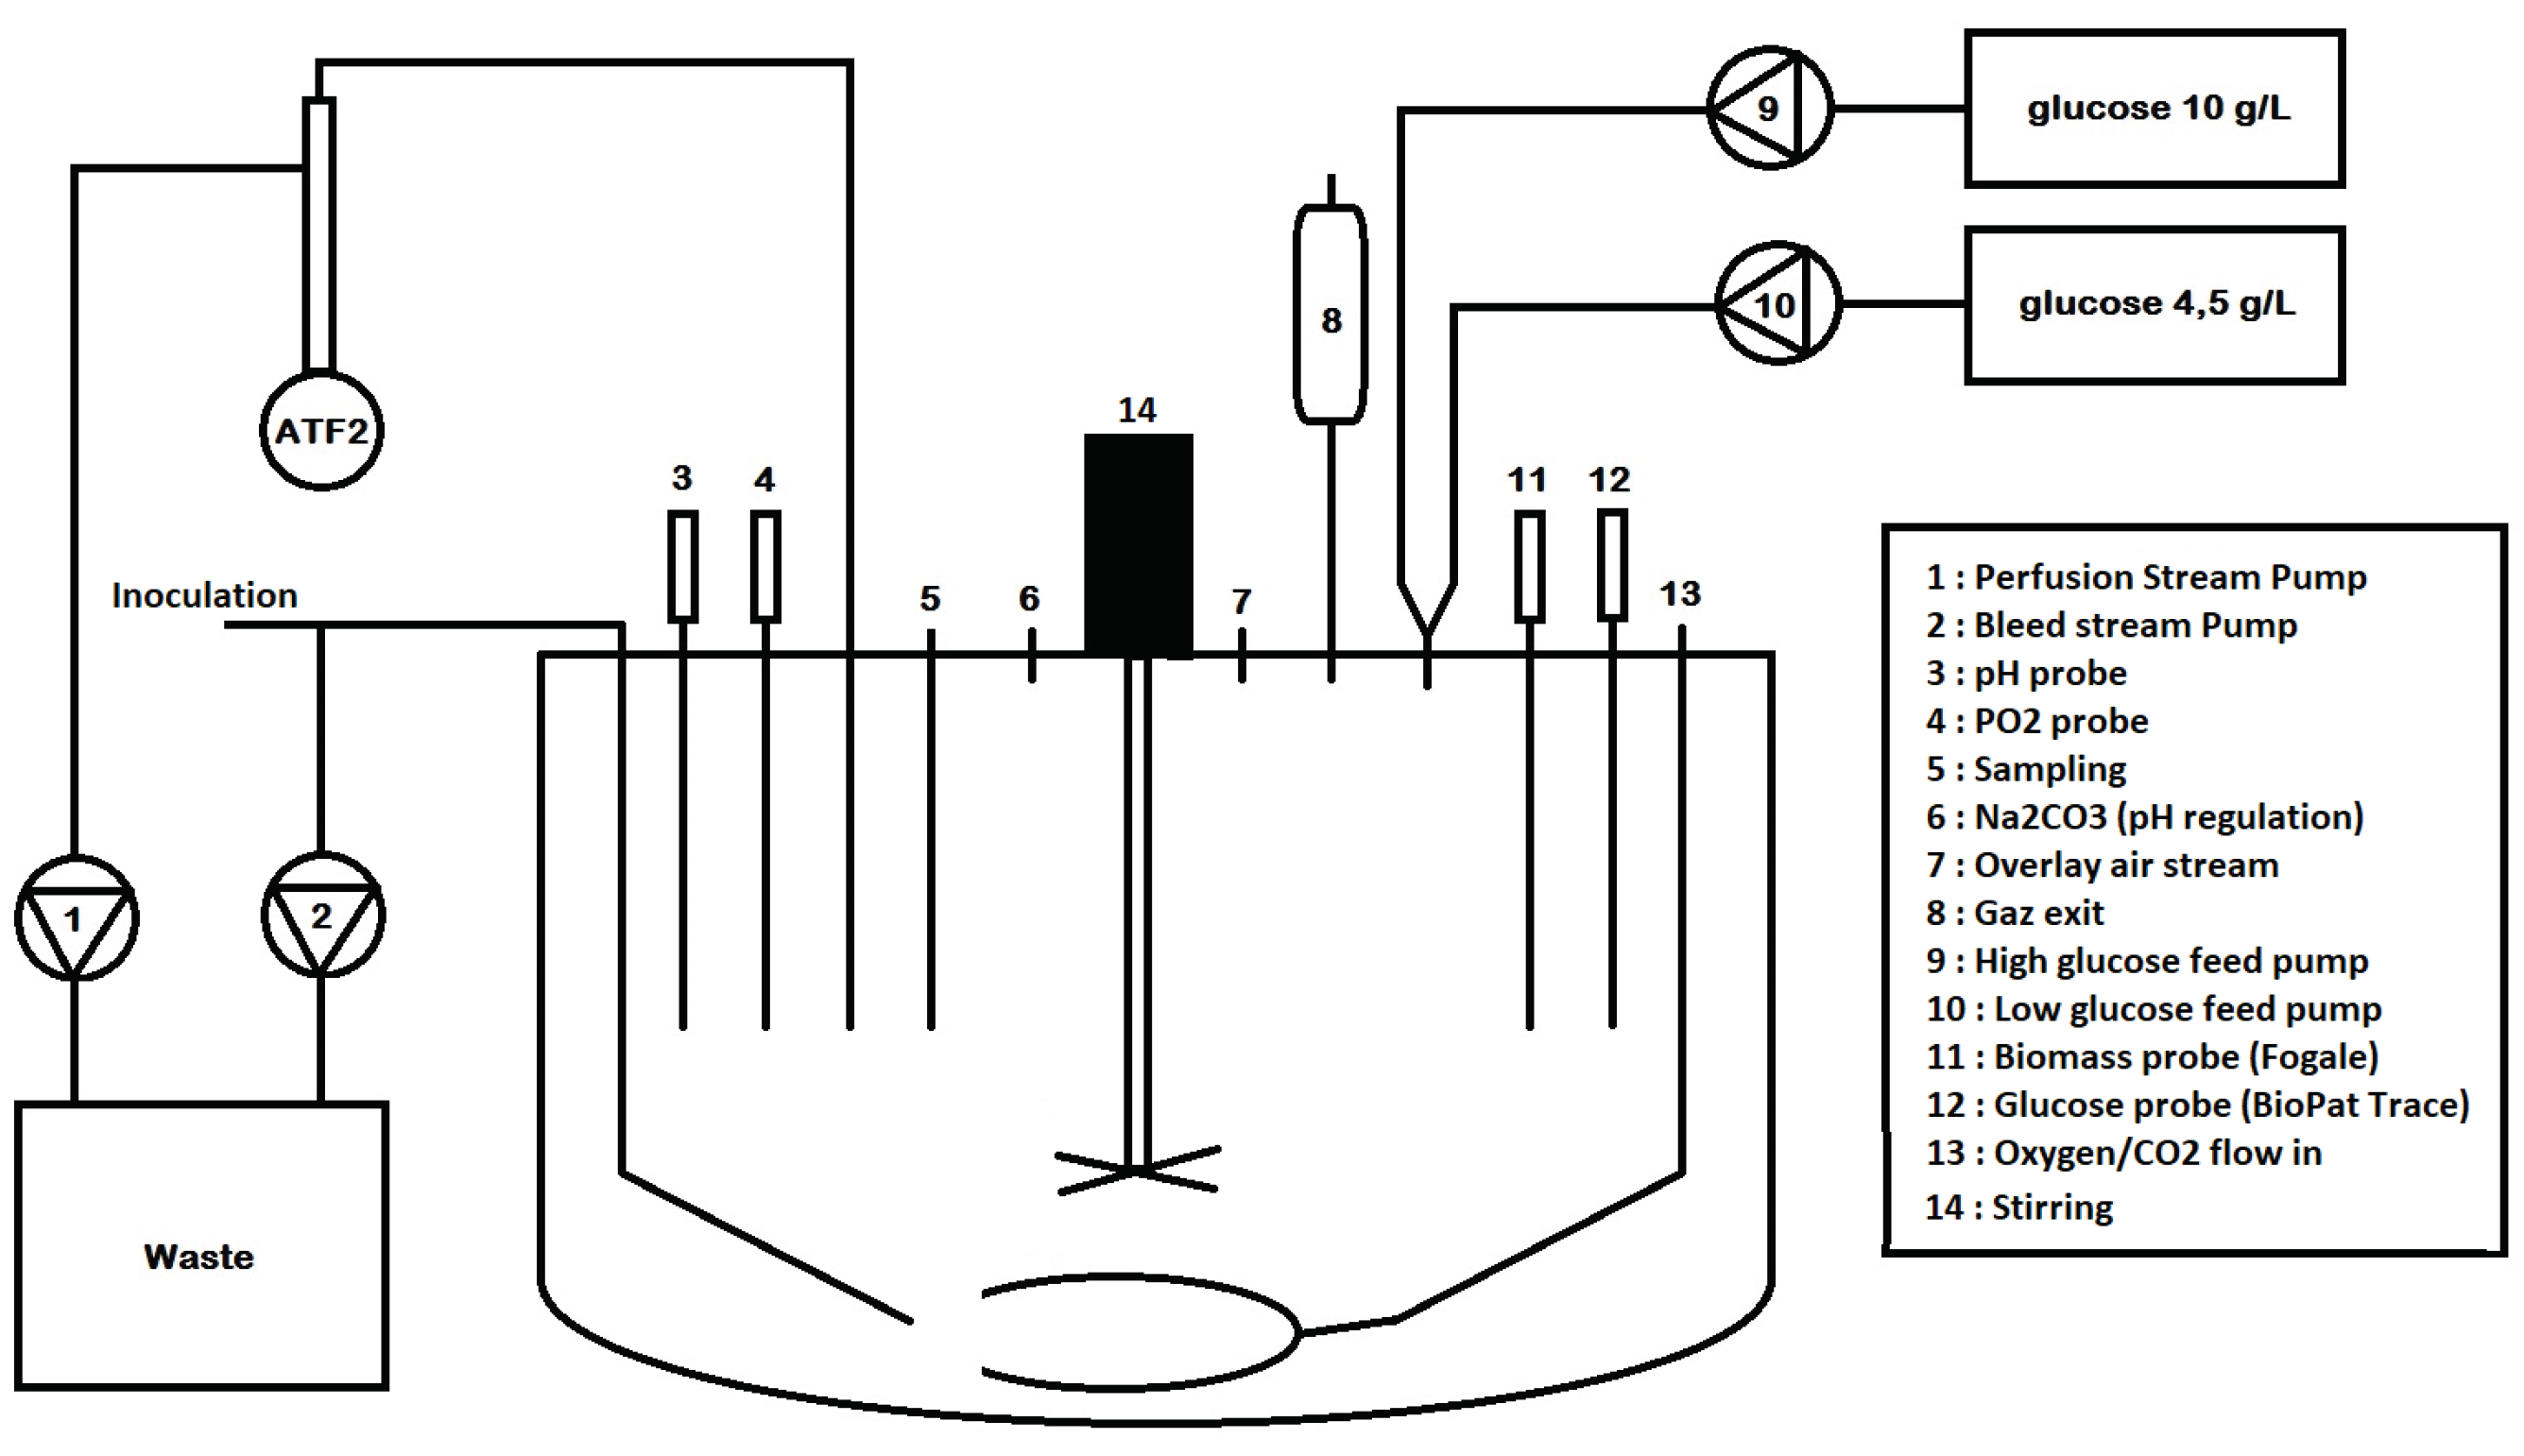
Culture operating conditions: The experiment was conducted using serum-free medium in a 5 L stirred-tank bioreactor, and the culture parameters were monitored using a BDCU II (Sartorius Stedim®, France). The effective medium volume was set to 4 L. Perfusion was achieved thanks to a Repligen XCell ATF system. The culture started with a 3 day batch phase before launching the cascade controller. The batch phase aimed at acclimating the biomass to the bioreactor environment and at initiating the control when cells were in the exponential growth phase. Dissolved oxygen started at 100% and was then maintained around 40%; pH was controlled at 7.2 during the whole experiment using carbonate and CO2 , while the temperature was regulated at 37 °C.
HEK cells (GSK®, Brentford, UK) adapted to serum free-medium conditions were used to comply with the suspension requirement. These cells were not modified to express any product of interest. A cell retention device (ATF2 system) using 60 cm—hollow fiber filters allowed the withdrawal of spent medium without removing cells. The retention rate of such devices was very close to 100% and considered as such in setting up the control strategy. The running flow rate of the system was set to 0.6 L per minute.
Medium feeding: Two different medium sources were used to feed the culture, one standard medium bag with 4.5 g/L of glucose and another bag titering at 10 g/L of glucose. The medium feeding and bleed were achieved using Watson Marlow 120U pumps, all equipped with 1/8–1/4 inch silicon tubing (Dow Corning®, Michigan, United States) to avoid biomass blockage within the tubing and to ensure the same flows in all three lines. The perfusion flow was controlled using the weight controller of the BDCU II, which at the same time also allowed maintaining the volume constant during the experiment.
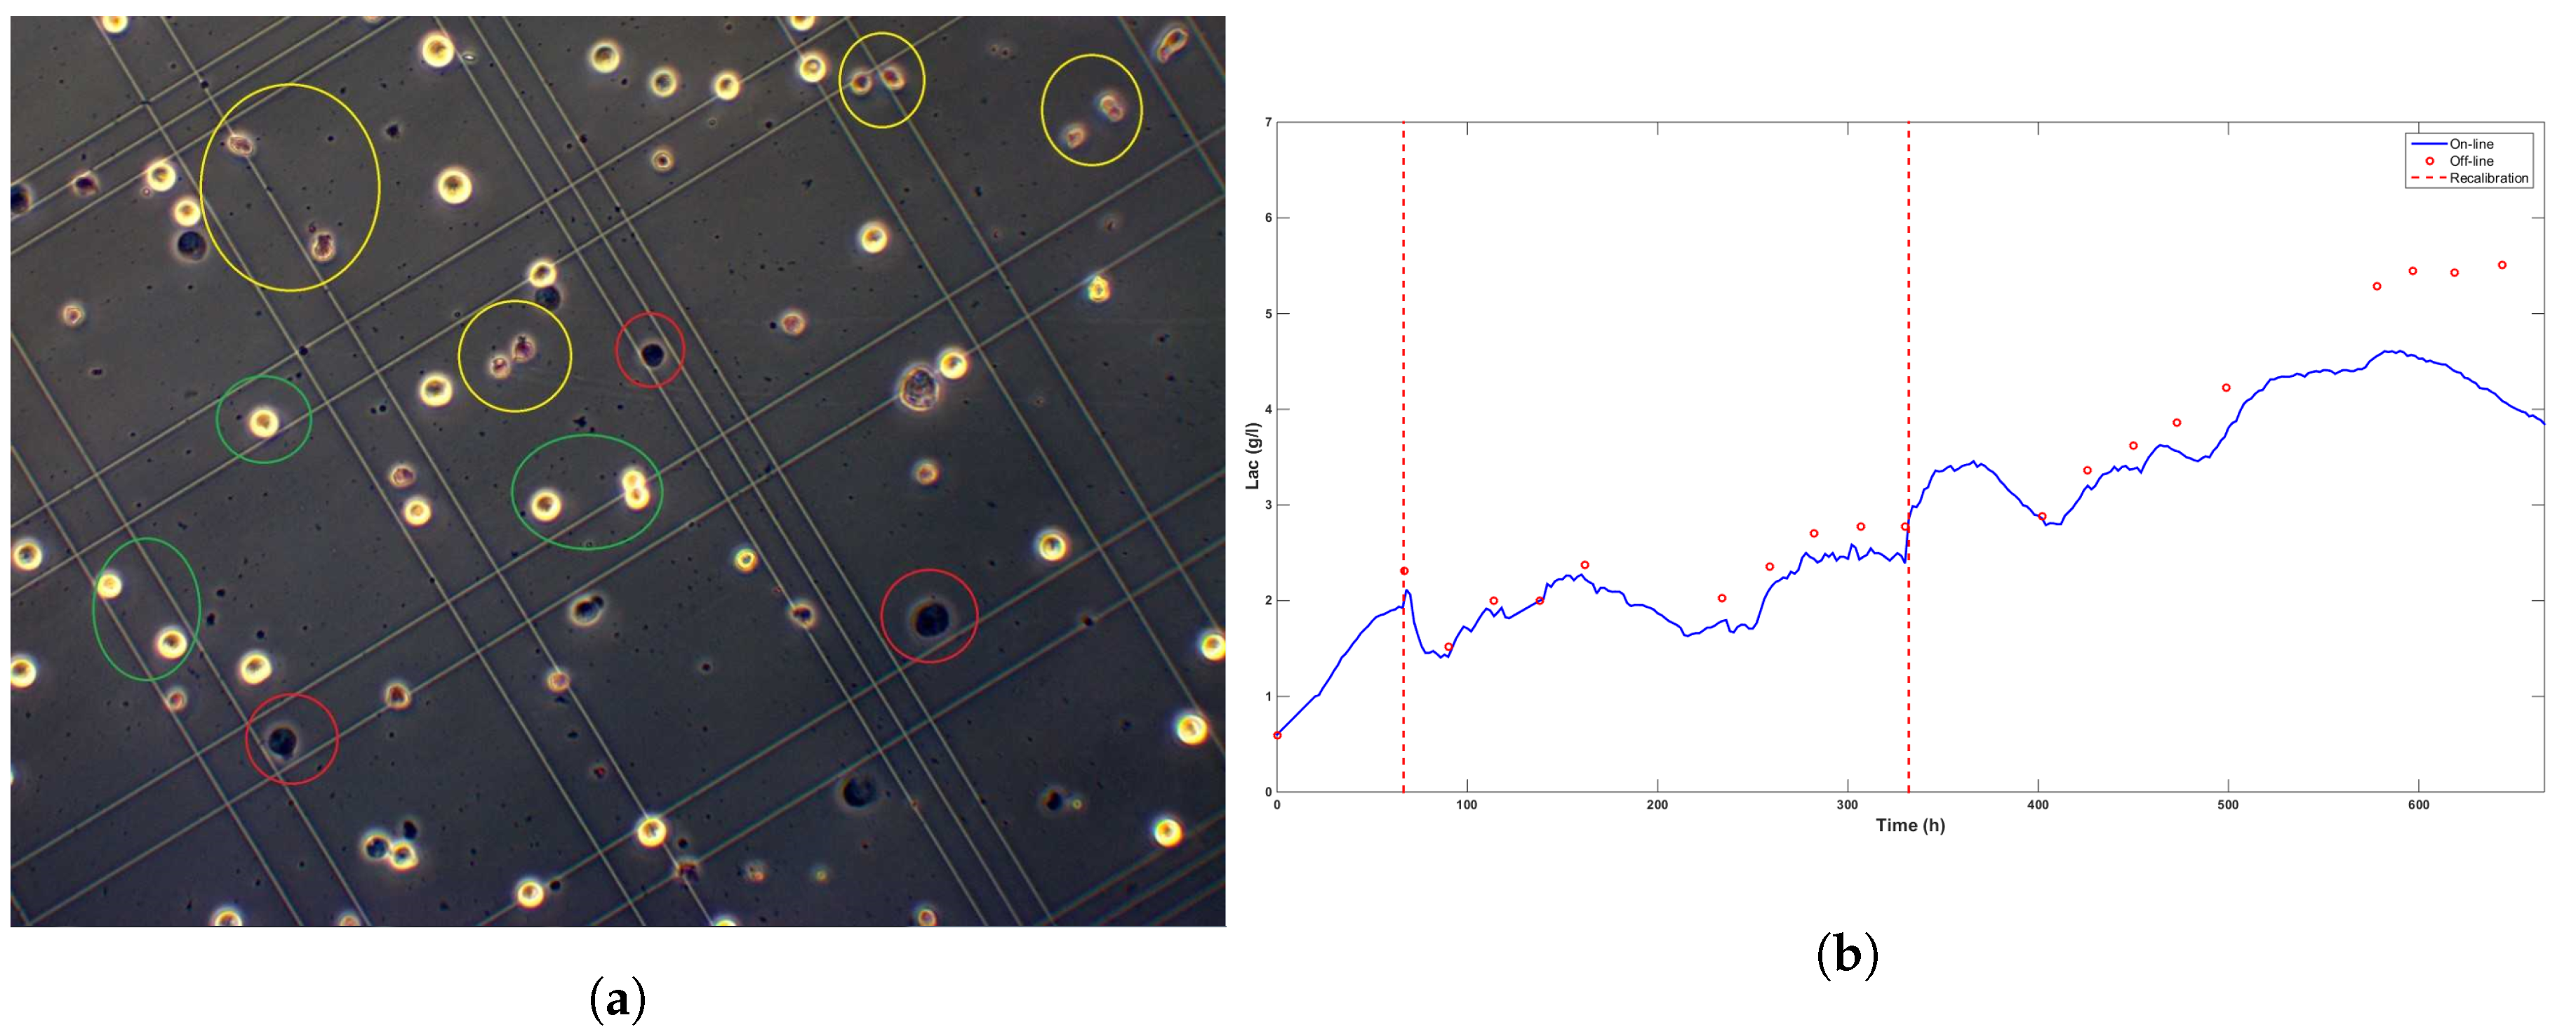
Online measurements of the biomass were achieved using a Fogale Probe (Hamilton®, Nevada, United States) that used the dielectric properties of living cells to provide biomass density measurements. The data acquisition frequency ranged from 1 measurement every 12 min to 1 measurement every 5 s. Glucose and lactate were measured online using a BioPat Trace device (Sartorius Stedim®, France) allowing data sampling up to one measurement every two minutes. The Trace device was analogically linked to the BDCU II controller so that the measurements were directly accessible from the MFCS program (Sartorius Stedim®, France). Nevertheless, since the animal cell culture was quite slow (time constant in the range of 1 h), the algorithm calculation happened every 2 h in order to avoid dealing with a useless quantity of data, computational efforts, and the waste of consumables. The acquisition of the biomass and glucose concentrations was adapted accordingly, namely one measurement every 12 min in the case of biomass and once every 2 h for glucose.
Off-line measurements were considered in order to check the accuracy of the on-line signals. Viable and dead cells were measured via cell count using a Bürker cell and Blue Trypan dye. Glucose and lactate were measured off-line through photometric assays (Cedex Bio HT —Roche Laboratory). The BioPat Trace and the Fogale probes were recalibrated whenever a difference of more than 10% between the two types of measurements was observed. As shown in the next section, recalibration was rarely required.
4. Experimental Results
This section is dedicated to the detailed discussion of a whole experimental run using the cascade controller. The reader may refer to
Figure 5 and
Figure 6, which illustrate the experimental results.
The culture started on a Friday afternoon with a three day batch phase that allowed the biomass to acclimate itself to the bioreactor environment. The biomass inoculum concentration was approximately equal to 0.8·10
cellsL
, while glucose and lactate levels were measured at 3.6 and 0.6 gL
, respectively. The real-time algorithm was launched after 20 h with only the state estimation scheme active (no control action). The objective was to test the observer convergence. This could be achieved by monitoring both measured concentrations and by examining the trajectory of the estimates of the specific rates
and
. SMO variables
and
, which represented the concentrations of biomass
X and and glucose
in the observer (Equations (
8) and (
9)), were initialized at 0.8·10
cellsL
and 3.5 gL
, while
and
were set to 100 and 50, which corresponded to values of
and
equal to 0.02 h
and 0.005 gh
10
cells, respectively. Convergence was achieved at about time t = 50 h approximately (so about one day was necessary to obtain satisfactory estimates from the SMOs).
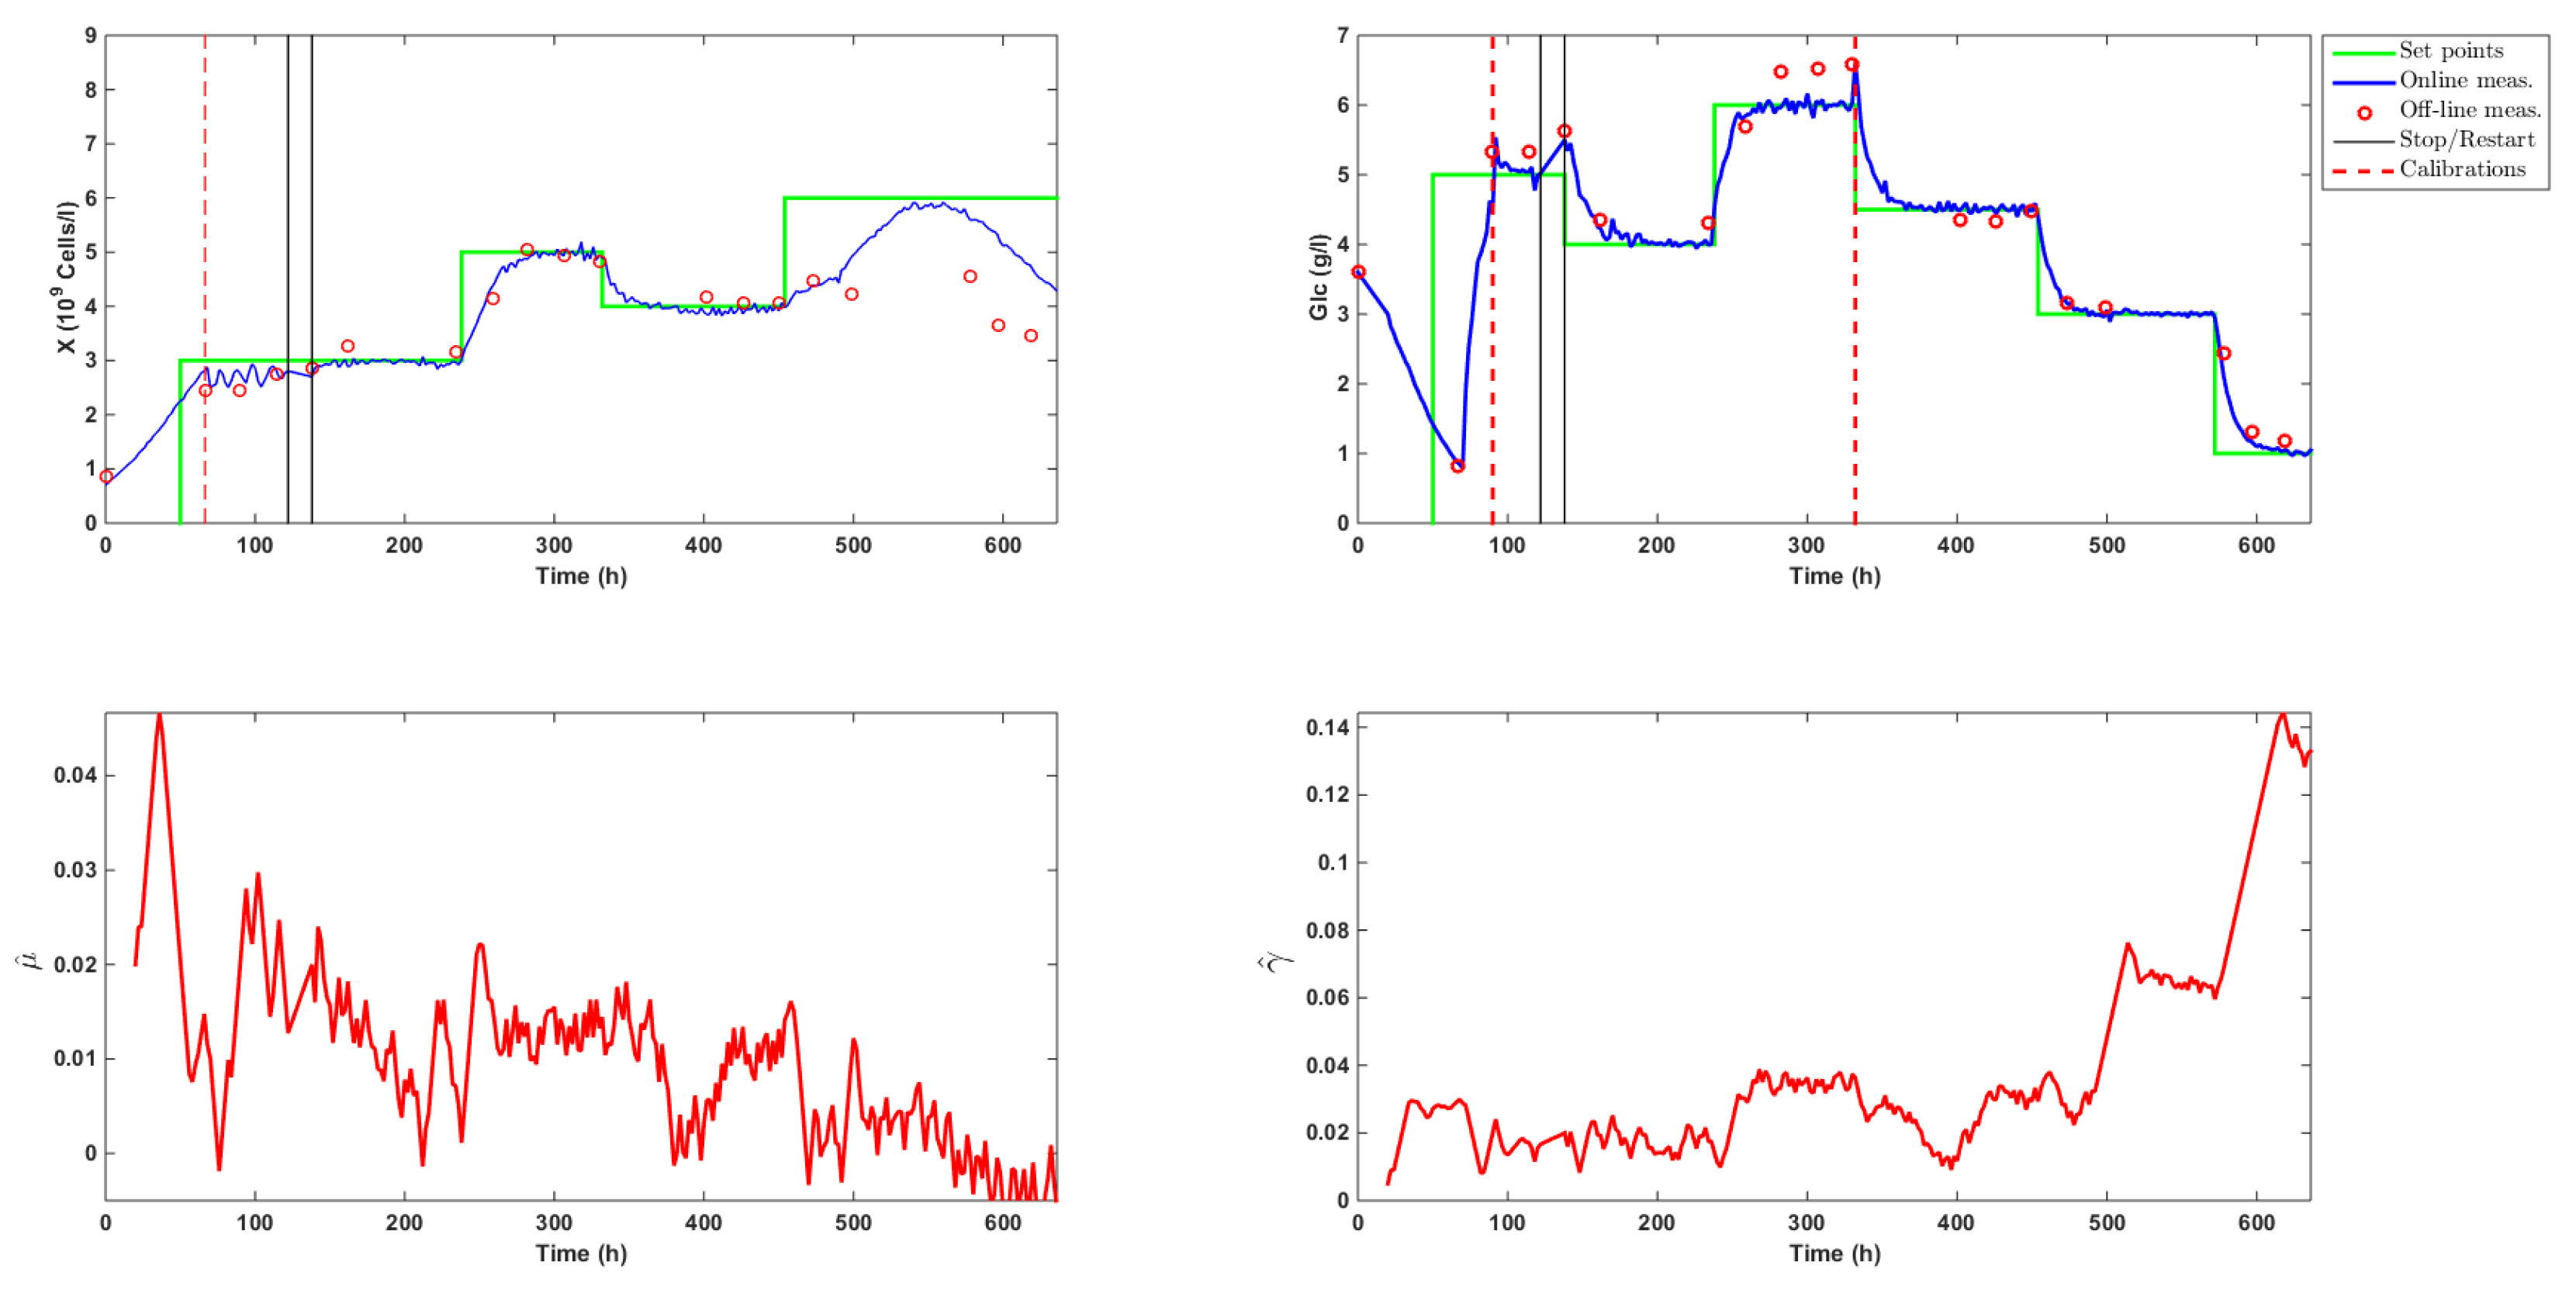
The controller was then launched with setpoints fixed at 3·10
cellsh
for biomass and 5 gL
for glucose. As can be noticed in
Figure 5, a calibration of both online probes was unfortunately required on Monday morning (t = 67 h). This manipulation caused an overshoot in the glucose trajectory. The controller reacted efficiently and quickly brought glucose back towards the setpoint. Due to a delay of about 2 h between the biomass measurement and the computation of the SMO estimates, the estimated biomass signal underwent some oscillations. The controller was stopped at t = 122 h to fix the issue and was resumed at time t = 138 h. The biomass setpoint of 3·10
cellsL
was then smoothly achieved. In order to support biomass growth, a minimum dilution of 0.014 h
(a third of the bioreactor volume per day) was used from time t = 138 h on. Meanwhile, glucose reached a new setpoint of 4 gL
. Concentrations were then successfully increased to setpoints fixed at 5·10
cellsL
for biomass and 6 gL
for glucose, before being decreased at levels of 4·10
cellsL
for biomass and 4.5 gL
for glucose.
At time t = 330 h, following a technical issue, the original digital ATF device controller MC410 was replaced by the more basic C24 system. As can be observed from the estimation of the specific growth rate
and the biomass signal of the Fogale probe in
Figure 5, cell growth significantly decreased in the time interval from t = 350 h to t = 400 h. Several reasons, taken alone or altogether, might explain this drop:
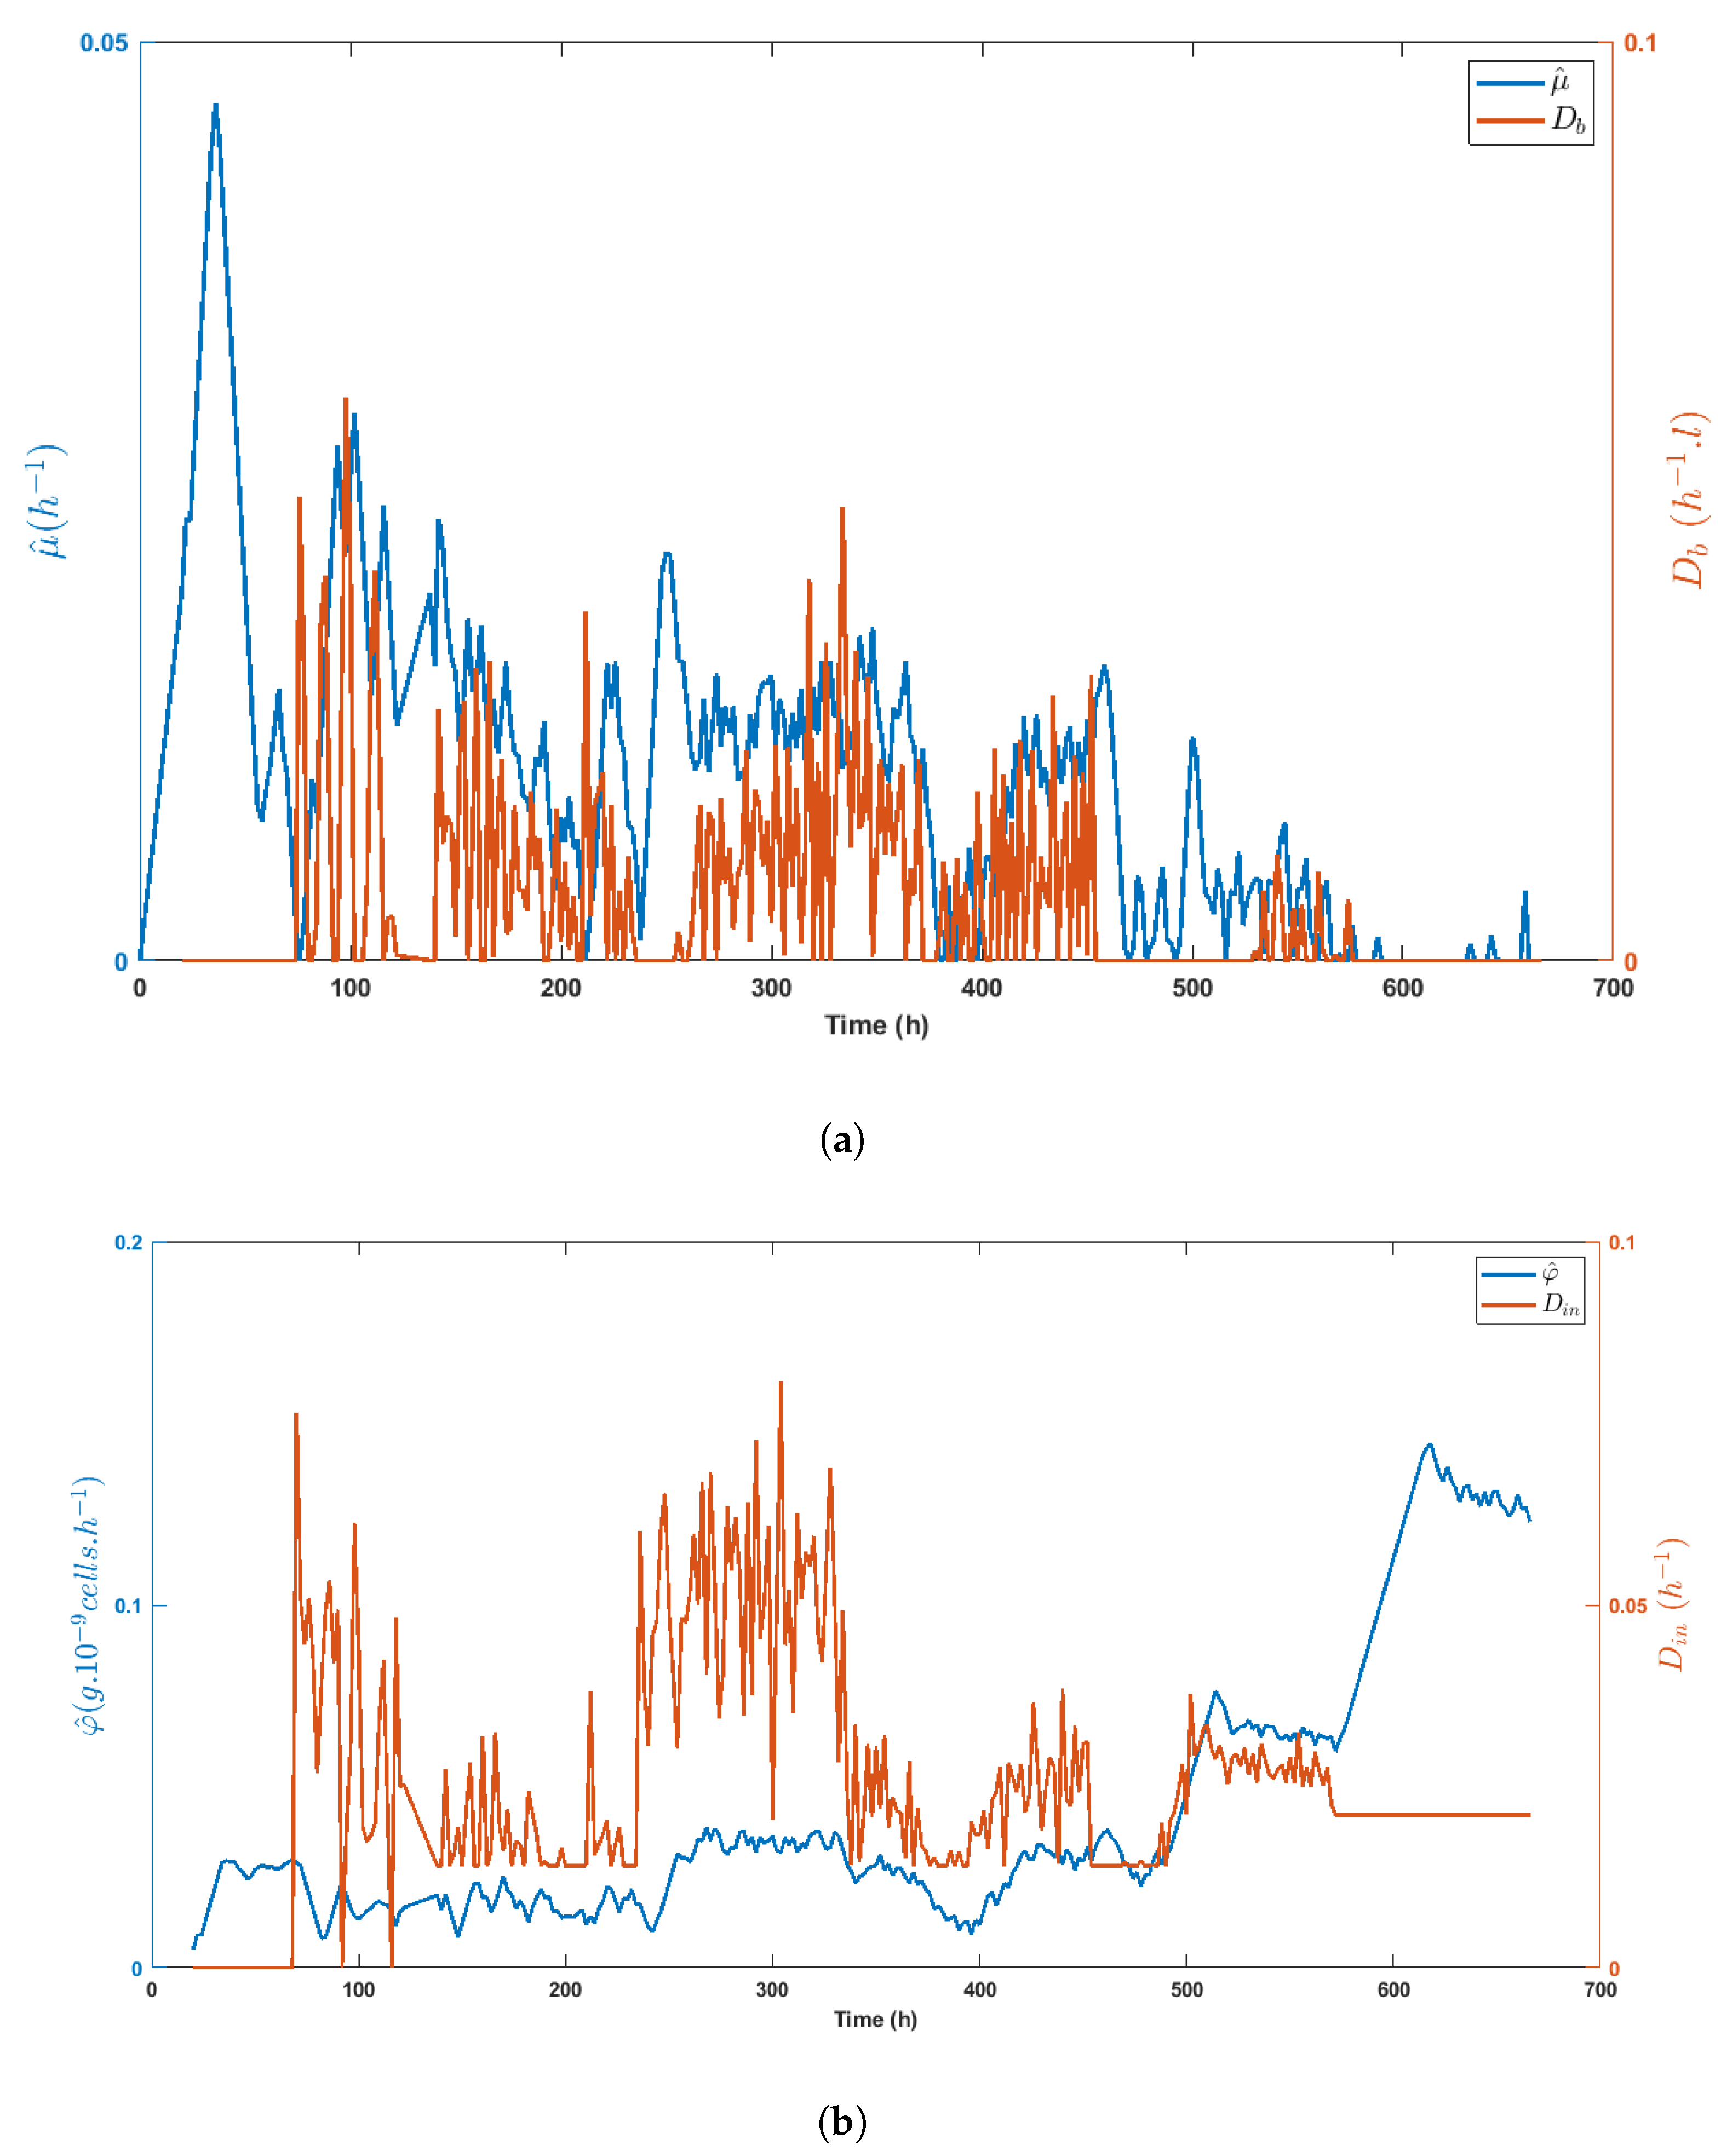
Figure 8a,b highlight the direct impact of the medium volume fed on biomass growth and the specific glucose uptake rate, respectively, while
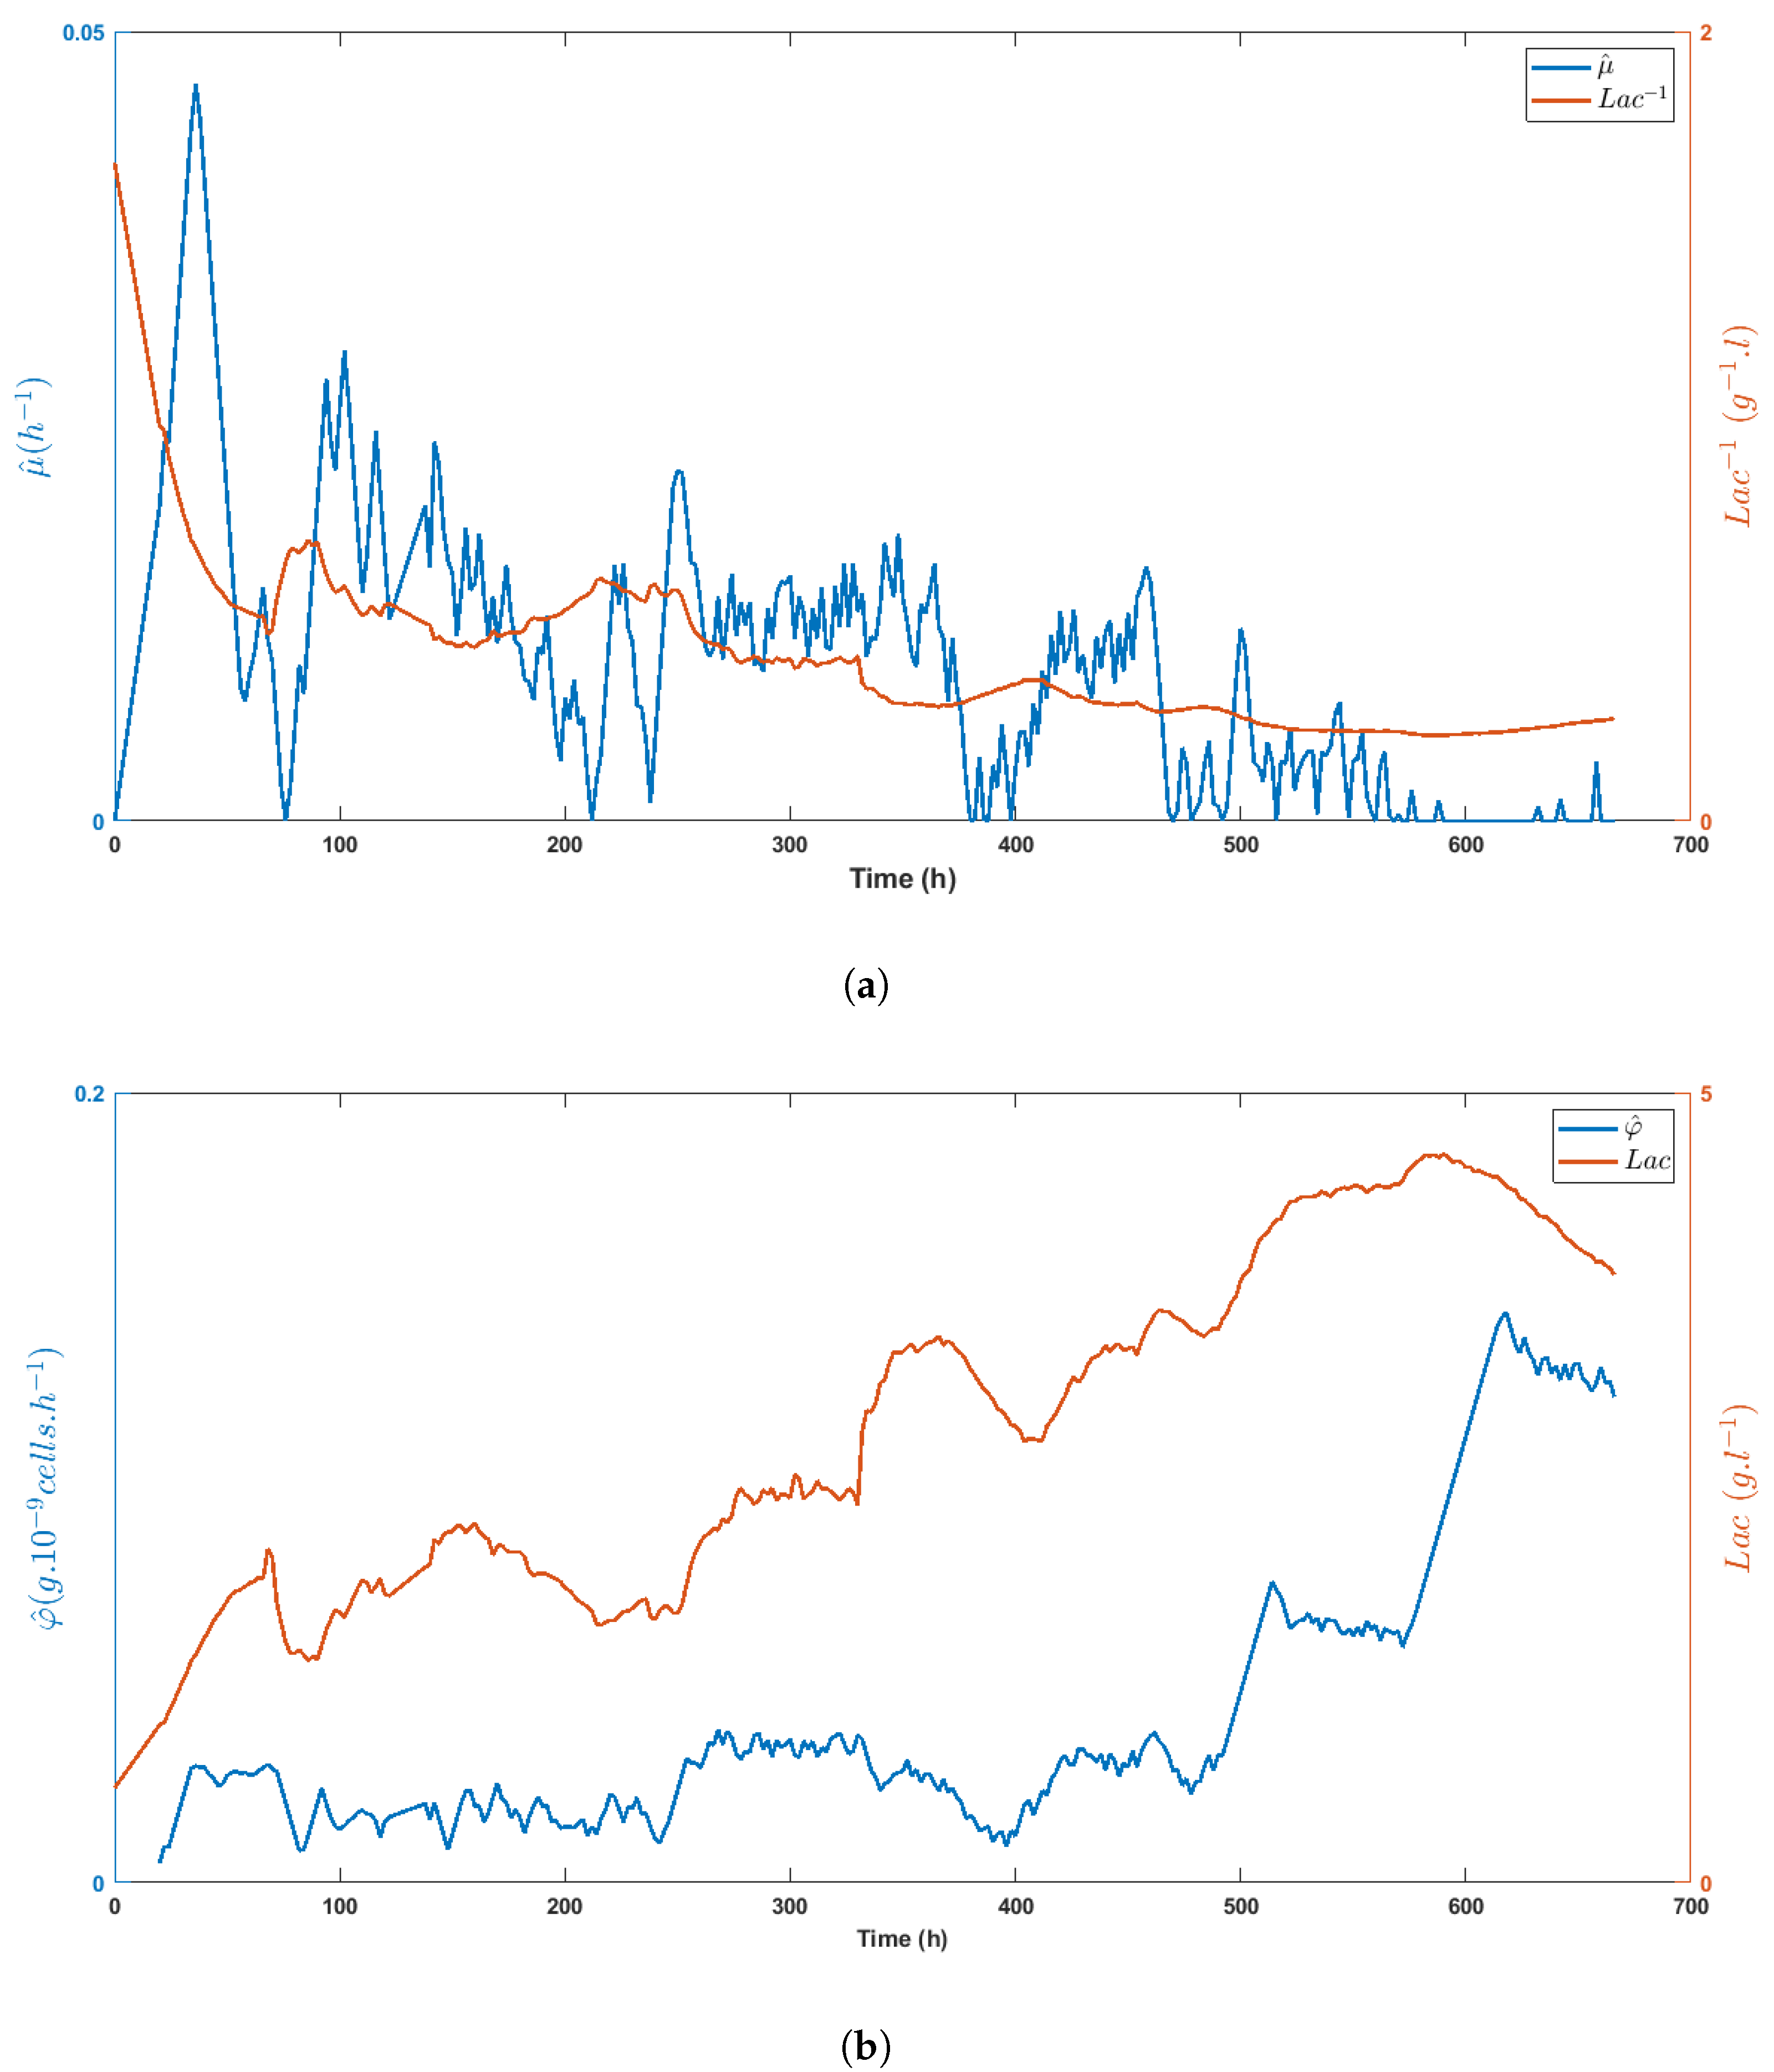
Figure 9a shows the inhibitory effect of lactate on biomass growth. Obviously, lactate concentration was linked to glucose uptake, as shown in
Figure 9b, even though the important decrease of
between t = 330 h and t = 400 h made these variables evolve in opposite directions.
At time t = 456 h, setpoints were updated to 8·10
cellsL
and 3 gL
. The specific growth rate decreased as the total dilution rate
dropped to allow for the new glucose setpoint to be reached. This led to a biomass increase of only 25% in 50 h. Given the poor physiological state of the biomass (shown in
Figure 7a, the dilution rate was raised to 0.021 h
at time t = 492 h, and the biomass setpoint was adjusted to 6·10
cellsL
. Biomass then started to grow a bit faster, but too slowly to reach the new biomass setpoint.
This terminal phase of the culture could possibly be explained by the age of the culture, although bioreactor operations including the bleed stream were expected to last long since older cells and cellular waste could be washed out via the bleed stream. However, our repeated tests led to partial bleed only, and some inhibitory products might have accumulated more than in usual production conditions.
It must be stressed that if a particular biomass setpoint would be chosen from the culture start, then the bleed stream would be active during the whole process, and this issue would probably not occur.
At time t = 552 h, the biomass started to decline, inducing a negative estimation of the biomass growth rate and confirming the bad state of the culture. A last glucose setpoint was fixed at 1 gL to check once more the efficiency of the controller.
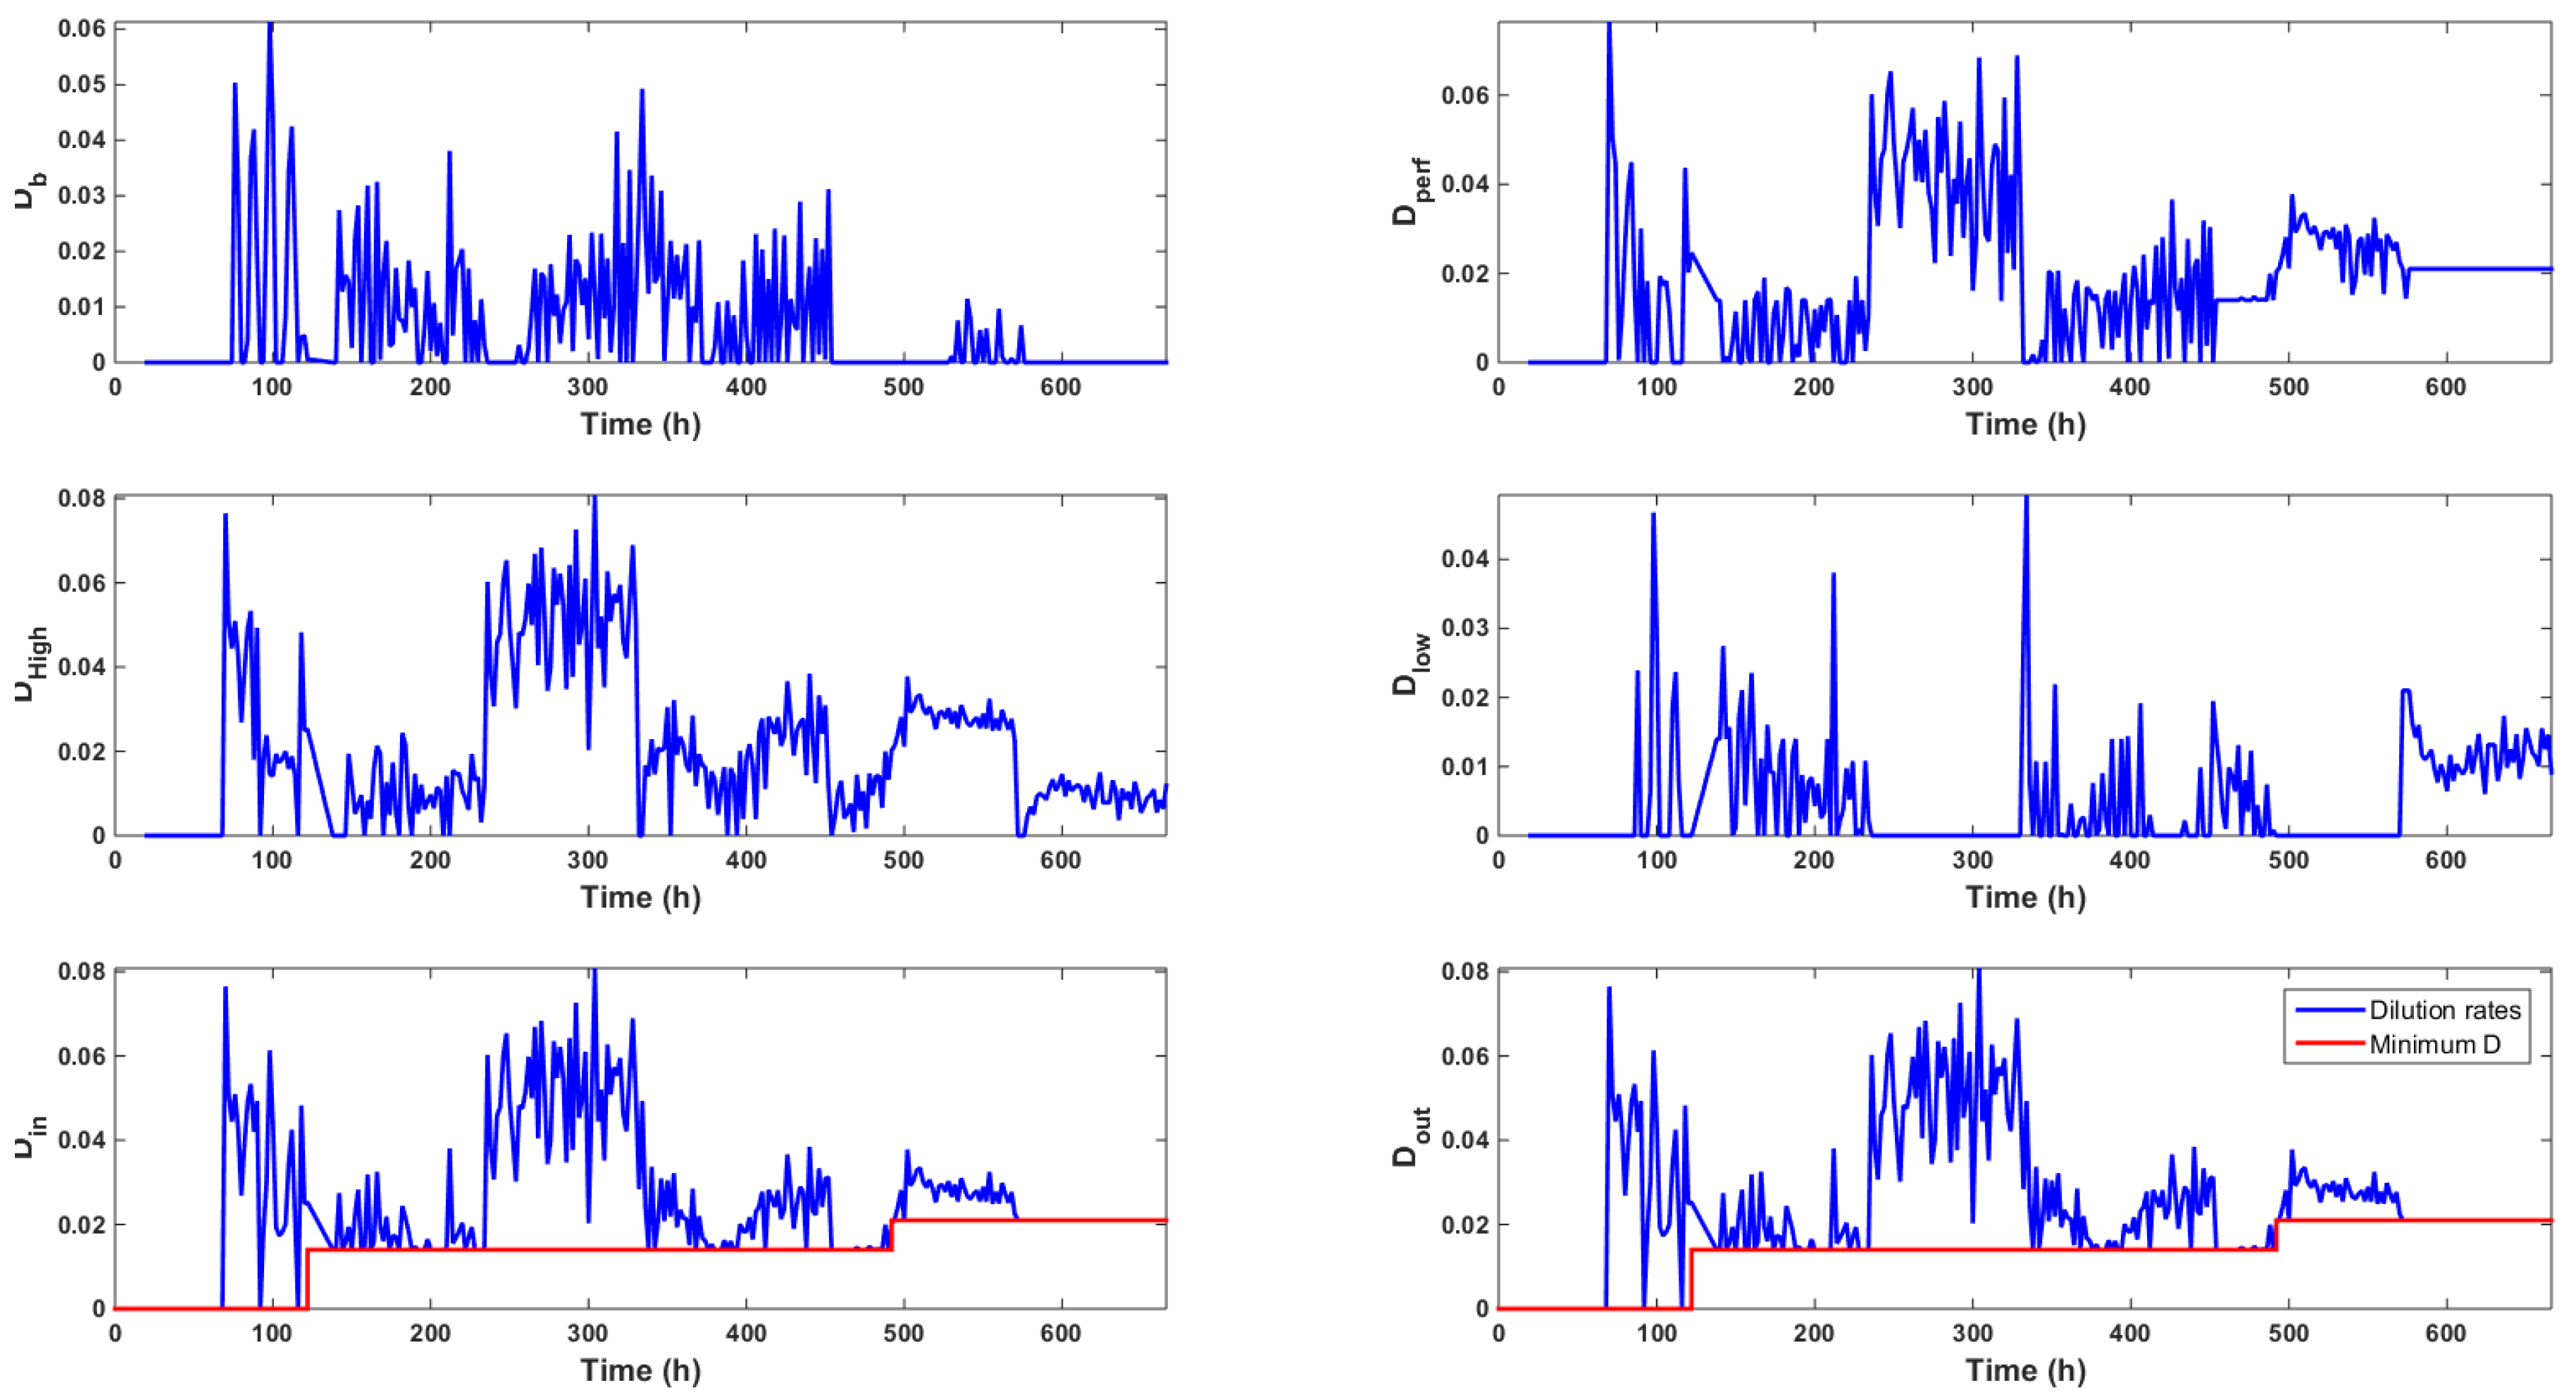
The dilution rates computed by the controller are displayed in
Figure 6, which shows that the high glucose feed was mainly used along the culture, even when low glucose setpoints were imposed. The total amount of high and low glucose medium fed along the culture was equal to
L and
L, respectively. This resulted in an average volume of
L per day or a
volume of the bioreactor per day starting at time t = 70 h. This volume was in agreement with the usual continuous or perfused cultures. These results supported the idea of using a concentrated feed in order to avoid wasting the culture medium.
Table 3 summarizes the performance of the controller. A setpoint was assumed to be reached when the distance between the variable and its setpoint was less than 5% of the setpoint value. Convergence of the glucose signal was achieved on average 21.6 h after setpoint change. The bias was about 0.04 gL
, and the standard deviation was 0.076 gL
. These good results were made possible thanks to the reliability and consistency of the measurement signals delivered by the BioPat Trace and the Fogale probe. The latter delivered accurate results, except when the biomass declined and dead cells delivered their ionic content to the medium, probably impacting the permittivity measurement. The bias was on average equal to 0.04·10
cellsL
and the standard deviation to 0.07·10
cellsL
when the controller was able to maintain the signals at setpoints.
5. Conclusions and Perspectives
This study was dedicated to the experimental validation of a cascade control strategy, where the inner loop implemented a linearizing control based on sliding mode estimation of the reaction rates and the outer loop used simple PI controllers with autotuning. The basic idea of the controller was to adjust biomass concentration, which could be related to production objectives, and glucose concentration, which could be related to the use (and possibly waste) of the culture medium. The controller did not require an accurate process model, which was a decisive advantage in terms of the development time.
A relatively long experiment (about 26 days) was described, where the controller was tested in various situations, including setpoint changes, to explore the range of possible operating conditions, but also perturbations related to instrument recalibration, or the change in the perfusion system. On the whole, the control structure had convincing performance. The measurements provided by the on-line equipment, i.e., the BioPat Trace analyzer and the Fogale probe, were reliable and could be used to develop software sensors of the reaction rates. The use of two feed media with high and low glucose concentrations significantly enhanced the process operability.
The following aspects should be considered for future developments:
The use of sliding mode observers is appealing as they are robust to modeling uncertainties and perturbations and provide convergence in finite time. However, their tuning is delicate, and they can generate oscillatory estimates when recovering from perturbations. It would be interesting to explore alternative robust estimation schemes, requiring minimal kinetic modeling, but possibly offering smoother recovery from large perturbations. One such scheme could be the hybrid observer proposed in [
30], which combines an asymptotic observer and a receding horizon estimator.
The BioPat Trace analyzer also provides information on the time evolution of the lactate concentration, which might be used directly in the reaction rate estimators and be part of the control objectives (for instance, controlling the ratio between glucose consumption and lactate production).


