1. Introduction
The importance of chemical process simulators is well-documented, as they are important tools for modelling chemical plants, while providing opportunities for optimization and debottlenecking of existing processes [
1,
2]. All commercially available process simulators follow the traditional development method, which in almost 100% of cases hides the source code from the end users thus relying on a closed, black-box approach. Open source code software can be a useful tool for development of an integrated process simulator and related simulation model that would be able to serve industrial users in improving their production operations. One of the interesting cases for application of the open source code software in fertilizer industry is ammonia production as the most energy-intensive process which gives the main raw material for different end products. The main energy consumer in ammonia plants is the steam methane reformer (SMR) furnace. In typical SMR furnace approximately 50% of the heat generated by combustion of natural gas in the burners is transferred through the reformer tubes and absorbed by the process gas. This unit presents the primary focus for the operators to minimize their costs in the whole ammonia plant.
The industrial users of any ammonia plant would like to have the ability to rapidly monitor and evaluate the performance of the SMR in its regular operation life in steady-state and dynamic mode. Many models have been created to describe SMR units with varying levels of details [
3,
4,
5].
Sophisticated simulators have been used to describe the performance of the units with a high accuracy [
6]. Nevertheless, many of these take a long time to converge, however, which is impractical for regular industrial uses and at the same time does not allow for the continuous prediction of process parameters with possibility for their adjustment and improvement to achieve the best available performance. Besides that, a series of catalyst beds within ammonia plants needs simple and practical on-line monitoring of their performance regarding the activity, selectivity, and lifetime.
The one-dimensional heterogeneous numerical model based on the open source code which replicates some of the work of Xu and Froment is proposed and extended to include main process control parameters in a form that is applicable to the vast majority of commercially available industrial SMR catalysts [
7,
8,
9,
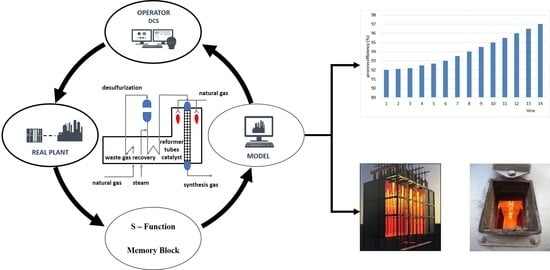
10]. The developed model has been compared with a real top-fired SMR unit from a stand-alone ammonia plant in Petrokemija fertilizer production complex involving a well-defined SMR catalyst. The developed model takes into account reaction kinetic constants, thermodynamic equations of state, heat fluxes, pressure drop, temperature approach to equilibrium, and catalyst properties. The model can be used in continuous monitoring and optimization of the performance of many different SMR catalysts through the application of predictive simulation as shown in
Figure 1.
The communication between a discrete model and any distributed control system (DCS) can be achieved by system-function which is compiled as MEX file using C++ language. This digital thread enables the model to access all specific information on each actual process parameter in the closed-loop system. In this way, the operators can directly and rapidly retrieve the necessary process data from the model at the end of each sampling period, which than can be immediately used as the new boundary condition in the optimization scheme.
The model can help operators to safely and securely optimize performance of the SMR catalyst, providing them with rapid, accurate, and predictive simulations. The simulation presents an exact and complete replica of the SMR catalyst, ensuring that users may interact with a control system interface to adjust better performance. It can be also easily used as a basis for implementation of an automatic advanced process (APC) control tool.
Implementation of the predictive simulation model for continuous monitoring and optimization of main process variables during operation of SMR catalyst will have direct economic benefits to industrial users in the range from 2% to 3% of overall energy consumption in running top-fired SMR. Besides that, the model will present a significant opportunity for digital transformation of existing industrial production units according to the goals of Industry 4.0.
2. Model Description
Steam reforming is the conversion of steam and hydrocarbons into a mixture of hydrogen, carbon monoxide, carbon dioxide, and unconverted reactants. Steam may be replaced either partially or completely by carbon dioxide as reactant [
11]. The reforming of natural gas with steam utilizes reforming reactions and water–gas shift reaction. Besides these two main reactions there are nine other possible reactions in the SMR process. With respect to simplifying the model for industrial users, only first three reactions presented in
Table 1 were used for description of industrial SMR [
9,
10,
11]. According to literature data only those reactions are critical for thermodynamic and kinetic consideration [
10,
11].
The net reforming reaction is strongly endothermic and occurs by increasing the number of moles. The overall effect of increasing reforming temperature on the effluent gas composition is to reduce the methane and carbon dioxide content and increase carbon monoxide and hydrogen content. On decreasing reforming temperatures, the effects are reversed. The pressure of the system is so nearly fixed that reforming pressure should be considered invariable. However, increasing pressure has an effect similar to reducing temperatures and reformer designs always represent a compromise in economics. The water gas shift reaction is exothermic with shifting of the carbon monoxide favored by low temperature. However, the rate of reaction is favored by high temperature. It can be seen that with methane the stoichiometric requirement for steam per carbon atom is 1.0. However, it has been demonstrated that this is not practical because all primary reformer catalysts developed so far tend to promote carbon (char) forming reactions under such SMR conditions. Those reactions can only be suppressed by using an excess of steam, with the result that the minimum steam per carbon atom ratio is approximately 1.7 [
12]. The reforming reaction itself is also promoted by an excess of steam and hence the ratios of 3.0 to 3.5 are commonly used in practice [
12]. However, lower steam-to-carbon ratios are attractive from the economic point of view.
Important considerations during operation of SMR are the type of furnace used to transfer heat to the reactants, the catalyst properties such as activity, lifetime, size, and strength, operating conditions such as feed composition, pressure, temperature, and desired product composition. The catalyst in all of the SMR furnaces is contained in heat resistant alloy tubes that typically have outside diameters from 80 to 180 mm, wall thickness of 9 to 20 mm and overall length of 10,000 to 13,000 mm [
12]. Fired lengths in commercial SMR furnaces vary from approximately 200 to as much as 3500 mm [
12]. Firing is usually controlled such that tube wall temperatures are maintained at values that will give a reasonable tube lifetime. By design and industry practice, maximum allowable tube wall temperatures are set to give an in-service lifetime of 100,000 h when taking into account the stress-to-rupture properties of the particular alloy used in manufacturing the tube [
13]. As noted by Schillmoller et al. [
13] an increase in temperature of only 38 °C above design with the common HK-40 material (25% chrome, 20% nickel alloy) can shorten the tube lifetime from 10 to 1.4 years. The general SMR furnace classifications according to firing pattern are the following: top fired, side fired, and bottom fired [
12]. All of the SMR furnaces have combustion heat recovery sections used for preheating feed streams, boiler feed water, etc. The schematic diagram of the top-fired SMR based on Kellogg Inc. design located in Petrokemija Plc., Kutina, used in the model is given in
Figure 2.
Catalyst activity has an important effect on the tube wall temperature in all SMR furnaces and is usually monitored by the plant operators by portable measurement devices. The heat transfer through the walls of the reformer tubes influences the catalyst activity. Of the total heat being transferred, the high activity catalyst uses more for the endothermic reforming reaction and less for raising the gas temperature. Besides that, feed gases can vary in composition from being nearly pure methane to the heavy hydrocarbons such as naphtha. As a result, specific catalyst formulations have been developed so far for different feed gas compositions. Xu and Froment [
11] used in their work catalyst which contained 15.2% nickel, supported on magnesium spinel with a BET surface area of 58 m
2, nickel surface area of 9.3 m
2/g
cat, and with the void fraction of 0.528. The catalyst used in simulation contained 14.5% nickel, supported on calcium aluminate with BET surface area of 57 m
2, nickel surface area of 12.0 m
2/g
cat, and with the void fraction of 0.51963. The mentioned catalyst characteristics are in good alignment with the work of Xu and Froment [
11] and therefore literature kinetics data are applicable for the model in spite of the fact that different catalyst support was used in the simulation procedure.
With respect to achieve an energy savings and to ensure mild temperature conditions against tubes during operation of SMR it is of utmost importance to maintain the catalyst performance at the best possible level. Therefore, a reliable and rapid mathematical model was important to be designed for continuous monitoring and evaluation of the steam methane reformer catalyst in an existing installation. Taking into account all theoretical explanations and literature review, model assumptions are given as follows:
The reaction mixture follows ideal gas law;
All reformer tubes within the furnace are identical; the overall performance of the reformer tubes is achieved by multiplication of one tube by the number of all other tubes;
The system operates in a dynamic state;
A 1-D analysis was used for mass flow, heat and momentum transfer. All important process variables are uniform at any cross section of the catalyst bed in the reformer tubes;
The model converts all higher hydrocarbons to an equivalent methane before any tube integrations take place. Kinetic expressions for SR1, SR2, and WGS reactions are only used;
There is no axial diffusion of mass and heat;
The model is heterogeneous;
There is no external mass and heat transfer resistance between the catalyst and the process gas;
Diffusion resistance between the catalyst is considerable and the same is considered;
SMR catalyst performance is usually evaluated in terms of its methane approach to equilibrium (
ATECH4), furnace tube wall temperatures, heat flux, pressure drop, and presence or absence of hot bands on the tubes. The
ATECH4 is the difference between the actual gas temperature exiting the catalyst (
T1) and the temperature at which the measured outlet gas composition would be at equilibrium (
T2). By definition, the actual
ATECH4 cannot be less than zero. The temperature at which the outlet gas composition would be at equilibrium is determined in the model by calculating from the material balance the equilibrium constant for the SR1 reaction defined by [
9,
10]:
and determining the corresponding temperature from a
T2-KSR1 correlating equation in the model, where
K represents chemical equilibrium constant, and
p is partial pressure of corresponding component (in bar), while
T is the temperature (in K). Due to elevated temperature and pressure, the gaseous reaction mixture in the SMR process is not ideal and does not obey Mendeleev–Clapeyron ideal gas law. However, the Dalton law of partial pressure can be used in the model because the main assumption is that the reaction mixture behaves as an ideal gas.
Properly designed SMR should, with new catalyst, have ATECH4 much lower than 5–10 °C. Those plants having effective desulphurization systems often have furnaces operating with ATECH4 in the 0–5 °C range. When evaluations give these type approaches, it can be said the catalyst is giving satisfactory performance. Calculated ATECH4 of 5–10 °C could be considered in the intermediate range and performance classified as acceptable, depending, of course, on the specific design in question. The ATECH4 above 10 °C would correspond to marginal performance and would generally become a factor in discharging the catalyst. According to this it appears that continuous monitoring and evaluation procedure of ATECH4 is a feasible perspective to keep catalyst performance at the best available level.
In many SMR furnace designs there can be a significant difference between measured outlet gas temperature and the actual outlet gas temperature. The measuring point is often in an outlet gas header, and because of heat losses from the bottom of the SMR furnace and exit lines, the resulting temperature is lower than the true catalyst exit value. For these cases, the
ATECH4 may well turn out to be a negative number. If the measured outlet gas composition is sufficiently accurate, the actual gas temperature exiting the catalyst can be calculated by assuming the gas is at equilibrium with respect to the WGS reaction [
9,
10]:
The model assumes that WGS reaction reaches equilibrium in a SMR but the SR1 reaction does not. However, a clearance can be made for the deviation from equilibrium by an
ATECH4 and thus at a given exit temperature both
KSR1 and
KWGS are known [
14]. From Equations (1) and (2), the equilibrium constant for the SR1 reaction and WGS reaction at the respective temperature can be calculated. It is considered that equilibrium conversion and chemical equilibrium of the reactions depends on the thermodynamic properties of the gaseous mixture and catalyst characteristics.
To properly monitor and evaluate the catalyst performance it is necessary to compare DCS readings of the gas chromatography analysis data with predicted gas composition and how the pressure drop DCS readings data compare to the theoretically predicted values. Besides that, the temperature rise across the tube is required to indicate the kinds of adjustment that can be justified. The key components in the exit dry gas analyses are methane and, in addition, the carbon oxides (CO and CO2), while hydrogen composition is then adjusted to give a total dry gas composition of 100%.
The accuracy of the pressure drop calculation is such that the actual value should be within 10% of the theoretical value. Actual pressure drops greatly exceeding the theoretical value would indicate some problem has or is occurring. Examples of such problems would be carbon formation catalyst breakage, faulty loading such as over-vibrating the tubes and/or failure to clean the tubes, pigtails, support plates, etc.
The calculations inside the developed model involve the solution of material and energy balance equations along with reaction kinetic expressions for the catalysts according to the literature findings [
15,
16,
17,
18,
19,
20,
21,
22,
23,
24,
25]. The model calculates the material balance,
ATECH4, gas radial temperature gradient, pressure drop, heat duty, molar fluxes, and reaction rates. The analytical expressions used in the one-dimensional heterogeneous model are shown in
Figure 3. The calculation procedure is performed in Matlab (Version 2019b, The MathWorks, Inc., Natick, US, MA, 2019) file which is fairly easy to use.
The basic input requirements consist of two parts, one which must be manually filled in by the operator and another one which is automatically exchanged between DCS data and memory block by compiling with system-function. In
Table 2 a list of all necessary variables needed for monitoring and evaluation of the SMR catalyst is shown.
The model converts the total wet feed flow to mole fractions of carbon, hydrogen, and oxygen with a base of the inlet dry gas as 100%. By using the mass balance and the equilibrium Equations (1) and (2), one can derive a quadratic equation:
Solving for
a give following expression:
where
Φ and
θ present intermediate calculation parameters as follows:
where
C,
H, and
O denote total molar quantities of carbon, hydrogen, and oxygen in compounds in the system (in kmol), while
a,
b,
c, and
d represent molar quantities of H
2, CO, CO
2, and CH
4 in reformed gas (in kmol), respectively.
Pressure (in bar or atm) in the tubes is calculated according to
where
i denotes molar quantity of inert gases (Ar + He) in reformed gas (in kmol).
By using Equations (4) and (7) the model solves reforming calculations by assuming a methane content of the reformed gas (
d), solving the corresponding hydrogen content (
a) and pressure (
p). The Newton–Raphson technique was used to get a rapid convergence in order to obtain the reformed gas composition. The technique uses previous values of the methane outlet molar concentration (
dn−2 and d
n−1) to predict the value for the next calculation:
where the
nth and (
n−1)
th results are used to predict the value of
d to use in the (
n+1)
th calculation.
The activity multiplier will default to the standard values if there is no input (preferred values are in range from 0.25 to 0.65). The model minimizes the function which is the sum of the appropriately weighted squares of the difference between DCS readings and corresponding values from the simulation. Using input data, the model will converge in 30 s or less to give final results. Logic flow diagram for this model is shown in
Figure 4.
For the purpose of synchronization between the model and any DCS system the C++ programming language was used for development of system-function and compiled with the MATLAB Compiler (MEX) (Version 2019b, The MathWorks, Inc. Natick, US, MA, 2019) [
26]. The programming procedure which contained the basic functionality for SIMULINK shared memory block is shown as a logic flow diagram in
Figure 5.
Characteristic process data of the top-fired SMR designed by Kellogg Inc. which is used in developed model for data reconciliation are given in
Table 3.
Limitations of developed model are the following:
impossibility to evaluate carbon forming potential with higher hydrocarbon feed streams, due to the reason that the model converts all of these compounds to an equivalent methane before any tube integrations take place. However, it is believed that from about 30% tube level down, all higher hydrocarbons have been broken down. Carbon forming predictions from this point in the tube to the bottom are accurate;
the model does not provide any information about tube hot band problems. The model with the heat flux profile does show the region of the highest heat transfer, but nothing more as to hot band formation;
all of the reformer tubes within the furnace are assumed to be identical. Of course, this is not true in real conditions due to reason that tubes close to the refractory brick wall are under different heat fluxes in comparison with the tubes in the middle part of the furnace. In order to compensate this nonuniformity sets of simulations were performed and results are adjusted against real process data.
3. Results and Discussion
The described model was integrated as an open source code software based on Matlab files, relying on the three reactions occurring in the SMR scheme which are given by Xu and Froment [
9,
10]. The kinetics are known for the catalyst used. According to three chemical equations given in
Table 1 and using reaction rates a mathematical model was developed which is able to solve the molar flux profile of each species occurring in reaction scheme by iterative procedure. By using following equation, the calculation procedure is straightforward and converges readily to any desired degree of accuracy:
where
Fi represents the molar flux of species
i,
ri denotes the rate of formation or disappearance of species
i given by Xu and Froment [
9,
10], and
l is the distance along the reactor tube. The model is also able to calculate pressure drop and energy balance with related pressure and temperature profile along the reformer tube [
9,
10,
23,
24,
25,
26,
27]. The Newton–Raphson iterative method of solving ordinary differential equations was used.
The developed model was tested against literature data for methane conversion in reformer tubes at 20 bar and at three different values for steam-to-carbon ratio, namely 1.0, 2.5, and 5.0 in the temperature range from 400 to 1000 °C [
8]. The calculated data in comparison with the literature data are shown in
Table 4 [
8,
11].
According to calculated data it can be concluded that the developed model fits almost perfectly against literature data in all tested temperature ranges from 400 to 1000 °C. The average deviation ranges from 1.69% to 2.06% for the three tested steam-to-carbon ratios.
Calculated data confirm the profile shapes regarding recently published work from Zecevic and Bolf [
27]. The effectiveness factor of 0.001 was used as the typical value for industrial SMR catalyst installed in the reformer tubes [
25]. The effectiveness factor is a function of Thiele Modulus which is related to the catalyst volume and external surface area of the catalyst. In the case of the large reforming catalyst pellet it is not possible to achieve equal accessibility implying that only a thin layer of catalyst close to the surface contributed to the reaction. Any differences may have contributed to the catalyst shape used, as a result of pellet geometry alteration. However, those alterations in pellet geometry of the commercially available reformer are not significant drawbacks to the developed model. All factors mentioned are more than acceptable for industrial practical usage.
The model was used to calculate the residence time required for a reasonable conversion in isothermal conditions and the results are compared with real process data from top-fired SMR unit. The feed composition, inlet molar flow rate, and mass of catalyst were taken from the real process conditions as given in
Table 3. The resulting plot of outlet component molar flow rate as a function of residence time is shown in
Figure 6. It can be seen that the reactor approaches equilibrium at residence times of 15–20 s. According to the results, the outlet component molar flow rates do not deviate more than 3% in comparison with the real process data taken from the real measurements during the operation of the top-fired SMR furnace at the same operating conditions. At the same inlet conditions given in
Table 3 the measured process data are as follows: 10.31 mol % for CH
4, 72.23 mol % for H
2, 9.18 mol % for CO, and 10.63 mol % for CO
2. This also implies that the model is precise enough for industrial usage. The deviations of up to 3% could be explained with inaccurate plant measurements, as a result of temperature or pressure drops in the reactor outlet system or from non-uniform operation between different catalyst tubes inside the SMR. However, to get to closer alignment with real process equilibrium conversions in the future the model will be tested by varying the effectiveness factor values.
The model is also able to calculate the necessary heat duty of the SMR box. The heat duty was calculated according to the inlet and outlet process data as given in
Table 3, considering inlet and outlet temperatures of the reformer tubes of 500 and 800 °C. Additionally, the optimum working temperature for the reformer tubes made of MANAURITE XM and 900 of 820–840 °C was taken as the tube wall temperature of the reformer tubes. That tube wall temperature will guarantee the longer lifetime of the reformer tubes preventing their creep damage. The results are shown in
Figure 7. It is evident that most of the heat duty is required in the first 3 m of the reformer tube, which is in accordance with the location of the top-fired burners. Namely, top-fired burners generate the 3–5 m long flame in the direction from the top to the bottom of the SMR furnace. This result is in complete accordance with the real process data given in
Table 3, because the installed reformer tubes possess the overall length of 11.34 m, with heated length of 10.30 m and catalyst loaded length of 10.0 m.
With respect to inlet conditions given in
Table 3 the molar flux of methane, carbon dioxide, carbon monoxide, hydrogen, and water as a function of the reformer tube length is shown in
Figure 8. It can be seen that the production rate of hydrogen is increasing through the whole length of reformer tube. The model gives methane conversion of 64.64%, the methane molar outlet concentration of 10.54% per dry basis of process gas (water content is completely excluded), and temperature approach to equilibrium of 5 °C. The calculated data in comparison with actual process data at given inlet process conditions fits almost perfectly. It can be seen that reaction equilibrium is shifted in the direction of reactants in the approximately first 0.5 m of the reformer tube length. The reason for this is the strong endothermic behavior of the steam methane reforming reaction. Due to absorption of the heat from the burners the reforming reaction is going toward products until full equilibrium is achieved.
The reaction rate profile for three reactions is shown in
Figure 9. Reaction rate profiles were tested according to the process data given in
Table 3 and the same was compared with the literature data [
9,
10]. From the calculated data for the reaction rates at the given process data, it can be concluded that the model describes the general pattern of behavior very well. The reaction rate 2 reverses the direction between 8 and 9 m down the reformer tube as the temperature increases and the equilibrium point shifts. Regarding the calculated results of the reaction rates for SR1, SR2, and WGS it can be concluded that the model can be used reliably for the performance evaluation of the real process conditions.
The pressure drop profile was tested by application of the Ergun equation [
20] taking into account all characteristics of the loaded catalyst. The characteristics of the catalyst are given in
Table 3, while the inlet pressure and inlet temperature are 30.5 bar and 500 °C. The molar flow rate at the inlet of reformer tubes is 1530 kmol h
−1, which is equal to name plant capacity of 1360 MTPD. The pressure drop profile is shown in
Figure 10. From the
Figure 10 it is visible that the pressure drop along the reformer tubes is 1.21 bar. In real conditions the pressure drop was 1.58 bar. The difference of 0.37 bar can be attributed to uneven packaging and breaking of the SMR catalyst during charging of the reformer tubes and possible sulfur and carbon deposition. The model predicted the characteristics of the catalyst bed as at the start of the lifetime ideally packed with undamaged catalyst pellets and completely clean without any contamination at the available surface area.
The temperature inside the SMR furnace is one of the most important process parameters which influences the energy consumption, conversion of methane, kinetics of the steam methane reforming reaction, temperature approach to equilibrium, and lifetime of the reformer tubes due to creep damage. Optimization of this parameter can save a significant amount of energy during the operations and extend the reformer tube lifetime. In
Figure 11 the temperature profile was calculated by the applied model at the inlet temperature and pressure of 500 °C and 30.5 bar, molar flow of 1530 kmolh
−1, skin temperature of the reformer tube of 840 °C, steam-to-carbon ratio of 3.60, and the exit temperature of 781 °C. In the real plant the average reformer tube outlet temperature at the same inlet conditions was 801 °C. The difference of only 20 °C points to the satisfactory agreement between model and real process conditions.
In order to give meaningful information about changes with time there are three general ways in which the performance of the SMR catalyst can be quantified. These are (a) measurement of composition at the outlet from the reformer tubes, (b) determination of the
ATECH4 at the outlet of reformer tubes, and (c) calculation of catalyst activity or active volume of catalyst. By calculating the
ATECH4, it is possible to arrive at an expression for the trend in relative catalyst activity. The
ATECH4 can be used as a good measure of the catalyst performance when the operating temperature of the reactor is held constant and when the reaction is equilibrium limited, such as with SMR [
12]. According to this, the model was used to evaluate the
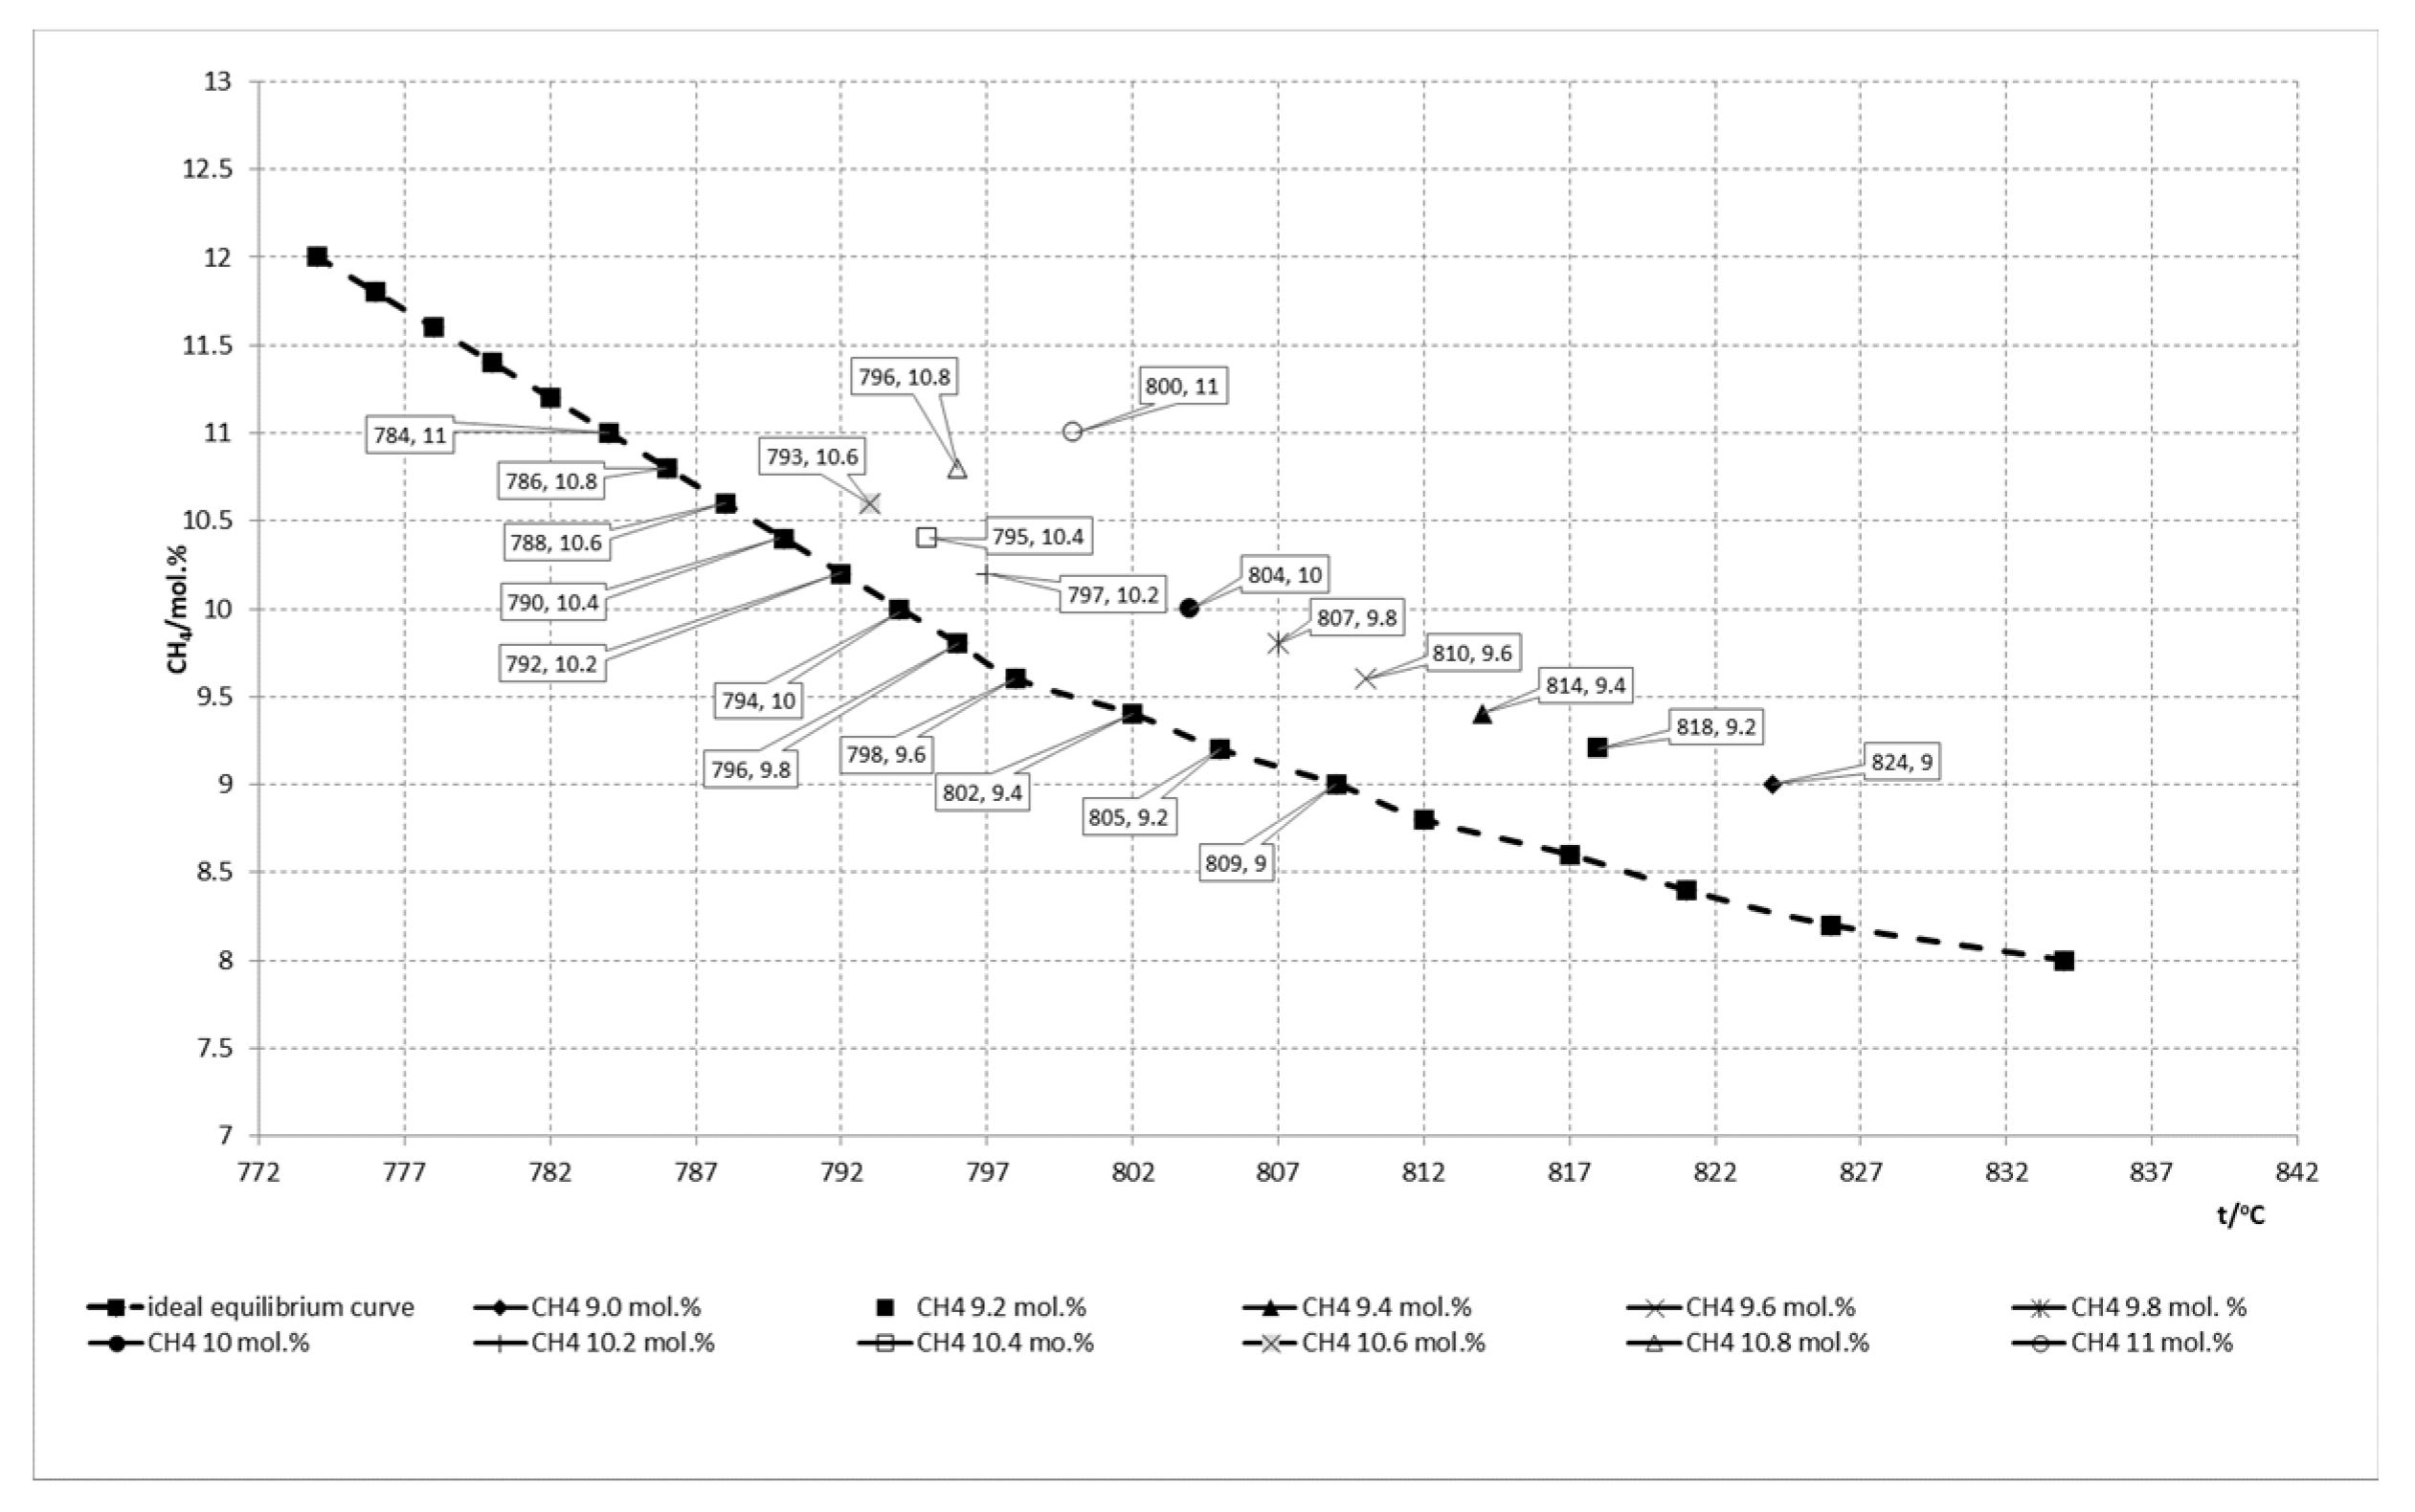
ATECH4 values of the SMR catalyst in operation in comparison with ideal equilibrium curve at different outlet methane molar concentrations and temperatures. The relationship between calculated
ATECH4 values of the SMR catalyst in operation against the ideal equilibrium curve, is shown in
Figure 12.
From the data given in
Figure 12 it can be concluded that the catalyst achieves better
ATECH4 values in the outlet methane molar concentrations in the range of 10.2–10.6 mol. % and the same are at the level of 5 °C which reflects excellent performance of the catalyst activity. In the range of the higher outlet methane molar concentration the values of
ATECH4 are in the range of 5–10 °C which gives acceptable performance of the catalyst activity, while in the lower range the values of
ATECH4 are higher than 10 °C which correspond to marginal performance. This is the reason for appropriate adjustments of the process parameters to achieve better catalyst performance.
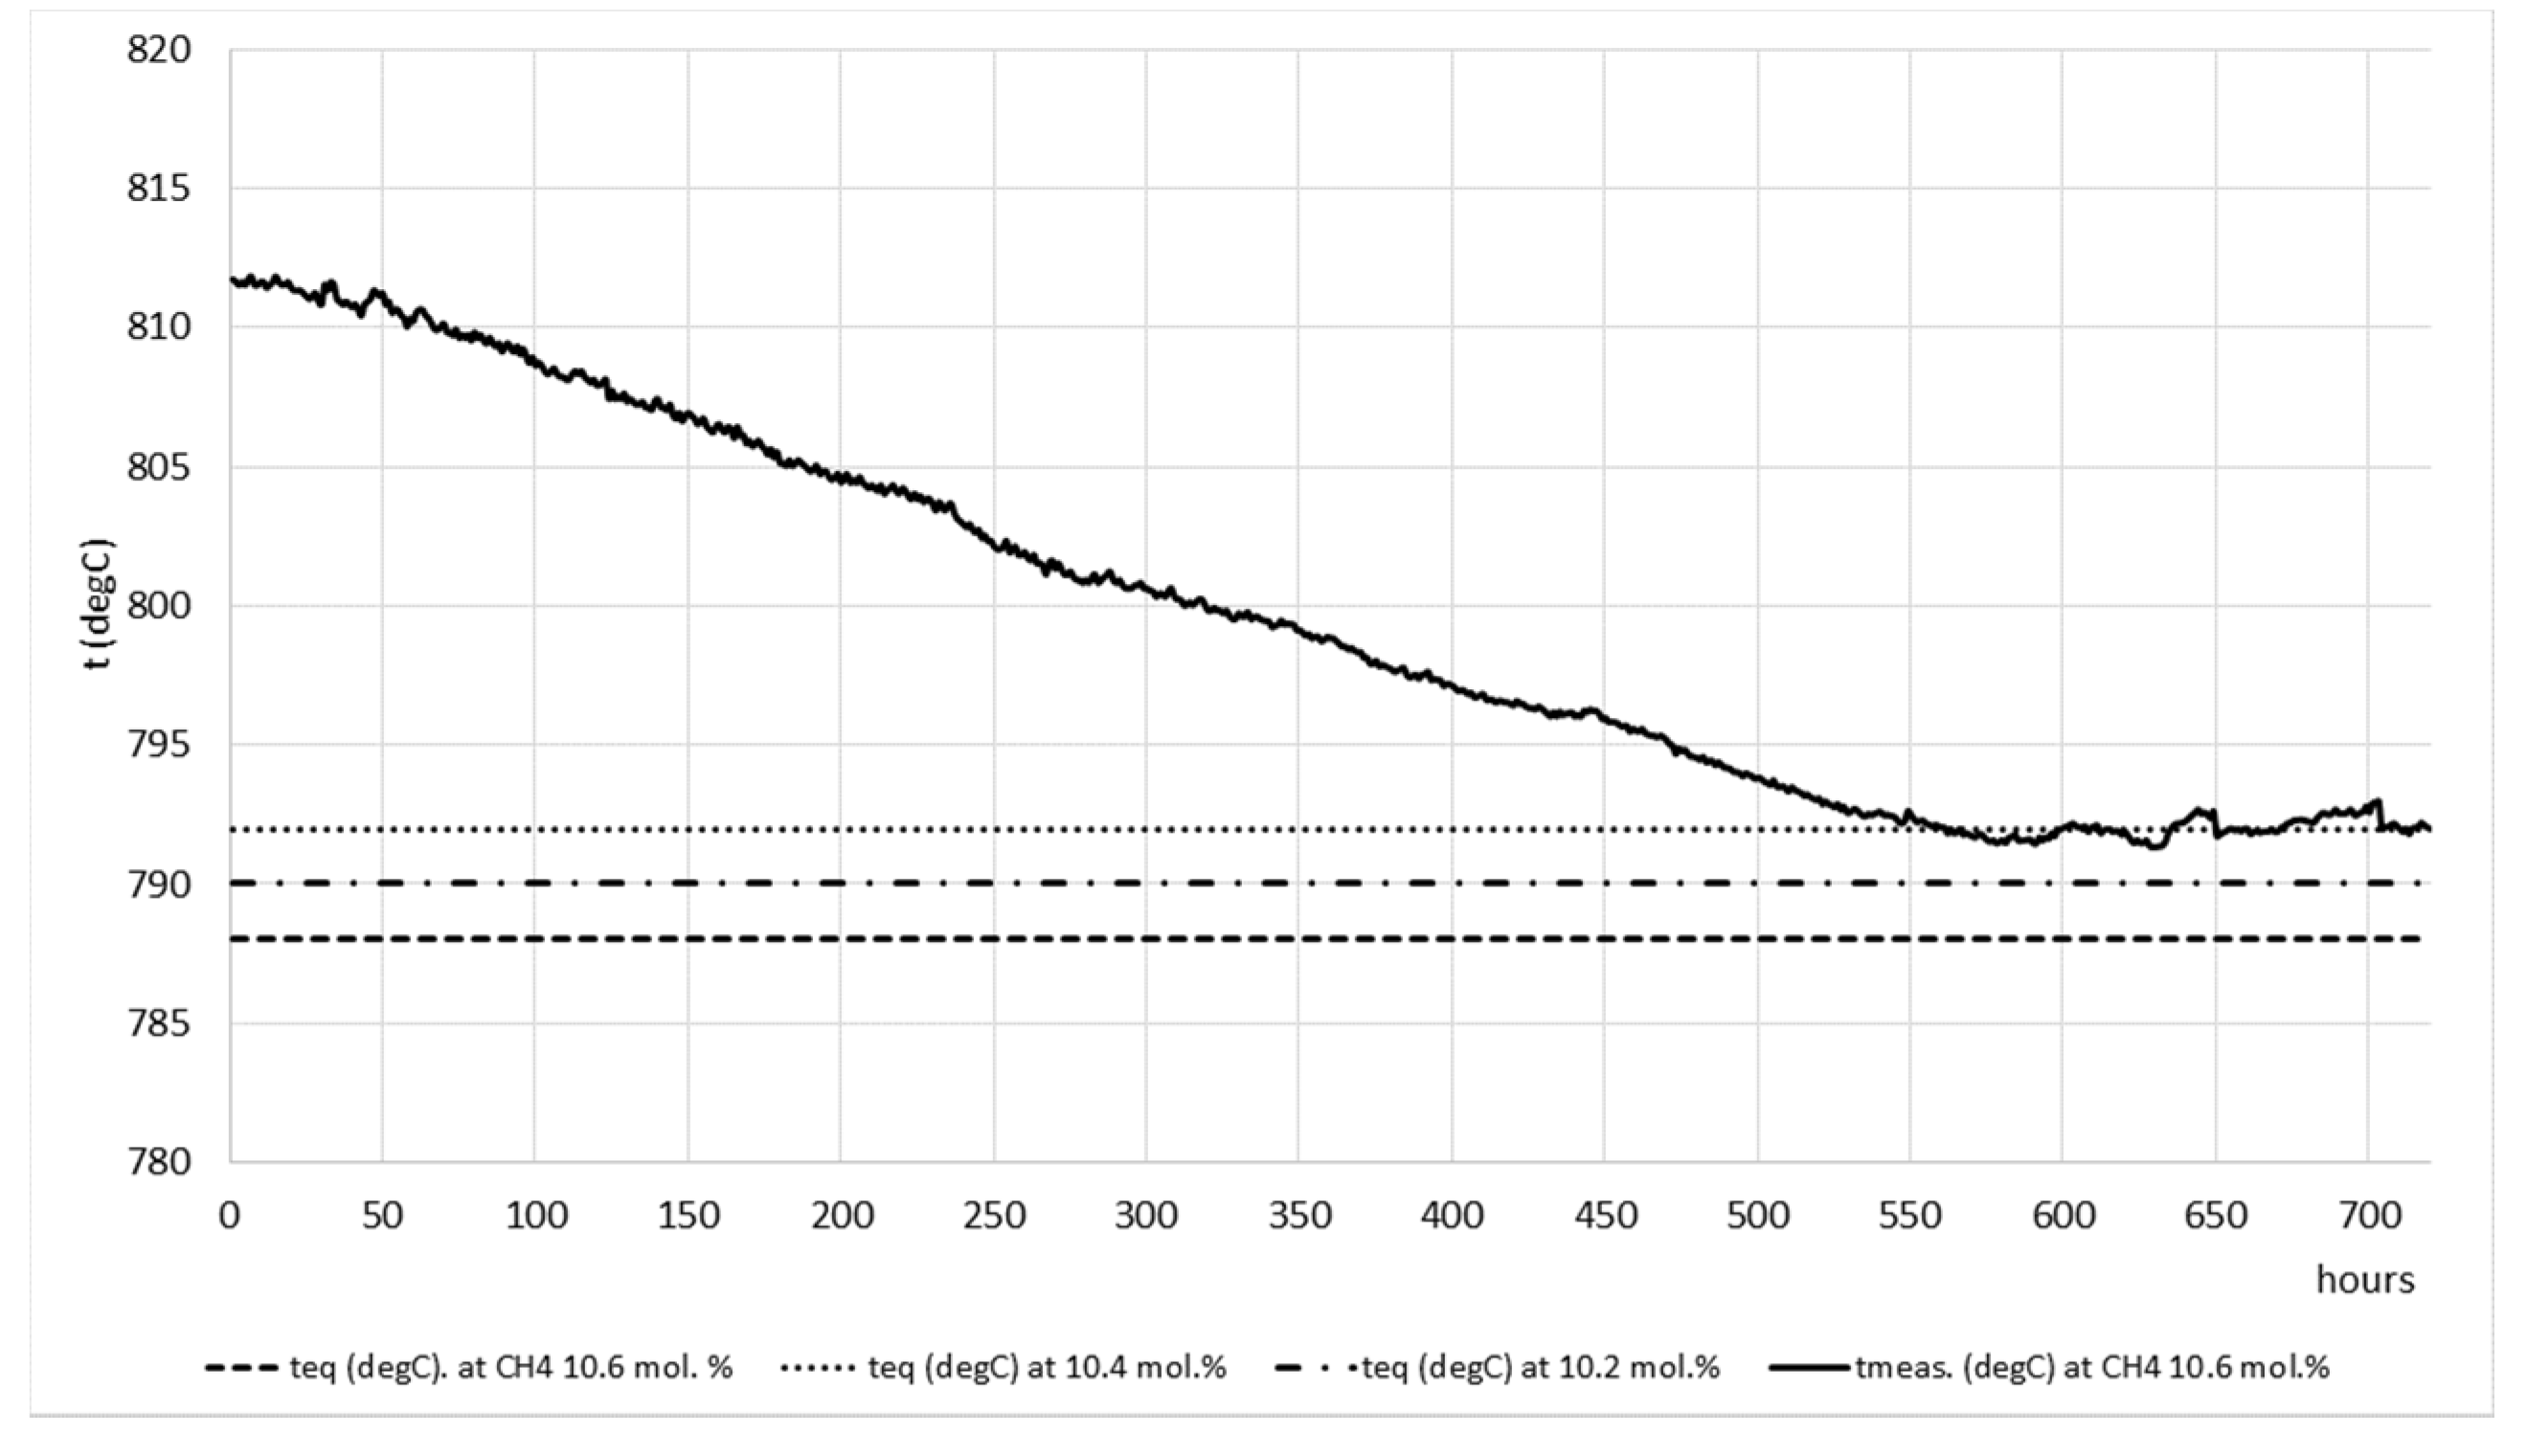
To test all features of developed model the same was connected with the DSC system in the existing ammonia plant through memory block and process data was retrieved for proper adjustments of parameters in order to improve catalyst performance and tube wall temperatures during ammonia operation. In
Figure 13 catalyst outlet temperature readings regarding the equilibrium temperature at three different outlet methane molar concentrations are shown, namely 10.6, 10.4, and 10.2 mol. %, respectively. In
Figure 14A,B the tube wall temperature readings are shown. In both cases the results are shown before and after implementation of recommendations given from the model in the period of 720 h.
From
Figure 13 it can be seen that the
ATECH4 values before implementation of recommendations from the model are at the level of approximately 20 °C. After following model recommendations (adjustments of the steam-to-carbon ratio and firing in the reformer furnace), the
ATECH4 values are approaching the equilibrium temperature and are also in the range from 0 to 10 °C. The target value for outlet methane molar concentration was 10.4 mol. %.
From
Figure 14A it can be seen that the tube wall temperatures are in the higher temperature range from 840 to 860 °C which reflects severe temperature conditions against tube metal alloy. At the same time, after following model recommendations by adjustment of the firing rate in the reformer furnace the tube wall temperature pattern is more uniform with the temperature range from 820 to 840 °C, which is shown in
Figure 14B. On average this represents 20 °C lower temperature which is extremely favorable for tube performance, because a decrease of about 20 °C will significantly prolonged the tube lifetime.
During the test period the energy savings in terms of lower natural gas consumption were also measured. Before applying the recommendations from the model, the natural gas consumption was at the level of 1045 m3 tone−1 of ammonia. Following model recommendations, it was observed that the natural gas consumption was lower for 33 m3 t−1 of ammonia which represents the savings in the amount of 3.15%. The achieved level of savings presents an extremely attractive savings scheme to be applied during operation of top-fired SMR in ammonia production.


