Abstract
Corn is one of the main food products in Mexico. The elaboration of corn-derived products generates wastewater with a high organic load (nejayote). Anaerobic digestion is an indicated treatment for wastewater with high organic loads. The results of this study show that the application of microaeration in the hydrolysis-fermentative reactor increased the percentage of volatile fatty acids (VFA) available in the medium by 62%. The addition of a conductive material, such as granulated activated carbon (GAC), promotes DIET (Direct interspecies electrons transfer) in the methanogenic UASB reactor increasing the methane yield by 55%. Likewise, a great diversity of exoelectrogenic bacteria, with the ability to donate electrons DIET mechanisms, were developed in the GAC biofilm, though interestingly, Peptoclostridium and Clostridium (17.3% and 12.75%, respectively) were detected with a great abundance in the GAC biofilm. Peptoclostridium has not been previously reported as a participant in DIET process.
1. Introduction
One of the main wastewaters produced in Mexico and in the Yucatan region is generated in the process of corn nixtamalization [1]. Throughout Mexico, it is estimated that the industrial production of this wastewater, known as nejayote, is in the range of 2.2–3.5 m3 per t−1 of processed corn every year [1,2]. This complex waste has a pH in the 10–13 range, a chemical oxygen demand (COD) between 3.5 and 40 g L−1 and a phenol concentration of 4.2–10 g L−1 [3,4,5]. Likewise, Yucatan peninsula (Mexico) has one of the most extraordinary and particular geologies in the world. Yucatan is a peninsula of 165,000 km2 formed by karst geology, which means that practically all the fresh water is underground, forming subsurface rivers connected to each other [6]. Undeniably, this makes the water resources in Yucatan especially vulnerable to contamination by the discharge of wastewater [7].
Anaerobic digestion is a mature technology, which has produced some very satisfactory results in the treatment of a wide variety of agro-industrial organic waste and the bioenergy generation [8]. Usually the hydrolytic stage is the limiting phase process, which can lead to low yields in methane production [9]. Promotion of a micro aerobic environment through air dosing has been proven as a method to increase the volatile fatty acids (VFA) generation rates, mainly in solid substrates [10]. Microaeration favors the growth of facultative bacteria, thereby increasing enzyme activity and in turn the hydrolytic rate [11].
Another problem suffered by anaerobic digestion systems is VFA accumulation. In recent years, many studies advocate the addition of abiotic conductive materials in anaerobic reactors to promote direct interspecies electron transfer (DIET) [12,13,14]. When compared to mediated interspecies electron transfer (MIET), DIET requires less energy consumption because it does not have any problem with the diffusion of electron transporters [15]. Generally, the oxidation of an organic substrate is thermodynamically unfavorable (∆G° > 0). However, the overall methanogenesis reaction has a negative Gibbs free energy value making this reaction possible [14]. The electroactive connections between exoelectrogenic bacteria and electrotrophic archaea through conductive materials help to increase the oxidation rate of organic compounds, such as acetic, propionic and butyric acids [16,17]. DIET presents a more favorable mechanism for syntrophic relationships of microorganisms in methane production, keeping the systems stable at high organic loads and high hydrogen partial pressure [18,19]. In order for DIET to occur, the exoelectrogenic community develop a biofilm on the conductive material added to the reactor [20,21]. Therefore, the study of the communities developed in the biofilms can shed light on the number of groups of bacteria that can participate in DIET.
From 2014, the DIET between exoelectrogenic bacteria and electrotrophic methanogens was evidenced through pili in a Geobacter-Methanosaeta co-culture [12,13]. Six years, through the identification of microorganisms in biofilms enriched in conductive materials (magnetite, granular activated carbon, biochar, graphene, iron oxide nanoparticles, hematite and akaganeite), exoelectrogenic bacteria have been discovered, such as Thauera, Sporanaerobacter, Enterococcus, Pseudomonas, Anaerolinaceae, Bacteroides, Streptococcus, Syntrophomonas, Sulfurospirillum, Caloramator, Tepidoanaerobacter, Coprothermobacter, Clostridium senso stricto, Peptococcaceae, Caloramator, Syntrophmonadaceae and Bacillaceae. Also electrotrophic methanogen genera have been found able to participate in DIET, such as Methanosarcina, Methanobacterium, Methanolinea, Methanothrix, Methanoregula, Methanimicrococcus, Methanosaeta and Methanospirillum [14,18,20]. However, the number of bacteria capable of participating in DIET through conductive materials is still unknown [14,21].
This study investigates the two stage anaerobic digestion of nejayote throughout microaeration in the hydrolytic reactor and how this can be taken advantage of by employing carbonaceous conductive materials in the methanogenic reactor promoting DIET.
2. Materials and Methods
2.1. Substrate and Inoculum
Nejayote samples were obtained from a flavor corn company in Yucatan (Mexico). They were transported in 25 L high-density polycarbonate containers and kept at −80 °C. The nejayote was characterized according to the following parameters: pH, total solids (TS), volatile solids (VS) and COD [22].
The inoculum used in both reactors was a mixed microbial consortium, which consisted of soil (30 cm deep) 30 g L−1, dairy manure 300 g L−1; swine manure 150 g L−1, commercial Na2CO3 1.5 g L−1, and tap water 1 L [23]. Previously, this inoculum was employed successfully in nejayote anaerobic digestion [1].
2.2. UASB
UASB reactors were built in PVC (Polyvinyl chloride) with a working volume of 6.2 L, a height of 72.5 cm and a diameter of 10.14 cm in the central cylinder, maintaining a good diameter-height ratio as indicated in literature [1,8,24,25].
The assigned nomenclature for UASB (Upflow Anaerobic Sludge Blanket) with, and without, GAC was as follows, respectively; UASB DIET, and UASB control [24,25].
Both reactors have two reducer connecters to facilitate sedimentation and granulation of the inoculum. 2 bags of metal mesh 316 (400 × 400), one at 35 cm and the other 60 cm from the bottom, each with 40 gr of granular activated carbon was introduced as a conductive support in the UASB DIET [15].
To start up the UASB, synthetic wastewater and inoculum in a ratio of 1:1 was used on volume. The composition of the synthetic wastewater was 4 g/L sucrose, 1 g/L ammonium chloride, 0.2 g/L potassium phosphate, and 1 g/L sodium bicarbonate [1]. The reactors operated with an ascending flow velocity of 1.0 ± 0.2 m/h [1,19], a pH range of 6.8–7.4, at mesophilic temperatures (38 ± 1 °C), which were maintained with a circulating water bath WiseCircu®. The organic loading rate was increased from 1 to 5.5 kg COD m−3 d−1 until the reactors collapsed. The produced volume of biogas was measured by displacement of water and headspace pressure was measured employing a digital pressure transducer (type PN78 up to 2 bars, ifm, San Pedro Garza García, N.L., Mexico) with a syringe that was connected to pierce the septum. Statistical analysis was performed with the Analysis ToolPak in Microsoft Excel (Excel 2016 (v16.0), Microsoft, CDMX, Mexico).
2.3. Experimental Setup Hydrolytic Reactor
Anaerobic packed bed reactors (APBR) were employed as hydrolytic reactors. The assigned nomenclature for hydrolytic APBRs with and without microaeration was as follows, MR (APBR with microaeration) and CR (APBR control).
Both reactors were made with acrylic material, the shape was cylindrical and with a total volume of 6.18 L, a height of 21.6 cm and a diameter of 19.1 cm. The working volume of both reactors were 4.1 L. PVC rings with a diameter of 1/2” (1.27 cm) were used as packing material. Additionally, an acrylic plate was set at 4.8 cm high with holes attached to a 26 gauge 18 × 18 stainless steel mesh. The mesh function was to support the packing material. Temperature was controlled by a thermostatic bath (ALPHA RA 8, LAUDA, Delran, NJ, USA) and reactors were jacketed with polyester fiber and foamed polyethylene to avoid heat loss. MR and CR worked at 34 ± 1 °C [24].
Air injection in MR a plastic spiral tube with holes was inserted from the top of the acrylic plate. Tube was connected to an acrylic Hydra flowmeter with SS 304 float material, SS 304 guide material and flow range 0 to 3 L min−1. To control the volume of air injected in MR a Resun AC-9602 air pump with a maximum air flow of 3.5 L min−1 was used, which was connected to the flowmeter through a plastic tube. The air pump was connected to a timer to regulate the microaeration period. The air was introduced for a period of 6 min, every 2 h and 40 min, according to literature data [10,11].
In both MR and CR, 3.6 L of nejayote (without any pH adjustment) and 0.5 L of inoculum were introduced at the beginning of the experiment. The test was performed in duplicate for each treatment. An oxidation-reduction potential sensor (model MTC101, HACH, Tlalnepantla, Edo. De México, Mexico) was introduced at the top of MR and CR to measure the oxidation reduction potential.
2.4. Experimental Setup: Coupled Reactors
Two APBR reactors with microaeration were connected to two UASB reactors.
When referring to the overall process of the set of two reactors, they will be named as follows: control process is APBR control + UASB control and DIET process is APBR DIET + UASB DIET (Figure 1).
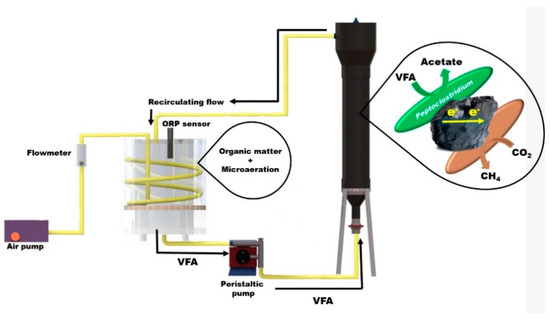
Figure 1.
Reactors coupling system; packed bed reactor with micro-aereation and upflow anaerobic sludge blanket.
While, 40 g L−1 of GAC was introduced as conductive support to the UASB DIET [19]. The GAC (Carbotecnia-25 Kg-Activated carbon from bituminous coal-granulometry 12 × 40) was placed in a 400 × 400 gauge 316 stainless steel mesh bag with a volume of 487 cm3 to prevent GAC arriving to the peristaltic pump. Inside the UASB DIET, a PVC base was placed to seat the steel mesh bag. A LAUDA ALPHA RA 8 thermostatic bath was used to control temperature (37 ± 1 °C). Reactors were jacketed with a polyester and foamed polyethylene fiber to avoid heat loss.
Connection of the APBRs with UASBs was made 24 h after starting hydrolysis of the nejayote in APBR, when maximum concentration of VFA was reached. The organic loading rate used in the experimentation was 4.2 kg COD m−3 day−1.
2.5. Analytical Techniques
The percentage of methane was determined on a Molsieve column (30 m long, 0.53 mm internal diameter, and 0.25 µm film thickness) in a gas chromatograph (Clarus 500-Perkin Elmer, Waltham, MA, USA) with the thermal conductivity detector (TCD). Nitrogen was used as gas carrier and temperatures of 75, 30 and 200 °C were used for the injector, oven, and detector, respectively. VFA were determined in a gas chromatograph (Clarus-500 Perkin Elmer, Waltham, MA, USA). The column employed was Agilent J&W (30 m long, 0.53 mm internal diameter) with a flame ionization detector (FID). Before analyzing VFA by chromatography, samples were filtered, acidified with phosphoric acid, centrifuged and frozen at −80 °C for 24 h. Temperature, pH, TS, and vs. were analyzed, following standard methods [22]. Colorimetric methods (Hach Company DR-890, Loveland, CO, USA) were used to determine COD. Redox potential was determined employing a Hach Lange model MTC101 oxidation-reduction potential sensor.
2.6. Statistical Analysis
Physicochemical parameters were performed in duplicate and their results were expressed as mean ± standard deviation (SD) using the Statistica 9 software (version 9, StatSoft, Cary, NC, USA).
2.7. Microbial Community Composition Analysis by Metagenomics Sequencing
DNA (Deoxyribonucleic acid) extraction was performed at the end of the two-stage anaerobic digestion experiment. The nomenclature used to identify the samples was as follows: S UASB control for the UASB control sludge sample, S UASB DIET for the UASB DIET sludge sample, B steel for the sample of the biofilm formed in the steel mesh bag and B GAC for the sample of the biofilm formed in the GAC.
Three extractions were made from each sample to ensure the representativeness of the analysis. DNA extraction was performed with the ZymoBIOMICS ™ kit (Zymo Research, Irvine, CA, USA), following the protocol of the producer. The DNA pellet was resuspended in 50 µL of TE (Tris-EDTA) buffer (10 mM Tris-HCl (pH 8) and 1 mM EDTA (Ethylenediaminetetraacetic acid) (pH 8)). DNA concentration and purity were determined on a NanoDrop ND-1000 spectrophotometer (NanoDrop Technologies, Seattle, WA, USA). The A260/280 ratio was always higher than 1.6 in all the samples, and the DNA concentration between 50–100 ng L−1. The primers used for amplification of 16S rDNA gene region were 341F and 805R. DNA was sent for sequencing (RTL genomics, Lubbock, TX, USA), this was performed using Illumina Miseq platform. The software used for analysis of the data obtained was Galaxy and database consulted was from National Center for Biotechnology Information. The principal component analysis was performed with NTSYS software (version 2.2, NTSYS software, Copthall, Roseau Valley, Dominica) [26].
3. Results and Discussion
3.1. Substrate Characterization
Nejayote can be considered a liquid waste, but when it is analyzed in detail a large amount of solids from the nixtamalization process are observed [4]. In this process, the pericarp of the corn kernels is detached and becomes part of the nejayote giving it a consistency between liquid and solid [27]. The results obtained in the substrate characterization were pH (10.20 ± 0.4), total solids (TS) (1.22 ± 0.01%), volatile solids (VS) (0.84 ± 0.01%) and COD (30.37 ± 8.99 g L−1) (Table 1). These values are in the range reported by others studies [3,4].

Table 1.
Nejayote characterization compared with other studies.
3.2. UASB Startup and Selection of Organic Loading Rate of Coupled Reactors
COD removal percentage in control UASB was 88 ± 4%, before reaching the organic loading rate of 4.6 kg COD m−3 day−1, thereafter decreasing to 45% (Figure 2). Likewise, the UASB DIET had a stable performance, keeping an effluent COD around 2 ± 0.7 g L−1 and had 98 ± 0.5% of the COD added removed from the beginning of the experimentation until the organic loading rate increased to 5.5 kg COD m−3 day−1, thereafter decreasing to 54%.
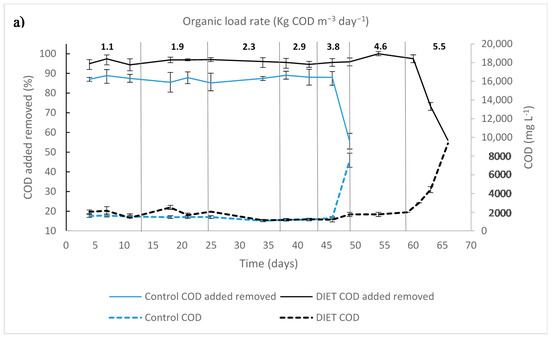
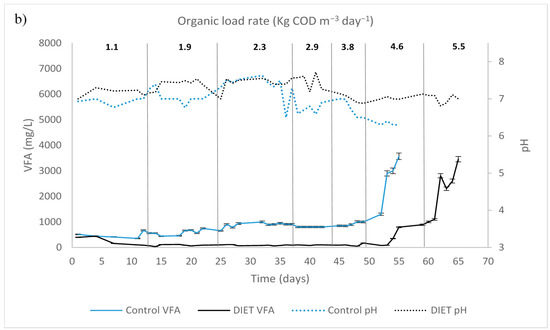
Figure 2.
Upflow anaerobic sludge blanket startup and different organic load rate: (a) chemical oxygen demand; (b) volatile fatty acids (VFA) and pH.
On day 54 of experimentation, with an organic loading rate of 4.6 kg COD m−3 day−1, the VFA concentration reached levels of 2.6 g L−1 in UASB control; while in UASB DIET the values were 1.4 g L−1. The VFA/alkalinity ratio exceeded 0.5 in UASB control. A UASB reactor has optimal performance when the VFA is kept below 1.5 g L−1 and the VFA/alkalinity ratio is below 0.5 [24,25].
3.3. Oxidation Reduction Potential Influence in Hydrolytic Reactor
The volume of air injected in MR was 274 L air (kg TS day)−1 [28]. The air was introduced for a period of 6 min, every 2 h and 40 min. The reducing environment, generated by the presence of the anaerobic inoculum and the lack of oxygen in the reactor, produced a quick decrease in the ORP to values of less than −500 mV in both reactors. This reduction was linked to the high concentration of hydrogen gas detected in both reactors, 39.4% and 67.3% for MR, and CR respectively. The ORP is the tendency of a compound to obtain electrons, the higher the capacity to acquire electrons, the greater the ORP of a redox pair [29]. Each redox pair has a specific reduction oxidation potential, in the case of H+/H it is −420 mV [30], while oxygen/water has a value of +820 mV [29]. This means that electrons have a greater affinity for the oxygen introduced into the reactor, and thus, the reactor ORP should increase because the specific potential value of oxygen is very high. In reactors that have a high concentration of hydrogen, the electrons begin to reduce free protons which causes a reduction in the ORP because the specific potential value of hydrogen is −420 mV. When hydrogen is consumed, the ORP increases because redox pairs with higher intrinsic ORP become more relevant. The results of reactor MR, on day 1 when the hydrogen concentration was high (67.3%), the ORP was low (−557 mV) however, by day 4 when the value of hydrogen has been reduced to 0% the ORP was significantly increased (−275 mV). Therefore, the air added in this study caused an increase in the oxidation-reduction potential (ORP) [28,31].
The results show that microaeration increases 62% of VFAs after 24 h (Figure 3).
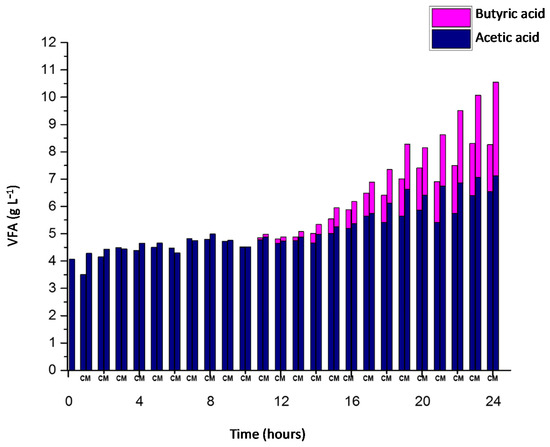
Figure 3.
Volatile fatty acids concentration in APBR; with microaeration (M) and without microaeration (C) during 24 h.
Figure 3 shows the initial VFA concentration was 4 g L−1 in the reactors. 5 g L−1 of VFA was exceeded in CR and MR after 13 and 14 h of the test respectively. The increment is more significant after 18 h of test.
At the end of the experimentation, the VFA concentrations were 8.1 and 10.5 g L−1 for CR, and MR respectively. Likewise, Figure 3 shows that acetic acid makes up 100% of the VFAs during the first 10 h. Butyric acid was generated after 11 h of experimentation.
The acetic acid concentration increased from 4 g L−1 to 6.5 and 7.2 g L−1 for CR, and MR respectively. On the other hand, butyric acid produced during acidogenesis in CR was 1.7 g L−1, while in MR the final concentration of butyric acid was 3.4 g L−1.
3.4. Performance of Coupled Reactors
APBR reactors and the UASB reactors were coupled after the first initial 24 h, when maximum concentration of VFA was reached in APBR reactors. The organic loading rate used in this experimentation was 4.2 kg COD m−3 day−1, according to the results obtained previously.
3.4.1. APBR Control + UASB Control
The UASB control was outside the optimal range for the correct performance of the methanogenic community. Methanogenic microorganisms are more sensitive to pH decreases than fermentative bacteria, and so pH drops can affect their methanogenesis performance [32]. In the Figure 4, the pH in both APBR dropped to values less than 6 on the first day of experiment, however the APBR control never reached the value 7. The optimal pH for the development of the microorganism community participating in methanogenesis is between 6.8 and 7.3 [33]. As the reactors were connected in recirculation, APBR were affected by UASB. Therefore, the pH at the end of experimentation in reactors connected were very similar values (above 7).
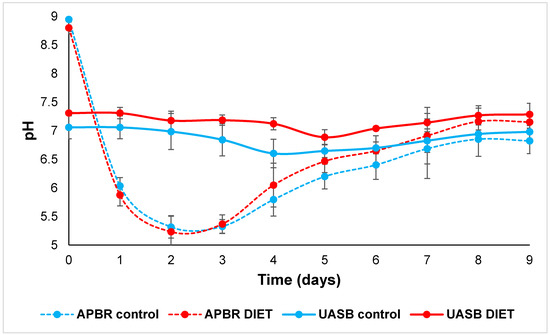
Figure 4.
pH in APBR control, APBR DIET, UASB control and UASB DIET.
During the experimentation, the VFA concentration exceeded 5 g L−1 in the UASB control; this implies that VFA generated in APBR control accumulated in this reactor due to poor performance in the methanogenic phase. It recorded a VFA concentration of 3.35 ± 0.02 g L−1 at the end of the experiment (Figure 5). In the UASB control, acetic acid was detected throughout the experiment, which demonstrated that it was not possible to metabolize all the acetic acid produced through acetoclastic archaea and syntrophic oxidation by MIET [34,35,36].
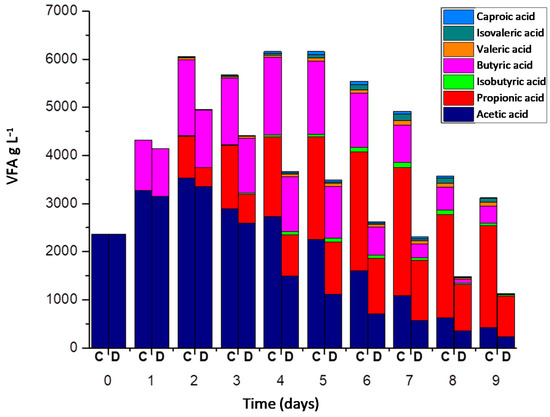
Figure 5.
VFA concentration in Control process = C (APBR control + UASB control) and DIET process = D (APBR DIET + UASB DIET).
On the seventh day, the maximum propionic acid concentration was reached with values recorded at 2.66 ± 0.56 g L−1 in the control process (Figure 5). At the end of the experiment, the concentration of propionic acid registered in the control process was greater than 2 g L−1. The degradation of propionic acid in anaerobic reactors is a thermodynamically unfavorable oxidation process, which causes its accumulation and inhibition problems in the reactors [37]. The control process achieved a COD removal of 62.66 ± 6.23% (Figure 6a).
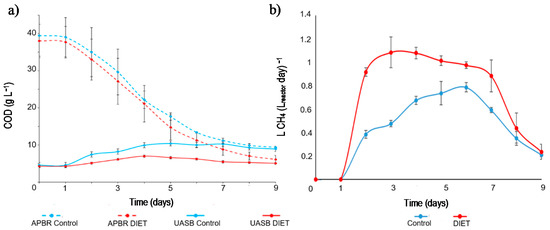
Figure 6.
(a) COD concentration in APBR control, APBR DIET, UASB control and UASB DIET. (b) Methane yield in Control process and DIET process.
Figure 6a shows the COD evolution in APBR and UASB reactors. The nejayote employed in these tests had a high COD concentration (39.51 ± 5.57 g L−1). Due to recirculation between the APBR and the UASB, and the anaerobic digestion process itself, the amount of organic matter present in the connected reactors was equalized as the process progresses. At the end of the test, the difference in the COD concentration between APBR control and UASB control decreased from 39.51 g L−1 to 10.04 g L−1.
3.4.2. APBR DIET + UASB DIET
In other studies, it has been shown that pH values are kept more stable in reactors when conductive materials were added, compared to those reactors without [38,39]. In APBR DIET the pH reached a value of 6 on the fourth day and exceeded 7 on the eighth day (Figure 4). Generally, the VFA accumulation causes a pH decrease. In this study, given that these VFA were consumed with greater efficiency through DIET, this pH diminution was avoided in UASB DIET, which kept the reactor in constant conditions. It has been widely reported that DIET process metabolizes alcohols and VFA more efficiently than MIET [40,41]. DIET avoids the inhibition problems of high hydrogen partial pressure and drastic pH drops due to VFA accumulation [18]. When hydrolysis, acidogenesis and acetogenesis are performed efficiently, and methanogenesis is not performed at the same rate, the system is unbalanced and increases the VFA concentration [42].
The reactor with best performance in VFA degradation was UASB DIET. VFA concentration never exceeded 1.6 g L−1 in UASB DIET during the entirety of experiment.
Highest acetic acid concentration in UASB DIET was 0.29 g L−1, the day after reactors were connected (Figure 5). When UASB control reached its maximum acetic acid concentration, the UASB DIET had already consumed all the acetic acid. This clearly demonstrates that the acetic acid generation and its subsequent consumption was much faster in UASB DIET. This improvement in acetic acid degradation performance was due to conductive material addition and DIET promotion. The conductive materials promote the syntrophic relationship between acetogenic bacteria and methanogenic archaea, facilitating the acetic acid degradation and improving the methane generation [43]. There are two potential pathways for methane production from acetic acid [44]. One is from methanogenic acetoclastic archaea and the other pathway is by acetic acid oxidation in the syntrophic relationship between bacteria and archaea, either via DIET or MIET. The absence of acetic acid from the fourth day in UASB DIET indicates that acetic acid generated by propionic acid and butyric acid oxidation was fully metabolized [45]. These results demonstrate that the GAC boosted the synergistic relationships between bacteria and archaea in the acetic acid degradation.
On the seventh day, the maximum propionic acid concentration was reached with values recorded at 1.25 ± 0.21 g L−1 and at the end of the experiment was less than 0.9 g L−1 in the DIET process (Figure 5). The degradation of propionic acid in an anaerobic system requires the syntrophy between propionic oxidizing bacteria and hydrogenotrophic methanogenic archaea [46]. Electron transport by DIET has been reported to have a more negative Gibbs free energy value than that performed by MIET.
The COD concentration at the end of the experiment in the APBR DIET was 52.6% lower than APBR control. At the end of the test, the difference in the COD concentration APBR DIET + UASB DIET was from 35.21 g L−1 to 4.09 g L−1. In the UASB control and DIET, where methanogenesis occurred, this difference increased to 77.12% between them. The DIET process achieved a COD removal of 78.77 ± 4.55% (Figure 6a). The GAC promotes direct interspecies electron transfer, which causes an increase in the degradation rate of the organic matter hydrolyzed by APBR [47].
3.4.3. Methane Yield
Figure 6b shows the methane yield throughout the experiment. The UASBs started to feed the APBRs at the end of the first day, so a record of generated methane was at the end of the second day of the test. From the beginning to the end of the test, the methane yield was higher in the DIET process than in control process. The methane yield in the DIET process was over 0.9 LCH4 (Lreactor day)−1 until the sixth day of experimentation. This value was never reached by the control process. At the beginning of the experiment, there was a higher concentration of organic matter, which was used by UASB DIET to reach 1.08 ± 0.13 LCH4 (Lreactor day)−1. In the control process, the highest methane value was detected on the sixth day of the test (0.79 ± 0.04 LCH4 (Lreactor day−1). The control process required a longer time than the DIET process to degrade the VFA. Consequently, there was a lag of three days to achieve the maximum methane yield in the control process. The total methane yield throughout the experiment was 55% higher in the DIET process. Increases between 20% and 300% have been reported in methanogenic reactors when conductive materials have been added [19,40,48].
3.5. Analyses of Microbial Communities
To explore the improved methanogenesis in the reactor supplemented with GAC, the bacteria communities were analyzed by sequencing the 16S rRNA gene of the biofilm adhered to the GAC to the steel mesh and suspended sludge in the two reactors described. The dendrogram located at the top of Figure 7 explains the similarity between the four samples analyzed. S UASB control shows a similarity coefficient of 0.64 with S UASB DIET and B Steel. However, the correlation coefficient between S UASB DIET and B steel was 0.96, indicating great similarity between both samples. B GAC shows the greatest difference with respect to the other three samples with a coefficient of 0.13. The GAC was static inside the steel bag and the carbon surface is porous, allowing the development of completely different communities in B GAC sample.
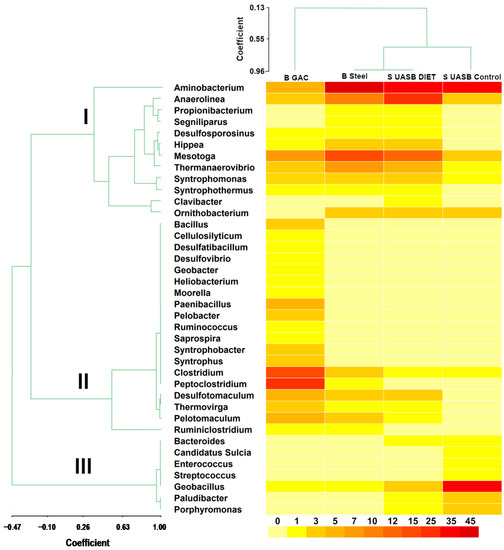
Figure 7.
Heat map and dendrograms at genus level. Granulated activated carbon biofilm (B GAC), steel mesh bag biofilm (B steel), UASB DIET sludge (S UASB DIET) and UASB control sludge (S UASB control). The heatmap scale is color-coded from 0% to 45% abundance. The correlation coefficient in the dendrograms appears on the two scales.
The different analysis (heat map and dendrogram) demonstrates a great similarity between B steel and S UASB DIET. The constant movement of the sludge in the reactor, together with the completely flat surface of the steel mesh, resulted in both communities developing similar bacteria and abundances in both samples. Aminobacterium are capable of degrading amino acids to VFAs. Aminobacterium colombiense and Clostridium sporogenes do not contain FDH (formate dehydrogenase) genes, which means they can only operate via H2 electron transfer in syntrophic metabolism. Some other substances besides H2 and formate have been reported as electron carriers in syntrophic metabolism [40,41,46].
The dendrogram of bacterial genera (Figure 7) shows three well defined clades. The second clade was made up of bacteria that were only detected in B GAC or those that were more abundant in B GAC than in any other sample. Additionally, other exoelectrogenic bacteria with less abundance than the previous mentioned also clustered in this clade (Desulfatibacillum, Geobacter, Pelobacter, and Desulfovibrio). These bacteria belong to the phylum Deltaproteobacteria, which are able to transfer electrons extracellularly and to reduce both Fe (III) and sulfate [49]. Iron-reducing microorganisms can transport electrons extracellularly in sediments and soils [50]. This ability can also be applied in others environments such as anaerobic digesters. Peptoclostridium and Clostridium were the bacteria with the highest abundance in B GAC (17.3%, and 12.75%, respectively). Peptoclostridium was developed in the GAC biofilm and its similarities in the metabolic processes carried out by Clostridium, suggests that these two bacteria played an important role by transferring electrons through GAC to electrotrophic methanogens. There is a considerable saving, in terms of the energy consumed, to transfer of electrons through DIET when compared to MIET [51].
Synergistetes has been rejected as a possible participant in DIET [51,52] which can be observed by its low presence in B GAC (8.9%). The phylum with the highest abundance in B GAC were Firmicutes (62.6%), Proteobacteria (10.5%) and Thermotogae (6.8%). Bacteria belonging to these three phyla have been identified as electron donors in DIET [44,53]. An enrichment in electroactive Firmicutes was detected. Clostridium abundance increased to 12.8% in B GAC. This genus has been reported to have the ability to transfer electrons extracellularly and to reduce Fe (III) [54] and it has been identified in other studies as an exoelectrogenic bacteria participating in DIET [55]. Two Firmicutes belonging to the Peptococcacea family, Desulfotomaculum and Pelotomaculum, were detected with an abundance of 4.3% and 4.8% in B GAC respectively. Both of these Firmicutes have the ability to oxidize propionate to acetate, which is a necessary precursor in methane formation through syntrophic relationships with methanogenic archaea [56,57]. Another propionate-degrading exoelectrogenic bacteria (Syntrophobacter), belonging to the phyla Proteobacteria, was only detected in B GAC [58].
4. Conclusions
The hydrolytic phase is a limiting stage in anaerobic digestion process. To overcome this barrier, microaeration was applied in the hydrolytic reactor. This reduced the time required for hydrolysis by half and additionally increased the percentage of acetic and butyric acids available for the methanogenic stage by 62%, which were metabolized through DIET process, thus, increasing methane generation. The final concentration of VFA in the control process was triple that of the DIET process. The removal of total COD was 62.7% and 78.8% for the control and DIET processes respectively. The performance of the DIET process was 55% higher in total methane yield. Two-stage anaerobic digestion systems with microaeration and DIET is a solution for complex wastes, such as nejayote, in which both hydrolysis and methanogenesis can be problematic stages to carry out the process. Furthermore, several bacteria with the ability to participate in DIET were detected in the GAC biofilm. Especially noteworthy is the high abundance of Peptoclostridium and Clostridium (17.3% and 12.75%, respectively). Peptoclostridium had not previously been described as a participant in DIET. It was assumed that it had a role in DIET because of similarities with the metabolic processes carried out by other bacteria participants in DIET (Clostridium) and its dominance in the GAC biofilm.
Author Contributions
Conceptualization, L.A.-G.; methodology, D.V.; validation, C.R., D.V. and L.A.-G.; formal analysis, R.T.-T., L.A.-G., D.V.; investigation, D.V. and C.R.; resources, L.A.-G.; data curation, R.T.-T.; writing—original draft preparation, D.V.; writing—review and editing, D.V., R.T.-T., L.A.-G. All authors have read and agreed to the published version of the manuscript.
Funding
Mexican Council for Science (CONACYT) for the financial support granted to carry out this study through grant 738499 awarded for doctoral studies.
Acknowledgments
The authors thank Jorge Arturo Domínguez Maldonado for technical assistance in the laboratory test. Also we would like to thank Alberto Cortés Velázquez for technical assistance in DNA extraction.
Conflicts of Interest
The authors declare no conflict of interest.
References
- España-Gamboa, E.; Domínguez-Maldonado, J.A.; Tapia-Tussell, R.; Chale-Canul, J.S.; Alzate-Gaviria, L. Corn industrial wastewater (nejayote): A promising substrate in Mexico for methane production in a coupled system (APCR-UASB). Environ. Sci. Pollut. Res. 2018, 25, 712–722. [Google Scholar] [CrossRef] [PubMed]
- Salmerón-Alcocer, A.; Rodríguez-Mendoza, N.; Pineda-Santiago, V.; Cristiani-Urbina, E.; Juárez-Ramírez, C.; Ruiz-Ordaz, N.; Galíndez-Mayer, J. Aerobic treatment of maize-processing wastewater (nejayote) in a single-stream multi-stage bioreactor. J. Environ. Eng. Sci. 2003, 2, 401–406. [Google Scholar] [CrossRef]
- Meraz, K.A.S.; Vargas, S.M.P.; Maldonado, J.T.L.; Bravo, J.M.C.; Guzman, M.T.O.; Maldonado, E.A.L. Eco-friendly innovation for nejayote coagulation–flocculation process using chitosan: Evaluation through zeta potential measurements. Chem. Eng. J. 2016, 284, 536–542. [Google Scholar] [CrossRef]
- Rosentrater, K.A. A review of corn masa processing residues: Generation, properties, and potential utilization. Waste Manag. 2006, 26, 284–292. [Google Scholar] [CrossRef]
- Valderrama-Bravo, C.; Gutiérrez-Cortez, E.; Contreras-Padilla, M.; Rojas-Molina, I.; Mosquera, J.C.; Rojas-Molina, A.; Beristain, F.; Rodríguez-García, M.E. Constant pressure filtration of lime water (nejayote) used to cook kernels in maize processing. J. Food Eng. 2012, 110, 478–486. [Google Scholar] [CrossRef]
- Bauer-Gottwein, P.; Gondwe, B.R.N.; Charvet, G.; Marín, L.E.; Rebolledo-Vieyra, M.; Merediz-Alonso, G. the Yucatán Peninsula karst aquifer, Mexico. Hydrogeol. J. 2011, 19, 507–524. [Google Scholar] [CrossRef]
- Metcalfe, C.D.; Beddows, P.A.; Bouchot, G.G.; Metcalfe, T.L.; Li, H.; Van Lavieren, H. Contaminants in the coastal karst aquifer system along the Caribbean coast of the Yucatan Peninsula, Mexico. Environ. Pollut. 2011, 159, 991–997. [Google Scholar] [CrossRef]
- Yu, D.; Kurola, J.M.; Lähde, K.; Kymäläinen, M.; Sinkkonen, A.; Romantschuk, M. Biogas production and methanogenic archaeal community in mesophilic and thermophilic anaerobic co-digestion processes. J. Environ. Manag. 2014, 143, 54–60. [Google Scholar] [CrossRef]
- Van Fan, Y.; Klemeš, J.J.; Perry, S.; Lee, C.T. Anaerobic digestion of lignocellulosic waste: Environmental impact and economic assessment. J. Environ. Manag. 2019, 231, 352–363. [Google Scholar] [CrossRef]
- Nguyen, D.; Khanal, S.K. A little breath of fresh air into an anaerobic system: How microaeration facilitates anaerobic digestion process. Biotechnol. Adv. 2018, 36, 1971–1983. [Google Scholar] [CrossRef]
- Zhu, M.; Lü, F.; Hao, L.-P.; He, P.-J.; Shao, L.-M. Regulating the hydrolysis of organic wastes by micro-aeration and effluent recirculation. Waste Manag. 2009, 29, 2042–2050. [Google Scholar] [CrossRef] [PubMed]
- Barua, S.; Dhar, B.R. Advances towards understanding and engineering direct interspecies electron transfer in anaerobic digestion. Bioresour. Technol. 2017, 244, 698–707. [Google Scholar] [CrossRef] [PubMed]
- González, J.; Sánchez, M.E.; Gómez, X. Enhancing anaerobic digestion: The effect of carbon conductive materials. C J. Carbon Res. 2018, 4, 59. [Google Scholar] [CrossRef]
- Wu, Y.; Wang, S.; Liang, D.; Li, N. Conductive materials in anaerobic digestion: From mechanism to application. Bioresour. Technol. 2020, 298, 122403. [Google Scholar] [CrossRef] [PubMed]
- Lovley, D.R. Reach out and touch someone: Potential impact of DIET (direct interspecies energy transfer) on anaerobic biogeochemistry, bioremediation, and bioenergy. Rev. Environ. Sci. Bio Technol. 2011, 10, 101–105. [Google Scholar] [CrossRef]
- Gu, M.; Yin, Q.; Liu, Y.; Du, J.; Wu, G. New insights into the effect of direct interspecies electron transfer on syntrophic methanogenesis through thermodynamic analysis. Bioresour. Technol. Rep. 2019, 7, 100225. [Google Scholar] [CrossRef]
- Yang, P.; Tan, G.-Y.A.; Aslam, M.; Kim, J.; Lee, P.-H. Metatranscriptomic evidence for classical and RuBisCO-mediated CO 2 reduction to methane facilitated by direct interspecies electron transfer in a methanogenic system. Sci. Rep. 2019, 9, 1–7. [Google Scholar]
- Zhao, Z.; Zhang, Y.; Li, Y.; Dang, Y.; Zhu, T.; Quan, X. Potentially shifting from interspecies hydrogen transfer to direct interspecies electron transfer for syntrophic metabolism to resist acidic impact with conductive carbon cloth. Chem. Eng. J. 2017, 313, 10–18. [Google Scholar] [CrossRef]
- Zhao, Z.; Li, Y.; Quan, X.; Zhang, Y. Towards engineering application: Potential mechanism for enhancing anaerobic digestion of complex organic waste with different types of conductive materials. Water Res. 2017, 115, 266–277. [Google Scholar] [CrossRef]
- Cheng, Q.; Call, D.F. Hardwiring microbes via direct interspecies electron transfer: Mechanisms and applications. Environ. Sci. Process. Impacts 2016, 18, 968–980. [Google Scholar] [CrossRef]
- Lovley, D.R. Syntrophy goes electric: Direct interspecies electron transfer. Annu. Rev. Microbiol. 2017, 71, 643–664. [Google Scholar] [CrossRef] [PubMed]
- American Public Health Association (APHA). Standard Methods for the Examination of Water and Wastewater, 21st ed.; APHA: Washington, DC, USA, 2005; p. 1527. [Google Scholar]
- Poggi-Varaldo, H.M.; Valdés, L.; Esparza-Garcia, F.; Fernández-Villagómez, G. Solid substrate anaerobic co-digestion of paper mill sludge, biosolids, and municipal solid waste. Water Sci. Technol. 1997, 35, 197–204. [Google Scholar] [CrossRef]
- Jiang, J.; Zhang, Y.; Li, K.; Wang, Q.; Gong, C.; Li, M. Volatile fatty acids production from food waste: Effects of pH, temperature, and organic loading rate. Bioresour. Technol. 2013, 143, 525–530. [Google Scholar] [CrossRef] [PubMed]
- Latif, M.A.; Ghufran, R.; Wahid, Z.A.; Ahmad, A. Integrated application of upflow anaerobic sludge blanket reactor for the treatment of wastewaters. Water Res. 2011, 45, 4683–4699. [Google Scholar] [CrossRef]
- Rohlf, F.J. NTSYS 2.1: Numerical Taxonomic and Multivariate Analysis System; Exeter Software: New York, NY, USA, 2000. [Google Scholar]
- Rosentrater, K.A.; Flores, R.A.; Richard, T.L.; Bern, C.J. Physical and nutritional properties of corn masa by-product streams. Appl. Eng. Agric. 1999, 15, 515–523. [Google Scholar] [CrossRef]
- Yin, J.; Yu, X.; Zhang, Y.; Shen, D.; Wang, M.; Long, Y.; Chen, T. Enhancement of acidogenic fermentation for volatile fatty acid production from food waste: Effect of redox potential and inoculum. Bioresour. Technol. 2016, 216, 996–1003. [Google Scholar] [CrossRef]
- Liu, C.-G.; Xue, C.; Lin, Y.-H.; Bai, F.-W. Redox potential control and applications in microaerobic and anaerobic fermentations. Biotechnol. Adv. 2013, 31, 257–265. [Google Scholar] [CrossRef]
- Murray, K.; Rodwell, V.; Bender, D.; Botham, K.M.; Weil, P.A.; Kennelly, P.J. Harper’s Illustrated Biochemistry. 28; McGraw-Hill: New York, NY, USA, 2009; p. 832. [Google Scholar]
- Lim, J.W.; Chiam, J.A.; Wang, J.-Y. Microbial community structure reveals how microaeration improves fermentation during anaerobic co-digestion of brown water and food waste. Bioresour. Technol. 2014, 171, 132–138. [Google Scholar] [CrossRef]
- Park, J.-H.; Kang, H.-J.; Park, K.-H.; Park, H.-D. Direct interspecies electron transfer via conductive materials: A perspective for anaerobic digestion applications. Bioresour. Technol. 2018, 254, 300–311. [Google Scholar] [CrossRef]
- Gerardi, M.H. Wastewater Bacteria; John Wiley & Sons: Hoboken, NJ, USA, 2006. [Google Scholar]
- Wang, G.; Mu, Y.; Yu, H.-Q. Response surface analysis to evaluate the influence of pH, temperature and substrate concentration on the acidogenesis of sucrose-rich wastewater. Biochem. Eng. J. 2005, 23, 175–184. [Google Scholar] [CrossRef]
- Chen, Y.; Luo, J.; Yan, Y.; Feng, L. Enhanced production of short-chain fatty acid by co-fermentation of waste activated sludge and kitchen waste under alkaline conditions and its application to microbial fuel cells. Appl. Energy 2013, 102, 1197–1204. [Google Scholar] [CrossRef]
- Zhang, J.; Zhang, L.; Loh, K.-C.; Dai, Y.; Tong, Y.W. Enhanced anaerobic digestion of food waste by adding activated carbon: Fate of bacterial pathogens and antibiotic resistance genes. Biochem. Eng. J. 2017, 128, 19–25. [Google Scholar] [CrossRef]
- Ali Shah, F.; Mahmood, Q.; Maroof Shah, M.; Pervez, A.; Ahmad Asad, S. Microbial ecology of anaerobic digesters: The key players of anaerobiosis. Sci. World J. 2014, 2014, 1–21. [Google Scholar] [CrossRef] [PubMed]
- Dang, Y.; Sun, D.; Woodard, T.L.; Wang, L.-Y.; Nevin, K.P.; Holmes, D.E. Stimulation of the anaerobic digestion of the dry organic fraction of municipal solid waste (OFMSW) with carbon-based conductive materials. Bioresour. Technol. 2017, 238, 30–38. [Google Scholar] [CrossRef]
- Lei, Y.; Sun, D.; Dang, Y.; Chen, H.; Zhao, Z.; Zhang, Y.; Holmes, D.E. Stimulation of methanogenesis in anaerobic digesters treating leachate from a municipal solid waste incineration plant with carbon cloth. Bioresour. Technol. 2016, 222, 270–276. [Google Scholar] [CrossRef]
- Dang, Y.; Holmes, D.E.; Zhao, Z.; Woodard, T.L.; Zhang, Y.; Sun, D.; Wang, L.-Y.; Nevin, K.P.; Lovley, D.R. Enhancing anaerobic digestion of complex organic waste with carbon-based conductive materials. Bioresour. Technol. 2016, 220, 516–522. [Google Scholar] [CrossRef]
- Zhao, Z.; Zhang, Y.; Holmes, D.E.; Dang, Y.; Woodard, T.L.; Nevin, K.P.; Lovley, D.R. Potential enhancement of direct interspecies electron transfer for syntrophic metabolism of propionate and butyrate with biochar in up-flow anaerobic sludge blanket reactors. Bioresour. Technol. 2016, 209, 148–156. [Google Scholar] [CrossRef]
- Capson-Tojo, G.; Rouez, M.; Crest, M.; Steyer, J.-P.; Delgenès, J.-P.; Escudié, R. Food waste valorization via anaerobic processes: A review. Rev. Environ. Sci. Bio Technol. 2016, 15, 499–547. [Google Scholar] [CrossRef]
- Lin, R.; Cheng, J.; Zhang, J.; Zhou, J.; Cen, K.; Murphy, J.D. Boosting biomethane yield and production rate with graphene: The potential of direct interspecies electron transfer in anaerobic digestion. Bioresour. Technol. 2017, 239, 345–352. [Google Scholar] [CrossRef]
- Zhang, J.; Zhao, W.; Zhang, H.; Wang, Z.; Fan, C.; Zang, L. Recent achievements in enhancing anaerobic digestion with carbon-based functional materials. Bioresour. Technol. 2018, 266, 555–567. [Google Scholar] [CrossRef]
- Barua, S.; Zakaria, B.S.; Dhar, B.R. Enhanced methanogenic co-degradation of propionate and butyrate by anaerobic microbiome enriched on conductive carbon fibers. Bioresour. Technol. 2018, 266, 259–266. [Google Scholar] [CrossRef] [PubMed]
- Stams, A.J.M.; Plugge, C.M. Electron transfer in syntrophic communities of anaerobic bacteria and archaea. Nat. Rev. Microbiol. 2009, 7, 568–577. [Google Scholar] [CrossRef] [PubMed]
- Yang, Y.; Zhang, Y.; Li, Z.; Zhao, Z.; Quan, X.; Zhao, Z. Adding granular activated carbon into anaerobic sludge digestion to promote methane production and sludge decomposition. J. Clean. Prod. 2017, 149, 1101–1108. [Google Scholar] [CrossRef]
- Tian, T.; Qiao, S.; Li, X.; Zhang, M.; Zhou, J. Nano-graphene induced positive effects on methanogenesis in anaerobic digestion. Bioresour. Technol. 2017, 224, 41–47. [Google Scholar] [CrossRef]
- Cravo-Laureau, C.; Matheron, R.; Cayol, J.-L.; Joulian, C.; Hirschler-Rea, A. Desulfatibacillum aliphaticivorans gen. nov., sp. nov., an n-alkane-and n-alkene-degrading, sulfate-reducing bacterium. Int. J. Syst. Evol. Microbiol. 2004, 54, 77–83. [Google Scholar] [CrossRef]
- Kato, S.; Hashimoto, K.; Watanabe, K. Methanogenesis facilitated by electric syntrophy via (semi) conductive iron-oxide minerals. Environ. Microbiol. 2012, 14, 1646–1654. [Google Scholar] [CrossRef]
- Shen, L.; Zhao, Q.; Wu, X.; Li, X.; Li, Q.; Wang, Y. Interspecies electron transfer in syntrophic methanogenic consortia: From cultures to bioreactors. Renew. Sustain. Energy Rev. 2016, 54, 1358–1367. [Google Scholar] [CrossRef]
- Shrestha, P.M.; Malvankar, N.S.; Werner, J.J.; Franks, A.E.; Elena-Rotaru, A.; Shrestha, M.; Liu, F.; Nevin, K.P.; Angenent, L.T.; Lovley, D.R. Correlation between microbial community and granule conductivity in anaerobic bioreactors for brewery wastewater treatment. Bioresour. Technol. 2014, 174, 306–310. [Google Scholar] [CrossRef]
- Yin, Q.; Miao, J.; Li, B.; Wu, G. Enhancing electron transfer by ferroferric oxide during the anaerobic treatment of synthetic wastewater with mixed organic carbon. Int. Biodeterior. Biodegrad. 2017, 119, 104–110. [Google Scholar] [CrossRef]
- Wiegel, J.; Tanner, R.; Rainey, F.A. An introduction to the family Clostridiaceae. Prokaryotes 2006, 4, 654–678. [Google Scholar]
- Li, L.-L.; Tong, Z.-H.; Fang, C.-Y.; Chu, J.; Yu, H.-Q. Response of anaerobic granular sludge to single-wall carbon nanotube exposure. Water Res. 2015, 70, 1–8. [Google Scholar] [CrossRef] [PubMed]
- Imachi, H.; Sekiguchi, Y.; Kamagata, Y.; Hanada, S.; Ohashi, A.; Harada, H. Pelotomaculum thermopropionicum gen. nov., sp. nov., an anaerobic, thermophilic, syntrophic propionate-oxidizing bacterium. Int. J. Syst. Evol. Microbiol. 2002, 52, 1729–1735. [Google Scholar] [PubMed]
- Plugge, C.M.; Balk, M.; Stams, A.J.M. Desulfotomaculum thermobenzoicum subsp. thermosyntrophicum subsp. nov., a thermophilic, syntrophic, propionate-oxidizing, spore-forming bacterium. Int. J. Syst. Evol. Microbiol. 2002, 52, 391–399. [Google Scholar] [CrossRef] [PubMed]
- Müller, N.; Worm, P.; Schink, B.; Stams, A.J.M.; Plugge, C.M. Syntrophic butyrate and propionate oxidation processes: From genomes to reaction mechanisms. Environ. Microbiol. Rep. 2010, 2, 489–499. [Google Scholar] [CrossRef] [PubMed]
Publisher’s Note: MDPI stays neutral with regard to jurisdictional claims in published maps and institutional affiliations. |
© 2020 by the authors. Licensee MDPI, Basel, Switzerland. This article is an open access article distributed under the terms and conditions of the Creative Commons Attribution (CC BY) license (http://creativecommons.org/licenses/by/4.0/).