Article

Heavy Metal Sorption by Sludge-Derived Biochar with Focus on Pb2+ Sorption Capacity at μg/L Concentrations

1
School of Business, Society and Engineering, Future Energy Center, Mälardalen University, P.O. Box 883, SE-721 23 Västerås, Sweden
2
Research Unit of Sustainable Chemistry, University of Oulu, P.O. Box 8000, FI-90014 Oulu, Finland
*
Authors to whom correspondence should be addressed.
Processes 2020, 8(12), 1559; https://doi.org/10.3390/pr8121559
Submission received: 20 October 2020 / Revised: 20 November 2020 / Accepted: 24 November 2020 / Published: 27 November 2020
(This article belongs to the Special Issue Sustainable Development of Waste towards Green Growth)

Abstract

:
Municipal wastewater management causes metal exposure to humans and the environment. Targeted metal removal is suggested to reduce metal loads during sludge reuse and release of effluent to receiving waters. Biochar is considered a low-cost sorbent with high sorption capacity for heavy metals. In this study, heavy metal sorption to sludge-derived biochar (SDBC) was investigated through batch experiments and modeling and compared to that of wood-derived biochar (WDBC) and activated carbon (AC). The aim was to investigate the sorption efficiency at metal concentrations comparable to those in municipal wastewater (<1 mg/L), for which experimental data are lacking and isotherm models have not been verified in previous works. Pb2+ removal of up to 83% was demonstrated at concentrations comparable to those in municipal wastewater, at pH 2. SDBC showed superior Pb2+ sorption capacity (maximum ~2 mg/g at pH 2) compared to WDBC and AC (<0 and (3.5 ± 0.4) × 10−3 mg/g, respectively); however, at the lowest concentration investigated (0.005 mg/L), SDBC released Pb2+. The potential risk of release of other heavy metals (i.e., Ni, Cd, Cu, and Zn) needs to be further examined. The sorption capacity of SDBC over a metal concentration span of 0.005–150 mg Pb2+/L could be predicted with the Redlich–Peterson model. It was shown that experimental data at concentrations comparable to those in municipal wastewater are necessary to accurately model and predict the sorption capacity of SDBC at these concentrations.

1. Introduction

Current municipal wastewater management causes exposure of humans and the environment to heavy metals. Municipal wastewater treatment does not specifically target heavy metals [1]; instead, the heavy metals entering municipal wastewater treatment plants (WWTPs) partly associate with sludge and may enter agricultural land through sludge reuse, while the remainder is released to receiving waters. In the EU, roughly 40% of sludge is reused; plant nutrients and organic matter from wastewater can thus be utilized, benefitting circularity. However, accumulation of heavy metals in soil and uptake in crops are potential risks, as the metals might enter the food chain [2]. An additional concern is that heavy metals that enter receiving waters through the release of wastewater effluent may cause harm to aquatic organisms [3]. Therefore, regulations for limiting the heavy metal release into water and the heavy metal load from sludge into agriculture are necessary. EU directives provide limit values for Pb, Ni, Cd, Cu, Zn, and Hg when sludge is used in agriculture [4]. With respect to heavy metal release into receiving waters, environmental quality standards exist for Pb, Ni, Cd, and Hg [5]. The possible control measures to limit heavy metal exposure to humans and the environment from wastewater include source control (e.g., banning the use of certain products in households or restricting their release from industries), limiting sewer overflows, and designated wastewater treatment [6]. The typical concentrations of heavy metals in influent municipal wastewater in relation to the limit values and environmental quality standards are summarized in Table 1. Based on the ratios calculated in Table 1, it is relevant to consider the introduction of a treatment step that targets the removal of heavy metals and has the potential to reduce heavy metal loads released into both agriculture and receiving waters.
Efficient treatment methods for heavy metal removal include chemical precipitation, ion exchange, membrane filtration, electrochemical treatment technologies, coagulation–flocculation, and sorption. Using organic byproducts for the sorption of heavy metals is considered a potential low-cost method compared to methods such as ion exchange and membrane filtration. Sorption processes also have the advantage that no heavy metal laden sludge is generated compared to chemical precipitation, which is the most widely used method for heavy metal separation from industrial wastewaters [9,10]. Biochars produced through the pyrolysis of organic byproducts have been shown to have high heavy metal sorption capacities, up to more than 100 mg/g [11]. Pyrolysis is generally considered to increase the sorption capacity of organic matter by creating a porous structure and an increased surface area [12].
Herein, we consider the novel concept of using sludge-derived biochar (SDBC) for the sorption of heavy metals from municipal wastewater. Under this concept, an internal resource of treatment plants could be utilized. Separation of heavy metals early in the treatment process (during or directly following primary treatment) will reduce the heavy metal concentrations in the treated effluent and, at the same time, the sludge generated in later treatment steps would have lower heavy metal concentrations and would become more attractive for use in agriculture. Based on a review by Smith et al. [13], SDBC could have a comparable or higher heavy metal sorption capacity compared to commercial activated carbon (AC) sorbents. SDBC sorption is therefore a promising method for targeted heavy metal removal.
Previous research has shown that the sorption capacity of SDBC may be optimized based on the temperature and time of pyrolysis [14,15]. The sorption capacity varies around four-fold according to previous studies, where the temperature range is 500–900/300–600 °C and the time of pyrolysis is 20 min/1–2 h. The optimum sorption capacities have been found to be 20 mg Cd/g, 18 mg Pb/g, and 30 mg Cr/g. The optimization of SDBC heavy metal sorption capacity by activation and modification has also been performed [16,17]. Both activation and modification showed large potential for increasing heavy metal sorption capacity (e.g., KMnO4 modification of biochar derived from pine wood increased Pb2+ removal capacity by a factor of 20—from 2.35 to 47.05 mg/g). However, modification is associated with increased cost (i.e., material and energy input) [17]. The increased cost needs to be balanced against the gain in sorption performance; however, the available literature does not generally include the cost aspect, and the appropriate option for optimizing heavy metal sorption is therefore difficult to identify.
The main challenge of this novel concept is to predict the sorption behavior of SDBC at heavy metal concentrations comparable to those in municipal wastewater. This type of wastewater is typically dilute in comparison to industrial wastewaters. Investigations of heavy metal removal through different removal techniques at concentrations comparable to those in municipal wastewater are scarce compared to the numerous studies for higher heavy metal concentrations [3]. A large number of studies have examined the optimization of SDBC’s sorption capacity through the adaptation of pyrolysis conditions (temperature and time) and activation (before, during, or after pyrolysis) [13]. However, similar to the studies on heavy metal removal in general, the examination of heavy metal removal capacities at heavy metal (sorbate) concentrations below 1 mg/L are lacking. It is common to use isotherm models to describe how the sorption capacity varies at different equilibrium sorbate concentrations; however, model predictions are generally not verified in the range below 1 mg/L. Based on the literature data with respect to sorption isotherm parameters, the equilibrium sorption capacity will be far below the maximum sorption capacity of the sorbent if high removal (%) is to be obtained. Predictions based on the existing literature are therefore highly uncertain (as further explained in Supplementary Materials Figures S1 and S2), and it is relevant to assess the accuracy of sorption isotherms when considering a wider concentration span.
The aim of the present work was to evaluate SDBC as a potential sorbent of heavy metals during municipal wastewater treatment, specifically considering low heavy metal concentrations. Sorption efficiency was evaluated by batch sorption experiments. A further objective of the batch experiments was to determine the variation in sorption capacity under varying conditions, namely, sorbent dose, sorbent size interval, contact time, and pH. The surface area and porosity of the sorbents were analyzed to elucidate the importance of the physical characteristics of the sorbent.

2. Material and Methods

2.1. Sorbents

Specifications of the feedstock, origin, and production of the sorbents used in this study are provided in Table 2. The focus of this study was to investigate the sorption potential of SDBC, and wood-derived biochar (WDBC) and AC were used as reference materials for comparison. The sorbents were ground using a mortar and pestle, and subsequently sieved to different size intervals using sieves with sieve opening of 0.125, 1.00, and 2.00 mm (the sorbent size before grinding was up to ~4 mm (SDBC), from ~5 cm up to several centimeters (WDBC), or 0.4–1.7 mm (AC, based on information given by the manufacturer). The sorbents were not washed after grinding.
The specific surface areas, pore sizes, and pore volumes of SDBC, WDBC, and AC were analyzed prior to the sorption experiments (sorbents <0.125 mm, three replicates; SDBC 1–2 mm, one replicate). SDBC samples collected after the kinetic experiment were also analyzed (three replicates). These properties were determined as follows:
  • Prior to characterization, the sorbents were degassed at 140 °C at 0.67 Pa until the pressure stabilized at a low level.
  • The sorption–desorption of N2 was measured at a temperature of −196 °C using a Micromeritics ASAP 2020 instrument (Norcross, GA, USA).
  • The Brunauer–Emmett–Teller (BET) algorithm [18], was applied to deduce the specific surface area (for the relative pressure (p/p0) range of 0.05–0.18; the upper range was chosen based on the highest p/p0 ratio to provide a positive C-value, and a correlation coefficient of 0.999 was achieved for the transformation plot), pore volume and mean pore diameter (calculated from the adsorption isotherm at a relative pressure ratio of 0.985).
  • The differential function theory (DFT) algorithm [19] was applied to calculate the fraction of the micro-, meso-, and macropores (assuming that the pores were slit-formed).
Metal concentrations in the sorbents (analyzed by ALS Scandinavia AB, Luleå, Sweden, one replicate per sorbent) were analyzed by ICP-SFMS (Inductively coupled plasma sector field mass spectrometry) according to International Organization of Standardization (ISO) 17294-2:2016 [20] and the Environmental Protection Agency (EPA) method 200.8:1994 [21], after digestion according to EN 13656:2003 [22].
Proximate analysis (moisture content and volatile matter; one replicate per sorbent) was conducted according to SS 028113-1 [23]. For sorbent pH analysis, sorbent and deionized water were mixed at a ratio of 1:10 and pH measurements were performed after 20 min (using a Metrohm 744 pH-meter, Metrohm Nordic AB, Bromma, Sweden). Elemental analysis (two replicates per sorbent) was performed in a Thermo Fisher FlashSmart CHNS/O instrument (Waltham, MA, USA).

2.2. Sorption Experiments

2.2.1. Experimental Conditions

Table 3 summarizes the experimental conditions during the sorption experiments. The experiments were performed using aqueous metal solutions. The choice of heavy metals to include in the experiments was based on the relevant legislation and standards (as given in Table 1). Pb2+ was chosen as the main heavy metal to study in the experiments because its sorption to SDBC has been frequently examined in the literature (e.g., by Ho et al. [24]; Lu et al. [25]; Zhang et al. [15,26]) (at initial metal concentrations >1 mg/L). Furthermore, our preliminary data indicated that SDBC may efficiently reduce the concentration of Pb2+ in municipal wastewater (see Supplementary Materials Figure S3). For preliminary evaluation of the Ni2+, Cd2+, Cr3+, Cu2+, and Zn2+ removal capacity of SDBC, experiments and modeling were performed under different pH levels. As (arsenic) was excluded from the scope because it is regulated in few countries. Hg was excluded from the scope due to the possible volatilization that may occur, which would complicate the prediction of its removal during municipal wastewater treatment [7].
All sorption experiments were performed at room temperature. To avoid the precipitation of lead hydroxides, the solutions were acidified to an initial pH of 2 (except in the pH experiments) (preparatory experiments at initial pH levels of 2, 4, 6, and 8 indicated that sorbent addition, irrespective of sorbent, induced a pH increase, leading to a final pH above or close to the pH from which lead hydroxide precipitation may occur at Pb2+ concentration 5 mg/L). In the dose, size interval, kinetics, and pH experiments, an initial metal concentration of 5 mg/L was chosen, because this concentration is in the middle of the range used for the isotherm experiments. This concentration is somewhat higher than that commonly found in municipal wastewater. The expected behavior of heavy metals at a lower initial sorbate concentration is that:
  • The sorption capacity (mg/g) will decrease and a similar dose will be required to reach the same removal (%) (Supplementary Materials Figure S1).
  • The sorbent size interval is expected to have a similar importance irrespective of initial sorbate concentration, i.e., that the sorption capacity increases as the particle size decreases (unless the dose is so large that the removal is close to 100%, in which case, the size interval may not have any impact).
  • The kinetics will, based on modeling by Al-Jabari [27], likely be quicker when the initial concentration is lower.
  • The pH from which heavy metals start to precipitate will be higher.
In the isotherm experiment, the sorption capacity of SDBC under varying sorbate concentrations was compared to that of WDBC and AC, to reveal if these sorbents all have a similar evolution of sorption capacity as the sorbate concentration decreases.
The risk of release of heavy metals from SDBC, WDBC, and AC was assessed in association with the pH experiments but using ultrapure water instead of aqueous metal solution.

2.2.2. Experimental Procedures

Aqueous metal solutions containing single metals were prepared from the following metal salts: Lead nitrate (Pb(NO3)2), nickel sulphate (NiSO4•6H2O), copper nitrate (Cu(NO3)2•3H2O), zinc chloride (ZuCl2), cadmium nitrate (Cd(NO3)2•4H2O), and chromium nitrate (Cr(NO3)3•9H2O) (the respective metal salts were purchased from: Fisher Scientific GTF, Göteborg, Sweden (Pb and Ni); KEBO lab, Stockholm, Sweden (Cu, Zn and Cr) and Avantor, Radnor, PA, USA (Cd)). Stock metal solutions at a concentration of 1000 mg/L were prepared by addition of metal salts to “type 1” ultrapure water, according to ISO 3696:1987 [28]. The ultrapure water was produced in a Merck Milli-Q Compact System (Merck KGaA, Darmstadt, Germany) (fed with deionized water). Stock metal solutions were later diluted with ultrapure water to obtain the experimental concentrations.
The sorbents were dried for ~12 h at 105 °C prior to the experiments and stored in a desiccator to preserve low humidity. Prior to the addition of sorbent, the pH of the metal/blank solution was adjusted by the addition of acid (HNO3) or base (NaOH) until the desired pH or maximum 0.09 units above the desired pH was reached.
The following blank samples were prepared: Sorbent and ultrapure water, to examine the possible release of metals from the sorbents; ultrapure water only, to evaluate the possible metal contamination during sample handling; metal solution only, to determine the initial concentration of the solutions.
To separate sorbent from the solution, samples were centrifuged (5000 rpm, 15 min) and filtered through a 0.45 μm membrane filter. HNO3 (1 mol/L) (Scharlab, Barcelona, Spain) was added for sample preservation (0.50 mL/100 mL). Samples were later digested, and metals were analyzed by ICP-MS (Inductively coupled plasma - mass spectrometry) and ICP-OES (- optical emission spectrometry), according to ISO 17294-2:2016 [20] and ISO 11885:2007 [29] (analysis performed by SYNLAB Analytics & Services Sweden AB, Linköping, Sweden). The instruments used were a PerkinElmer NexION350D and a PerkinElmer 7300 (Waltham, MA, USA), respectively.

2.2.3. Calculation of Sorption and Removal Efficiency

The sorption of metals per mass unit of sorbent, q (mg/g), and the removal efficiency, Δ C (%), were calculated as follows:
q = m M e m + q i ,
Δ C = C 0 C C 0 × 100 ,
where m M e = ( C 0 C ) × V (mg) is the total amount of metals sorbed, C 0 (mg/L) is the initial concentration of metals, C (mg/L) is the final concentration in the liquid sample after separation of the sorbent, V (L) is the volume of the sample, m (g) is the mass of sorbent, and q i (mg/g) represents the initial amount of sorbed metal per mass unit of sorbent. The final amount of sorbed metal per mass unit and the final concentration of the metal solution are denoted by q e and C e , respectively, if the experiment is continued until equilibrium has been established in the solution, or as q t and C t if the experiment is ended before equilibrium has been established.
The parameter q i is generally not considered in sorption experiments, since this is small compared to the equilibrium sorption that is usually considered. In the present work, q i was introduced to avoid q (generally calculated as m M e / m ) taking a negative value. Calculation of q i was based on two assumptions:
a)
With no metals in the solution at equilibrium, no metal is sorbed ( q is 0 when C is 0, in agreement with the Langmuir and Redlich-Peterson isotherms, see Section 2.2.2);
b)
q increases linearly in relation to C at low sorbate concentration [30]. (There is no exact definition of what is considered a low sorbate concentration. It is relative to the sorption capacity of the sorbent. To find the rate of linear increase of q , m M e / m was plotted in relation to C . Linear behavior was assumed to be valid up to a certain concentration, C X . The coefficient of determination, R2, is given to indicate the linear correlation of m M e / m and C in this concentration range.)
The standard deviations of q e and Δ C were calculated according to standard procedures. The variations of sorbent mass ( m ) and sample volume ( V ) were small (sorbent mass varied ±0.3% for a dose ≥1 g/L and ±6% for a dose <1 g/L, while sample volume varied ±0.1%) and was therefore disregarded when calculating the standard deviation of q . The sample volume added during preservation was also disregarded in the calculations (it constituted only 0.5% of the total sample volume).

2.2.4. Modeling with Respect to Metal Hydroxide Precipitation and Sorption Isotherms

To indicate the fraction of metals that may precipitate at different pH levels, the speciation of metal hydroxides was calculated with the chemical equilibrium software Visual MINTEQ, version 3.1 [31].
Isotherm models were applied to describe the sorption capacity ( q e ) as a function of the sorbate concentration ( C e ). The most commonly applied isotherm models for metal sorption to biochar and other sorbents were applied. Based on a review of previous work, these were: Langmuir, Freundlich, Langmuir–Freundlich (also called Sips), Temkin, Dubinin–Radushkevich, and Redlich–Peterson [30,32]. The Langmuir isotherm [33] is expressed as:
q e = Q m a x K L C e 1 + K L C e ,
where Q m a x (mg/g) and K L (L/mg) represent the maximum sorption capacity and the affinity between sorbent and sorbate, respectively. The model was developed based on the theoretical assumption that all sorption sites are similar and that each site has the capacity to bind one sorbate molecule/ion. The Freundlich isotherm [34] is expressed as:
q e =   K F C e n ,
where K F (L/mg) represents the strength of adsorption, and a higher K F indicates higher sorption capacity. The term n (dimensionless) indicates the driving force for the sorption or heterogeneity of the sorption sites, and generally has a value below 1. The Freundlich isotherm does not have a maximum value, i.e., does not consider saturation of the sorbent [30]. It was originally proposed as an empirical equation, but later shown to have thermodynamic justification [35]. The Langmuir–Freundlich isotherm [36] is expressed as:
q e = Q L F A L F C e n L F 1 + A L F C e n L F ,
where Q L F (mg/g) takes a higher value for sorbents with high sorption capacity, while n L F (dimensionless) and A L F (L/mg) are related to the constants of the Freundlich model. Sips [36] suggested the model as a modification of the Freundlich model to predict saturation of surface sites at high sorbate concentrations. Langmuir–Freundlich reduces to the Langmuir equation when n L F is equal to 1 and to the Freundlich equation when ( A L F C e ) n L F << 1 [11]. The Temkin isotherm [37] is expressed as:
q e = R T b l n K T C e ,
where b (kJ/mol) is associated with sorption energy, K T (L/g) corresponds to the maximum binding energy, R (kJ/mol, K) is the gas constant, and T (K) is the temperature in Kelvin. The underlying theoretical assumption is that the heat of adsorption (the energy released when a given amount of sorbent is adsorbed) is linearly dependent on the degree of surface coverage [37]. The Redlich–Peterson isotherm [37] is expressed as:
q e = K R P C e 1 + a R P C e g ,
where K R P (L/g), a R P (mg/L), and g (dimensionless) are empirical constants [38]. The value of g should be between 0 and 1. If C e is small, the isotherm will become linear ( q e = K R P C e ) and when C e is large, it becomes similar to a Freundlich-type model ( q e = K R P / a R P C e 1 g ) [38].
The fitting of the Dubinin–Radushkevich isotherm [30] to the experimental data was also tested, but resulted in a large deviation from the experimental data at concentrations below 0.1 mg/L (results not shown).
The isotherm model parameters were determined by fitnlm, a command in MATLAB (version R2016b) that applies an iterative least squares algorithm that minimizes the sum of the squared differences between the model and the measured value. To adapt the model fit based on the accurateness of the experimental data, a weight (the reciprocal of the squared standard deviation) was used. Next, the model fit was evaluated based on the coefficient of determination, R2.

3. Results and Discussion

3.1. Sorbent Characteristics

The sorbent characterization results are given in Table 4. SDBC had the smallest surface area of the three sorbents, and it was similar to that found by Zhang et al. [15] for SDBC produced by pyrolysis at 400–600 °C with a 1 h duration. The average pore size and pore volume of SDBC were in the same order of magnitude as that of Chen et al. [14], where SDBC was produced by pyrolysis at 500–900 °C with a 20 min duration.
The SDBC samples that were collected after the kinetic experiment had larger surface area and smaller average pore size compared to fresh samples of SDBC. The fraction of micropores was also larger. This indicates that small pores were opened up during the kinetic experiment (while the sorbent was suspended in liquid). It has been suggested that such additional pore volume could be created as an effect of the swelling of biochar when it is immersed in water [39].
The surface area of WDBC was larger than that of SDBC, while the pore volumes of the two sorbents were similar (not statistically different based on a t-test, p < 0.05). The surface area was comparable to that of other wood-derived biochars [40].
AC had the largest surface area, as well as the largest pore volume and smallest average pore size, of the three adsorbents. This combination of characteristics is reasonable, since many small pores provide a larger surface area. The particle size distribution (not measured here) is another characteristic that is of importance for the surface area. A large surface area should indicate a high sorption capacity due to the potentially larger amount of surface sorption sites. However, despite generally having a much smaller surface area compared to commercial AC, biochars have often been shown to have a higher affinity for metals [41].
The results from characterization of the sorbents with respect to metal concentrations, release of metals, pH, proximate analysis and elemental analysis, are given in Table 5.
Since the focus of the present work was to investigate the variation of sorption capacity at varying sorbate concentrations, optimization of sorption capacity (activation or modification) was not attempted.

3.2. Sorption Experiments

3.2.1. Pb2+ Sorption Isotherms: SDBC Compared to Reference Materials WDBC and AC

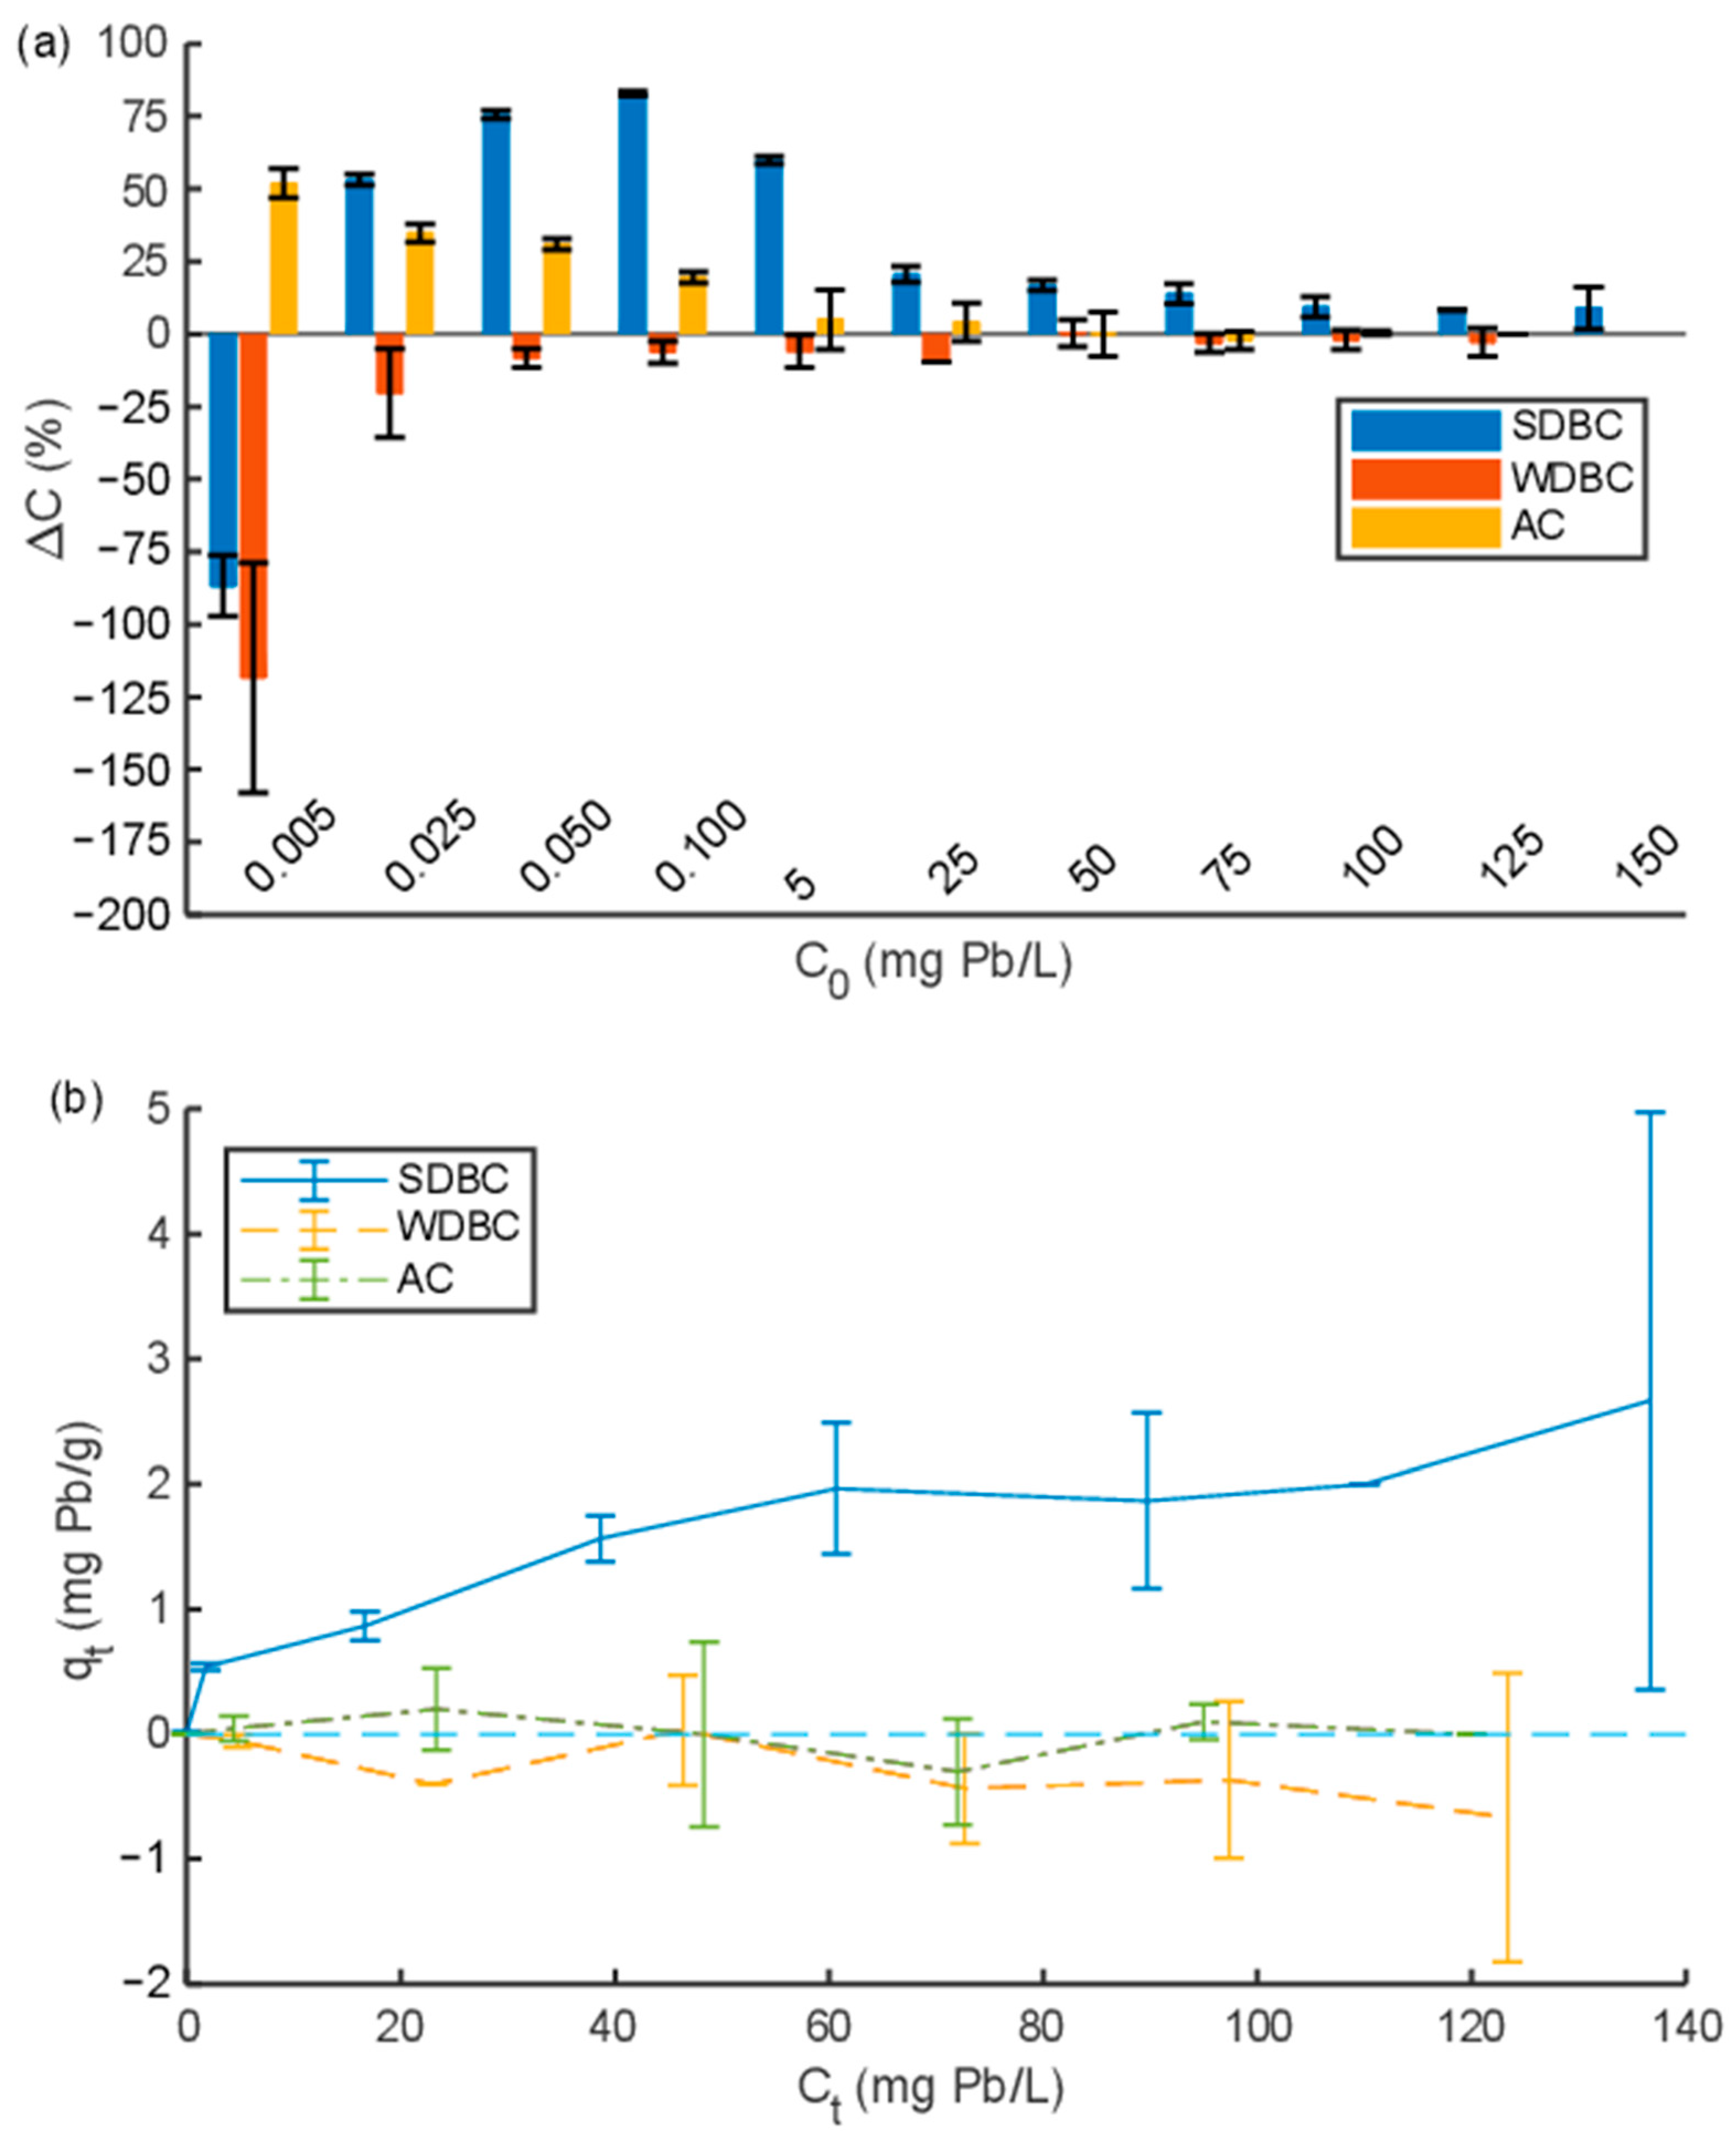
As seen in Figure 1a, SDBC removed Pb2+ at all concentrations except at the lowest concentration (0.005 mg/L), where Pb2+ instead was released into the solution (the final concentration was higher than the initial concentration). The maximum Pb2+ removal of SDBC was 83 ± 1% at an initial concentration of 0.1 mg/L. AC removed Pb2+ at initial concentrations of 0.005–0.1 mg/L, while it did not significantly remove or release Pb2+ at concentrations of 5 mg/L or higher. WDBC released Pb2+ when the initial concentration was low, while at higher concentrations, it did not significantly release or remove Pb2+.
The lack of sorption capacity of WDBC and the non-significant sorption capacity of AC at initial concentrations of 5 mg/L and higher was not anticipated, since previous works indicated that WDBC and AC may efficiently sorb Pb2+. However, the results for AC are in relatively good agreement with data according to Sajjad et al. [42]. They investigated the sorption capacity of commercial AC of the same type as was used in our experiments. The Pb2+ removal at pH 2 according to Sajjad et al. [42] was ~12% (read from figure) at an initial concentration in the range of 5–20 mg/L. The corresponding Pb2+ removal in our experiments (initial pH of 2) was 5 ± 10% and 4 ± 6% (initial concentrations 5 and 25 mg/L, respectively). At an initial pH of 4 and 8, our results showed that the pH increase induced by the addition of AC resulted in almost complete Pb2+ removal (see Supplementary Materials Figure S4).
The release of Pb2+ from WDBC used here was ~1 mg/kg (see Table 5, at a dose of 5 g/L, pH 2), which indicates that this WDBC is not an appropriate sorbent when the initial metal concentration and pH are very low. However, other WDBCs may be more appropriate. WDBCs have previously been shown to sorb Pb2+. Biochar derived from poplar wood, pinewood branches, oak wood, and pine wood showed sorption capacities of 3.6, 58, 2.6, and 4.1 mg/g, respectively (at initial pH of 4, 2, 5, and 5) [43,44,45]. The cause of the inferior performance of WDBC in our experiments was not fully identified, though the low solution pH may be one cause. The literature data with respect to Pb2+ removal capacity at solution pH 2 (pine wood/pine branch biochar) are not consistent; it was relatively high according to Abdel-Fattah et al. [44] (58 mg/g), but only by a few percent (sorption capacity in milligrams per gram not specified) according to Mohan et al. [45]. The pH of the sorbent may also be of importance; the WDBC pH according to Zhao et al. [43] was 8.2, while the WDBC used here had a pH of only 5.6 (as given in Table 5). An increased initial pH promotes sorption (and at initial pH 8, precipitation of lead hydroxides); at an initial pH of 4 and 8, the removal of Pb2+ by WDBC investigated here was 20% (0.19 mg/g) and 88% (0.84 mg/g), respectively (see Supplementary Materials Figure S4). Other factors of relevance for the sorption capacity may be the surface area, the initial Pb2+ concentration in the sorbent, or the surface acidity. WDBCs investigated by Zhao et al. [43], Abdel-Fattah et al. [44], and Mohan et al. [45] all had smaller surface areas but higher sorption capacities compared to the WDBC investigated here, which indicates that the surface area is not the crucial factor. Furthermore, it does not seem possible to directly infer the release of Pb2+ based on the initial concentration in the WDBC; the initial Pb2+ concentration in the WDBC used here (0.854 mg/kg) was lower compared to that reported in biochar derived from hickory woodchips (26 mg/kg) and pine needles (39 mg/kg) [46]. Wu et al. [46] detected no Pb2+ release from hickory woodchip biochar at pH 2 (24 h contact time), while the Pb2+ release from pine needle biochar at pH 2 was 8.76 mg/kg (dose of 20 g/L), i.e., the amount of Pb2+ initially contained was not proportional to the release. Surface acidity (reflecting the number of acidic functional groups) was identified as a key factor for Pb2+ sorption (of biochars derived from rice husk, olive pits, and wood chips) according to Campos and De la Rosa [47]. However, the surface acidity was not investigated here.
SDBC had a higher Pb2+ removal capacity than WDBC and AC at all concentrations, except at 0.005 mg/L, where AC had the highest removal capacity (52 ± 5%). The decreasing removal capacity of SDBC at initial concentrations lower than 0.05 mg/L was due to the initial content of Pb in the biochar, as given in Table 5. WDBC released similar amounts of Pb as SDBC, which is unexpected since the initial concentration of Pb in WDBC was less than one hundredth compared to SDBC. The initial concentration of Pb in AC was similar to that in WDBC, but the release of Pb was much lower. Thus, the strength of the sorption or binding of Pb seems to differ between these sorbents. In contrast, the relative release of Ni from SDBC, WDBC, and AC seems to be in agreement with the initial concentrations in the different sorbents (based on the data in Table 5). This shows that the release of metals was not proportional to the initial metal concentration in the sorbents, but the relative amount of metals released varied both depending on sorbent properties and between different metals. The sorbent properties that govern metal release may be, e.g., the number and type of surface functional groups and the amount of anion salts such as phosphates and carbonates (with which the heavy metals may precipitate) in the sorbent (the relevance of functional groups and anion salts are further discussed below but were not measured here). Similar to what was found here, the amount of metals released by SDBC in standard toxicity characteristic leaching procedure (TCLP) tests according to Ho et al. [25] and Wu et al. [46] differed even though the initial metal concentrations in SDBC were similar.
An explanation for the higher removal capacity of SDBC could be that it likely contains more phosphates and carbonates compared to the other sorbents, which is beneficial for the precipitation of metal phosphates and carbonates [25]. A further contribution may be the accumulation of exchangeable alkali metals in SDBC during sludge pyrolysis [14], which was confirmed by the low VM content (high ash content) of SDBC compared to the other sorbents. The higher surface area of AC and WDBC compared to SDBC evidently did not result in higher sorption capacity, in agreement with observations in previous studies [32,41]. This suggests that surface area in itself is not a good basis for judging the metal sorption capacity of carbonous sorbents when the sorbents have different origins or were produced under different conditions. This also confirms that surface chemistry is of great importance for metal sorption potential.
The initial amount of sorbed metal on SDBC ( q i ) was calculated to represent 1.37 × 10⁻² mg/g (a linear relationship between m M e / m and C ( m M e / m = 1.81 C ) was assumed to be valid up to C X = 0.015 mg/L ( C 0 0.1 mg/L), R2 = 0.98). SDBC reached a maximum Pb2+ sorption capacity of approximately 2 mg/g at a final concentration of ~60 mg/L (initial concentrations of 75 mg Pb/L and above) (see Figure 1b). The kinetic experiments later revealed that the duration of the isotherm experiment (24 h) was not sufficient to reach equilibrium for sorption to SDBC, which implies that the real maximum sorption capacity should be slightly higher than what was observed in the isotherm experiment.
The maximum Pb2+ sorption capacity of AC was lower compared to SDBC—only (3.5 ± 0.4) × 10−3 mg/g—at an initial concentration of 0.1 mg/L ( q i for AC was very close to zero). At higher initial concentrations, the difference between the initial and final Pb2+ concentrations was small and the measurement uncertainty was therefore high.
The final pH was 2.5–2.8 for SDBC, 2.1–2.2 for WDBC, and 2.2–2.3 for AC. The low pH resulted in a lower maximum sorption capacity of Pb2+ compared to previous studies of Pb2+ sorption to sludge-derived biochar [15,24,25]. According to Ho et al. [24], biochar derived from anaerobically digested sludge could sorb 50 mg Pb/g at pH 5, but only approximately 3 mg/g at an initial pH of 2 (similar final pH)—the latter value is similar to our findings. Ho et al. [24] showed that the main sorption processes at pH 5 were precipitation and ion exchange; these processes are favored by an increased pH.
As already mentioned, the SDBC was pyrolyzed at 550–600 °C with a 16–30 min duration. SDBC produced from the same feedstock but under different conditions of pyrolysis could have a different sorption capacity. Several studies on SDBC have indicated that a high pyrolysis temperature might result in a decreased sorption capacity, despite the increased surface area. This is attributed to the destruction of organic functional groups, e.g., carboxyl and hydroxyl groups [24,48]. Zhang et al. [15] found that SDBC pyrolyzed at 400 °C for 2 h had a higher sorption capacity for Pb2+ and Cr4+ compared to SDBC pyrolyzed at 500 and 600 °C for 1 h. In contrast, Chen et al. [14] found that a pyrolysis temperature of 800–900 °C provided higher removal capacity for Cd2+ compared to SDBC produced at a lower pyrolysis temperature, even though the increased pyrolysis temperature was shown to decrease the number of surface functional groups.
Some of the blank samples of ultrapure water were found to contain small amounts of Pb2+, i.e., <0.3 μg/L. The concentrations of Ni2+, Cd2+, Cr3+, Cu2+, and Zn2+ were below the detection limits though. The Pb2+ found was likely (unintentionally) added during sample preparation or filtering. The detected Pb was estimated to contribute a maximum of 4%–10% of the final concentration in the samples of lowest initial metal concentrations and was disregarded in the calculations.

3.2.2. Effect of Dose and Sorbent Size Interval on the Pb2+ Sorption Capacity of SDBC

The removal of Pb2+ was proportional to the dose of SDBC added at an initial metal concentration of 5 mg/L (see Figure 2a). The sorption capacity at this sorbate concentration was approximately 0.5 mg/g (as is also seen in Figure 1), resulting in a required dose of ~10 g/L to achieve a removal close to 100%.
According to Ho et al. [24], q e (mg/g) decreased with as the sorbent dose increased, though this seems to have been due to the fact that almost all Pb2+ was sorbed from the solution, which means that an increasing number of sorption sites would be left empty at an increased dosage. In the current experiment, the highest dose evaluated (10 g/L) corresponded to almost a 100% Pb2+ sorption, and q t was similar irrespective of the sorbent dose. The slight decline in sorption capacity at a dose of <2 g/L is likely associated with the lower final pH at the lower dose, as indicated in Figure 2b.
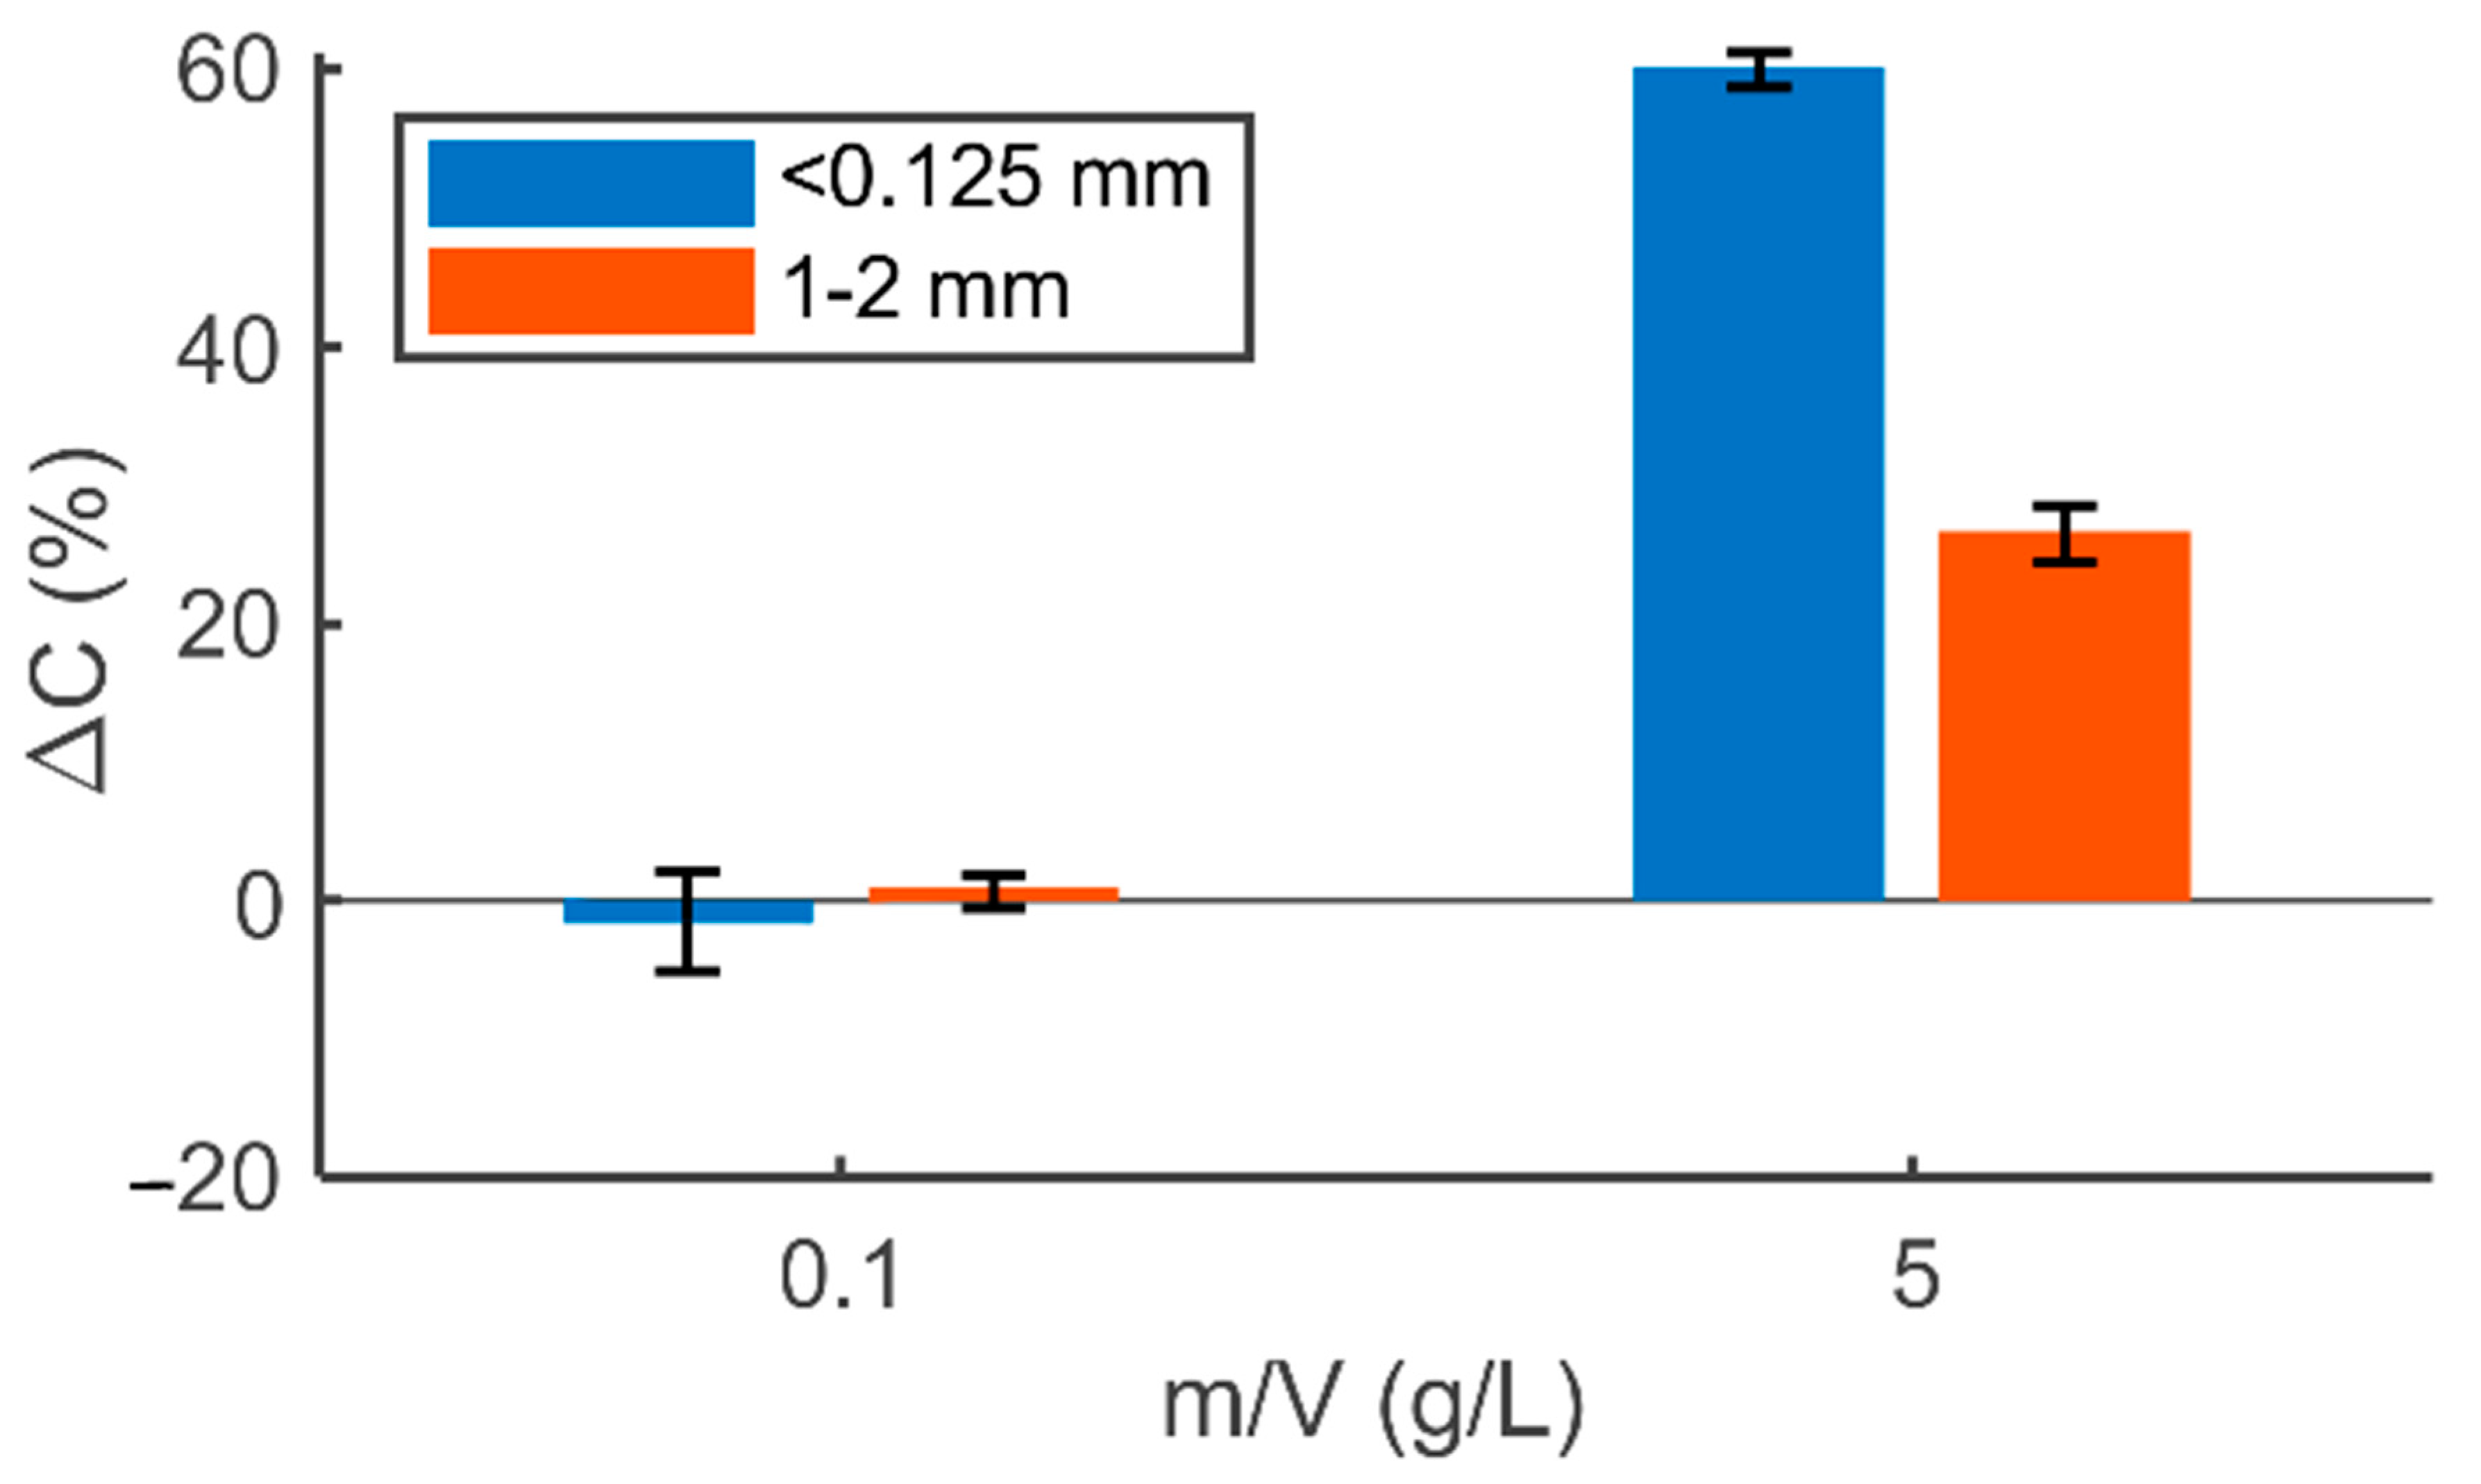
An increased sorbent size interval resulted in a decreased sorption capacity, which was expected due to the less sorbent surface area available [11]. At sorbent dose of 5 g/L of granulated SDBC (1.00–2.00 mm) had less than half the sorption capacity compared to pulverized SDBC (<0.125 mm) (see Figure 3). This corresponds to the smaller surface area and pore volume of the granulated SDBC (see data in Table 4). At a sorbent dose of 0.1 g/L (pH 2 and initial concentration 5 mg/L), there was no significant removal (or release) of Pb2+ for either of the sorbent size intervals.

3.2.3. Sorption Kinetics: Pb2+ Sorption to SDBC

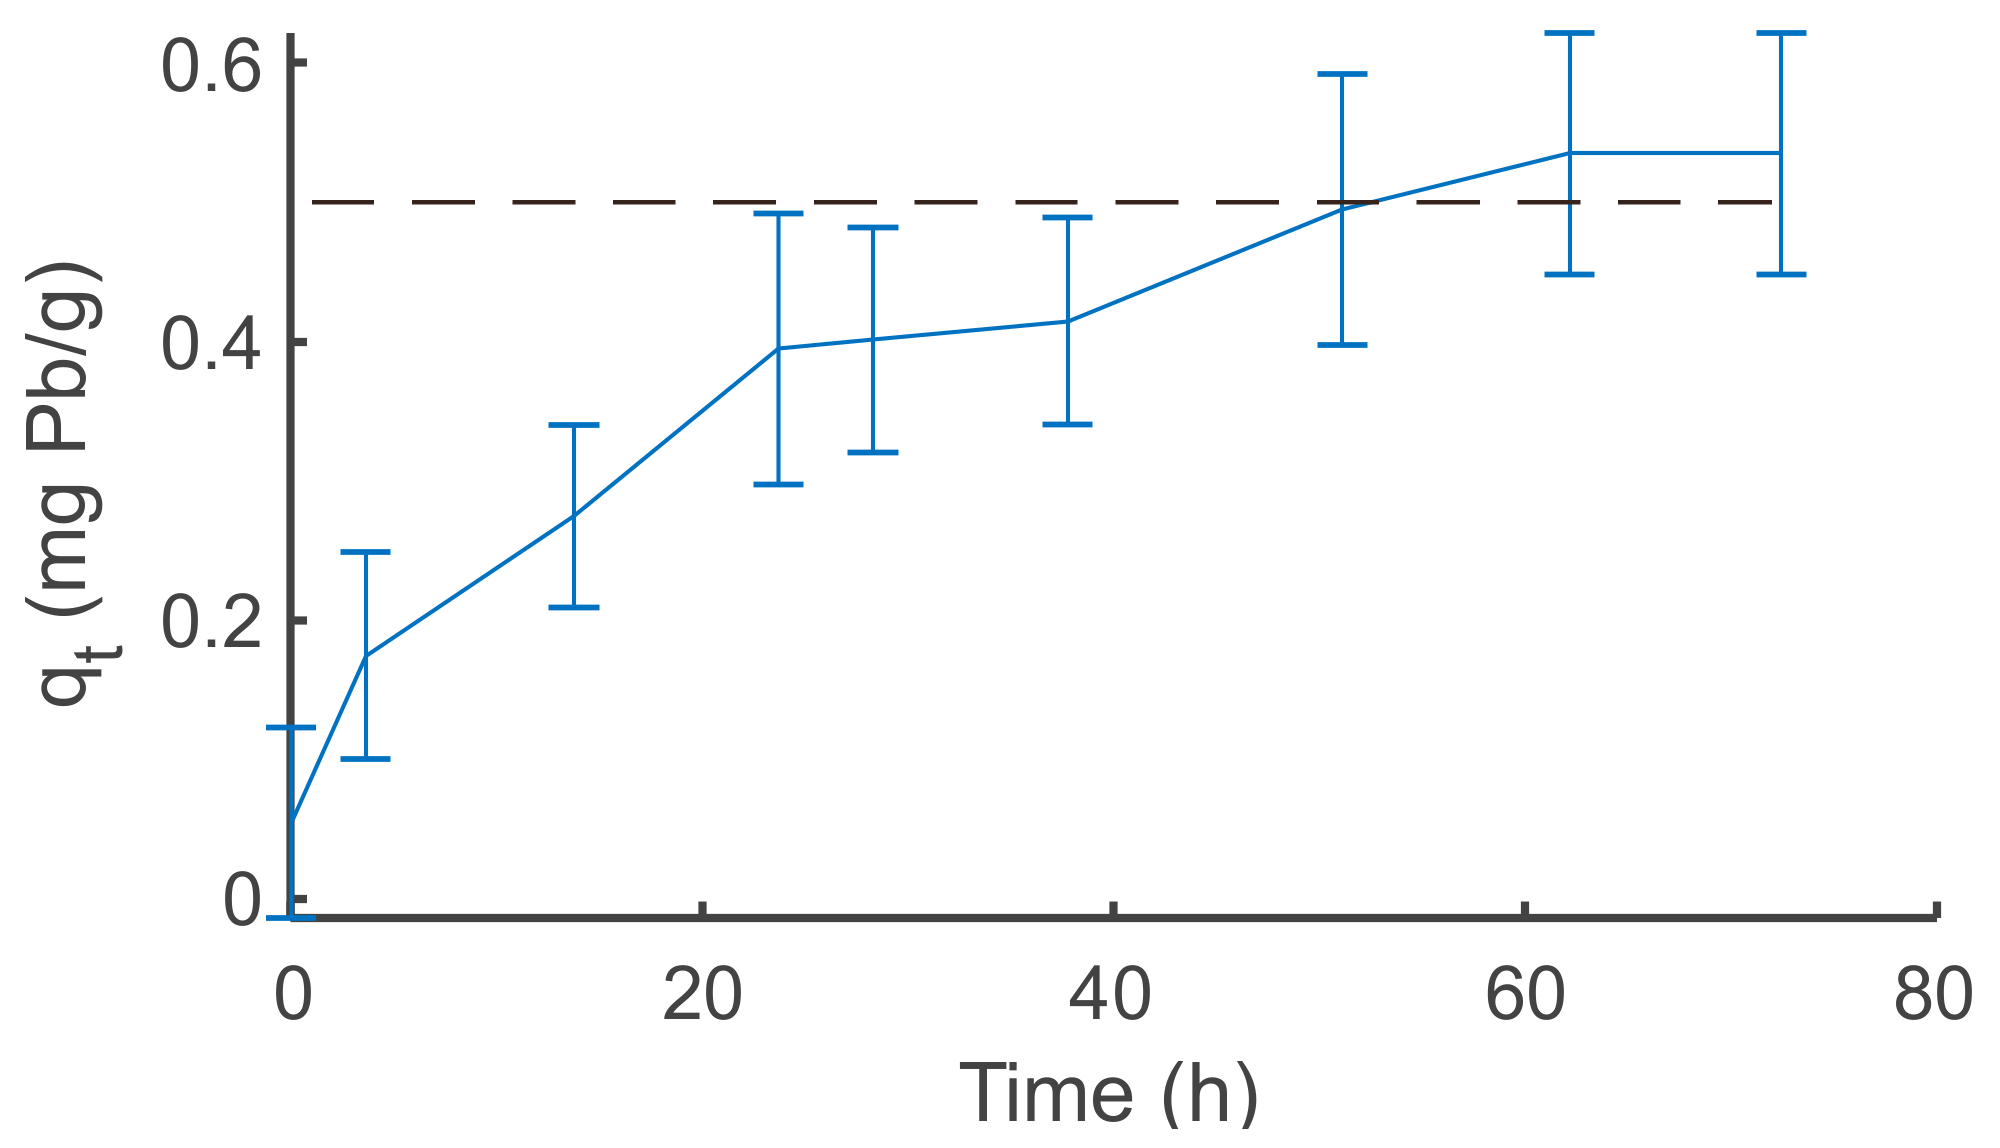
The kinetic study, performed for Pb sorption to SDBC, indicated that it took approximately 50 h before sorption equilibrium was established (see Figure 4).
According to Tran et al. [30], it could take several days or weeks before equilibrium is established for porous sorbents. The pore diffusion and/or diffusion on the sorbent surface limits the sorption rate [49]. However, the long time required for equilibrium in this experiment does not agree with previous studies of Pb2+ sorption to sludge-derived biochar. According to several studies, equilibrium was established within a few hours [15,26,50]. According to Lu et al. [25], a low kinetic rate indicated a high degree of chemisorption through surface complexation and precipitation, while ion exchange and electrostatic interaction are considered as much quicker processes. The sorption could, according to Lu et al. [25], take a longer time at a low pH, although equilibrium should though still be reached within a few hours. As previously mentioned, there was an indication that small pores were opened up during the kinetic experiment. This might, in part, explain the slow kinetics, as the number of sorption sites could then gradually increase.

3.2.4. Effect of pH on Pb2+, Ni2+, Cd2+, Cr3+, Cu2+, and Zn2+ Sorption to SDBC

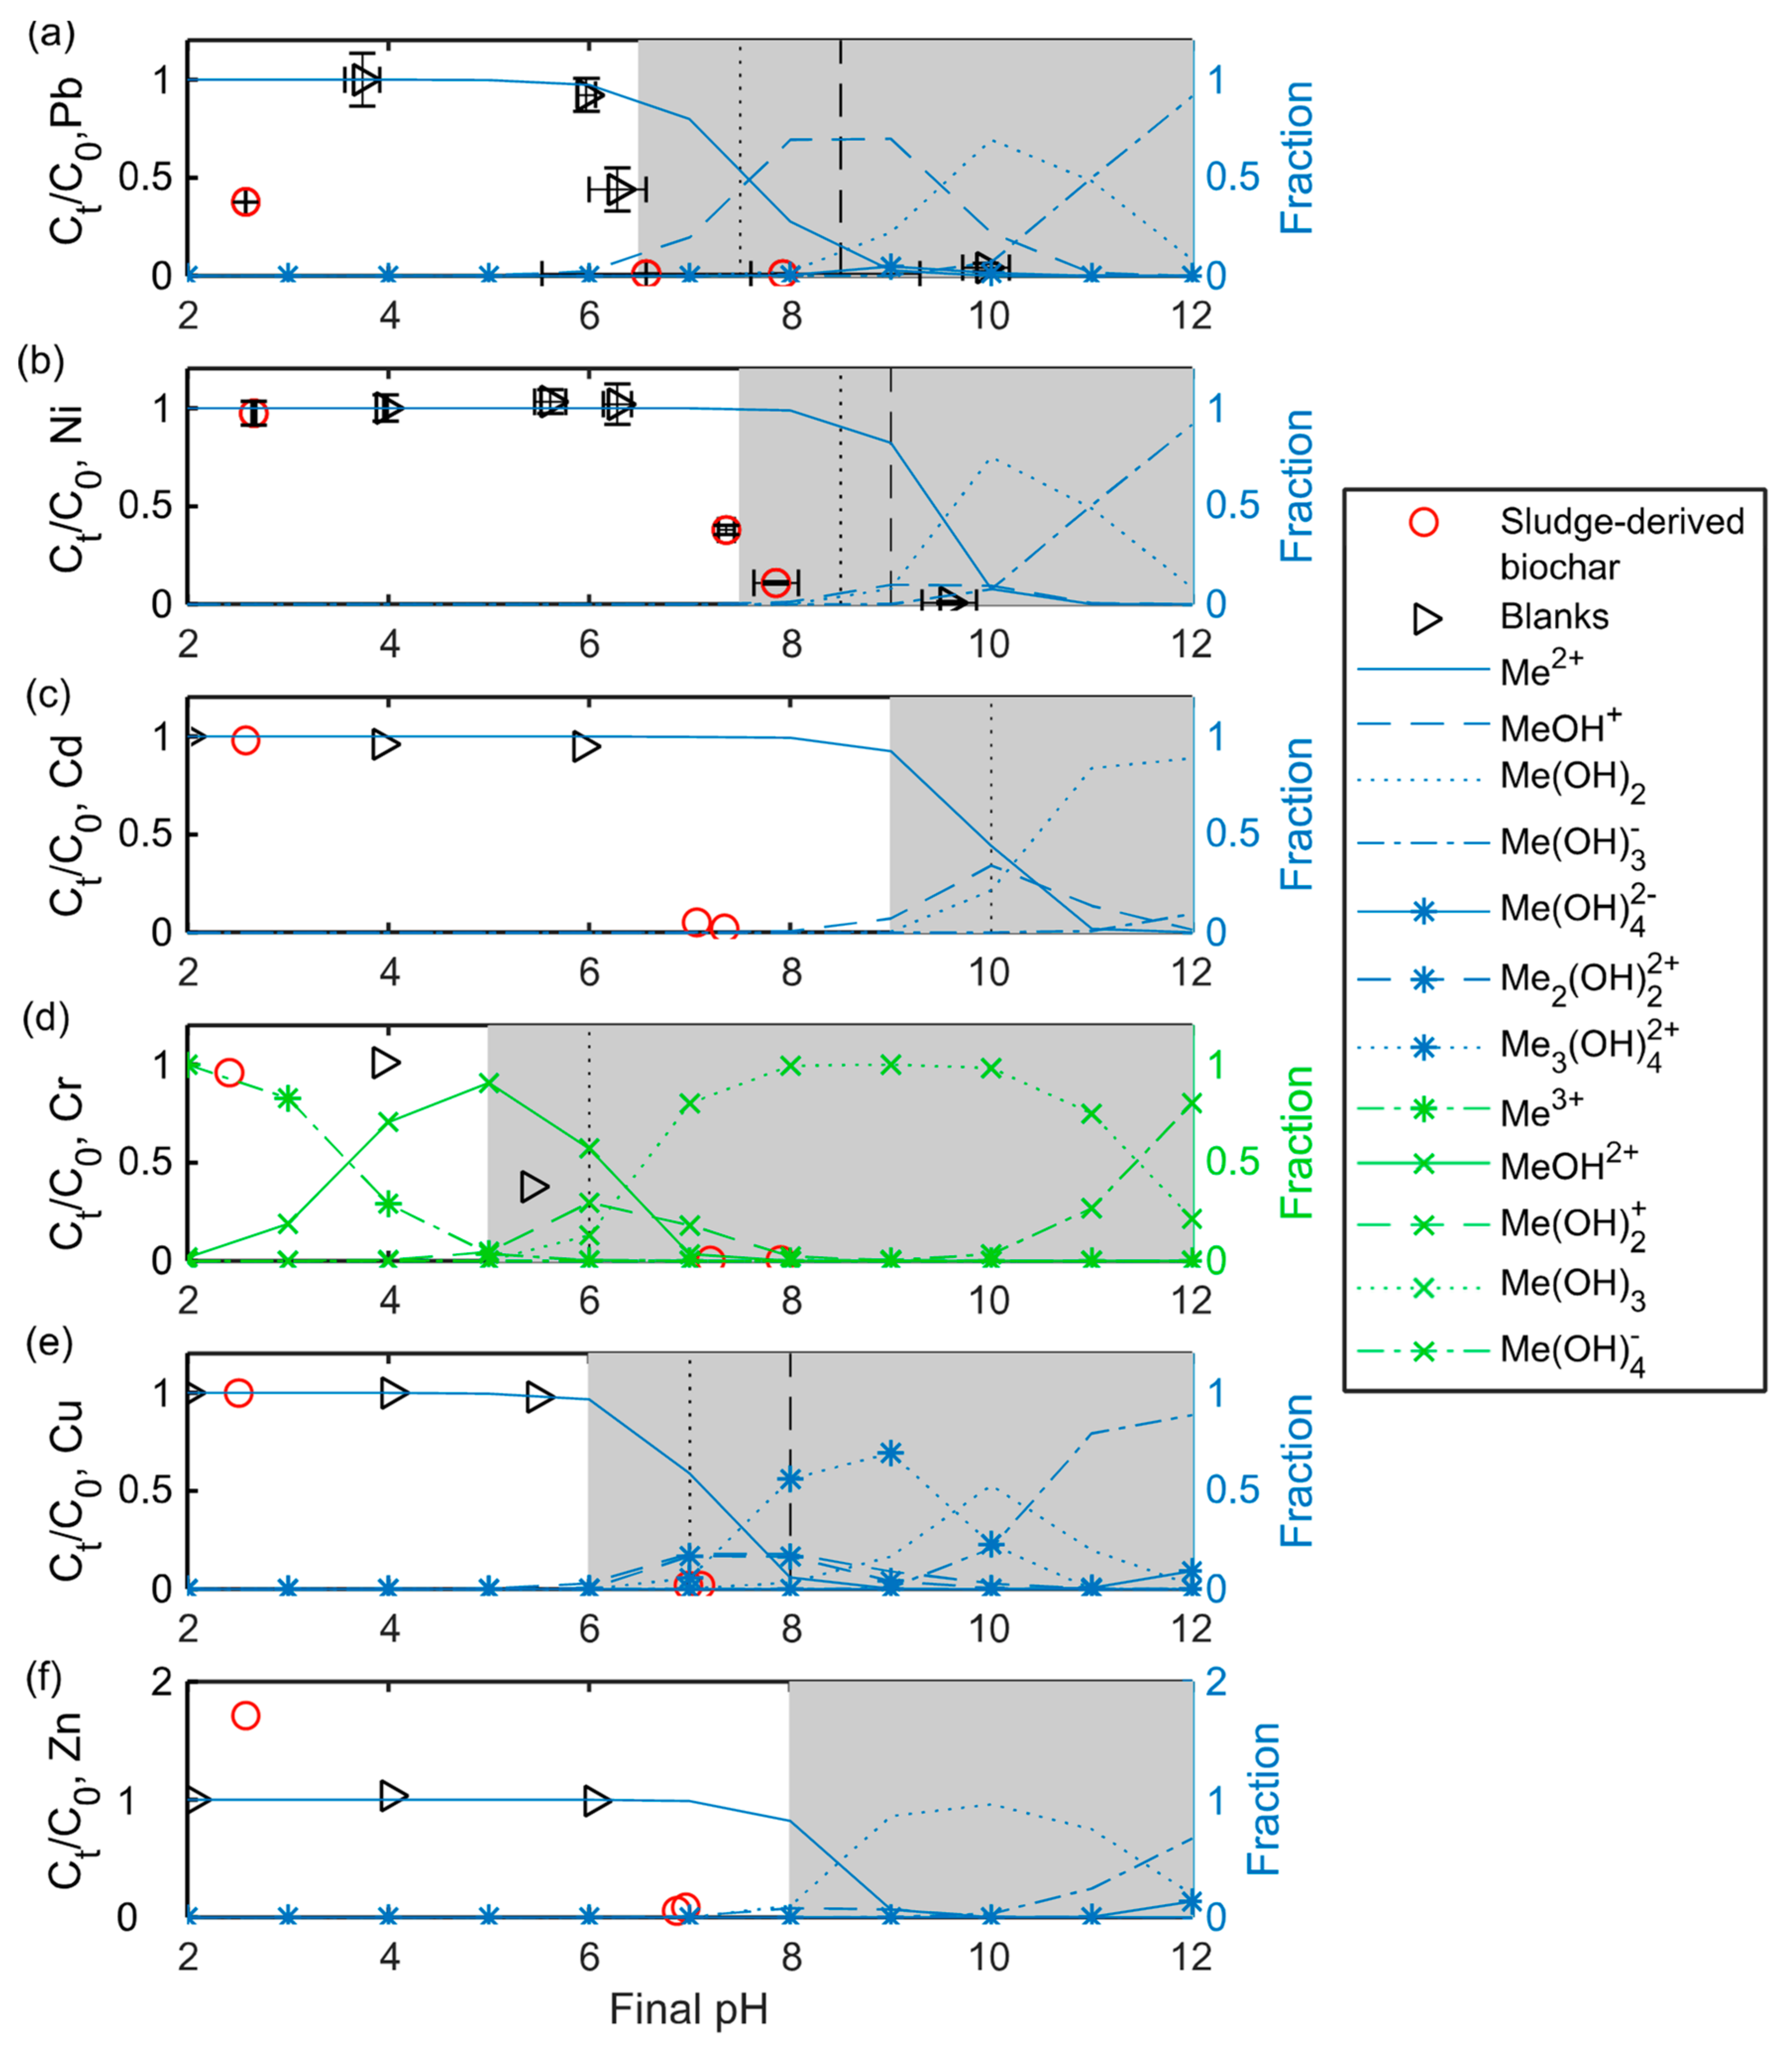
SDBC caused an increase in the sample pH (regardless of initial pH), with a maximum final pH of approximately 8 (see Supplementary Materials Figure S5). This pH increase may have derived from the release of alkalis such as Ca2+ [51]. Figure 5 shows the final concentrations of Pb2+, Ni2+, Cd2+, Cr3+, Cu2+, and Zn2+ for the pH experiments in relation to the final pH of the solution.
SDBC showed the potential to sorb over 90% of Cd2+ and Zn2+ at a final pH of approximately 7, which indicates that precipitation is not a dominating mechanism, since Cd2+ and Zn2+ should be prevalent as metal ions below ~9 and 8, respectively. Instead, sorption processes such as ion exchange and surface complexation are likely involved, together with electrostatic interaction. At an initial pH of 2 (final pH of ~2.5), SDBC released Zn2+, which caused an increase in the sample Zn2+ concentration of ~70%. Pb2+ was partly sorbed at a final pH of <3. At a higher pH (from final pH ~6.5 and above), Pb was removed to almost 100%, which might partly have been caused by precipitation, since lead hydroxides could start to form from a final pH of approximately 6.5.
Cr3+ and Cu2+ were removed to almost 100% at a final pH of approximately 7 and above. This removal could partly or entirely be attributed to precipitation, since Cr3+ and Cu2+ could precipitate from a final pH of approximately 5 and 6, respectively. The Ni2+ removal of more than 50% at a final pH of approximately 7.5 could partly be attributed to precipitation, since Ni2+ precipitation could occur from approximately pH 7.5.
The speciation of heavy metals was not directly investigated here. However, it should be noted that the speciation of heavy metals may not only be affected by the pH in the solution, but also by other factors such as redox potential. Wongrod et al. [52] showed that the oxidation of As3+ to As5+ (redox potential under standard conditions: +0.56 V) occurred after the addition of SDBC. Reduction may also occur, as Cr6+ is easily reduced to Cr3+ (redox potential under standard conditions: Above +1.3) [30]. In the case of the metals investigated here, redox reactions are most likely to be of importance in the case of Cu2+, as this metal has the highest standard reduction potential (the standard reduction potentials fall in the order of: +0.34, −0.13, −0.25, −0.40, −0.74, and −0.76 for Cu2+, Pb2+, Ni2+, Cd2+, Cr3+, and Zn2+, respectively). El-Naggar et al. [53] investigated heavy metal mobility in soil amended with rice hull biochar under fluctuating redox conditions and found that an increase in redox potential resulted in larger fraction of dissolved heavy metals (Cd, Cu, Ni, and Zn). The dissolution was associated with a decline in pH. Oxidation of sulfides and increased concentrations of dissolved aromatic organic compounds at high redox potentials was given as other possible explanations of the increased solubility of heavy metals under high redox potential.
When sorbents were added to ultrapure water at an initial pH of 2, the release of Pb, Ni Cd, Cr, Cu, and Zn occurred (as given in Table 5). At an initial pH of 4, the release of Pb2+ from SDBC decreased to 3.6 × 10⁻⁴ mg/L, and no release of Pb2+ was detected at an initial pH of 8 (see Supplementary Materials Table S1). These results agree with the findings of Wu et al. [46], who observed a higher release of Pb when samples were acidified to pH 2–4. The release of Pb2+ per gram of SDBC added was higher at a lower sorbent dose, with the release of 1.2 × 10⁻³ mg/g at a dose of 5 g/L and 4.0 × 10⁻² mg/g at a dose of 0.1 g/L (pH 2, sorbent size interval <0.125 mm, and contact time 24 h).
The release of Zn2+ was similar to that found by Ho et al. [24], who performed acid leaching tests on sludge-derived biochar and detected resulting Zn concentrations of 4.9 mg/L. Similar to our findings, Ho et al. [24] detected low concentrations of Pb, Ni, Cd, Cr, and Cu after the acid leaching tests.
3.3. Isotherm Modeling: Pb2+ Sorption to SDBC

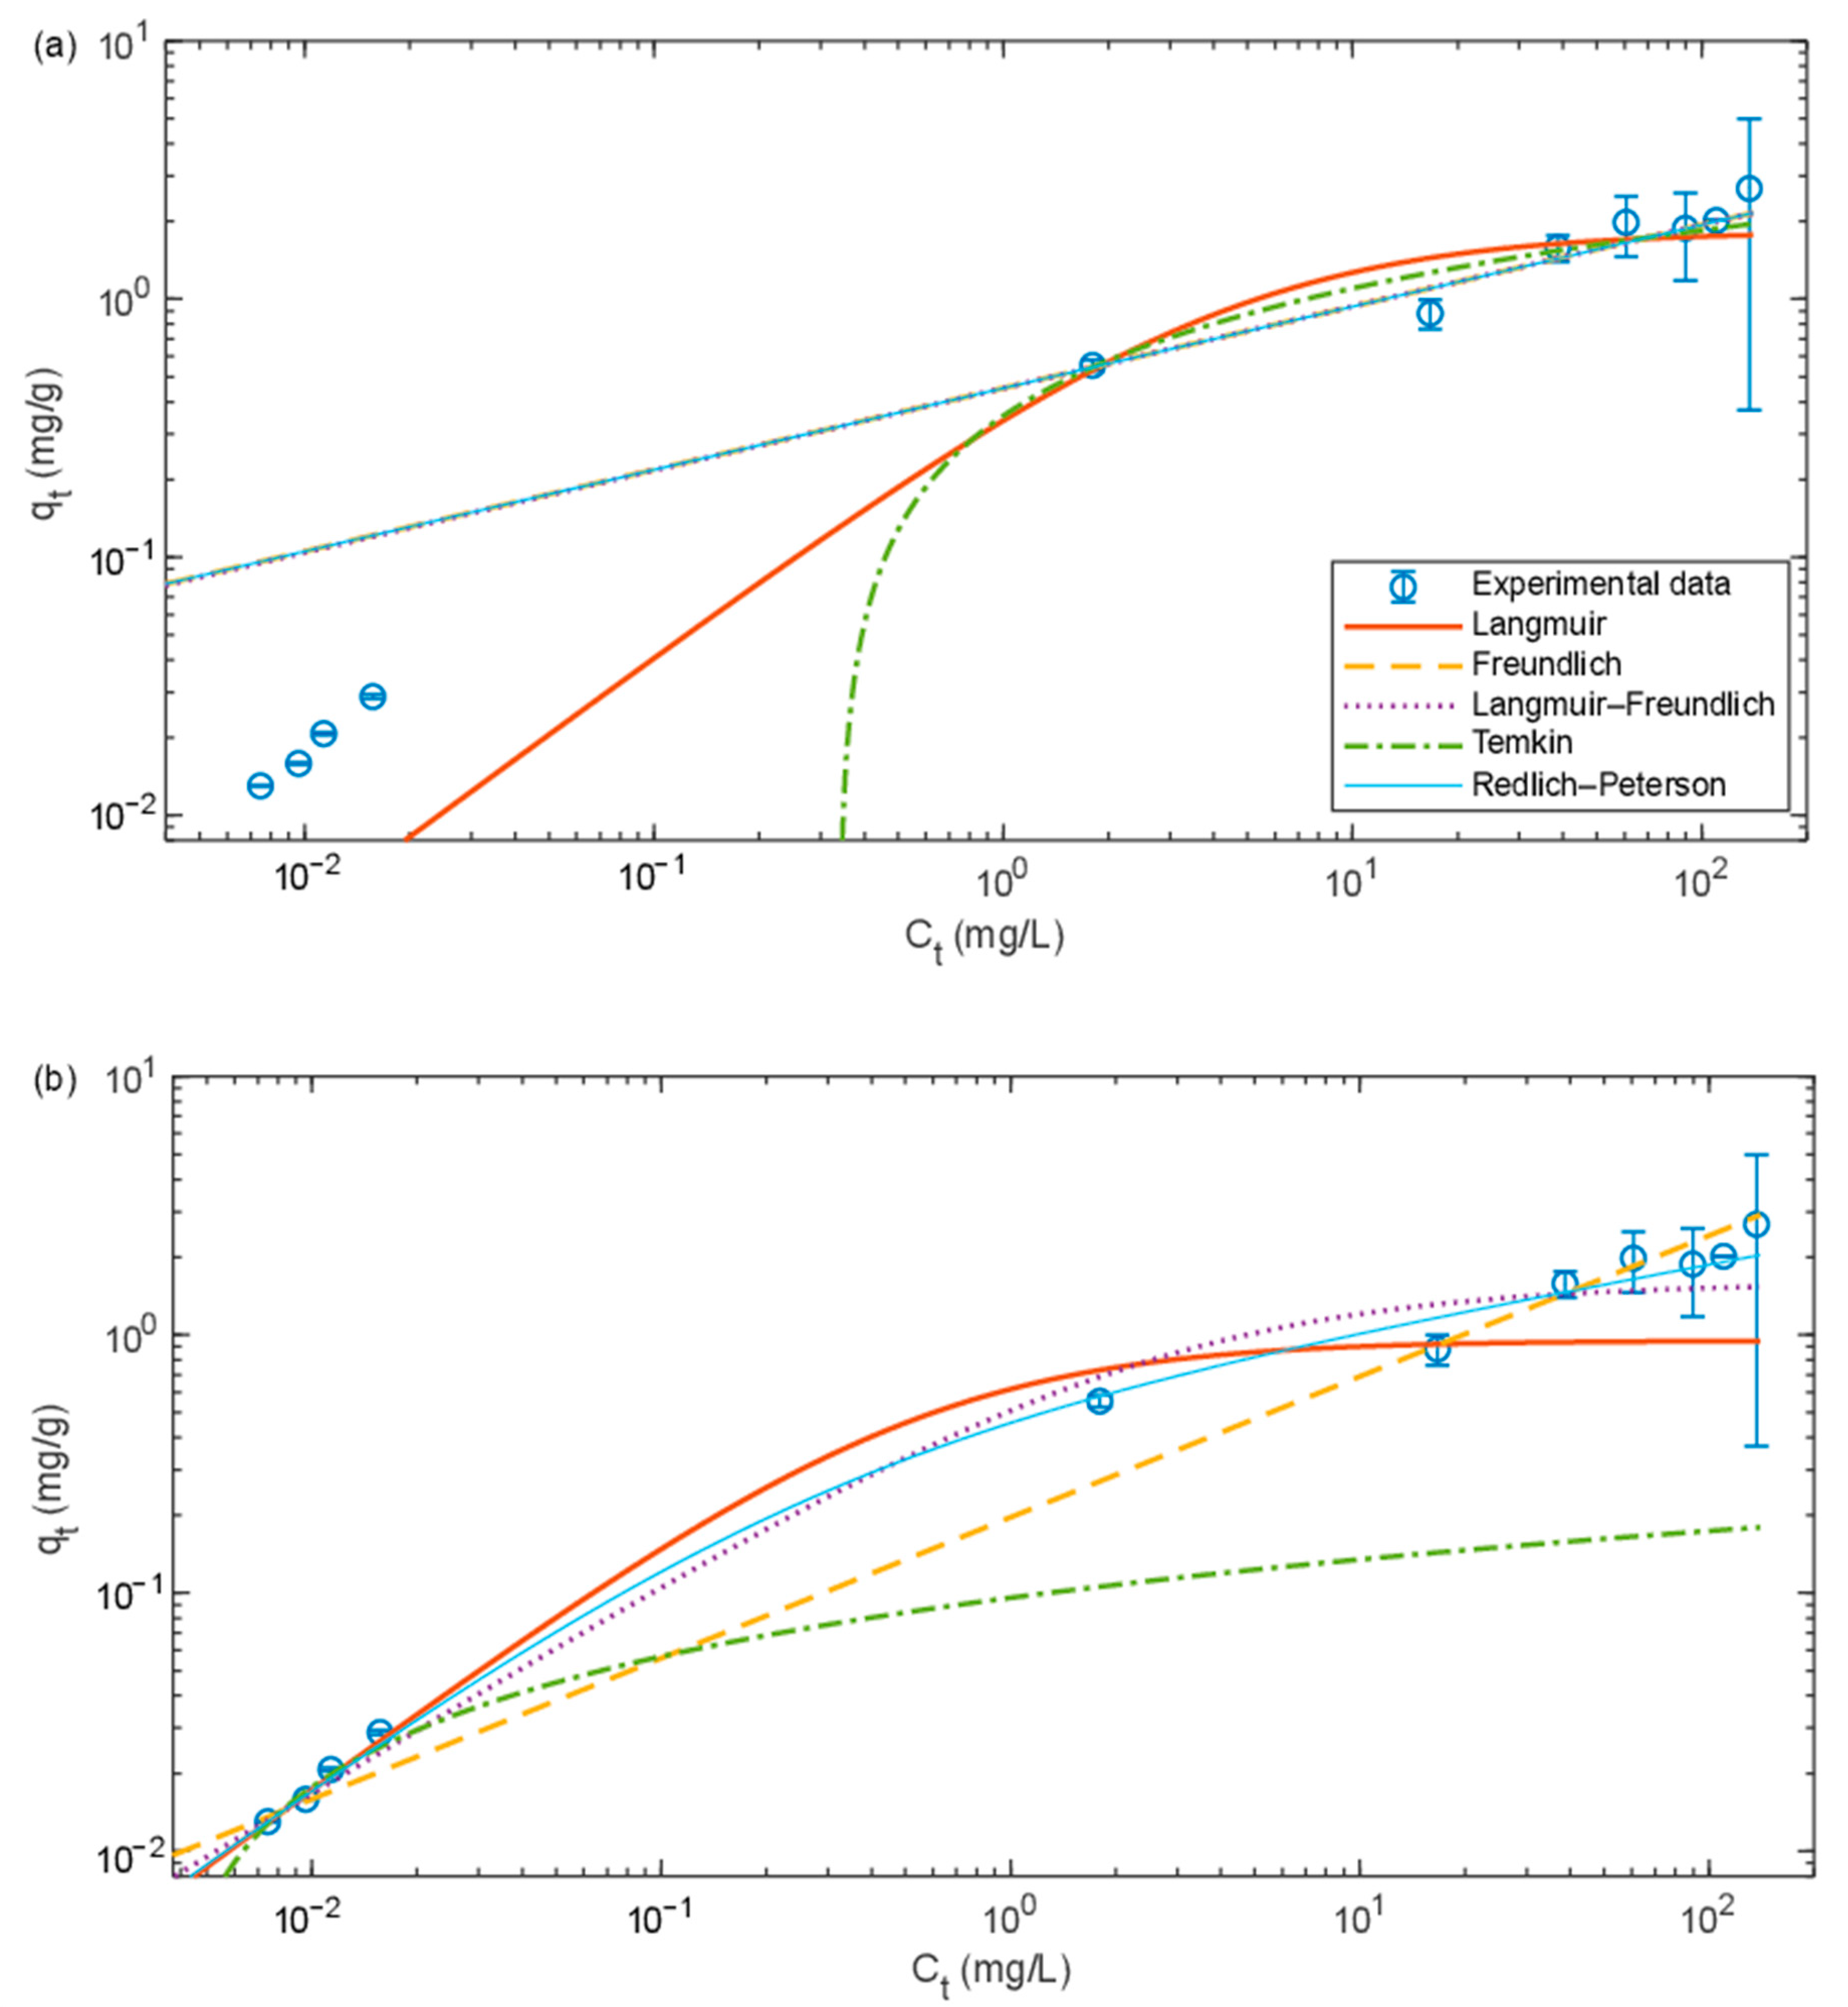
The isotherm models for the sorption of Pb2+ to SDBC are shown in Figure 6a,b (since WDBC and AC did not sorb significant amounts of Pb2+ over the whole concentration range, it was not possible to perform isotherm modeling for these sorbents). The parameter and R2 values for the different models are given in Table 6. When thee modeling was based only on experimental data where the equilibrium concentrations were above 1 mg/L, the Freundlich, Langmuir–Freundlich, and Redlich–Peterson models showed the highest correlations with the experimental data, and all three models gave very similar outputs. However, the sorption at equilibrium concentrations comparable to those in municipal wastewater was not accurately predicted in this case (as seen in Figure 6a). When the modeling was based on the whole concentration range, the Redlich–Peterson model showed the highest correlation with the experimental data. Even though the parameter values for Redlich–Peterson were not similar when modeling was based on concentrations >1 mg/L compared to when modeling was based on the whole concentration range, both modeling options gave similar outputs at concentrations above 1 mg/L. On the contrary, fitting the Freundlich and Langmuir–Freundlich models based on the whole concentration range resulted in less accurate fits at concentrations above 1 mg/L.
The Redlich–Peterson isotherm was especially developed for describing sorption over a wide range of sorbate concentrations [38], which could explain why it has potential to fit the experimental data well. The sorption capacity increased linearly at initial Pb concentrations below 0.1 mg/L. This indicates that the sorption sites that are occupied first have similar sorbate affinities, while at increasing sorbate concentrations, the sites of decreasing sorbate affinity become occupied. The Langmuir–Freundlich model gave the second best fit when considering the whole concentration range. Both with three parameters, the Redlich–Peterson and Langmuir–Freundlich models are more flexible compared to the other models considered. A difference between the two models is that the Langmuir–Freundlich model predicts saturation of surface sites at high sorbate concentrations, while Redlich–Peterson does not predict a finite sorption capacity.
The isotherm parameter values for the sorption of Pb2+ to sludge-derived biochar vary. As an example, the studies by Ho et al. [24] and Lu et al. [48] determined the Freundlich parameter values to be ~30 and 2.23, respectively, for K F and ~8 and 0.298, respectively, for n . In the latter case, the pH in the experiment was 2 (as in this study), and K F increased with increasing pH. The corresponding maximum sorption capacities found in those studies were 47 mg/g and ~30 mg/g. The lower value of K F in this study is in agreement with the lower maximum sorption capacity found here.

3.4. Possible Implementation in a Municipal Wastewater Treatment Plant

SDBC could sorb Pb at concentrations comparable to those in municipal wastewater. Sorption occurred at pH 2, which shows that sorption mechanisms other than precipitation were of importance. At 0.005 mg Pb/L, which is comparable to the minimum Pb concentration typically found in raw municipal wastewater (0.002–0.1 mg Pb/L according to Cantinho et al. [7]), Pb release occurred. However, because the release of metals decreased with increasing pH, there should be less risk of release when the sorbent is applied in real wastewater (which was also indicated by our preliminary results with respect to sorption from wastewater; see Supplementary Materials Figure S3). The risk of release may also vary depending on the metal content in sludge feedstock. The metal concentrations in SDBC were below the limit values for sludge use in agriculture according to European Directive 86/278/EEG [4]. However, the concentrations of Pb, Ni, Cd, Cr, Cu, and Zn were higher compared to the average metal concentrations in sludge from certified WWTPs in Sweden (16, 15, 0.7, 30, 314, and 498 mg/kg dry matter (DM), respectively) [54]. Enrichment of these metals by approximately 20%–60% has previously been shown, due to loss of DM during pyrolysis [25,55]. Even when possible enrichment is considered, the concentrations of these metals in SDBC are still slightly higher than the average concentrations in sludge from certified WWTPs. In comparison to other metals, the concentration of Hg in SDBC was small, and this indicates that it was volatilized during pyrolysis.
The release of Ni, Cd, Cu, and Zn (at an initial pH of 2) resulted in heavy metal concentrations exceeding the minimum concentrations encountered in municipal wastewater. The risk that these heavy metals are released from SDBC could therefore not be ruled out. In the case of Cr, the release was below the typical concentrations found in municipal wastewater. At a pH similar to that in municipal wastewater (typically pH 7–8, according to la Cour Jansen et al. [56]), SDBC was shown to sorb large amounts of Cd and Zn through sorption processes other than precipitation. The reduction of Cd is particularly relevant since the general reduction of Cd levels is required to reach long-term targets for sludge reuse according to the Swedish certification and proposed legislation [54]. Pb, Cr, and Cu could partly be removed through precipitation at a pH similar to that in real wastewater. The addition of sorbent may thus promote metal removal both through sorption and by alkalization. Precipitation of Ni does not occur at a similar pH but would require the pH to increase (to above pH 8.5–9). Efficient Ni removal is thus less likely to occur. Note that the initial metal concentrations investigated in the pH experiments were higher than those typically found in municipal wastewater, and the removal/release of Ni, Cd, Cu, Cr, and Zn at a pH and initial concentration representative of that found in municipal wastewater needs to be further accessed.
The isotherm experiments and modeling showed that experimental data at concentrations comparable to those in municipal wastewater are necessary to accurately predict the sorption capacity at these concentrations. To clarify the importance of accurate isotherm parameter values for the prediction of sorption and removal capacity, consider the required dose of SDBC to achieve 90% removal of Pb2+ at an initial concentration of 0.05 mg/L (which is in the middle of the expected range of 0.002–0.1 mg/L) (based on Figure S6 in the Supplementary Materials):
  • When we applied the Redlich–Peterson isotherm with parameter values based on the experimental data for an equilibrium concentration of >1 mg/L, we found that the required dose was ~0.6 g/L.
  • However, when the isotherm parameter values based on the whole concentration range of the experiment were applied, we found that the removal increased only marginally after 80% removal had been reached. To achieve 80% removal, a dose of ~10 g/L was required.
Thus, the predicted amount of sorbent required is greatly underestimated if modeling is based on only the higher equilibrium concentrations.
For the calculation of the equilibrium sorption at concentrations comparable to those in municipal wastewater, it is relevant to take into account q i , which represents the initial amount of sorbed metal per mass unit of sorbent. This parameter is generally not taken into account in sorption experiments. Considering the variation in the of release of metals at different pH levels and sorbent doses, these conditions will likely influence the value of q i . Furthermore, the total amount of metals contained in the sorbent will also influence the value of q i .
In a wastewater treatment process, dose and size interval could be adapted based on the required metal removal. Note that the maximum possible dose, if the sorbent was produced internally at the treatment plant (according to the novel concept considered here), would be limited by the amount of primary sludge produced over time.
Due to the slow kinetics, it might not be practically possible to achieve maximum sorption if SDBC were applied in municipal wastewater treatment, because the required basin volumes to achieve comparable residence time would be very large.
For the possible implementation of SDBC as a sorbent in a WWTP, the sorption capacity needs to be further evaluated with wastewater of different qualities. One aspect that we plan to evaluate in coming work is the possible competition for and blocking of sorption sites—depending on factors such as organic matter concentration in the wastewater. Furthermore, the possible synergies of metal removal and removal of other pollutants is of interest for further investigation. Wei et al. [57] found that effluent organic matter from a biological wastewater treatment process enhanced the sorption of Cu2+ onto SDBC through interaction of humic and fulvic acids in the sorption process. To determine the possible metal sorption in a specific WWTP, the speciation of metals in the raw wastewater (dissolved or particle-bound) should also be assessed.

4. Conclusions

A high potential of Pb2+ sorption by SDBC was demonstrated at Pb concentrations comparable to those in municipal wastewater (up to 83%, with a maximum sorption capacity of ~2 mg/g at pH 2); however, it is important to note that the release of Pb from the sorbent may be an issue when the initial Pb concentration is below 25 μg/L (municipal wastewaters could have Pb concentrations below this value). The experimental results and modeling indicated that Cd, Cr, Cu, and Zn may be efficiently removed by sorption to SDBC and alkalization induced by the addition of sorbent at a pH similar to that in municipal wastewater, while efficient removal of Ni is less likely to occur. Ni, Cd, Cr, Cu, and Zn removal at an initial concentration comparable to that in municipal wastewater was not directly evaluated and the risk of Ni, Cd, Cu, and Zn being released from SDBC at such initial concentrations could not be ruled out. The Pb2+ sorption capacity of the reference materials, i.e., WDBC and AC, was considerably lower compared to the anticipated sorption capacity based on the literature (<0 and (3.5 ± 0.4) × 10−3 mg/g, respectively). The probable cause is the low pH used in the experiments (pH 2). The Pb sorption capacity of SDBC could be described using the Redlich–Peterson isotherm model over a concentration span of 0.005–150 mg/L. It was shown that experimental data at concentrations comparable to those in municipal wastewater are necessary to accurately model and predict the sorption capacity of SDBC at these concentrations.

Supplementary Materials

The following are available online at https://www.mdpi.com/2227-9717/8/12/1559/s1, Table S1: Release of metals from sludge-derived biochar (SDBC) at different pH levels; Figure S1: Removal efficiency and sorption capacity of SDBC for Pb2+ at initial Pb2+ concentrations similar to those in municipal wastewater, based on the literature data; Figure S2: Removal of Pb2+ at different doses; Figure S3: Concentrations of Pb2+ in milli-Q (ultrapure water) and filtered wastewater (0.45 μm) before and after the addition of SDBC (5 g/L); Figure S4: Residual Pb2+ in the solution ( C t / C 0 ) at various final pH levels; Figure S5: Initial and final pH levels after the addition of SDBC to the metal solutions during the experiment with respect to the effect of pH; Figure S6: Calculation of the removal (%) at different doses and initial concentrations ( C 0 ) equal to 0.050 mg Pb2+/L, based on the isotherm parameters that were determined in this study.

Author Contributions

Conceptualization, I.S., L.J.W., and E.T.; methodology, I.S. and H.R. (Hanna Runtti); formal analysis, I.S.; investigation, I.S., H.R. (Hanna Runtti), and H.R. (Henrik Romar); writing—original draft preparation, I.S.; writing—review and editing, H.R. (Hanna Runtti), L.J.W., H.R. (Henrik Romar), and E.T.; visualization, I.S.; supervision, L.J.W. and E.T.; project administration, E.T.; funding acquisition, E.T. All authors have read and agreed to the published version of the manuscript.

Funding

This work was supported by VA-kluster Mälardalen, Eskilstuna Energi och Miljö, Vafab Miljö, Mälarenergi, Maa-ja Vesitekniikan tuki ry, and the Walter Ahlström Foundation.

Acknowledgments

The authors thank Dagmar Stirba (Linz-Unkel Sewage treatment plant) for supplying the sludge-derived biochar, Bert Geraats (Eliquo) for suppling information on the quality and production of the sludge-derived biochar, and Per Almersson (Vindelkol) for suppling information about the production of wood-derived biochar.

Conflicts of Interest

The authors declare no conflict of interest.

Nomenclature

ACActivated carbon
C 0 Initial concentration (mg/L)
C t / C e Final/equilibrium concentration (mg/L)
Δ C Removal efficiency (%)
DMDry mass (%)
m Sorbent mass (g)
m M e Sorbate mass (mg)
m / V Sorbent dose (g/L)
q i Initially sorbed metal (mg/g)
q t / q e Final/equilibrium sorption (mg/g)
SDBCSludge-derived biochar
V Volume (L)
WDBCWood-derived biochar
WWTPMunicipal wastewater treatment plant

References

  1. Cloutier, F.; Clouzot, L.; Vanrolleghem, P.A. Predicting the Fate of Emerging Contaminants in Wastewater Treatment Plants. Proc. Water Environ. Fed. 2012, 2012, 3828–3836. [Google Scholar] [CrossRef]
  2. Milieu Ltd.; WRc; RPA. Environmental, Economic and Social Impacts of the Use of Sewage Sludge on Land; Draft Summary Report 1: Assessment of Existing Knowledge; European Commission: Brussels, Belgium, 2008. [Google Scholar]
  3. Hargreaves, A.J.; Constantino, C.; Dotro, G.; Cartmell, E.; Campo, P. Fate and removal of metals in municipal wastewater treatment: A review. Environ. Technol. Rev. 2018, 7, 1–18. [Google Scholar] [CrossRef]
  4. European Commission. Council Directive 86/278/EEC of 12 June 1986 on the protection of the environment, and in particular of the soil, when sewage sludge is used in agriculture. Off. J. Eur. Union 1986, 187, 6–12. [Google Scholar]
  5. European Commission. Directive 2008/105/EC of the european parliament and of the council of 16 December 2008 on environmental quality standards in the field of water policy. Off. J. Eur. Union 2008, 348, 84–97. [Google Scholar]
  6. Vezzaro, L.; Benedetti, L.; Gevaert, V.; De Keyser, W.; Verdonck, F.; De Baets, B.; Nopens, I.; Cloutier, F.; Vanrolleghem, P.A.; Mikkelsen, P.S. A model library for dynamic transport and fate of micropollutants in integrated urban wastewater and stormwater systems. Environ. Model. Softw. 2014, 53, 98–111. [Google Scholar] [CrossRef]
  7. Cantinho, P.; Matos, M.; Trancoso, M.A.; dos Santos, M.M.C. Behaviour and fate of metals in urban wastewater treatment plants: A review. Int. J. Environ. Sci. Technol. 2016, 13, 359–386. [Google Scholar] [CrossRef] [Green Version]
  8. Metcalf & Eddy; Tchobanoglous, G.; Stensel, H.; Tsuchihashi, R.; Burton, F. Wastewater Engineering: Treatment and Resource Recovery, 5th ed.; Tchobanoglous, G., Burton, F.L., Stensel, H.D., Eds.; McGraw-Hill: New York, NY, USA, 2014; ISBN 1259010791. [Google Scholar]
  9. Barakat, M. New trends in removing heavy metals from industrial wastewater. Arab. J. Chem. 2011, 4, 361–377. [Google Scholar] [CrossRef] [Green Version]
  10. Fu, F.; Wang, Q. Removal of heavy metal ions from wastewaters: A review. J. Environ. Manag. 2011, 92, 407–418. [Google Scholar] [CrossRef]
  11. Inyang, M.I.; Gao, B.; Yao, Y.; Xue, Y.; Zimmerman, A.; Mosa, A.; Pullammanappallil, P.; Ok, Y.S.; Cao, X. A review of biochar as a low-cost adsorbent for aqueous heavy metal removal. Crit. Rev. Environ. Sci. Technol. 2016, 46, 406–433. [Google Scholar] [CrossRef]
  12. Rosales, E.; Meijide, J.; Pazos, M.; Sanromán, M.A. Challenges and recent advances in biochar as low-cost biosorbent: From batch assays to continuous-flow systems. Bioresour. Technol. 2017, 246, 176–192. [Google Scholar] [CrossRef]
  13. Smith, K.M.; Fowler, G.D.; Pullket, S.; Graham, N.J.D. Sewage sludge-based adsorbents: A review of their production, properties and use in water treatment applications. Water Res. 2009, 43, 2569–2594. [Google Scholar] [CrossRef] [PubMed]
  14. Chen, T.; Zhang, Y.; Wang, H.; Lu, W.; Zhou, Z.; Zhang, Y.; Ren, L. Influence of pyrolysis temperature on characteristics and heavy metal adsorptive performance of biochar derived from municipal sewage sludge. Bioresour. Technol. 2014, 164, 47–54. [Google Scholar] [CrossRef] [PubMed]
  15. Zhang, W.; Mao, S.; Chen, H.; Huang, L.; Qiu, R. Pb(II) and Cr(VI) sorption by biochars pyrolyzed from the municipal wastewater sludge under different heating conditions. Bioresour. Technol. 2013, 147, 545–552. [Google Scholar] [CrossRef] [PubMed]
  16. Gómez-Pacheco, C.V.; Rivera-Utrilla, J.; Sánchez-Polo, M.; López-Peñalver, J.J. Optimization of the preparation process of biological sludge adsorbents for application in water treatment. J. Hazard. Mater. 2012, 217–218, 76–84. [Google Scholar] [CrossRef] [PubMed]
  17. Zhang, A.; Li, X.; Xing, J.; Xu, G. Adsorption of potentially toxic elements in water by modified biochar: A review. J. Environ. Chem. Eng. 2020, 8, 104196. [Google Scholar] [CrossRef]
  18. Brunauer, S.; Emmett, P.H.; Teller, E. Adsorption of gases in multimolecular layers. J. Am. Chem. Soc. 1938, 60, 309–319. [Google Scholar] [CrossRef]
  19. Seaton, N.A.; Walton, J.P.R.B.; Quirke, N. A new analysis method for the determination of the pore size distribution of porous carbons from nitrogen adsorption measurements. Carbon 1989, 27, 853–861. [Google Scholar] [CrossRef]
  20. ISO Standard, no. 17294-2. Water Quality—Application of Inductively Coupled Plasma Mass Spectrometry (ICP-MS)—Part 2: Determination of Selected Elements Including Uranium Isotopes; ISO: Geneva, Switzerland, 2016. [Google Scholar]
  21. EPA Method 200.8: Determination of Trace Elements in Waters and Wastes by Inductively Coupled Plasma-Mass Spectrometry; EPA: Washington, DC, USA, 1994.
  22. EN 13656. Characterization of Waste—Microwave Assisted Digestion with Hydrofluoric (HF), Nitric (HNO3) and Hydrochloric (HCl) Acid Mixture for Subsequent Determination of Elements; CEN: Brussels, Belgium, 2002. [Google Scholar]
  23. SS 028113-1—Vattenundersökningar—Bestämning av torrsubstans och glödgningsrest i vatten, slam och sediment. In Determination of Dry Matter and Ignition Residue in Water, Sludge and Sediment; SIS: Stockholm, Sweden, 1981.
  24. Ho, S.-H.; Chen, Y.-d.; Yang, Z.-k.; Nagarajan, D.; Chang, J.-S.; Ren, N.-q. High-efficiency removal of lead from wastewater by biochar derived from anaerobic digestion sludge. Bioresour. Technol. 2017, 246, 142–149. [Google Scholar] [CrossRef]
  25. Lu, H.; Zhang, W.; Yang, Y.; Huang, X.; Wang, S.; Qiu, R. Relative distribution of Pb2+ sorption mechanisms by sludge-derived biochar. Water Res. 2012, 46, 854–862. [Google Scholar] [CrossRef]
  26. Zhang, W.; Huang, X.; Jia, Y.; Rees, F.; Tsang, D.C.W.; Qiu, R.; Wang, H. Metal immobilization by sludge-derived biochar: Roles of mineral oxides and carbonized organic compartment. Environ. Geochem. Health 2017, 39, 379–389. [Google Scholar] [CrossRef]
  27. Al-Jabari, M. Kinetic models for adsorption on mineral particles comparison between Langmuir kinetics and mass transfer. Environ. Technol. Innov. 2016, 6, 27–37. [Google Scholar] [CrossRef]
  28. ISO Standard, no. 3696. Water for Analytical Laboratory Use—Specification and Test Methods; ISO: Geneva, Switzerland, 1987. [Google Scholar]
  29. ISO Standard, no. 11885. Water Quality—Determination of Selected Elements by Inductively Coupled Plasma Optical Emission Spectrometry (ICP-OES); ISO: Geneva, Switzerland, 2007. [Google Scholar]
  30. Tran, H.N.; You, S.-J.; Hosseini-Bandegharaei, A.; Chao, H.-P. Mistakes and inconsistencies regarding adsorption of contaminants from aqueous solutions: A critical review. Water Res. 2017, 120, 88–116. [Google Scholar] [CrossRef] [PubMed]
  31. Gustafsson, J.P. Visual MINTEQ Version 3.1 [WWW Document]; KTH Royal Institute of Technology: Stockholm, Sweden, 2018; Available online: https://vminteq.lwr.kth.se/download/ (accessed on 20 September 2018).
  32. Tan, X.; Liu, Y.; Zeng, G.; Wang, X.; Hu, X.; Gu, Y.; Yang, Z. Application of biochar for the removal of pollutants from aqueous solutions. Chemosphere 2015, 125, 70–85. [Google Scholar] [CrossRef] [PubMed]
  33. Langmuir, I. The adsorption of gases on plane surfaces of glass, mica and platinum. J. Am. Chem. Soc. 1918, 40, 1361–1403. [Google Scholar] [CrossRef] [Green Version]
  34. Freundlich, H. On the adsorption in solution (Über die Adsorption in Lösungen, in German). Z. Phys. Chem. 1906, 57, 385–470. [Google Scholar]
  35. Coulson, J.M.; Richardson, J.F. Chemical Engineering, Volume 2: Particle Technology and Separation Processes, 4th ed.; Butterworth-Heinemann: Oxford, UK, 1991. [Google Scholar]
  36. Sips, R. On the Structure of a Catalyst Surface. J. Chem. Phys. 1948, 16, 490–495. [Google Scholar] [CrossRef]
  37. Temkin, M.; Pyzhev, V. Kinetics of ammonia synthesis on promoted iron catalysts. Acta Physiochim. URSS 1940, 12, 327–356. [Google Scholar]
  38. Redlich, O.; Peterson, D.L. A Useful adsorption isotherm. J. Phys. Chem. 1959, 63, 1024. [Google Scholar] [CrossRef]
  39. Mohan, D.; Sharma, R.; Singh, V.K.; Steele, P.; Pittman, C.U., Jr. Fluoride removal from water using bio-char, a green waste, low-cost adsorbent: Equilibrium uptake and sorption dynamics modeling. Ind. Eng. Chem. Res. 2012, 51, 900–914. [Google Scholar] [CrossRef]
  40. Tan, X.-F.; Liu, Y.-G.; Gu, Y.-L.; Xu, Y.; Zeng, G.-M.; Hu, X.-J.; Liu, S.-B.; Wang, X.; Liu, S.-M.; Li, J. Biochar-based nano-composites for the decontamination of wastewater: A review. Bioresour. Technol. 2016, 212, 318–333. [Google Scholar] [CrossRef]
  41. Mohan, D.; Sarswat, A.; Ok, Y.S.; Pittman, C.U. Organic and inorganic contaminants removal from water with biochar, a renewable, low cost and sustainable adsorbent—A critical review. Bioresour. Technol. 2014, 160, 191–202. [Google Scholar] [CrossRef] [PubMed]
  42. Sajjad, M.; Khan, S.; Baig, S.A.; Munir, S.; Naz, A.; Ahmad, S.S.; Khan, A. Removal of potentially toxic elements from aqueous solutions and industrial wastewater using activated carbon. Water Sci. Technol. 2017, 75, 2571–2579. [Google Scholar] [CrossRef] [PubMed] [Green Version]
  43. Zhao, J.J.; Shen, X.-J.; Domene, X.; Alcañiz, J.-M.; Liao, X.; Palet, C. Comparison of biochars derived from different types of feedstock and their potential for heavy metal removal in multiple-metal solutions. Sci. Rep. 2019, 9, 1–12. [Google Scholar] [CrossRef] [PubMed] [Green Version]
  44. Abdel-Fattah, M.M.; Mahmoud, M.E.; Ahmed, S.B.; Huff, M.D.; Lee, J.W.; Kumar, S. Biochar from woody biomass for removing metal contaminants and carbon sequestration. J. Ind. Eng. Chem. 2015, 22, 103–109. [Google Scholar] [CrossRef]
  45. Mohan, D.; Pittman, C.U., Jr.; Bricka, M.; Smith, F.; Yancey, B.; Mohammad, J.; Steele, P.H.; Alexandre-Franco, M.F.; Gómez-Serrano, V.; Gong, H. Sorption of arsenic, cadmium, and lead by chars produced from fast pyrolysis of wood and bark during bio-oil production. J. Colloid Interface Sci. 2007, 310, 57–73. [Google Scholar] [CrossRef]
  46. Wu, H.; Che, X.; Ding, Z.; Hu, X.; Creamer, A.E.; Chen, H.; Gao, B. Release of soluble elements from biochars derived from various biomass feedstocks. Environ. Sci. Pollut. Res. 2016, 23, 1905–1915. [Google Scholar] [CrossRef]
  47. Campos, P.; De La Rosa, J.M. Assessing the effects of biochar on the immobilization of trace elements and plant development in a naturally contaminated soil. Sustainability 2020, 12, 6025. [Google Scholar] [CrossRef]
  48. Lu, H.; Zhang, W.; Wang, S.; Zhuang, L.; Yang, Y.; Qiu, R. Characterization of sewage sludge-derived biochars from different feedstocks and pyrolysis temperatures. J. Anal. Appl. Pyrolysis 2013, 102, 137–143. [Google Scholar] [CrossRef]
  49. Worch, E. Adsorption Technology in Water Treatment: Fundamentals, Processes, and Modeling; De Gruyter: Berlin, Boston, 2012. [Google Scholar]
  50. Tao, H.-C.; Zhang, H.-R.; Li, J.-B.; Ding, W.-Y. Biomass based activated carbon obtained from sludge and sugarcane bagasse for removing lead ion from wastewater. Bioresour. Technol. 2015, 192, 611–617. [Google Scholar] [CrossRef]
  51. Chen, T.; Zhou, Z.; Han, R.; Meng, R.; Wang, H.; Lu, W. Adsorption of cadmium by biochar derived from municipal sewage sludge: Impact factors and adsorption mechanism. Chemosphere 2015, 134, 286–293. [Google Scholar] [CrossRef]
  52. Wongrod, S.; Simon, S.; van Hullebusch, E.D.; Lens, P.N.L.; Guibaud, G. Changes of sewage sludge digestate-derived biochar properties after chemical treatments and influence on As(III and V) and Cd(II) sorption. Int. Biodeterior. Biodegrad. 2018, 135, 96–102. [Google Scholar] [CrossRef]
  53. El-Naggar, A.; Shaheen, S.M.; Ok, Y.S.; Rinklebe, J. Biochar affects the dissolved and colloidal concentrations of Cd, Cu, Ni, and Zn and their phytoavailability and potential mobility in a mining soil under dynamic redox-conditions. Sci. Total Environ. 2018, 624, 1059–1071. [Google Scholar] [CrossRef] [PubMed]
  54. Mattsson, A.; Finnson, A.; I’Ons, D. Heavy metal content of Swedish municipal wastewater sludge—Status and goals. Water Sci. Technol. 2017, 76, 869–876. [Google Scholar] [CrossRef] [PubMed]
  55. Hossain, M.K.; Strezov, V.; Chan, K.Y.; Ziolkowski, A.; Nelson, P.F. Influence of pyrolysis temperature on production and nutrient properties of wastewater sludge biochar. J. Environ. Manag. 2011, 92, 223–228. [Google Scholar] [CrossRef] [PubMed]
  56. La Cour Jansen, J.; Arvin, E.; Henze, M.; Harremoës, P. Wastewater Treatment—Biological and Chemical Processes, 4th ed.; Polyteknisk Forlag: Copenhagen, Denmark, 2019. [Google Scholar]
  57. Wei, D.; Ngo, H.H.; Guo, W.; Xu, W.; Du, B.; Khan, M.S.; Wei, Q. Biosorption performance evaluation of heavy metal onto aerobic granular sludge-derived biochar in the presence of effluent organic matter via batch and fluorescence approaches. Bioresour. Technol. 2018, 249, 410–416. [Google Scholar] [CrossRef] [PubMed] [Green Version]
Figure 1. Isotherm experiment results for sludge-derived biochar (SDBC), wood-derived biochar (WDBC), and activated carbon (AC). The experiments were performed at an initial pH of 2, a sorbent dose of 5 g/L, a sorbent size interval of <0.125 mm, and a contact time of 24 h. (a) Removal of Pb2+ at different initial concentrations and (b) isotherm for Pb2+ sorption.
Processes 08 01559 g001
Figure 2. Effect of sorbent dose. (a) Removal and sorption capacity of Pb2+ at various doses ( m / V ) of sludge-derived biochar. Experiment performed at an initial Pb2+ concentration of 5 mg/L, an initial pH of 2, a sorbent size interval of <0.125 mm, and a contact time of 24 h. (b) Final pH for the dose experiment.
Processes 08 01559 g002
Figure 3. Removal of Pb2+ for different particle size intervals and different doses ( m / V ) of sludge-derived biochar. The experiment was performed at an initial Pb2+ concentration of 5 mg/L, an initial pH of 2, and a contact time of 24 h.
Processes 08 01559 g003
Figure 4. Kinetics of Pb2+ sorption to sludge-derived biochar. The experiment was performed at an initial Pb2+ concentration of 5 mg/L, an initial pH of 2, a sorbent dose of 5 g/L, and a sorbent size interval of <0.125 mm. Sorption equilibrium ( q e ≃ 0.5 mg/g) is indicated by the dotted line.
Processes 08 01559 g004
Figure 5. Metal removal at various final pH levels. Final concentration in relation to initial concentration ( C t / C 0 ) of (a) Pb2+, (b) Ni2+, (c) Cd2+, (d) Cr3+, (e) Cu2+, and (f) Zn2+ in solutions containing individual metals and sludge-derived biochar. In the legend, all metals are denoted by Me. The experiments were performed at an initial metal concentration of 5 mg/L, a sorbent dose of 5 g/L, a sorbent size interval of <0.125 mm, and a contact time of 24 h. No standard deviations are given for Cd, Cr, Cu, or Zn because there were only two replicates. The solid and dashed blue lines represent the fraction of dissolved metals and the metal hydroxides as a function of pH and were calculated using Visual MINTEQ 3.1. The grey areas, dotted black lines, and dashed black lines represent the pH from which the precipitation of metal hydroxides/oxides may occur (solubility index >0) at metal concentrations of 5, 0.1, and 0.005 mg/L, respectively. (Metal species that constituted a fraction less than 2% were excluded from the diagrams.)
Processes 08 01559 g005
Figure 6. Isotherm models for Pb2+ sorption to sludge-derived biochar: (a) Modeling based on equilibrium concentrations of >1 mg/L and (b) modeling based on the whole concentration range ( q i = 1.37 × 10⁻² mg/g). In (a), the Freundlich, Langmuir–Freundlich, and Redlich–Peterson curves are overlapping.
Processes 08 01559 g006
Table 1. Typical influent heavy metal concentrations in influent municipal wastewater compared to the limit values for sludge reuse and environmental quality standards (EQS) for recipients.
MetalTypical Influent Concentrations (μg/L) (Number of Plants)EQSRatio of Maximum Influent Concentration to Allowable Concentration in RecipientsLimiting Values a (mg/kg d.w.)Ratio of Maximum Theoretical Concentration b to Allowable Concentration in Sludge
As2.7–12 (15)--20–150 c2.4
Cd0.4–75 (18)0.08–0.25937.52–10150.8
Cr8–100 (17)--70–10005.7
Cu10–100 (18)--70–10005.7
Pb2–100 (18)1.2–1.383.345–9008.9
Hg0.7–3.6 (6)0.07 d51.42–107.2
Ni3–100 (17)4–8.625.025–20016.1
Zn100–1600 (17)--200–300032.2
Reference[7][5] [7]
a These apply in countries that have set more strict regulations compared to the central regulation within the EU, e.g., Austria, Belgium, Finland, and France (d.w., dry weight). b The maximum theoretical concentration was calculated by dividing the maximum influent concentrations encountered (μg/L) by the typical sludge production during municipal wastewater treatment (~0.25 kg TS/m3, [8]). c Limit values for As only apply in Austria (20 mg/kg d.w.) and Belgium (150 mg/kg d.w.). d The value for Hg is the maximum allowable concentration, while the other EQS values given are annual average values.
Table 2. Description of the sorbents: Sludge-derived biochar (SDBC), wood-derived biochar (WDBC), and activated carbon (AC).
SorbentFeedstockOriginPyrolysis TemperatureDuration of PyrolysisContinuous/Batch PyrolysisOther Treatment
SDBCMunicipal sewage sludgeLinz WWTP, Linz, Germany a550–600 °C16–30 min bContinuous-
WDBCWood cVindelkol AB, Vindeln, Sweden~500 °C8–14 h d4 m3 batches-
AC eCoalCabot Norit Nederland BV, Amersfoort, The NetherlandsInformation not availableSteam-activated
a They use a pyrolysis plant from the company PYREG GmbH (Dörth, Germany) (WWTP, municipal wastewater treatment plant.). The ash content of sludge used for the production of SDBC was 50% of dry matter (DM) and the phosphorus content was approximately 10% of DM (D. Stirba, personal communication, 12 July 2017) b Depending on the moisture content of the substrate. c Substrates vary from time to time and could include pine, birch, alder tree, and/or aspen (P. Almersson, personal communication, 2 May 2017). d Depending on the size of wood logs and their energy density (P. Almersson, personal communication, 2 May 2017). e Product name: NORIT GAC 1240.
Table 3. Specification of experimental conditions for the different parameters that were evaluated: Isotherms, dose, size interval, kinetics, and pH. The metal salts, acid, and base used for preparation of samples were of analytical grade.
Parameter EvaluatedProcedure (Batch a/Bulk b Sample)Sample Volume (mL)Initial Metal Conc., C0 (mg/L)Sorbent Dose (g/L)Particle Size (mm)Contact TimeMetalInitial pH cNumber of Replicates d
Sorption isothermBatch500.005–150 e5<0.12524 hPb2+23
Sorbent doseBatch25050.1–10.0<0.12524 hPb2+23
Sorbent size intervalBatch5055<0.125 and 1.00–2.0024 hPb2+23
Sorption kineticsBulk100055<0.1251 min to 72 hPb2+23
pHBatch5055<0.12524 hPb2+, Ni2+2/4/83
Cd2+, Cr3+, Cu2+, Zn2+2/4/62
a Batch samples were shaken at 180 rpm using a reciprocating shaker. b Bulk samples were continuously stirred using a magnetic stirrer, and samples for analysis were retrieved with a pipette after a designated number of minutes/hours. c Initial pH of the aqueous metal solution before the addition of sorbent. d Blank metal solutions of known concentrations (with no sorbent added) were prepared in duplicate. e Up to 125 mg/L for WDBC and AC; while the maximum initial Pb2+ concentration for SDBC experiment was 150 mg/L (to increase the amount of data with respect to the determination of the sorption isotherm).
Table 4. Properties of the following sorbents: Sludge-derived biochar (SDBC), wood-derived biochar (WDBC), and activated carbon (AC) (triplicate samples, with the exception of granular SDBC (1–2 mm), for which one replicate was analyzed).
SampleSurface Area (m2/g)Pore Volume (cm3/g) aAverage Pore Size (nm)Fraction of Micro-/Meso-/Macropores (%) b
SDBC, <0.125 mm12.7 ± 0.70.032 ± 0.00110.2 ± 0.210 ± 1/71 ± 1/19 ± 1
SDBC, 1–2 mm8.880.02712.26.6/69/25
SDBC, <0.125 mm, after kinetic experiment19.9 ± 1.20.039 ± 0.0015.88 ± 3.2216 ± 2/66 ± 1/18 ± 3
WDBC, <0.125 mm75.7 ± 23.50.042 ± 0.0112.23 ± 0.1575 ± 5/25 ± 5/<1
AC, <0.125 mm1010 ± 200.55 ± 0.022.18 ± 0.0176 ± <1/23 ± <1/<1
a For pore widths 1.5–300 nm. b Micropores <2 nm, mesopores 2–50 nm, and macropores >50 nm.
Table 5. Concentrations and release of metals, moisture content (M), volatile matter content (VM), and carbon/hydrogen/nitrogen content (C/H/N) of the following sorbents: Sludge-derived biochar (SDBC), wood-derived biochar (WDBC), and activated carbon (AC). The release of metals was investigated at a pH of 2, a sorbent dose of 5 g/L, and a contact time of 24 h (“-” indicates that no analysis was made) (one replicate was analyzed with respect to metals in biochar, pH, moisture content, and volatile matter content; the standard deviation is typically small [24]).
Metals in Biochar (mg/kg)pHM (%)VM (%) aC/H/N (%) a
PbNiCdCrCuZnHg
SDBC99.361.41.2184.35692170<0.056.62.53224.1 ± 0.1/0.94 ± 0.02/2.79 ± <0.01
WDBC0.8540.430<0.030.31416.037.4<0.055.62.99986.6 ± 0.1/2.98 ± 0.01/0.15 ± <0.01
AC0.29519.4<0.0319.725.52.25<0.056.55.49289.2 ± 2.0/0.47 ± <0.01/0.49 ± 0.02
Metals released (mg/L) (and mg/kg in parenthesis)
PbNiCdCrCuZn
SDBC0.0062 ± 0.0003 (1.2)0.013 ± 0010 (2.6)0.0027 ± 0.0001 (0.54)0.0031 ± 0.0001 (0.62)0.31 ± 0.01 (62)3.7 ± 0.1 (740)
WDBC0.0051 ± 0.0021 (1.0)0.00077 ± 0.00016 (0.15)----
AC0.00017 ± 0.00012 (0.034)0.016 ± 0.001 (3.2)----
a On a dry mass basis.
Table 6. Parameter values for the different isotherm models after fitting to the experimental data (Pb2+ sorption to sludge-derived biochar). R2 is the coefficient of determination.
Isotherm Model/Parameter NameParameter Value and Standard Error for Equilibrium Concentrations >1 mg/LR2Parameter Value and Standard Error for the Whole Concentration RangeR2
Langmuir 0.86 0.91
Q m a x 1.8 ± 0.2 0.95 ± 0.20
K L 0.23 ± 0.06 1.8 ± 0.4
Freundlich 0.98 0.77
K F 0.45 ± 0.03 0.20 ± 0.03
n 0.32 ± 0.02 0.55 ± 0.03
Langmuir–Freundlich 0.98 0.92
Q L F 137 ± 8053 1.6 ± 0.4
n L F 0.32 ± 0.16 0.82 ± 0.07
A L F 0.0033 ± 0.2006 0.47 ± 0.26
Temkin 0.94 0.67
b 7.3 ± 0.8 140 ± 30
K T 3.0 ± 0.8 280 ± 60
Redlich–Peterson 0.98 0.97
K R P 6.6 × 10^8 ± <0.1 × 10^8 1.9 ± 0.1
a R P 1.5 × 10^9 ± <0.1 × 10^9 3.1 ± 0.8
g 0.68 ± 0.01 0.75 ± 0.06
Publisher’s Note: MDPI stays neutral with regard to jurisdictional claims in published maps and institutional affiliations.