Article

Theoretical Evaluation of the Melting Efficiency for the Single-Screw Micro-Extrusion Process: The Case of 3D Printing of ABS

1
Centre for Polymer and Material Technologies (CPMT), Department of Materials, Textiles and Chemical Engineering, Ghent University, Technologiepark 130, 9052 Zwijnaarde (Ghent), Belgium
2
Centre for Textiles Science and Engineering (CTSE), Ghent University, Technologiepark 70A, 9052 Zwijnaarde (Ghent), Belgium
3
Laboratory for Chemical Technology (LCT), Department of Materials, Textiles and Chemical Engineering, Ghent University, Technologiepark 125, 9052 Zwijnaarde (Ghent), Belgium
*
Author to whom correspondence should be addressed.
Processes 2020, 8(11), 1522; https://doi.org/10.3390/pr8111522
Submission received: 29 October 2020 / Revised: 16 November 2020 / Accepted: 19 November 2020 / Published: 23 November 2020
(This article belongs to the Special Issue Tailoring Polymeric Materials for Specific Applications)

Abstract

:
One of the challenges for single-screw micro-extrusion or additive manufacturing (AM), thus 3D printing, of polymers is controlling the melting efficiency so that energy and equipment costs can be minimized. Here, a numerical model is presented for AM process design, selecting acrylonitrile–butadiene–styrene (ABS) as viscoelastic reference polymer. It is demonstrated that AM melting is different compared to conventional melting due to variation in extrusion dimensions, leading to a different balance in heating by conduction and viscous heat dissipation as caused by the shearing between the melt layers in the associated film layer near the barrel. The thickness of this melt film layer is variable along the screw length, and it is shown that simplified models assuming an overall average value are too approximate. It is highlighted that the screw frequency, pitch angle and compression ratio are important process parameters to control the point of melt finalization. In addition, the power-law index reflecting the shear thinning nature of the polymer melt is showcased as a key parameter. Moreover, AM process results assuming constant and temperature dependent specific heat capacities and thermal conductivities are compared. The current work opens the door for on-line AM process control, addressing all relevant operating and material parameters.

1. Introduction

The application of additive manufacturing (AM) for polymeric final products, which is popularly known as 3D printing or rapid prototyping, has increased significantly in the last years [1,2,3,4,5,6,7,8,9]. A frequently considered methodology for the manufacturing of polymer parts is extrusion-based AM (EAM) [2,10]. EAM depends on many parameters and several studies aimed at the facilitation of its industrial implementation [11,12,13,14]. The majority of EAM processes uses a polymer filament, which is forced through a heated nozzle promoting its melting, followed by the continuous deposition of the molten polymer substance as tracks to generate three-dimensional shapes [14]. Next to that, the use of single-screw extruders (SSEs) fed with pellet-shaped polymers is growing [15,16,17,18,19].
SSE-based AM allows the immediate employment of a wide variety of thermoplastic materials such as acrylonitrile butadiene styrene polymer (ABS), poly(lactic acid) PLA, polycarbonate (PC), polyamide (PA), thermoplastic polyurethane (TPU), and styrene–ethylene–butylene–styrene polymer (SEBS), reducing the cost of the feedstock materials [16,17,18,19,20,21]. It allows bypassing multiple manufacturing steps such as the filament extrusion before the AM process, relieving the material to one extrusion cycle and leading to less degradation. Its versatility and design simplicity make SSE one of the essential equipment tools for the bulk polymer processing industry [22,23,24,25,26]. Most SSEs are fed by a granular solid polymer, which is melted or plasticized in the screw channel. The extrusion process primarily consists of four elementary steps: handling of solid granules, melting, pumping, and mixing. Among these steps, understanding the melting is crucial for optimum SSE design and operation [23,24,25,26,27,28,29]. An excessively high melting rate and too long residence times can lead to substantial polymer degradation, while a too low melting rate can allow solid particles to reach the end of the metering zone affecting the extrusion rate stability.
Even though SSEs are regularly used in the polymer industry, a direct transition to EAM is not straightforward. Conventional extruders are much larger than the extruders used in AM so that downsizing is needed, and the term micro-extruder is more appropriate. As micro-extruders have different screw length (L) and diameter (D) values compared to traditional extruders (D ≥ 40 mm and L/D ≥ 18:1 for the latter and the opposite for the former) [30,31], a different optimum operating window can be expected to avoid both polymer degradation and solid slippage. The SSE melting process is also complicated, as it depends on many interconnected processing parameters. For example, the actual processing temperature depends not only on the screw and barrel temperature but also relies on shear dependent viscosity and stress, thermal conductivity, and heat capacity [23,24,32,33,34]. Specifically, shearing is a key parameter for a conventional SSE; it is claimed that ca. 80% of the total heat required for polymer melting is generated by this mechanism. The remaining heat is externally supplied through thermal resistances installed around the extruder barrel, thus conduction [35]. Upon reducing the SSE size, a higher heat transfer area-to-volume ratio is manifested compared to larger machines. Better heat transfer characteristics are thus reported for micro-extruders [35,36], further highlighting the differences in optimal processing conditions. A deep understanding of the effect of the machine size on the melt performance specifically in the range of the smaller sizes—as relevant for SSE-based EAM—is however still lacking.
In the present work, a numerical model based on previous studies regarding the melting mechanism in SSEs [24,33,34,35,36,37,38,39,40,41,42,43,44,45] is therefore presented to evaluate the melt evolution of a reference polymer ABS along the screw length for an AM pellet-based micro-extruder, also comparing the results with conventional extrusion. The developed model can be easily integrated into a real-time controller to actively tune the positions where the complete melting of the pellets should happen during a micro-extrusion AM process, as algebraically based mathematical relations are established between processing/material parameters and the melting efficiency. Two main user options are the rotational speed (or frequency) of the micro-extruder screw and the heating profile for the barrel to ensure that the polymer can be extruded at the desired exit viscosity. Focus is also on other processing characteristics such as the volumetric feeding ratio, the compression ratio, the channel width, and the pitch angle, as well as the effect of a variation of material characteristics such as the density, heat capacity, and shear-thinning power-law index. A differentiation is made between simulation results with constant and variable physicochemical parameters.

2. Modeling Details

2.1. Earlier Model Developments and Current Modeling Strategy

Maddock [46] was the first who investigated the melting mechanism of thermoplastic polymers in a conventional SSE, performing screw-freeze experiments. He observed that the solid and melt phases coexist along most of the extruder length. The melt first appears as a film between the hot barrel and the compacted solid pellets. This molten film is continuously displaced due to screw rotation, creating a pool of molten polymer between a screw flight and the solid bed. As the polymer chains are pushed more forward, the molten pool increases, and the remaining solid bed continuously deforms and reduces in size until the liquid state goes from one screw flank to the other. This mechanism has been confirmed for a wide variety of polymers, although some exceptions have been observed for poly(vinyl chloride) (PVC), polypropylene (PP), and low-density polyethylene (LDPE) [23,24,46].
Based on Maddock’s pioneering study, in 1966, Tadmor [42] proposed the first mathematical model for polymer melting in SSEs, considering for simplicity a Newtonian fluid and a constant molten film thickness. He derived a heat and mass balance for the melt film between the solid bed and the barrel to obtain an equation for the so-called solid bed profile (SBP) that describes the variation in the width of the solid bed along the extruder channel, which can be seen as the macro-scale. Several decades later, in 2006, Tadmor and Gogos [28] upgraded this Newtonian melting model by including the effect of a variable molten film thickness as well as the influence of temperature and shear rate on the height-dependent local or micro-scale viscosity. This model is based on a steady state implying a given mass throughput (solid and molten) and a melt velocity variation normalized with respect to the melt film thickness, which is on its own varying in size. The melting is assumed to take place only at the barrel surface through a drag-induced melt removal mechanism with the solid bed assumed to be homogeneous, continuous, and deformable except at the flight.
In addition, other modifications of the original Tadmor model have been put forward. Interestingly, Altınkaynak [24] examined in 2011 the modifications by several authors [32,37,38,39,40,41,42,43,44,45,47,48] and deduced that the Tadmor-type melting models are highly convenient in qualitatively explaining the melting in large scale SSEs, although it is impossible to assume a single melting mechanism to be valid for all extruder and polymer combinations. These authors recommended that ideally polymer melting processes in SSEs are simulated by integrating the conservation equations for mass, momentum, and energy, considering an advanced constitutive equation for the polymer investigated instead of assuming a predefined melting mechanism in combination with a simplified rheological description. Such detailed approaches are computationally very demanding, explaining why only a limited number of literature reports are available on such dedicated numerical implementations. For example, one has the study conducted by Syrjala [49] (2000) but it should be mentioned that this author assumed a constant velocity for the solid bed. Noteworthy are also the studies presented by Rauwendaal [33,34], who developed a numerical approach with a dispersive melting mechanism that takes into account the non-Newtonian characteristics of the fluid and a varying melt thickness.
A natural question that arises is whether the more accessible Tadmor (and Gogos)-based modeling strategy can be directly applied for AM micro-extruders, thus SSEs with a much smaller size. For AM melting, some substantial differences can be noted compared to conventional larger extruders, as already highlighted in the Introduction. The rotational speeds in micro-extrusion can be substantially lower and less heat is generated due to shear rate differences, while better heat transfer characteristics are established due to the higher heat transfer area-to-volume ratio [35,36]. This leads to lower values for the so-called Brinkman number (Br), which is a dimensionless number commonly used in polymer processing, indicating the ratio between the viscous heating to the (molecular) conduction heating [49,50,51,52,53]. In SSE, the heat transported by molecular conduction is supplied by external heaters to the wall of the extruder and then to the fluid, while the viscous heat is generated by the shearing caused by flowing elements moving at different velocities, and it is triggered by the engine turning the screw.
In the present section, the Tadmor and Gogos’ model for large-scale SSE is transferred toward micro-extruder application. First, the governing equations are described in a general position in the (micro-)extruder to then make the concrete link to the full equipment. For the derivation, an unwound screw is considered with the x and z directions defined based on the actual screw dimensions, as shown in Figure 1. Here, the barrel (or liquid layer at the barrel) is formally translated as moving with the velocity Vb.

2.1.1. General Principles

It is essential to evaluate in a first step (Step 1) the melting rate per unit of channel width W, i.e., q. Upon assuming in a first instance a constant viscosity of the fluid (simplified Newtonian fluid case), constant physicochemical properties, sufficiently large cohesive forces for the solid bed, and a given barrel temperature Tb, q can be expressed as a function of the channel coordinate z based on earlier work by Tadmor [23,42] as:
q = X   ρ m   | V b x | λ + c s   T m T 0 + c m   Θ   T b T m T b T m k 1 + Br 2 = ϕ X z
in which X is the width of the solid bed (initially W; see Figure 2), ρ m is the density of the molten phase, V b x is the velocity of the molten phase at the barrel in the x direction as defined in Figure 1 (absolute value to avoid sign confusion), λ is the heat of fusion, c m is the specific heat capacity of the molten phase, c s is the specific heat capacity of the solid phase, Θ is the average temperature of the melt (e.g., Θ = 2 3 + Br 12 [24], T m is the melting temperature, and k is the thermal conductivity. The symbol Φ is a melting efficiency used to enable a short notation but contains all extrusion settings and material parameters, and it is generally not a constant.
In Equation (1), V b x is related to the screw frequency (N), the inside diameter of the extruder barrel D b , and the helix pitch angle of the screw θ :
V b x = V b   s i n θ
V b = π   D b   N
For Newtonian fluids, Br in Equation (1) is evaluated according to:
Br = η 0   V j 2 k T b T m
in which η 0 is the zero-shear rate thus Newtonian viscosity of which the temperature dependence can be reflected by the so-called Williams–Landel–Ferry (WLF) equation [54] based on general fitting parameters ( D 1 , A 1 , A 2 , and T a ):
η 0 = D 1   e A 1   T T a A 2 + T T a
In Equation (4), V j is the velocity difference between the solid bed (in the z direction) and the melt layer at the barrel surface:
V j = V b 2 + V s z 2 2 V b V s z c o s θ
This z-direction velocity of the solid phase ( V s z ) can be calculated based on the volumetric flow rate Q as defined with the starting channel dimensions denoting H 0 as the initial channel height:
V s z = Q W   H 0
For non-Newtonian fluids, as covered in the present work, one needs a more complex set of expressions to calculate Br in Equation (1). Considering a basic Cross-like rheological model [55], one can use:
Br = η   V j n + 1 δ ¯ n 1   k T b T m
η = η 0 ^ 1 + η 0   γ ˙ τ * 1 n
η 0 ^ = η 0 ( 1 + η 0   γ c r ˙ τ * 1 n )
in which n is the pseudo-plasticity or power-law index; η is the shear rate dependent melt viscosity; η 0 ^ is a short notation to retrieve the Newtonian, limit thus before the critical shear rate γ c r ˙ ; τ * is the critical Cross model stress at the transition to shear thinning; δ ¯ is the average thickness of the molten layer (formally up to z); and the shear rate γ ˙ (for the molten film layer) at z is evaluated as:
γ ˙ = V j δ z
in which δ z is the (over the melt width averaged) thickness at z, which can be assessed at z = 0 in the absence of heat dissipation [23]:
δ 0 = 4   W   k T b T m λ ρ m   V b x
This value can also be used for an initial guess of δ ¯ with further corrections (thus, at larger z) for δ z based on [23,42]:
δ = 2   X λ   ρ m   V b x   2   k T b T m + η   V j n δ ¯ n 1
in which λ is given by:
λ = λ + c m   Θ   T b T m
λ = λ + c s   T m T 0
with T 0 the initial temperature of the pellets.
In a second step (Step 2), Equation (1) can be applied in a differential way along the z direction to complete the mass balance for the solid phase and to focus on specific settings, also including for instance variations in physicochemical parameters:
ρ s v s z H Δ X z + d z ρ s v s z H Δ X z = q X z d z = Φ X   d z
in which ρ s is the density of the solid phase and Δ is the gap height between barrel and screw. In the limit for Δz → 0 and ignoring Δ, it follows that:
d H X d z = Φ X ρ s v s z
so that with piecewise integration it is possible to calculate SBP while updating H and Φ if found appropriate, thus accounting for any significant change in flow behavior and temperature gradients.

2.1.2. Implementation for a Micro-Extruder with ABS Polymer

The piecewise concept, as discussed in the previous subsection, was encoded in a MATLAB® environment, assuming Δz intervals of 0.0001 m. Unless stated otherwise, a two-dimensional (2D) steady isothermal flow was simulated for an EAM compression and metering section with a respective helical length of 274 and 108 mm, assuming a perfect inlet, thus feeding section. These extruder dimensions are based on a micro-extruder with a conical screw in which the size of the diameter and pitch angle are not constant along its sections. The extruder is designed to be suitable for 3D printing applications with specific emphasis on a stable and reliable operability.
The design of the micro-extruder screw is presented in Figure 2 with the main extruder dimensions and reference operating conditions listed in Table 1 (Column 2, top part), also including related parameters for conventional extruders (Column 3 and 4). Here, a conventional case with similar parameters and conventional parameters is considered. In Figure 2, the concept of melt formation by drag is also illustrated on the right-hand side, consistent with the original work of Maddock [46].
The polymer material is ABS polymer manufactured by The Dow Chemical Company with its main characteristics listed at the bottom of Table 1 [24]. For illustration purposes, in most sensitivity analyses, constant physicochemical properties are considered, consistent with a major part of the derivation above. The ABS shear viscosity dependence at reference temperature (473 K) is depicted in Figure S3.

3. Results

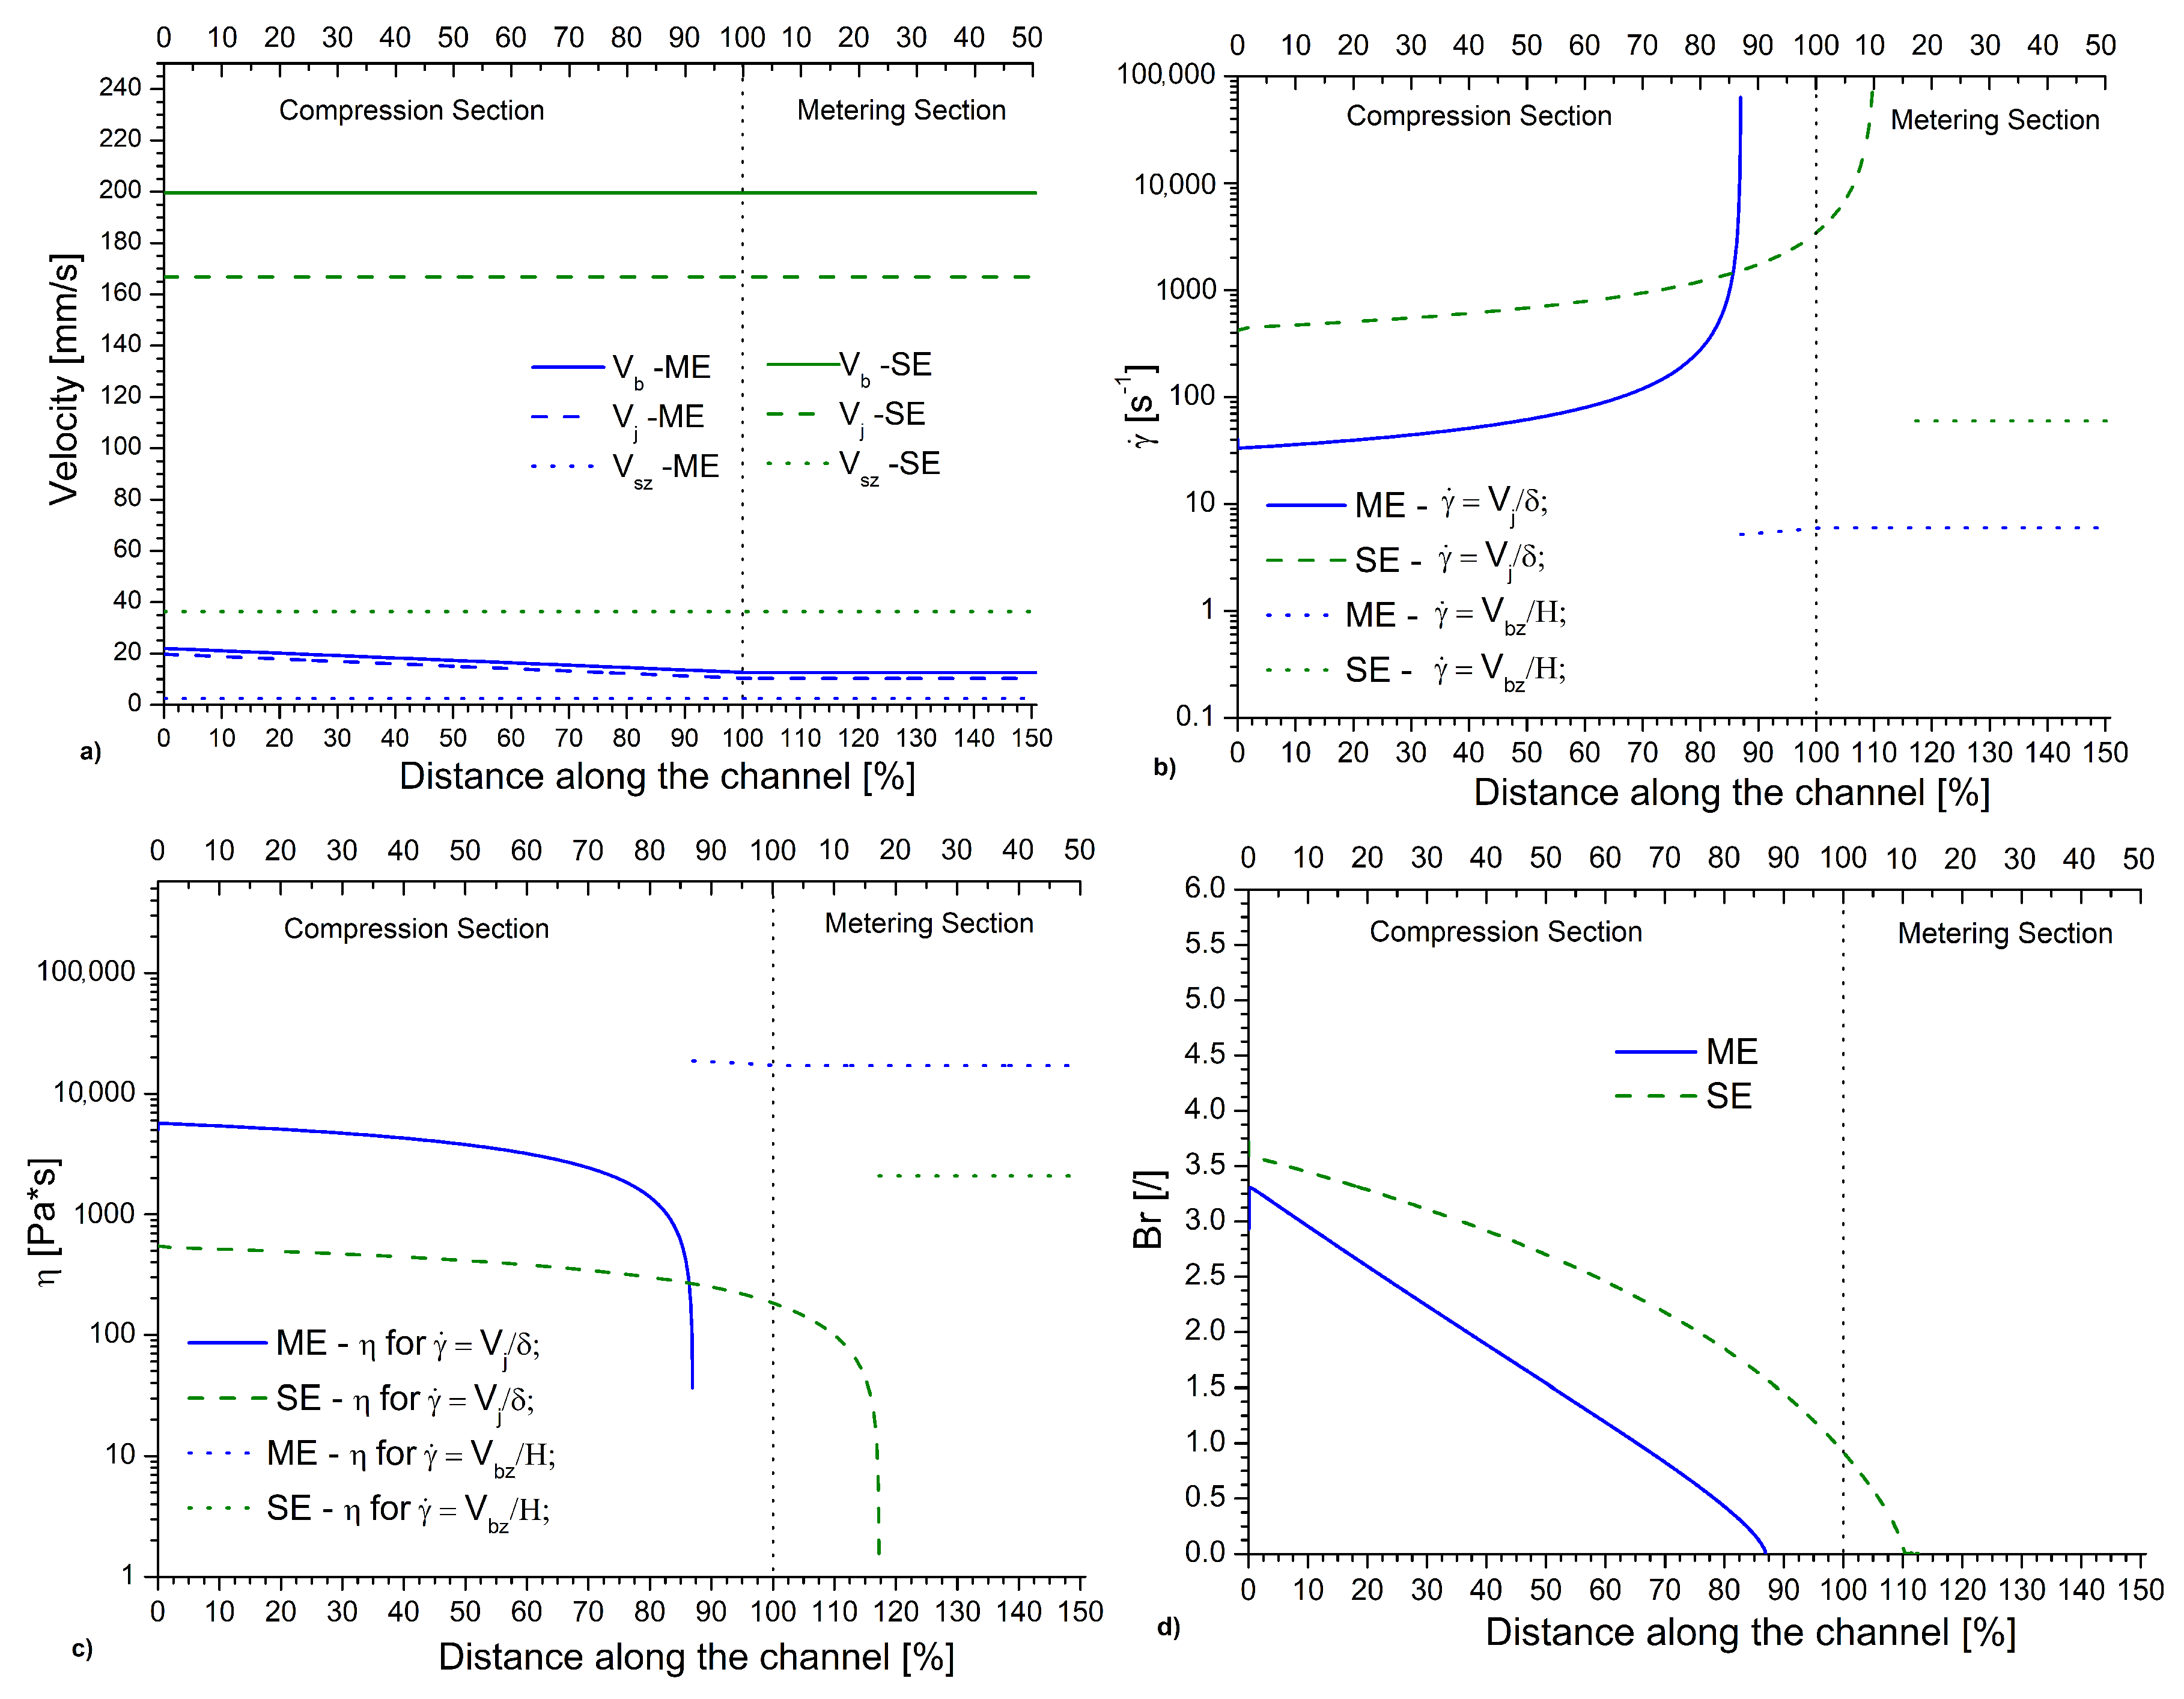
3.1. Melting Efficiency for Micro- vs. Conventional Extruder

In the present section, first, a comparison between the (melting) performance of the two standard extruders (short notation SE) and the micro-extruder (short notation ME) in Table 1 is conducted, considering normalized distances. The discussion is continued by evaluating the practicality of film thickness approximations in the AM melting model. Subsequently, for the micro-extruder case, emphasis is on the effects of the operating conditions and ABS material properties on the heating mechanism and SBP. The main focus is on the variations in the melting film layer in the compression section but for completeness results are also depicted for the metering section dealing with the whole channel height formally considering the drag velocity. The latter velocity is also considered in the metering section as soon as melting is completed.
In Figure 3, for the same screw speed and barrel temperature, the main compression and metering section variations for the micro-extruder (Table 1, Column 2, blue full line) and the standard extruder (Table 1, Column 3, red dashed line) are compared. The conventional extruder presents a bigger barrel diameter that leads to higher velocities ( V b , V j , and V s z ; Equations (3), (6) and (7)), as visible by the red lines in Figure 3a. Specifically, the higher relative velocities are leading to stronger viscous heating dissipations during the melting stage, leading to larger Br numbers (red dashed line in Figure 3d), at least if the shear thinning effect is not dominant. As illustrated in Figure 3c, this is the case at the lower to intermediate z values (up to 60 mm) with a plateau-like behavior for the melt layer viscosity. However, at higher z values (>60 mm), the shear rates are much higher (Figure 3b) so that shear thinning becomes very strong and the Br number for the larger extruder becomes lower than for the micro-extrusion counterpart.
At one point in Figure 3d for both extruders, a Br value of one is reached and thermal conductivity is equally important as viscous heat dissipation. This transition is for both extruders at similar z positions, but for the standard extruder a smaller period of Br numbers lower than 1 is established afterwards, highlighting that overall Br is still higher for the conventional case. Once Br becomes closer to 0 in Figure 3d, Φ lowers towards its minimum value (Figure 4a), consistent with the solid bed width approaching 0 mm, as clear in Figure 4c.
Further model analysis, as covered in Figure 4b, shows that δ decreases with increasing z values, with a more pronounced decrease for the standard extruder consistent with the discussion of the melting efficiencies above. One can of course wonder if a simplified model with directly a constant δ ¯ is worthwhile. This is explored in Figure 5 for the micro-extruder considering the case of taking δ ¯ always equal to the initial value and of the whole time the average from the detailed model from before over the total z range that matters (cf. extra horizontal blue line in Figure 4b). It follows in Figure 5a that the final melting point incorrectly shifts 14.5% to a lower value if one always uses the initial δ value, whereas the use of the explicit average is more warranted (lower shift of 8.0%). The Br variations in Figure 5b are for both approximations, although completely different compared to the detailed solution, putting forward that from a more fundamental point of view the detailed description is preferred. Assuming δ(z) = δ0, a better approximation of the heating mechanism is obtained at the beginning of the compression section but later on strong deviations result. The use of the explicit average leads to a similar shape as the δ(z) = δ0 model so that neither of the two approximations can provide a dedicated reflection of the detailed Br plot.
Figure 6 updates Figure 3 if more realistic settings are considered for the standard extruder (Table 1, Column 4, green dashed line). This implies a higher screw speed and barrel temperature for the standard extruder so that even higher velocities are observed for the standard extrusion, as depicted by the green dashed lines in Figure 6a repeating the full blue lines of the ME case from before. As expected, this increase in velocities leads to higher initial shear rates (Figure 6b) and also due to the higher barrel temperature much lower initial viscosities (Figure 6c). Consequently, the initial gap in Br number for the micro- and conventional extruder (Figure 6d) is less pronounced. The Br numbers are still the highest for the standard extruder, but the melting is now less efficient. A closer inspection reveals that the melting is 10% too slow, as part of the conventional melting still takes place in the metering section, which is not the case for micro-extrusion. In other words, Figure 6 shows that the lower viscosity values for the standard extruder limits the (initial) Br increase, counteracting the effect of higher V j values. In addition, the critical switch point defined at Br equal to 1 is pushed further away. Notably, the observed values of the conventional Br number, at the beginning of the compression section, are consistent with the reported balance between shear heat and conduction heat in previous work [35].
For completeness, in Figure S1, the updated plots of the melting efficiency parameter Φ , the melt film layer thickness δ , and the solid bed profile are provided. It again follows that these plots agree with the trends described for the main characteristics (in this case, Figure 6). On an overall basis, it is thus clear that for AM applications a different ideal operating window is expected, as explained in the following sections each time addressing one processing or material variable.

3.2. Effect of Barrel Temperature

To evaluate the effect of the barrel temperature on the micro-extrusion melting profile and the associated Br variation, both an increment and a decrement of the reference barrel temperature (473 K, Table 1) of 20 K were simulated, reminding that in this part of the sensitivity analysis physicochemical properties are still constant. Figure 7a shows that the increment in barrel temperature has a modest effect on SBP. It even leads to a slightly slower solid fraction reduction, slightly shifting the point of complete melting to higher values along the channel length z.
As indicated by the Br number plot in Figure 7b, the heating mechanism, on the other hand, changes considerably in the three cases, showing that the amount of heat supplied by the external heaters at the beginning of the compression section decreases from about 40% at 493 K to 10% at 453 K. These results are in qualitative agreement with a previous study on conventional extrusion [24], where an increment in the barrel temperature resulted in an increase in the complete melting point position. This was attributed to a decrease in the heat generated by shear since the polymer at higher temperatures presents lower Newtonian viscosity so that the heat generated by viscous dissipation decreases. The same conclusion thus follows for the micro-extrusion case. At first sight, the barrel temperature is thus less critical but from an energy point of view a lower barrel temperature is recommendable.

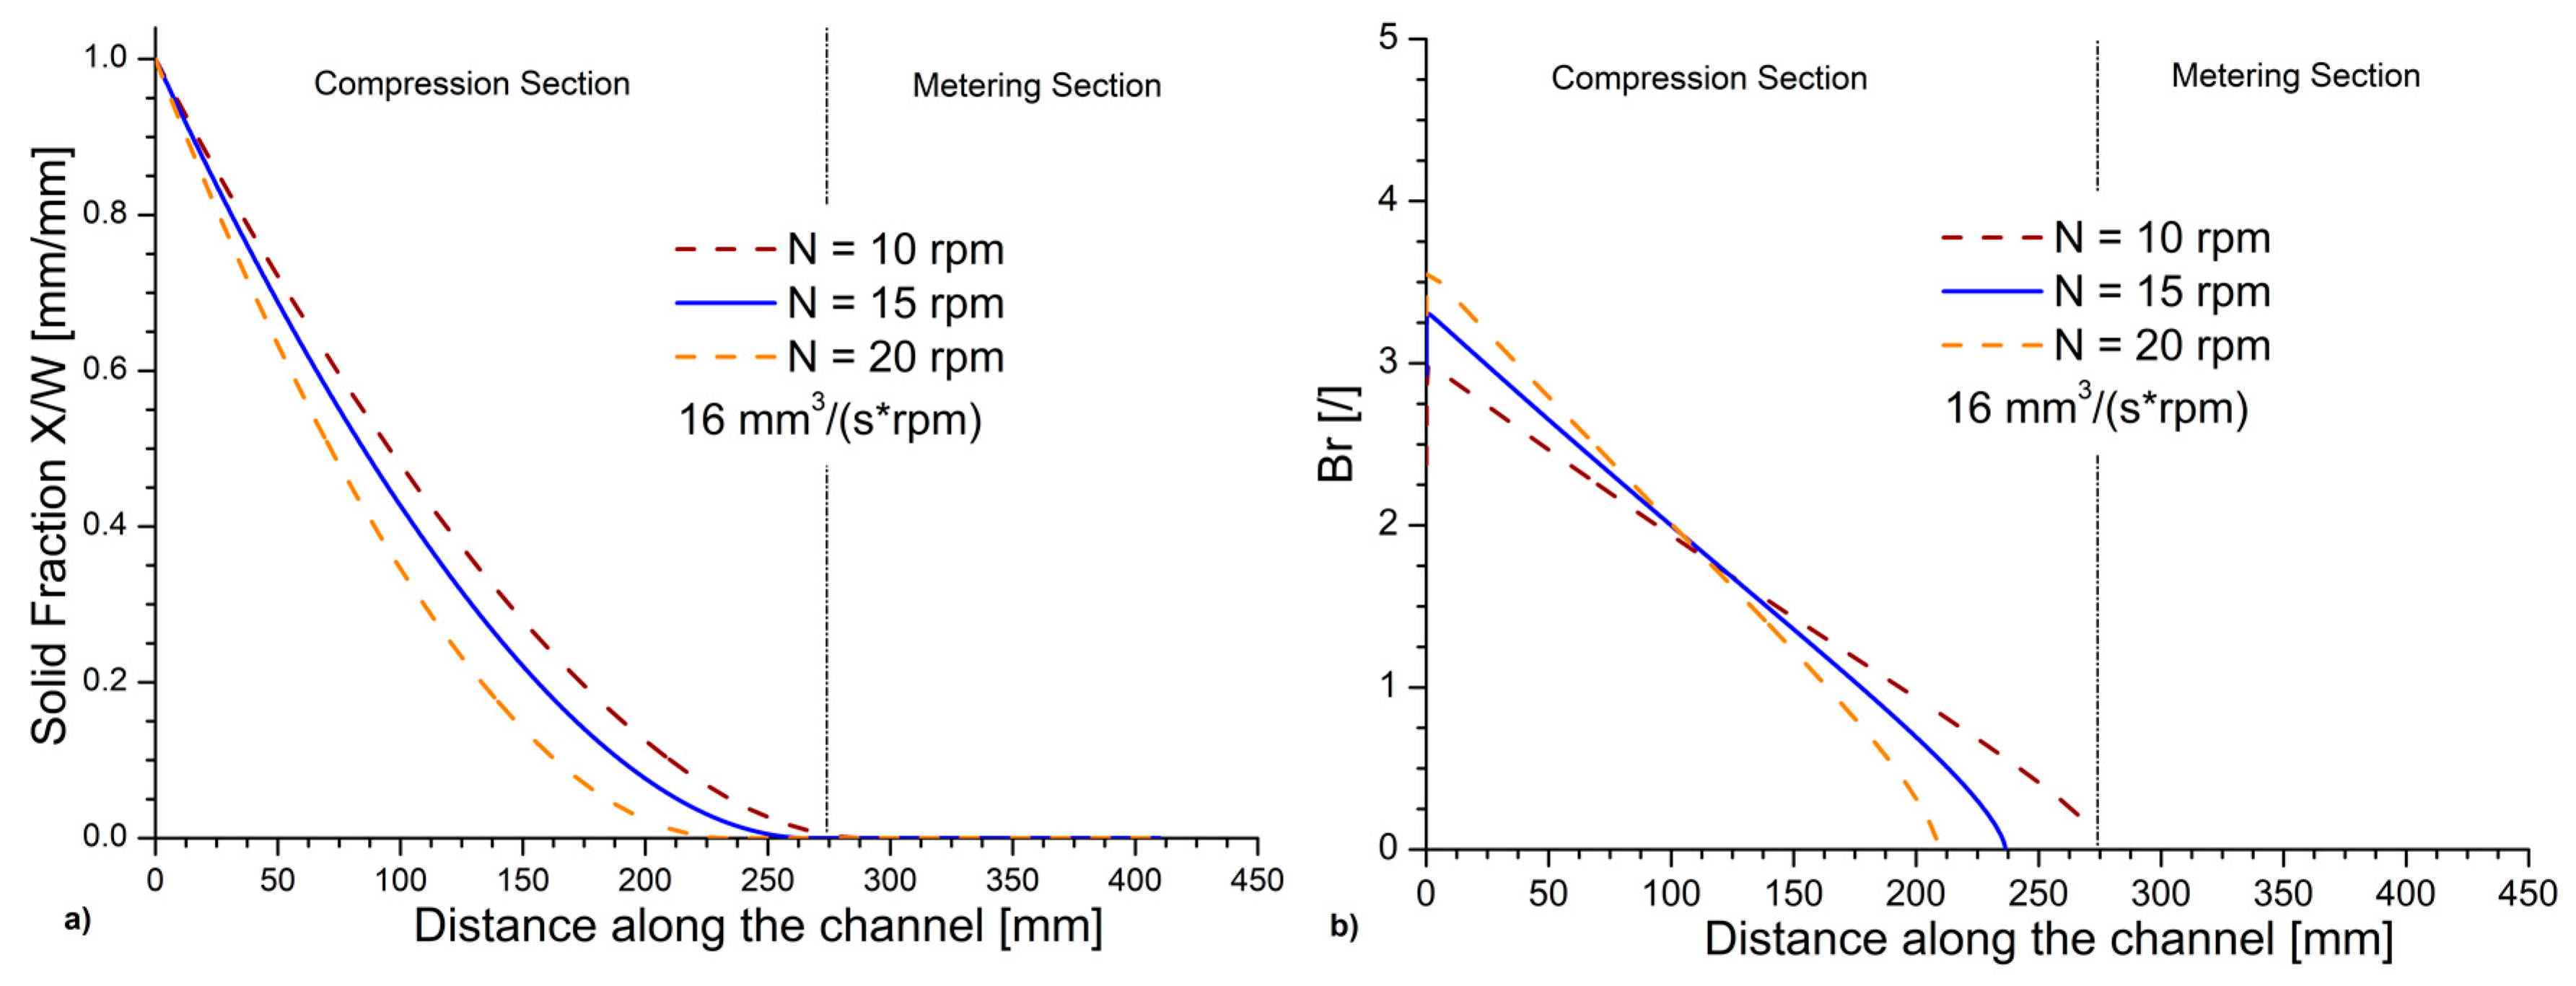
3.3. Effect of Screw Frequency under Flood Feeding

The effect of the rotational velocity of the screw thus the screw frequency on the melting profile and Br variation was evaluated by considering three screw frequencies, i.e., 10, 15, and 20 rpm, with the middle one the reference value in Table 1 (Column 2). The volumetric flow rate at the inlet was assumed to be directly proportional to the intrinsic screw velocity. This can be claimed as a constant amount of material is assumed to enter the extrusion screw with every rotation, which implies flood feeding (value of 16 mm3/(s rpm)).
Figure 8a shows that for increasing rotational velocities the point of complete melting moves to smaller distances along the channel. An analysis of the heating mechanism through the Br plot in Figure 8b shows that increasing the screw frequency leads to an increment of the share of heat generated by shear at lower z values with the critical point (value of 1) reached earlier or reversely closer to the final melting point. Hence, the screw frequency is an essential parameter to design the micro-extrusion melting behavior.
It should be stressed that previous SSE studies evaluating the melting profile as a function of the screw frequency observed the opposite behavior as the one detected in the present investigation [22,37,56]. However, these previous results were obtained considering larger extruders (barrel diameter > 38 mm) with lower heat transfer area-to-volume ratios, higher screw frequencies, and higher mass output in comparison with the current AM-based study.

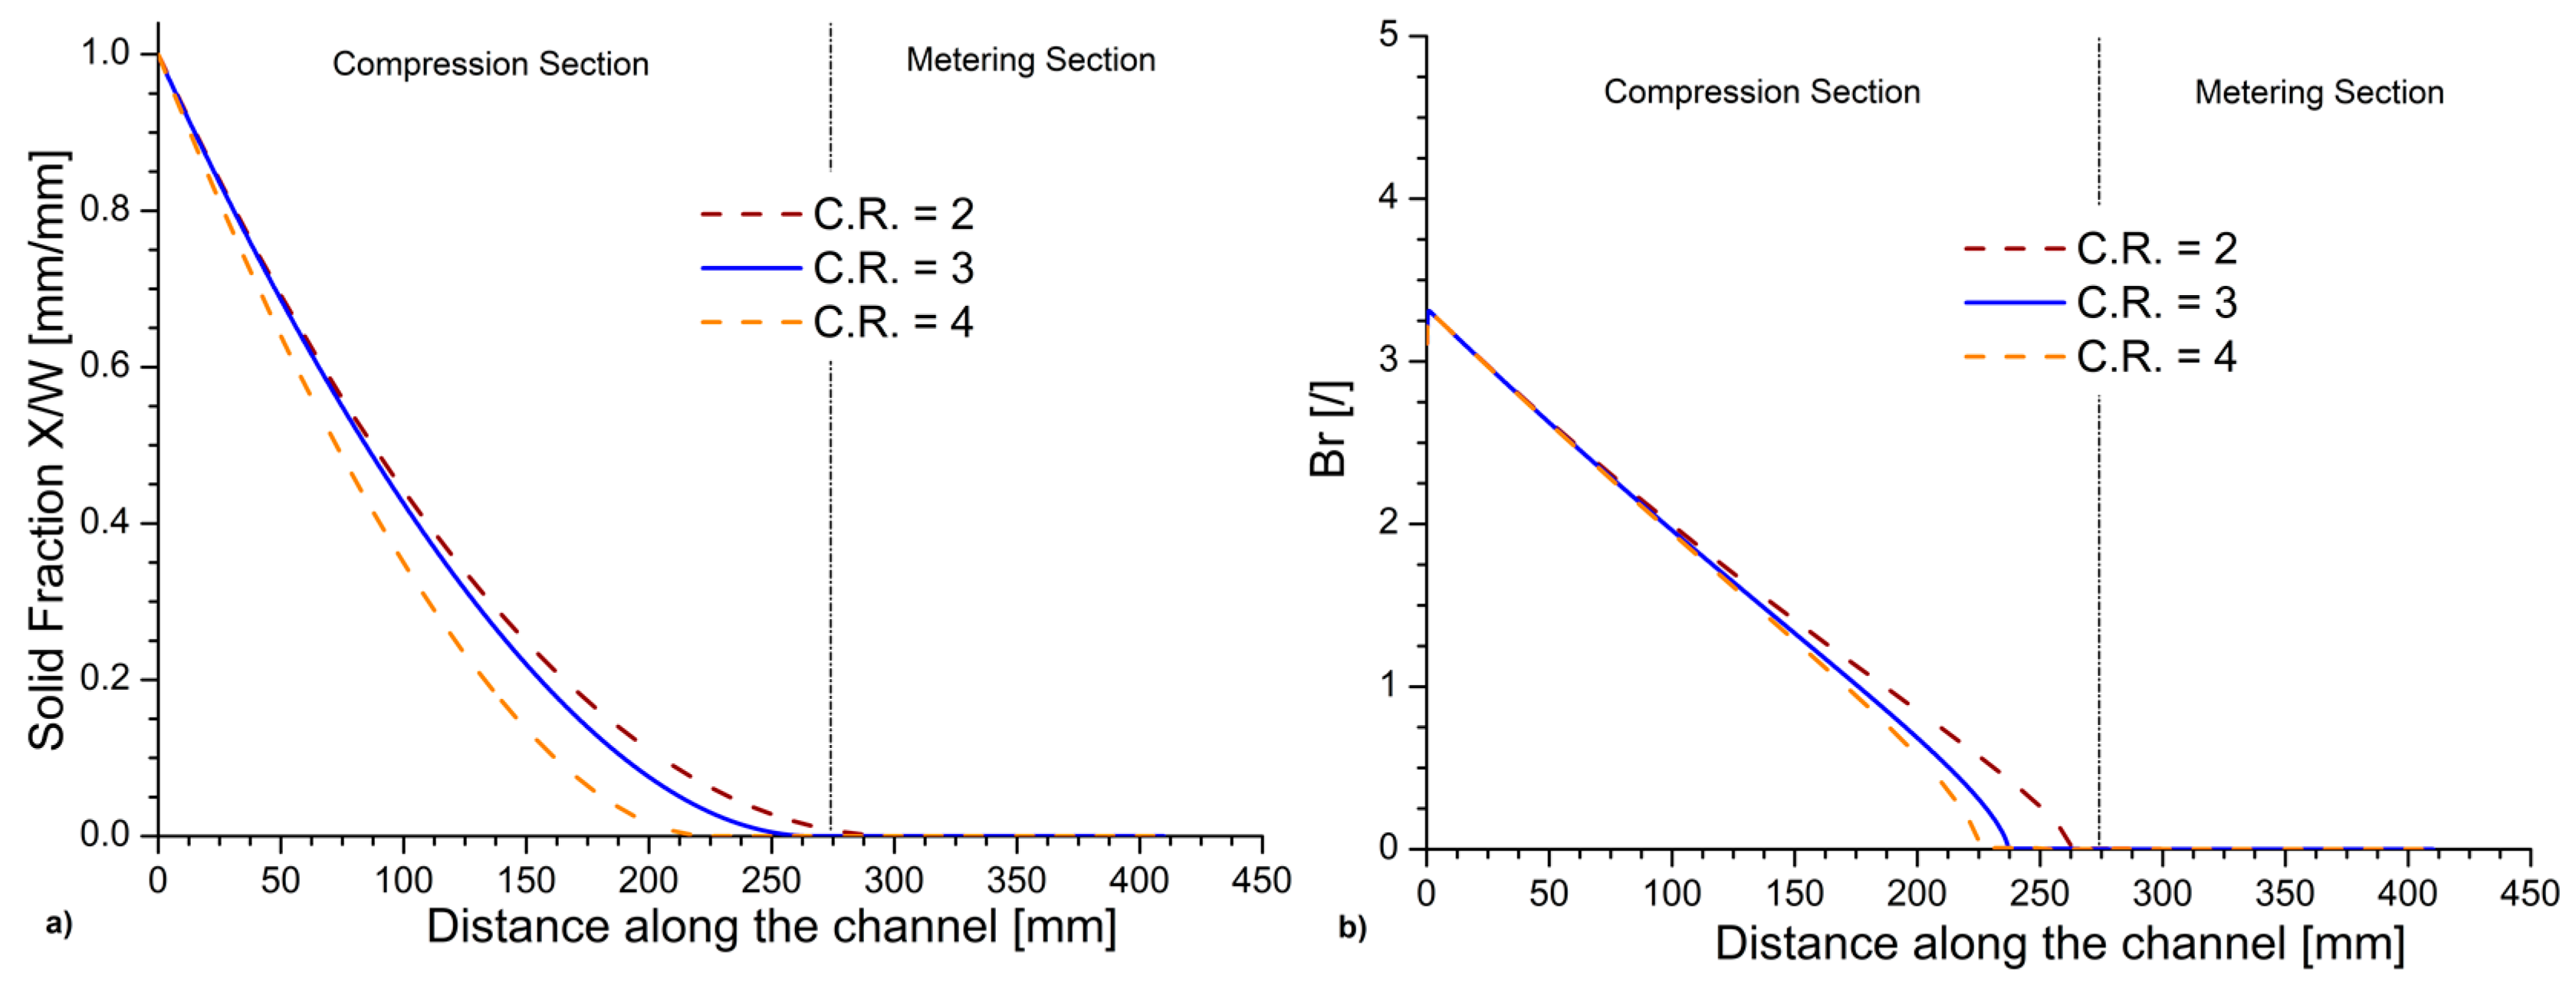
3.4. Effect of the Compression Ratio of the Screw

The effect of the compression ratio (C.R.) of the screw is investigated considering always the same value for the channel height at the beginning of the compression section and a varying channel height along the whole section to reach the desired C.R. values of 2, 3 (reference value from before), and 4. Figure 9a shows the effect of C.R. on the solid fraction along the channel length. For an increasing C.R., a shift of the point of complete melting to lower z values is observed. For example, for a compression rate increase from 2 to 4, the melting completion point lowers by 23%. As the rate of melting is directly dependent on the height of the channel through Equation (17), a variation in the melting profile is noticeable. This is mostly once the difference in the height of the channel becomes substantial, which explains why the melting profiles in Figure 9a at the beginning of the compression zone are still comparable.
This effect is also observed in Figure 9b showing that the C.R. variation only results in an appreciable variation of the heating mechanism toward the end of the melting. In all three cases, Br values are comparable at the beginning of the compression section and decrease until they reach zero at the point of complete melting. Hence, C.R. is also a critical parameter, leading to higher melting efficiencies, as shown in Figure S2.

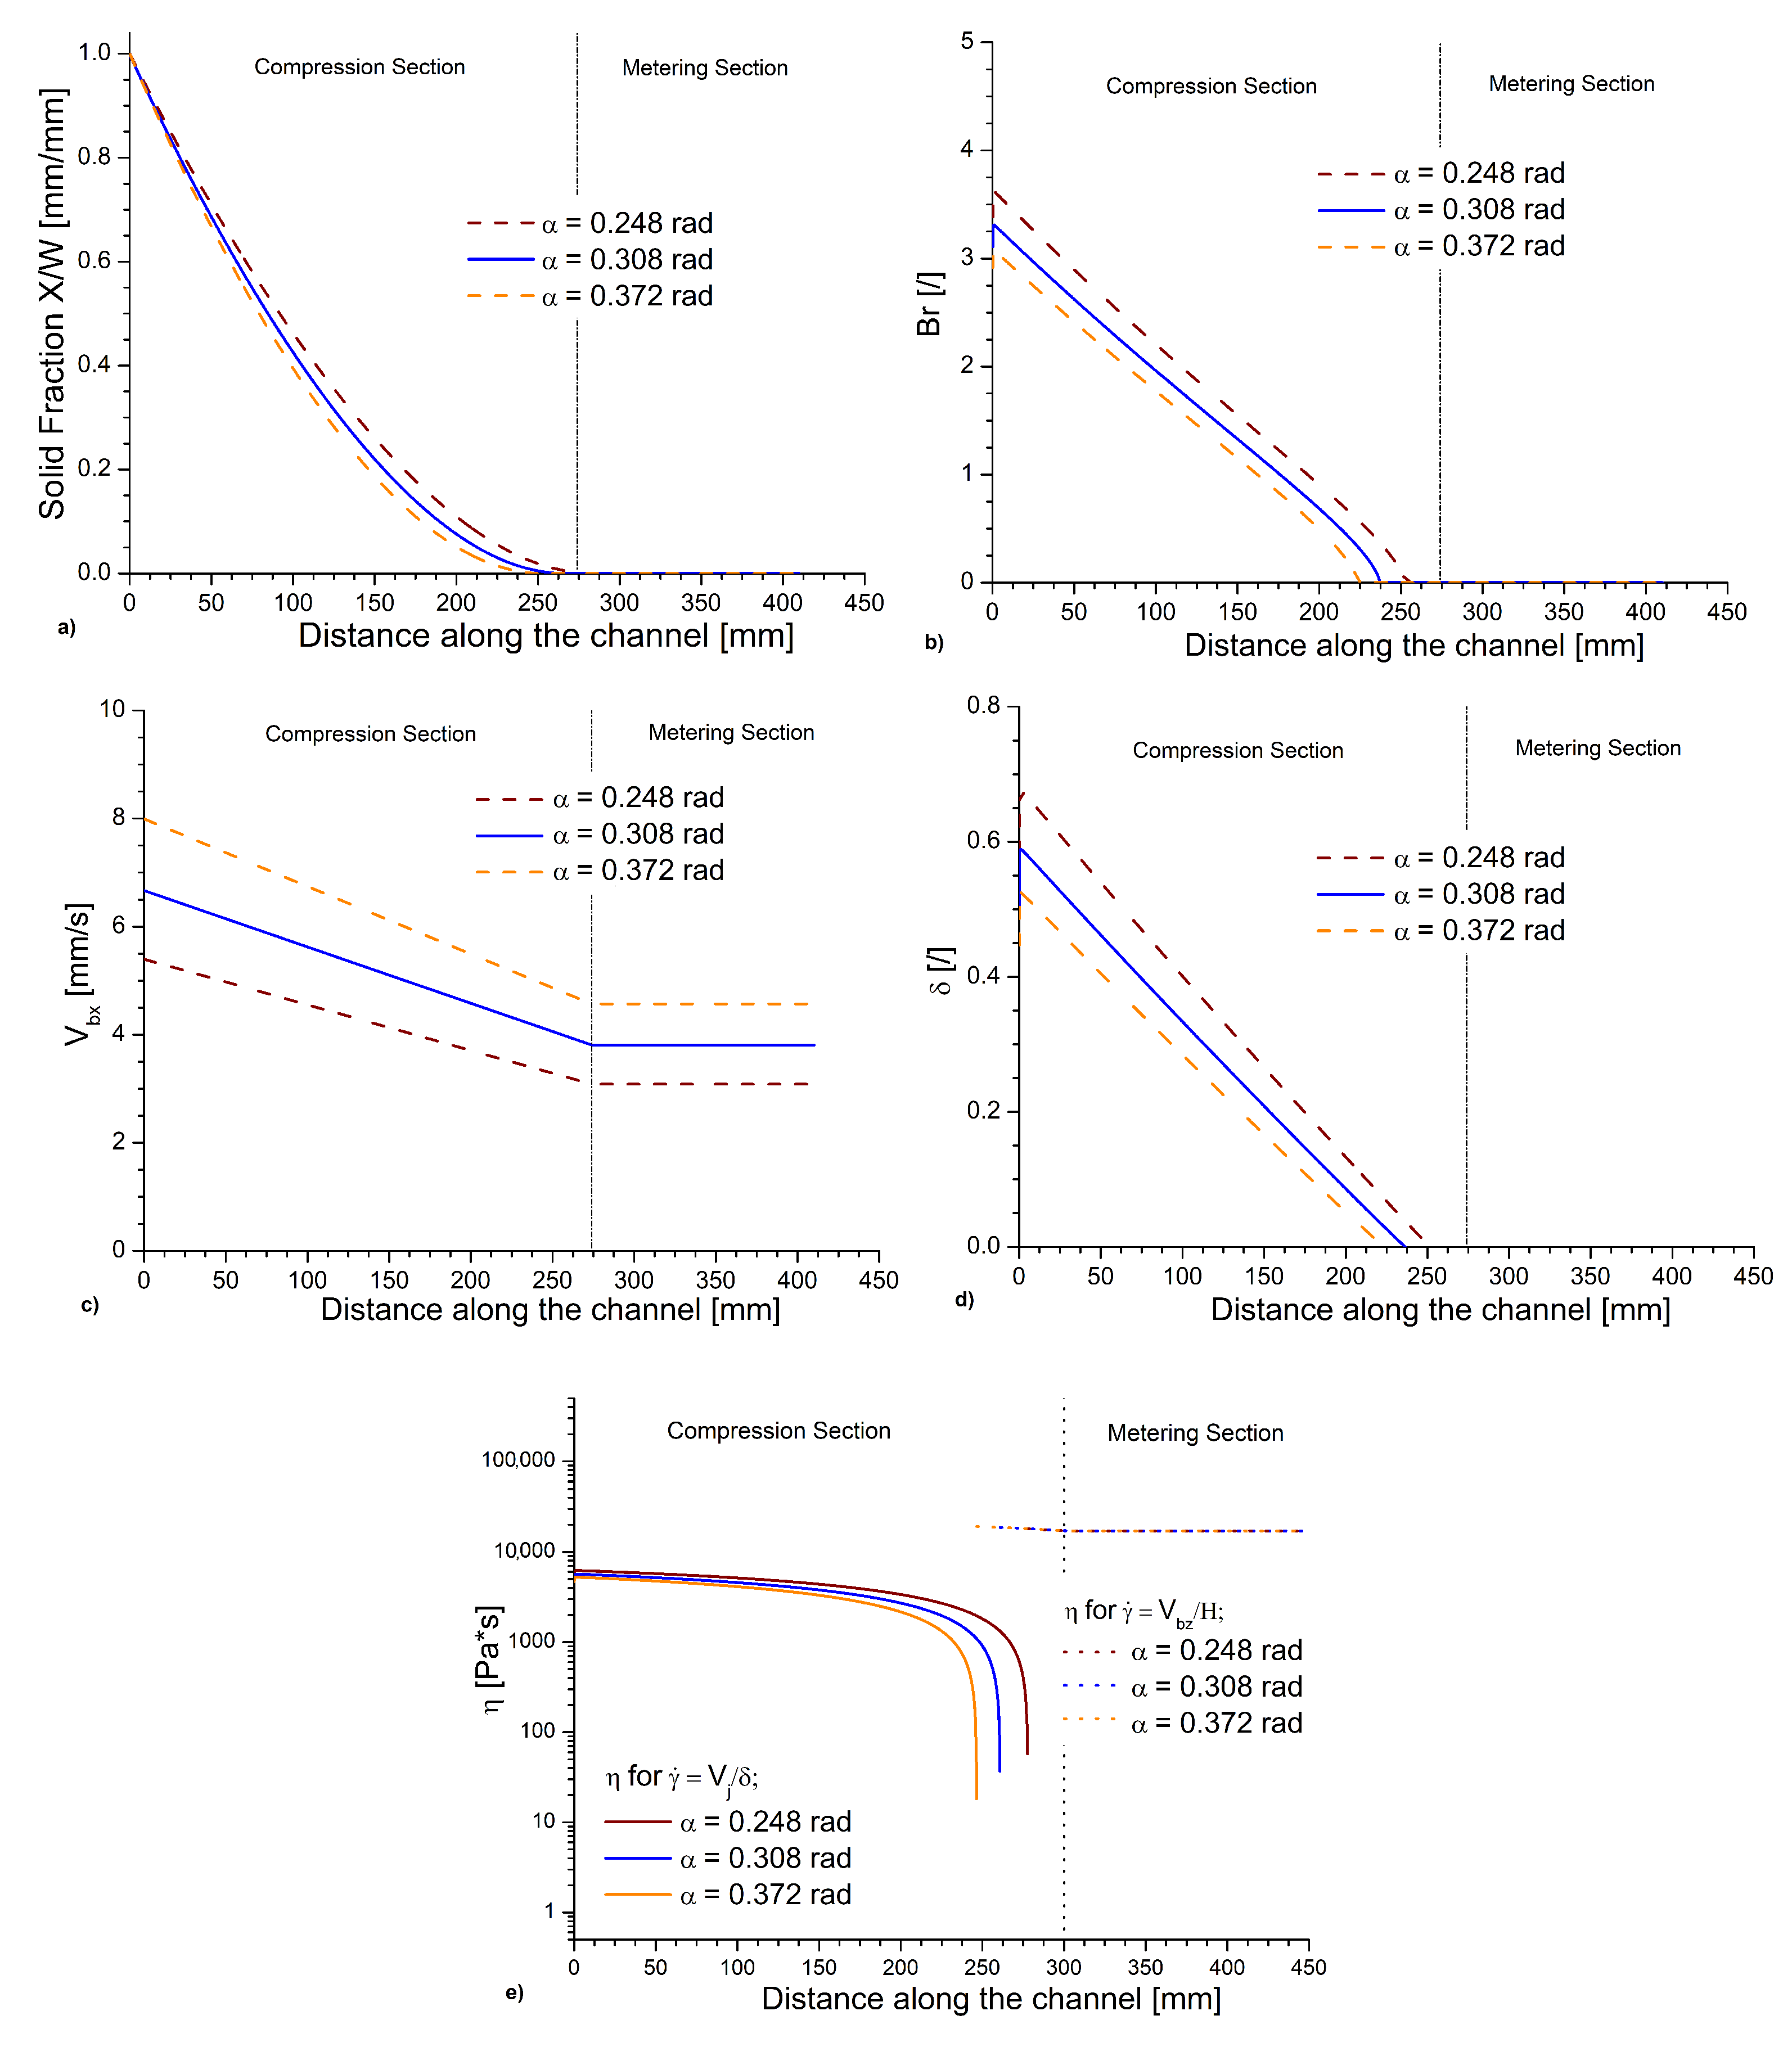
3.5. Effect of the Screw Pitch Angle

The effect of the screw pitch angle on the melting profile and Br evolution is covered in a next step by regarding an increment and decrement of the pitch angle by 20% from the reference value in Table 1 (Column 2). As shown in Figure 10a, increasing the pitch angle leads to a shift in the complete melting point, moving it to lower distances of the screw channel. This can be understood by noting that the melting rate is determined by the square root of V b x (Equation (1)), a property that is on its own strongly dependent on the pitch angle (Equation (2)), as illustrated in Figure 10c. An increment of V b x , due to an increase in the pitch angle, thus accelerates the melting rate.
It however also causes δ to decrease, as visible in Figure 10d. The latter decrement increases the melting shear rate so that viscosity profile is lowered as shown in Figure 10d. This leads in turn to a decrement of the heat generated by shear, thus the Brinkman number (Figure 10b), despite that the variation in the relative velocity is not affected, as shown in Figure S3. Overall, the square root dependence is dominant, explaining the positive effect of an increase of the pitch angle on the melting behavior.

3.6. Effect of Volumetric Feeding Rate

The effect of an increment and a decrement of 15% regarding the reference volumetric feeding rate on the melting profile and Br variation was also evaluated. The use of different volumetric feeding rates at a constant rotational speed is well representative, for example, for different pellets sizes used as a raw material in the extrusion process. Approximating a pellet as a sphere, one can visualize, as shown in Figure S4, how, for increasing average pellet diameters, the volume ratio between polymer material and voids decrease.
The melting profile appears to be sensitive to the volumetric rate of material entering the extruder, as reported in Figure S5. As expected, a shift of the point of complete melting to higher z values is observed with an increase in the volumetric rate. It is interesting to observe that the effect of this increment of the volumetric feed rate only results in a gradual increase of Br along the channel as visible in Figure S5, while the balance between viscous heat and conduction heat at the beginning of the compression section is comparable, indicating that the heating mechanism does not change considerably.
The variations observed in the solid bed profile are in good agreement with previous single screw literature data, showing that increasing the volumetric flow rate results in an increase of the solid fraction at the same position of the screw length. These observations have been attributed to a shorter time to heat the polymer if higher flow rates are employed [25]. A different study from Lewandowski [57] observed the opposite effect for an intermeshing counter-rotating twin-screw extruder. The different effect can be explained by the different melting mechanism, geometry, and operating conditions existing for twin-screw counter-rotating extrusion.

3.7. Effect of Screw Channel Width

The effect of the screw channel width W on the melting profile and Br variation was also evaluated by considering an increment and a decrement of 10% from the reference channel width (W = 16 mm; Table 1, Column 2), considering a constant volumetric feeding rate per unit of channel width (value of 15 mm3/mm/s). Both the SBP and the Br chart are visible in Figure S6. For increasing values of W, a shift is observed in the position of the complete melting point to higher values of the channel distance. The results are in accordance with those found for higher volumetric feeding rates previously discussed [24]. For higher values of W, a small increment of Br is also observable indicating that a higher share of the energy is supplied by viscous dissipation for wider channels.

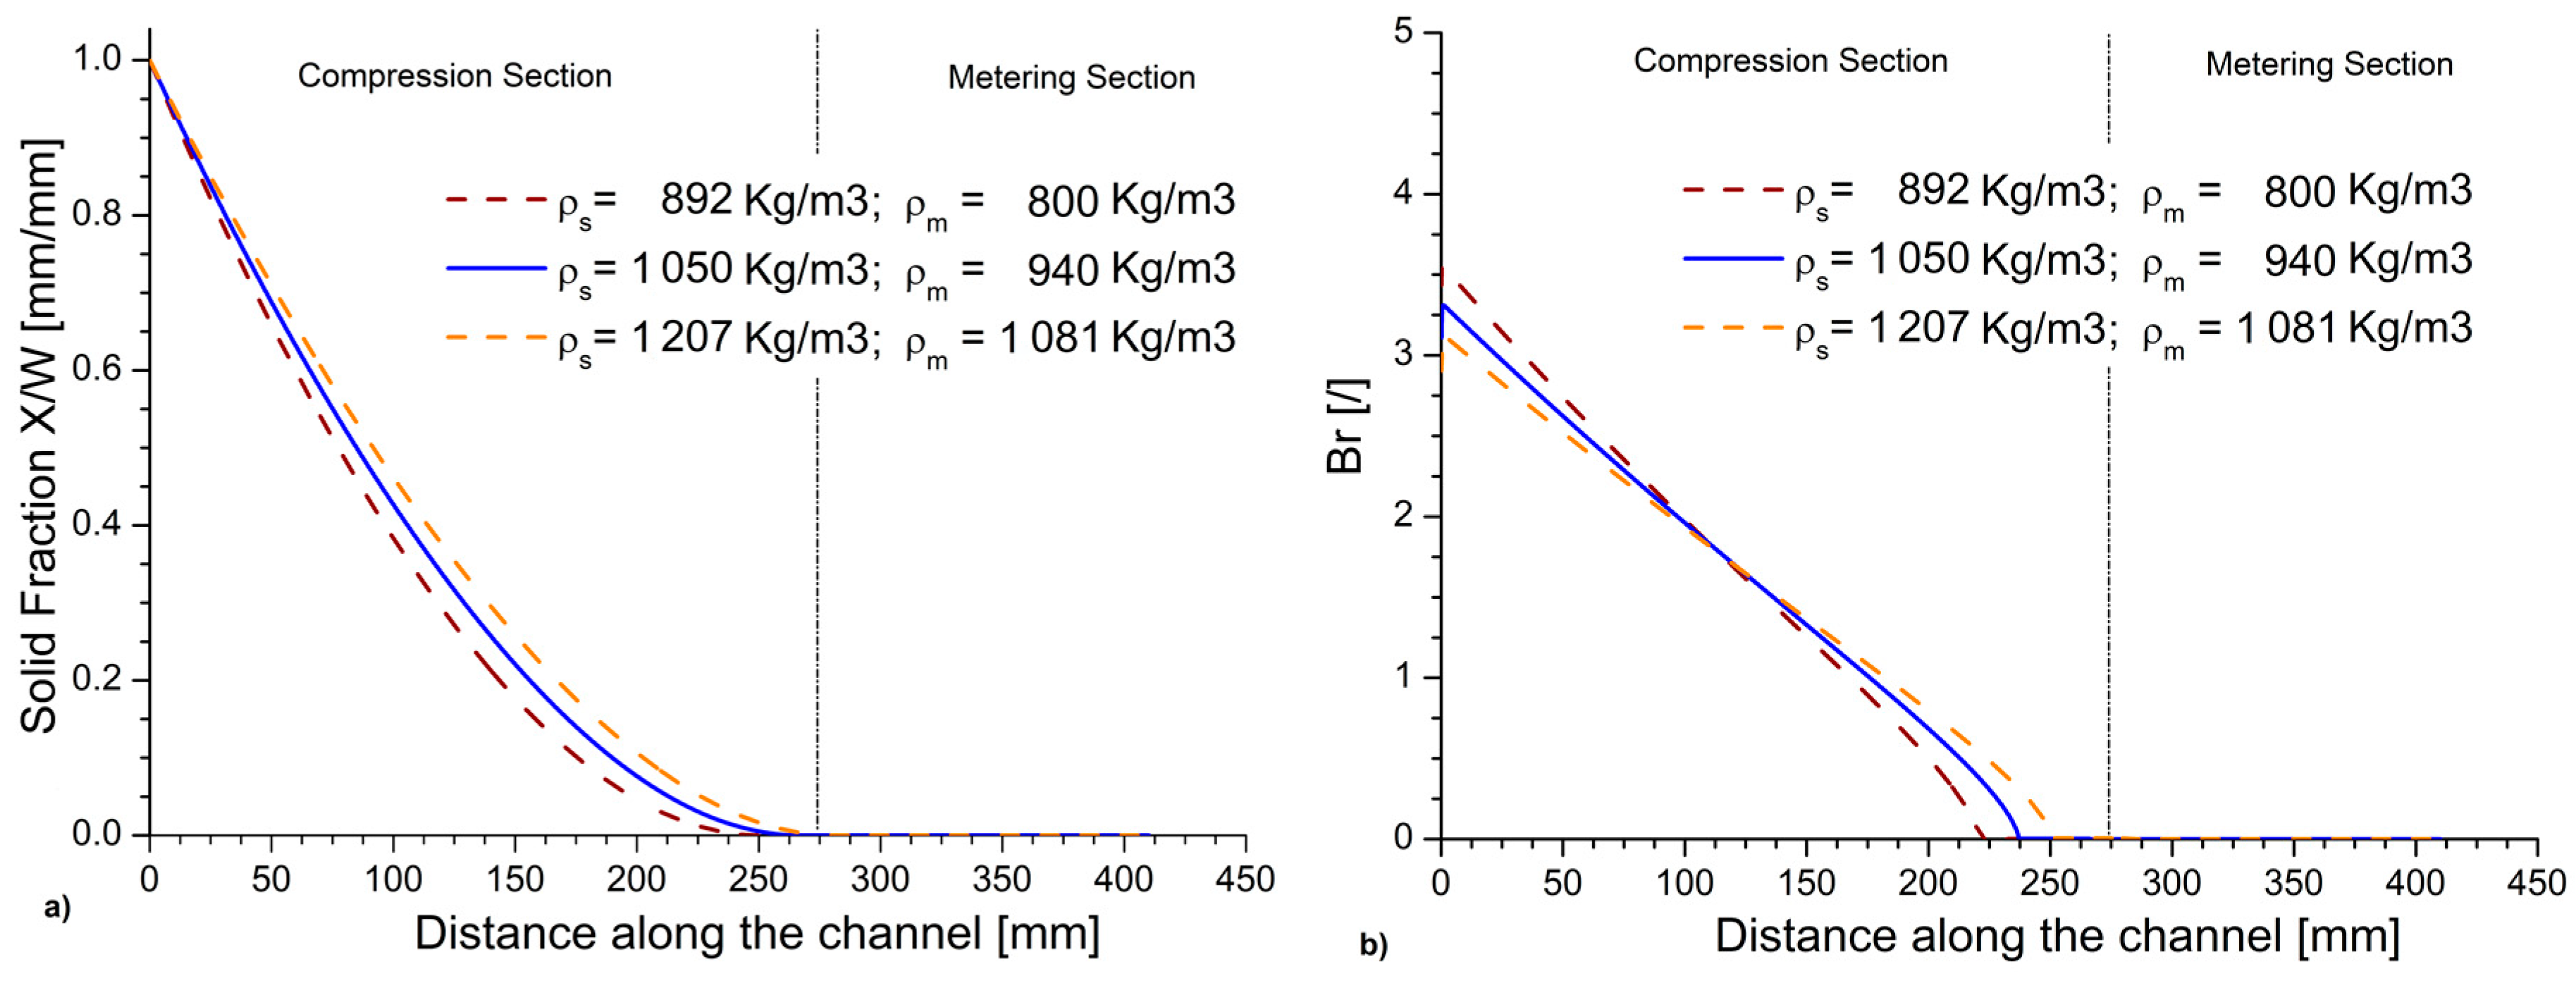
3.8. Effect of Polymer Density

The melting profile and the Brinkman number were also evaluated for an increment and a decrement of the 15% of the standard polymer density (950 kg/m3 in Table 1, Column 2). The variation of the solid fraction along the channel distance in Figure 11a indicates a slower melting for increasing values of this density. This can be explained as increasing the density of the polymeric material, for a constant volumetric feeding rate, results in a higher mass rate. More energy is hence required to melt the material completely, dislocating the SBP to longer distances in the channel. For increasing values of the material density, an initial decrement of the value of Br is observed, which is, keeping in mind the results of Figure 11a, indicative of an initial diminishing viscous dissipation heat.

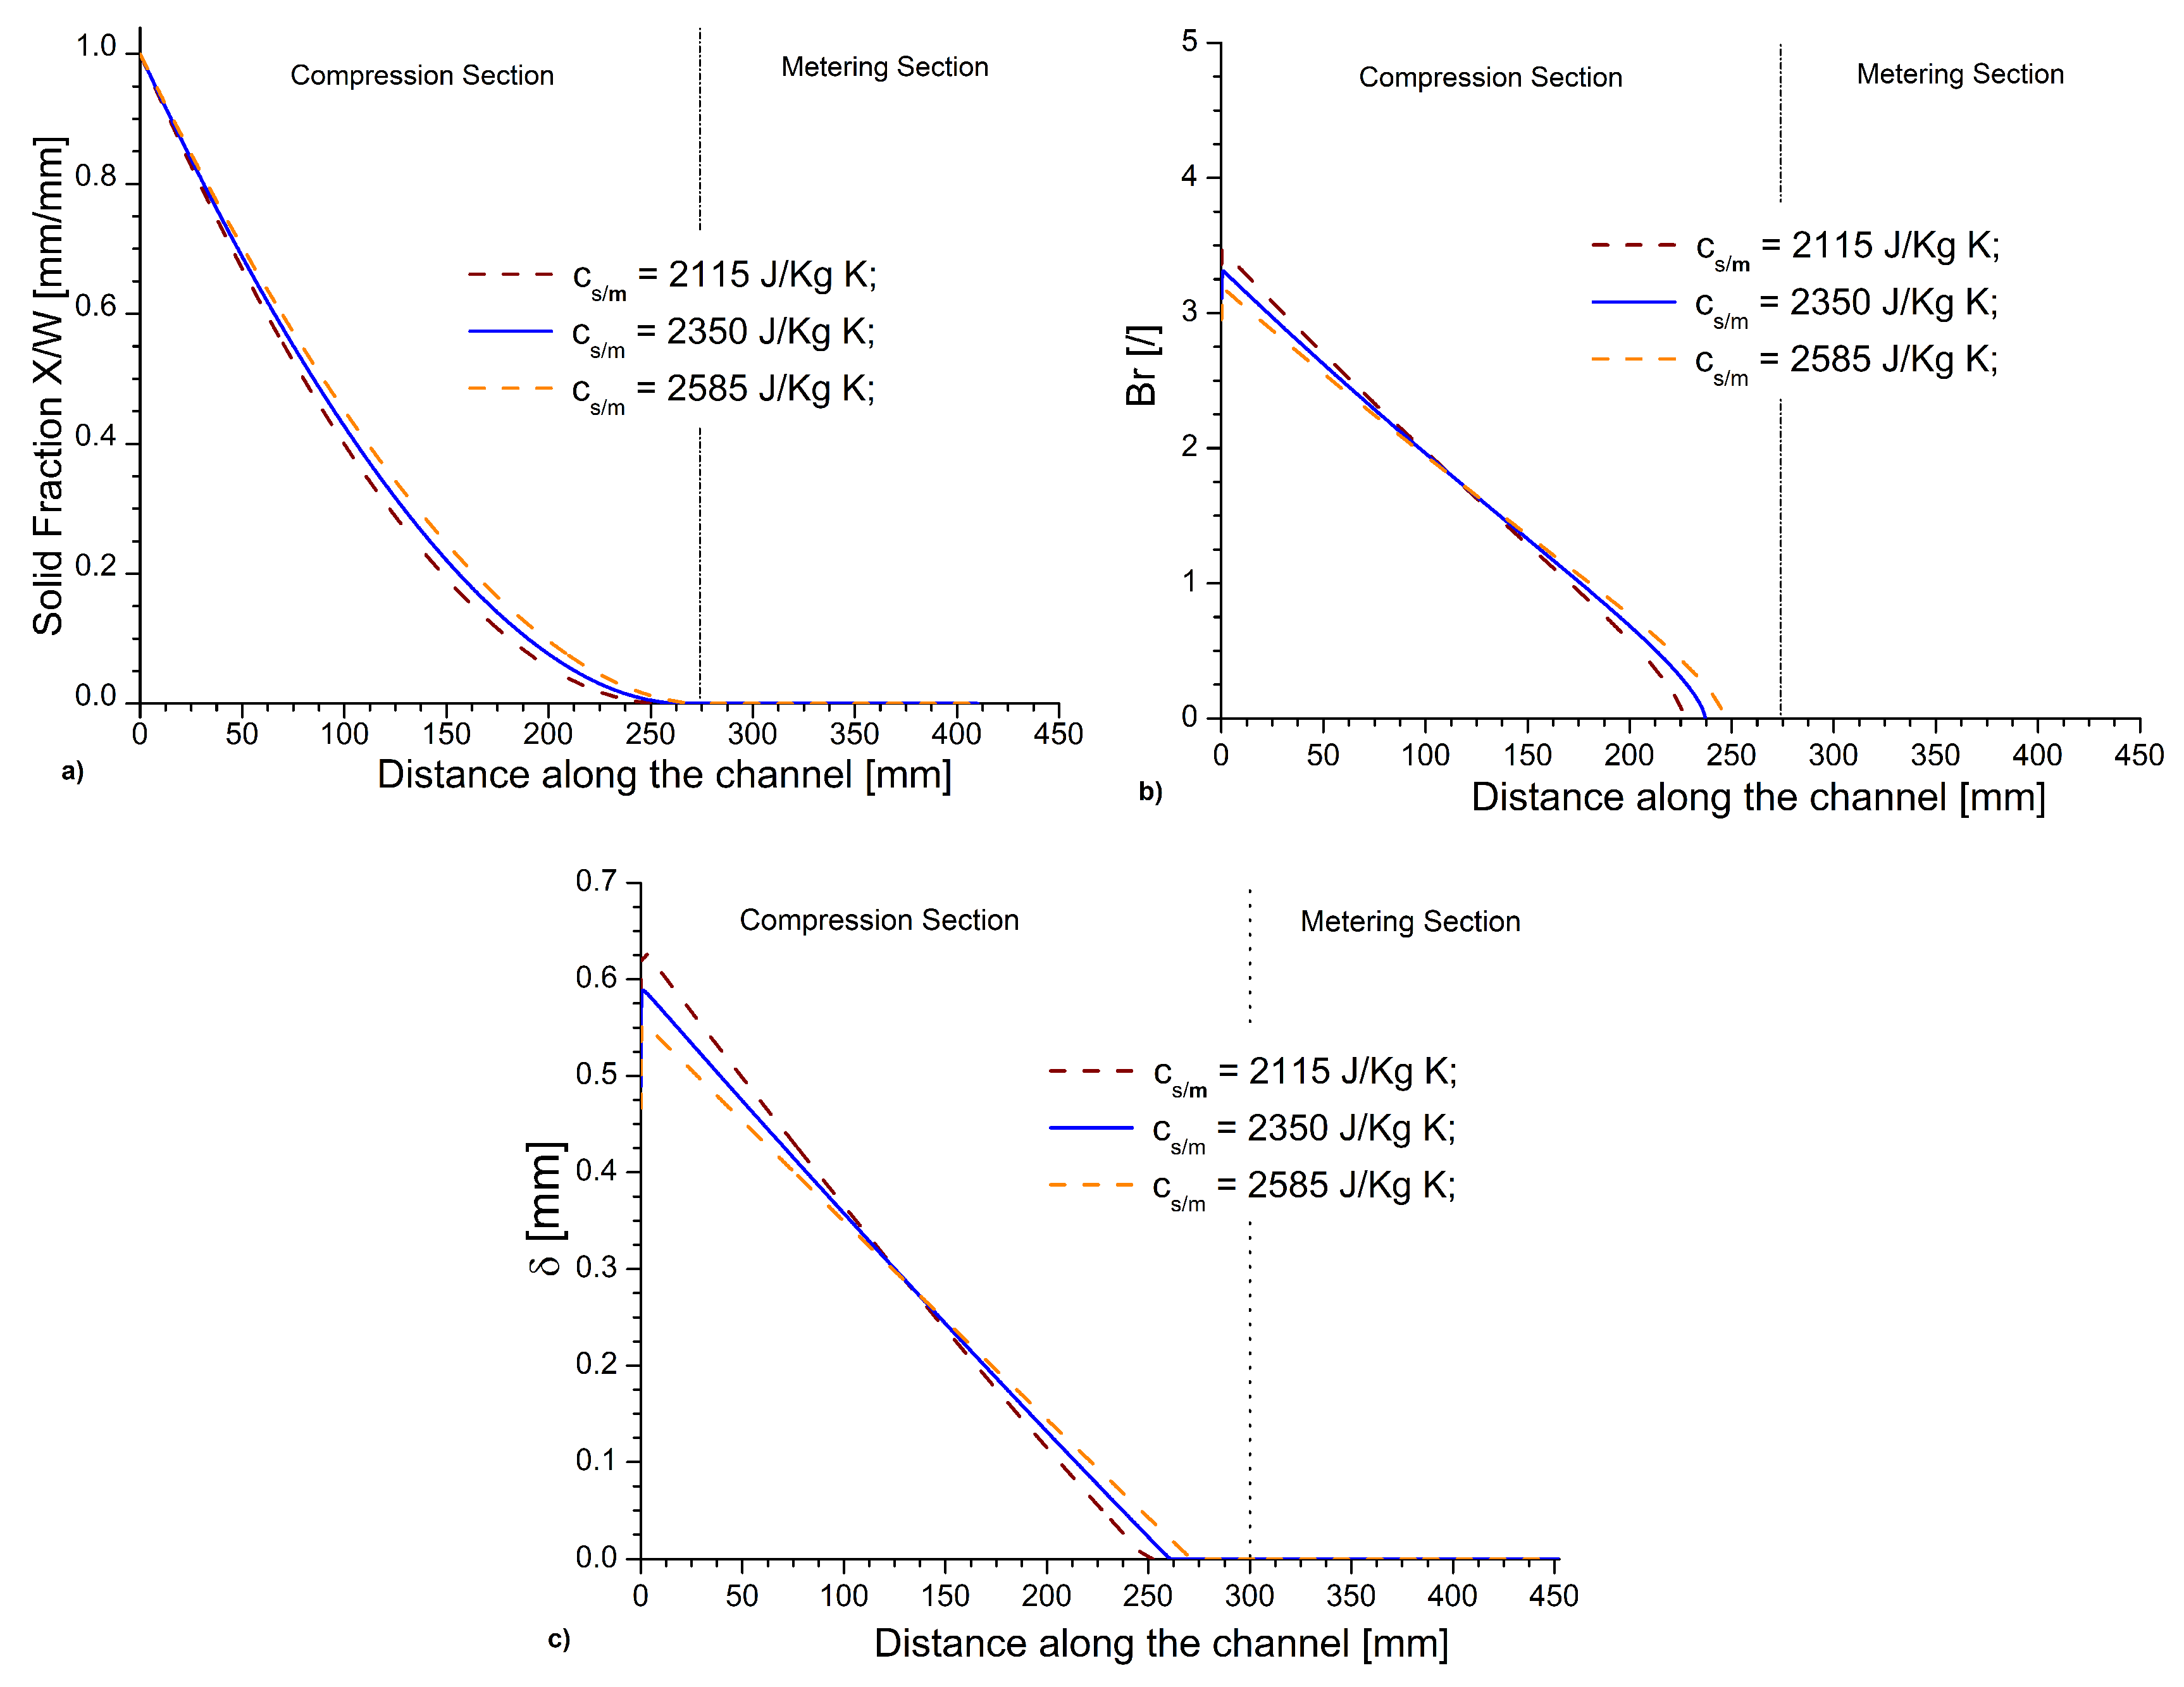
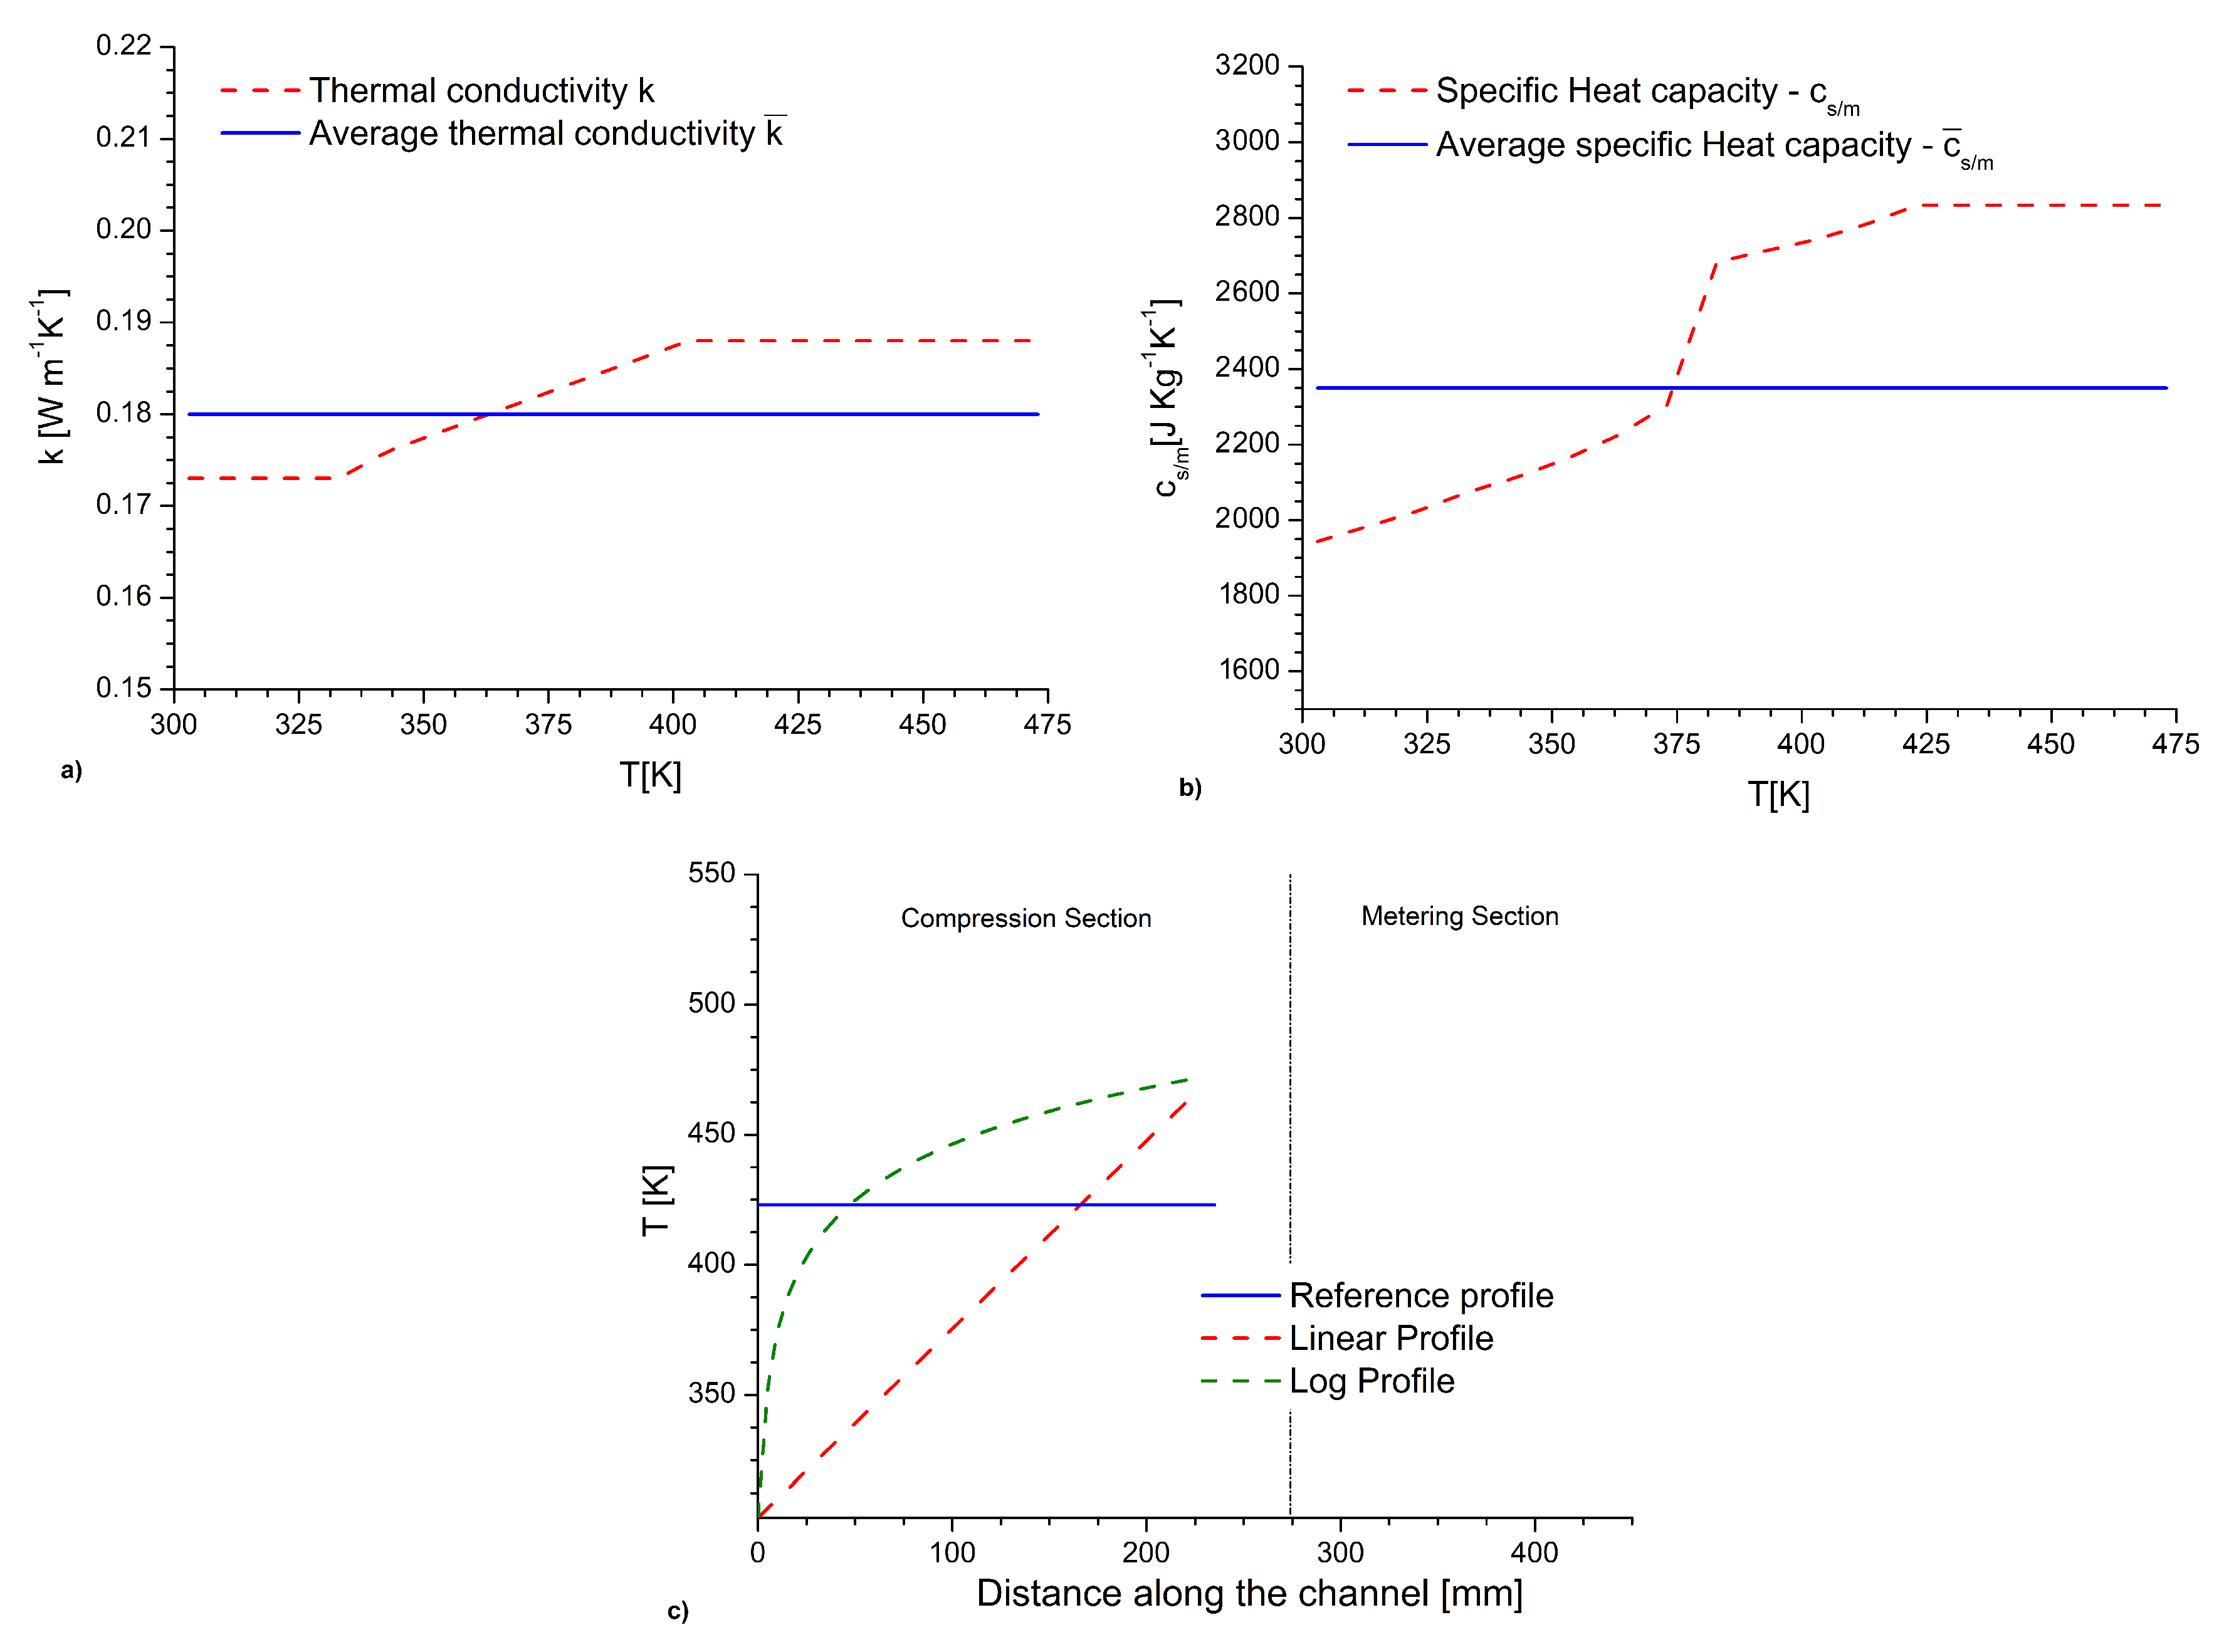
3.9. Effect of Specific Heat Capacity and Thermal Conductivity

The effect of both an increment and decrement of 10% of the standard specific heat capacities (cs and cm) on the melting profile and Br variation was investigated and the results are shown in Figure 12. For higher values of the specific heat capacity, the amount of heat energy required to raise the temperature of a substance per unit of mass increases, resulting in a slower melting so that the melting profile in Figure 12a moves slightly to the right. The Br number plot in Figure 12b displays rather modest variations in the heating mechanism. Hence, even for the lower values of the specific heat capacity the shearing effect is dominant, at least at the beginning of the compression section. However, advancing along the compression section, this dominance becomes less relevant and at about one third through the compression section the effect is reversed so that the share of heat supplied by the external heaters becomes higher towards the end of the channel. This inversion is also visible in the δ variation, which leads to a modification in Br.
Previous literature studies [24] observed that no variation in the SBP for a variation of 10% of the specific heat capacity or thermal conductivity. The ME case, however, presents substantial differences compared to those previous studies, which is mostly related to a different extruder geometry and operating conditions (Table 1, Column 4). Furthermore, the effect of a variation of the 20% of the thermal conductivity on the melting profile and the Br evolution was investigated. For an increment of the thermal conductivity, an increased amount of energy supplied from the heated barrel trough molecular conduction results. As expected, Figure S7 shows that for an increasing value of the thermal conductivity a faster melting of the pellets results, while the Br values decrease along the extruder as the heat exchanged between the polymer and the heated barrel increases. Again, the observed variation is different from what was observed in the previous studies [24]. The difference is attributed to the different extruder geometry, operating conditions, and entity of the thermal conductivity variation considered.

3.10. Effect of Power-Law Index

The melting profile and Br variation were further evaluated for different values of the power-law index n, reflecting a variation in the pseudo-plasticity of the polymer fluid. Both an increment and a decrement of 20% were considered compared to the reference micro-extrusion case in Table 1, with the main results shown in Figure S8a. The point of complete melting is observed to significantly move to higher z values for lower values of the power-law index. This result confirms what is expected since a lower power-law index is representative of a lesser viscous material under a defined shear rate in the processing regime. Such reduced viscosity leads to a lower amount of heat generated by viscous dissipation, delaying the position of complete melt for otherwise similar settings.
The associated Br plot as reported in Figure S8b shows that reducing n substantially reduces Br, i.e., lowering n leads to lowering heat being generated by viscous dissipation promoted by shear. Notably these simulation results regarding the effect of the power-law index on the melting profile in SSEs are in good agreement with what has been observed in previous studies for conventional SSE [24].

3.11. Summary of Individual Variations

From the above discussion, it is evident that many variables play an individual role but not all of them have an equal impact. In Table 2 a summary is presented regarding the above insights. One column contains the range of the variables explored and the other the range of shifts of the melting point finalization as well as the Br variation. It follows that the screw frequency and compression ratio are specifically sensitive as well as the power-law index.

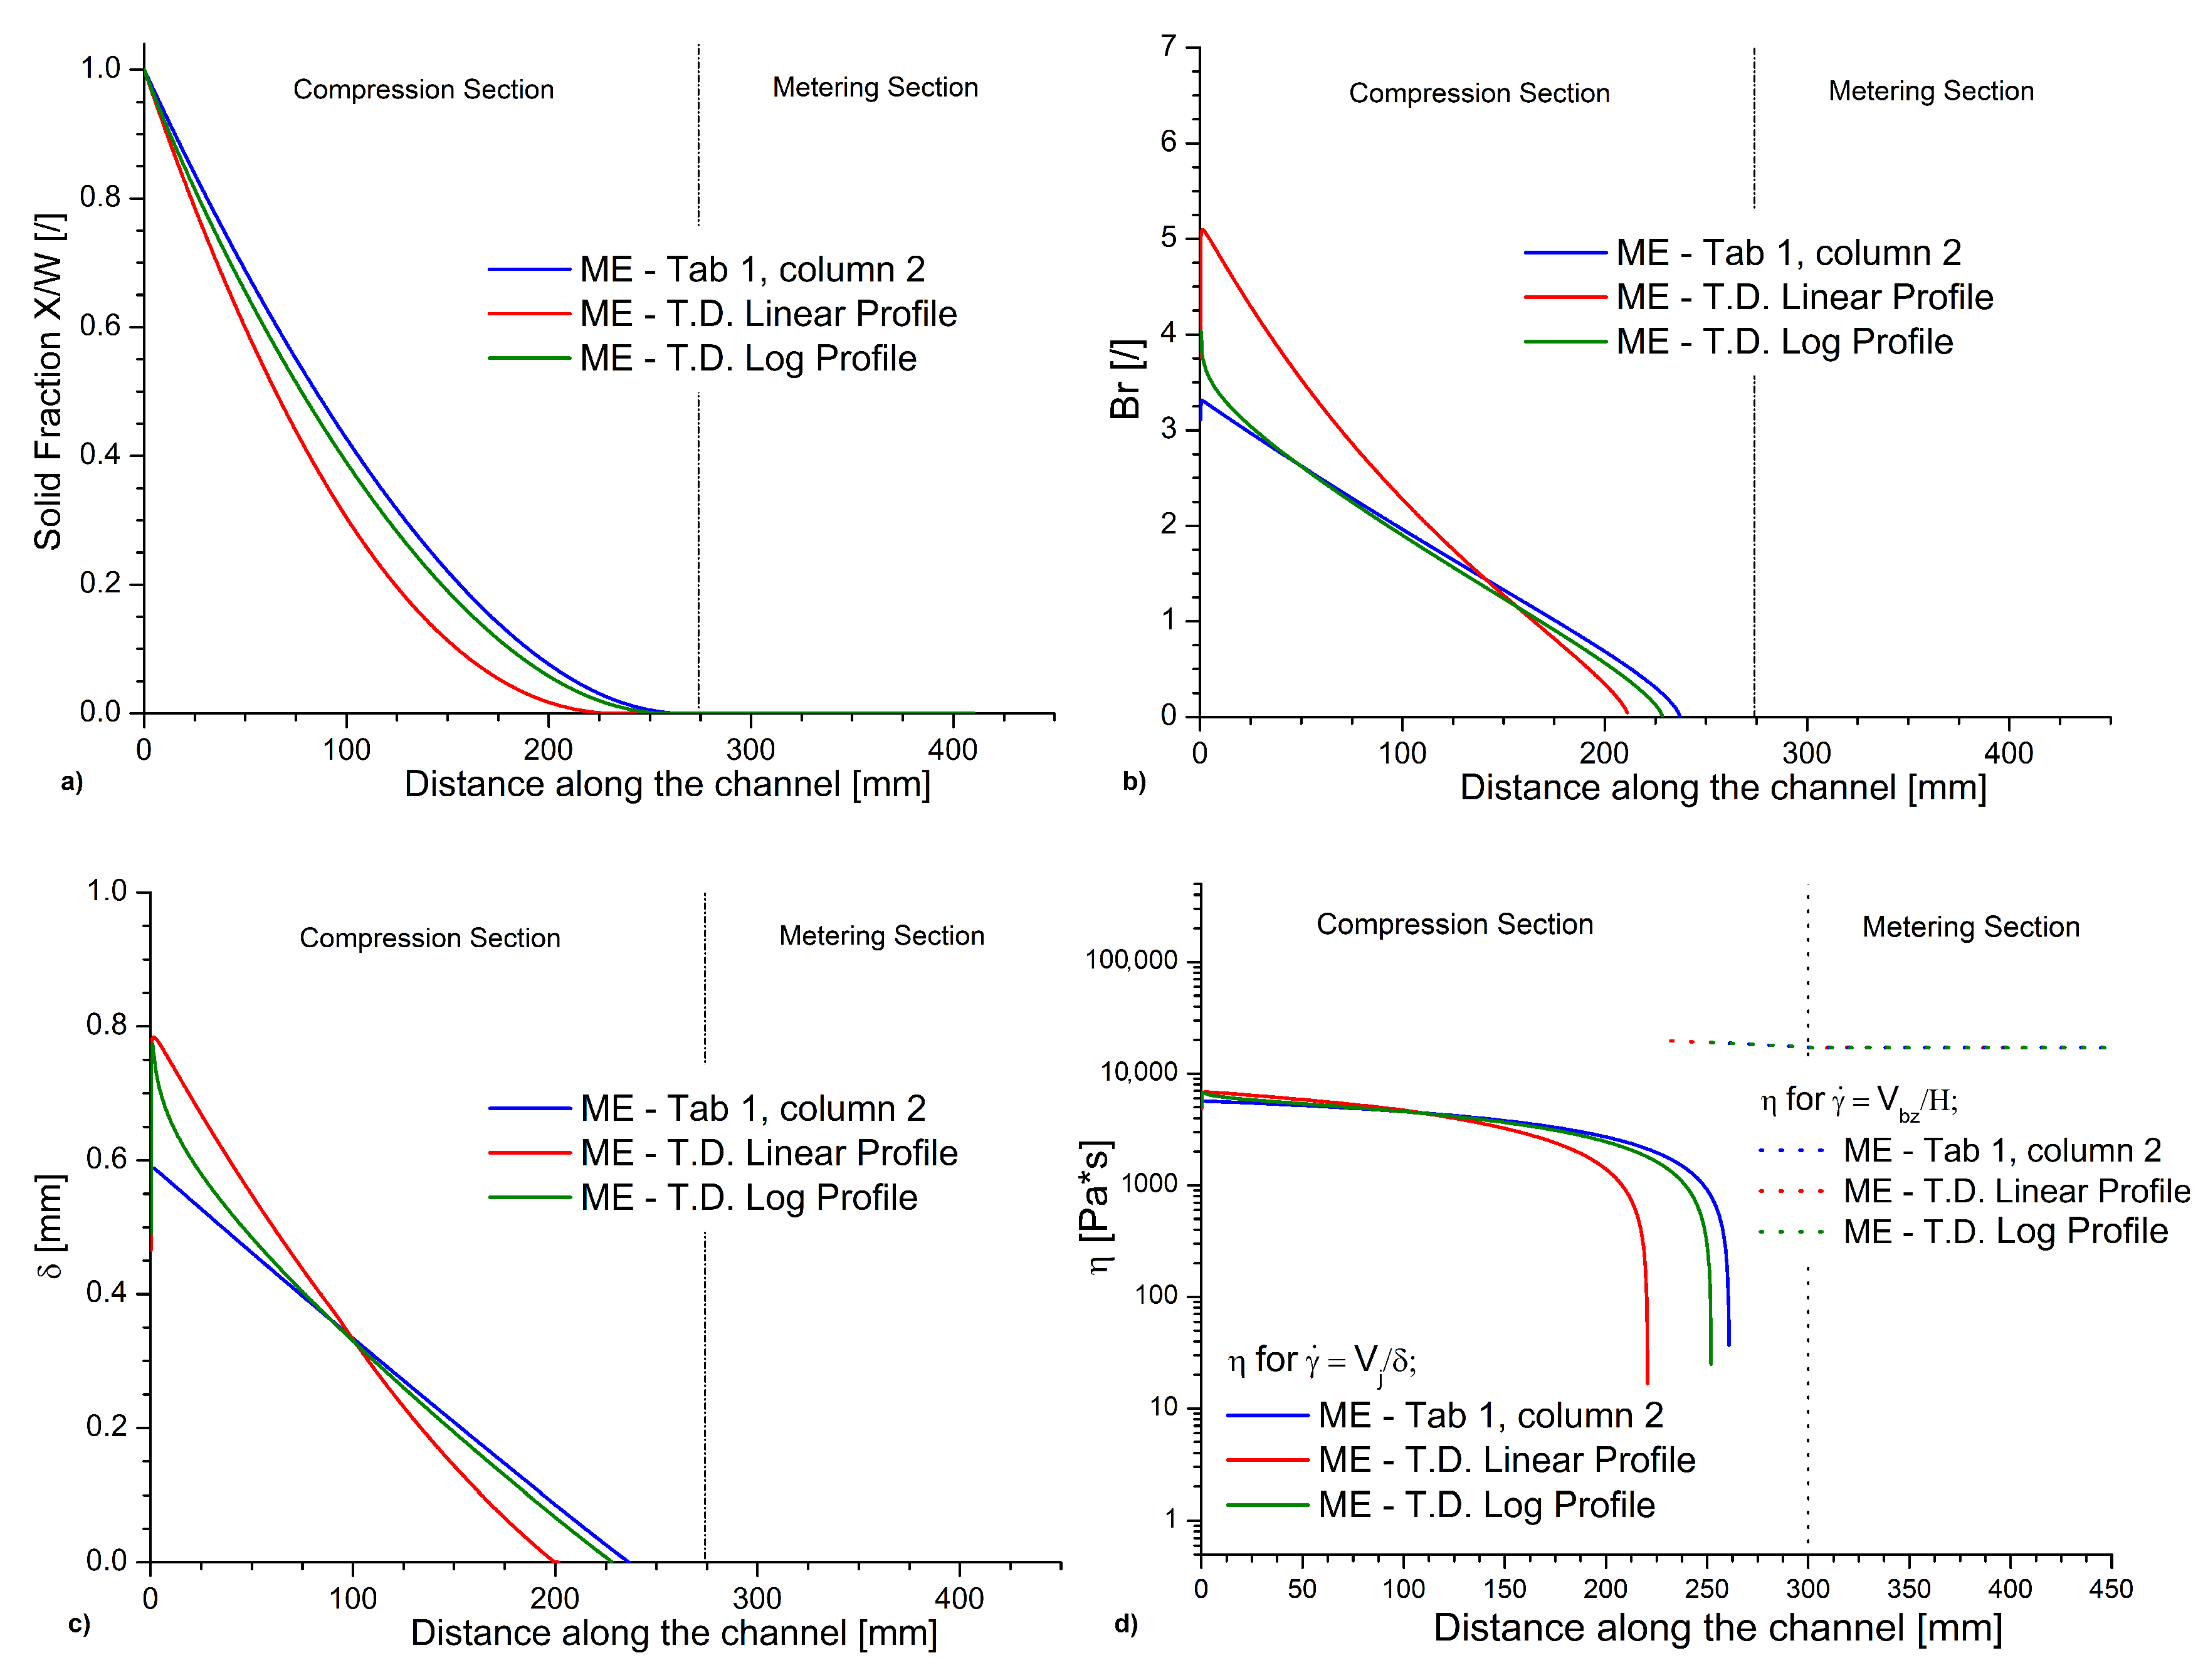
3.12. Extension for Varying Physicochemical Parameters

In the previous subsections, the values for the material properties thermal conductivity and specific heat capacity are considered constant, as also shown by the blue full lines in Figure 13. However, inside the melt film layer, temperature variations can exist. In this subsection, the effect of such variations is evaluated considering parameters based on previous work [58] although using scaling to obtain on average the value in Table 1.
In a first extra case, the solid bed temperature is assumed to vary from ambient temperature at the beginning of the metering section to the melting temperature at the complete melting point that is estimated from the reference case (dashed red line Figure 13c). It is of course possible to use an iterative process to include a better approximation of the position of the point of complete melting, but upon doing so no appreciable difference was observed, explaining why this initial assessment was maintained. As a second extra case, a logarithmic temperature profile is considered, as shown by the dashed green line in Figure 13c, probably closer to a real profile, as it can be expected that the amount of energy exchanged between the polymer melt and the barrel decreases as their temperature difference decreases.
If we consider the linear temperature variation, the observed values of Br at the beginning of the metering section are, as shown in Figure 14b (red dashed line), about 50% higher than the reference case (Table 1, Column 2, blue full line), highlighting the impact of the temperature dependent viscosity values. Figure 14d indeed shows that with a linear temperature profile the polymer presents a higher viscosity at the beginning of the metering section. This effect on Br is however highly mitigated if the logarithmic temperature profile is considered so that the heating mechanism becomes closer to the reference case. A similar trend is observed for the complete melting point (Figure 14a) displaying that the melting is about 13% faster if the linear temperature profile is considered (Figure 14a, red dashed line). For the logarithmic temperature profile, the variation in the point of complete melting is instead less than 1%.
The temperature profiles in Figure 13 also affect the variation of δ, as depicted in Figure 14c. As expected from Equation (12), the initial value of δ is the same for the two temperature profiles but for the logarithmic case δ decreases less rapidly so that the δ profile is closer to what observed in the reference case. Globally, it still holds that from a fundamental point of view a different δ profile implies a different melting behavior and, hence, the detailed update of this property along the simulation is highly relevant.

4. Conclusions

A numerical model that can be combined with on-line control systems is proposed to investigate the melting profile in single screw micro-extrusion processes for polymeric additive manufacturing (AM) applications. The model was used to predict the variations of melting profile and heating mechanism, due to variations in the extruder dimensions, process parameters, and material properties. In a first phase, the model was applied with a constant specific heat capacity and thermal conductivity to then switch to temperature dependent parameters in a second phase.
Essential in the model is the correct description of the melt layer thickness with only very approximated process design if only averaged values are utilized. Moreover, the Brinkman number ( Br ) appeared as an effective characteristic to explain the variations in the heating mechanism and melting profile.
Upon comparison with a conventional extruder with barrel temperature and screw velocity as typical for AM, it follows that the micro-extrusion is characterized by a lower Br and on a relative basis a slower melting. Essential parameters to control the melting finalization point are the screw frequency, pitch angle, and compression ratio. Specifically, the variation of the screw frequency has a different relation compared to conventional extrusion as AM is inherently in a different window of such velocities. A significant effect is also observed for the power-law index. The impact of the temperature dependent parameters is largely related to the actual shape of the temperature profile. It is shown that a temperature profile can be mimicked, leading to similar results as for the model with a given constant (high) melt temperature.

Supplementary Materials

The following are available online at https://www.mdpi.com/2227-9717/8/11/1522/s1, Figure S1: Extra information for Micro-Extruder and Standard Extruder II comparison, Figure S2: Melting efficiency parameter ϕ for different compression ratios, Figure S3: Relative velocity for different values of the pitch angle, Figure S4: Example of difference in the polymer (pellets) to channel volume ratio, Figure S5: Extra information for different volumetric inlets, Figure S6: Melting profile and Brinkman number for different values of the channel width, Figure S7: Melting profile and Brinkman number for different values of the thermal conductivity, Figure S8: Melting profile and Brinkman number for different values of the power law index.

Author Contributions

Conceptualization, M.E., L.C. and D.R.D.; software, A.L.G., L.C. and D.R.D.; investigation, A.L.G., R.F., M.E., L.C. and D.R.D.; writing—original draft preparation, A.L.G.; writing—review and editing, A.L.G., R.F., M.E., L.C. and D.R.D.; supervision, L.C. and D.R.D.; and funding acquisition, L.C. and D.R.D. All authors have read and agreed to the published version of the manuscript.

Funding

The authors are grateful to the funding of the Industrial Research Fund of Ghent University under grant agreement F2017/IOF-StarTT/090.

Conflicts of Interest

The authors declare no conflict of interest.

References

  1. Huang, S.; Liu, P.; Mokasdar, A.; Hou, L. Additive Manufacturing and Its Societal Impact: A Literature Review. Int. J. Adv. Manuf. Technol. 2013, 67, 1191–1203. [Google Scholar]
  2. Attaran, M. The rise of 3-D printing: The advantages of additive manufacturing over traditional manufacturing. Bus. Horiz. 2017, 60, 677–688. [Google Scholar]
  3. Ben-Ner, A.; Siemsen, E. Decentralization and Localization of Production: The Organizational and Economic Consequences of Additive Manufacturing (3D Printing). Calif. Manag. Rev. 2017, 59, 5–23. [Google Scholar] [CrossRef]
  4. Calignano, F.; Manfredi, D.; Ambrosio, E.P.; Biamino, S.; Lombardi, M.; Atzeni, E.; Salmi, A.; Minetola, P.; Iuliano, L.; Fino, P. Overview on Additive Manufacturing Technologies. Proc. IEEE 2017, 105, 593–612. [Google Scholar] [CrossRef]
  5. Peng, T.; Kellens, K.; Tang, R.; Chen, C.; Chen, G. Sustainability of additive manufacturing: An overview on its energy demand and environmental impact. Addit. Manuf. 2018, 21, 694–704. [Google Scholar]
  6. Majeed, A.; Zhang, Y.; Ren, S.; Lv, J.; Peng, T.; Waqar, S.; Yin, E. A Big Data-Driven Framework for Sustainable and Smart Additive Manufacturing. Robot. Comput. Integr. Manuf. 2021, 67, 102026. [Google Scholar]
  7. Dobrzański, L.; Dobrzański, L. Dentistry 4.0 Concept in the Design and Manufacturing of Prosthetic Dental Restorations. Processes 2020, 8, 525. [Google Scholar] [CrossRef]
  8. González-Henríquez, C.M.; Sarabia-Vallejos, M.A.; Rodriguez-Hernandez, J. Polymers for additive manufacturing and 4D-printing: Materials, methodologies, and biomedical applications. Prog. Polym. Sci. 2019, 94, 57–116. [Google Scholar]
  9. Franco, D.; Miller Devós Ganga, G.; de Santa-Eulalia, L.A.; Godinho Filho, M. Consolidated and inconclusive effects of additive manufacturing adoption: A systematic literature review. Comput. Ind. Eng. 2020, 148, 106713. [Google Scholar]
  10. Khosravani, M.; Reinicke, T. On the Environmental Impacts Of 3D Printing Technology. Appl. Mater. Today 2020, 20, 100689. [Google Scholar]
  11. Sun, Q.; Rizvi, G.M.; Bellehumeur, C.T.; Gu, P. Effect of processing conditions on the bonding quality of FDM polymer filaments. Rapid Prototyp. J. 2008, 14, 72–80. [Google Scholar]
  12. Wang, S.; Capoen, L.; D’hooge, D.R.; Cardon, L. Can the melt flow index be used to predict the success of fused deposition modelling of commercial poly(lactic acid) filaments into 3D printed materials? Plast. Rubber Compos. 2018, 47, 9–16. [Google Scholar] [CrossRef]
  13. Duty, C.; Ajinjeru, C.; Kishore, V.; Compton, B.; Hmeidat, N.; Chen, X.; Liu, P.; Hassen, A.; Lindahl, J.; Kunc, V. What Makes A Material Printable? A Viscoelastic Model for Extrusion-Based 3D Printing Of Polymers. J. Manuf. Process. 2018, 35, 526–537. [Google Scholar]
  14. Ajinjeru, C.; Kishore, V.; Liu, P.; Lindahl, J.; Hassen, A.; Kunc, V.; Post, B.; Love, L.; Duty, C. Determination of melt processing conditions for high performance amorphous thermoplastics for large format additive manufacturing. Addit. Manuf. 2018, 21, 125–132. [Google Scholar]
  15. Go, J.; Schiffres, S.N.; Stevens, A.G.; Hart, A.J. Rate limits of additive manufacturing by fused filament fabrication and guidelines for high-throughput system design. Addit. Manuf. 2017, 16, 1–11. [Google Scholar]
  16. Duty, C.E.; Kunc, V.; Compton, B.; Post, B.; Erdman, D.; Smith, R.; Lind, R.; Lloyd, P.; Love, L. Structure and mechanical behavior of big area additive manufacturing (BAAM) materials. Rapid Prototyp. J. 2017, 23, 181–189. [Google Scholar]
  17. Liu, X.; Chi, B.; Jiao, Z.; Tan, J.; Liu, F.; Yang, W. A large-scale double-stage-screw 3D printer for fused deposition of plastic pellets. J. Appl. Polym. Sci. 2017, 134, 45147. [Google Scholar] [CrossRef]
  18. Zhou, Z.; Salaoru, I.; Morris, P.; Gibbons, G.J. Additive manufacturing of heat-sensitive polymer melt using a pellet-fed material extrusion. Addit. Manuf. 2018, 24, 552–559. [Google Scholar]
  19. Whyman, S. Design and development of an extrusion system for 3D printing biopolymer pellets. Int. J. Adv. Manuf. Technol. 2018, 96, 3417–3428. [Google Scholar]
  20. Post, B.; Lind, R.F.; Lloyd, P.D.; Kunc, V.; Linhal, J.M.; Love, L.J. The Economics of Big Area Addtiive Manufacturing. In Proceedings of the Solid Freeform Fabrication Symposium—An Additive Manufacturing Conference, Austin, TX, USA, 8–10 August 2016. [Google Scholar]
  21. Wang, Z.; Liu, R.; Sparks, T.; Liou, F. Large-Scale Deposition System by an Industrial Robot (I): Design of Fused Pellet Modeling System and Extrusion Process Analysis, 3D Print. Addit. Manuf. 2016, 3, 39–47. [Google Scholar]
  22. Wilczynski, K. SSEM: A computer model for a polymer single-screw extrusion. J. Mater. Process. Technol. 2001, 109, 308–313. [Google Scholar]
  23. Tadmor, Z.; Gogos, C.G. Principles of Polymer Processing, 2nd ed.; John Wiley & Sons: Hoboken, NJ, USA, 2013. [Google Scholar]
  24. Altınkaynak, A.; Gupta, M.; Spalding, M.A.; Crabtree, S.L. Melting in a Single Screw Extruder: Experiments and 3D Finite Element Simulations. Int. Polym. Process. 2011, 26, 182–196. [Google Scholar] [CrossRef]
  25. Razeghiyadaki, A.; Zhang, D.; Wei, D.; Perveen, A. Optimization of Polymer Extrusion Die Based on Response Surface Method. Processes 2020, 8, 1043. [Google Scholar] [CrossRef]
  26. Grimard, J.; Dewasme, L.; Vande Wouwer, A. A Review of Dynamic Models of Hot-Melt Extrusion. Processes 2016, 4, 19. [Google Scholar] [CrossRef] [Green Version]
  27. Vera-Sorroche, J.; Kelly, A.; Brown, E.; Coates, P.; Karnachi, N.; Harkin-Jones, E.; Li, K.; Deng, J. Thermal optimisation of polymer extrusion using in-process monitoring techniques. Appl. Therm. Eng. 2013, 53, 405–413. [Google Scholar]
  28. Abeykoon, C.; Kelly, A.; Vera-Sorroche, J.; Brown, E.; Coates, P.; Deng, J.; Li, K.; Harkin-Jones, E.; Price, M. Process efficiency in polymer extrusion: Correlation between the energy demand and melt thermal stability. Appl. Energy 2014, 135, 560–571. [Google Scholar]
  29. Jamarani, R.; Erythropel, H.; Burkat, D.; Nicell, J.; Leask, R.; Maric, M. Rheology of Green Plasticizer/Poly(vinyl chloride) Blends via Time–Temperature Superposition. Processes 2017, 5, 43. [Google Scholar] [CrossRef]
  30. Giles, H.F., Jr.; Wagner, J.R., Jr.; Mount, E.M., III. Extrusion: The Definitive Processing Guide and Handbook; William Andrew, Inc.: Norwich, NY, USA, 2005. [Google Scholar]
  31. Covas, J.A.; Costa, P. A miniature extrusion line for small scale processing studies. Polym. Test. 2004, 23, 763–773. [Google Scholar]
  32. Bruker, I.; Balch, G.S. Melting Mechanism in Single Screw Extrusion. Polym. Eng. Sci. 1989, 29, 258–267. [Google Scholar] [CrossRef]
  33. Rauwendaal, C. An improved analytical melting theory. Adv. Polym. Tech. 1989, 9, 331–336. [Google Scholar]
  34. Rauwendaal, C. Dispersed solids melting theory. In Proceedings of the Society of Plastics Engineers, Annual Technical Conference—ANTEC, New Orleans, LA, USA, 9–13 May 1993; pp. 2232–2237. [Google Scholar]
  35. Hyvärinen, M.; Jabeen, R.; Kärki, T. The Modelling of Extrusion Processes for Polymers—A Review. Polymers 2020, 12, 1306. [Google Scholar]
  36. Christiano, J.P.; Davis Standard, L.; Pawcatuck, C. Examination of the performance of a high-speed single screw extruder for several different extrusion applications. In Proceedings of the Annual Technical Conference—ANTEC, Orlando, FL, USA, 2–4 April 2012; pp. 1029–1034. [Google Scholar]
  37. Agur, E.E.; Vlachopoulos, J. Numerical Simulation of a Single-Screw Plasticating Extruder. Polym. Eng. Sci. 1982, 22, 1084–1094. [Google Scholar] [CrossRef]
  38. Edmondson, I.R.; Fenner, R.T. Melting of Thermoplastics in Single Screw Extruders. Polymer 1975, 16, 49–56. [Google Scholar] [CrossRef]
  39. Mount, E.M.; Chung, C.I. Melting Behavior of Solid Polymers on a Metal Surface at Processing Conditions. Polym. Eng. Sci. 1978, 18, 711–720. [Google Scholar] [CrossRef]
  40. Mount, E.M., III; Watson, J.G., III; Chung, C.I. Analytical Melting Model for Extrusion: Melting Rate of Fully Compacted Solid Polymers. Polym. Eng. Sci. 1982, 22, 729–737. [Google Scholar] [CrossRef]
  41. Mount, E.M. M. Impact of Rheological Properties on Melting Rate Calculations. In Proceedings of the Society of Plastics Engineers, Annual Technical Conference—ANTEC, Boston, MA, USA, 1–4 May 2005; Volume 1, pp. 328–334. [Google Scholar]
  42. Tadmor, Z. Fundamentals of Plasticating Extrusion. I. A Theoretical Model for Melting. Polym. Eng. Sci. 1966, 6, 185–190. [Google Scholar] [CrossRef]
  43. Tadmor, Z.; Duvdevani, I.; Klein, I. Melting in Plasticating Extruders–Theory and Experiments. Polym. Eng. Sci. 1967, 7, 198–217. [Google Scholar] [CrossRef]
  44. Shapiro, J.; Halmos, A.L.; Pearson, J.R.A. Melting in Single Screw Extruders. Polymer 1976, 17, 905–918. [Google Scholar] [CrossRef]
  45. Sundstrom, D.W.; Young, C.C. Melting Rates of Crystalline Polymers under Shear Conditions. Polym. Eng. Sci. 1972, 12, 59–63. [Google Scholar] [CrossRef]
  46. Maddock, B. A visual analysis of flow and mixing in extruder screws. SPE ANTEC Tech. Papers 1959, 15, 383–389. [Google Scholar]
  47. Vermeulen, J.R.; Gerson, P.M.; Beek, W.J. The Melting of a Bed of Polymer Granules on a Hot Moving Surface. Chem. Eng. Sci. 1971, 26, 1445–1455. [Google Scholar] [CrossRef]
  48. Vermeulen, J.R.; Scargo, P.G.; Beek, W.J. The Melting of a Crystalline Polymer in a Screw Extruder. Chem. Eng. Sci. 1971, 26, 1457–1465. [Google Scholar] [CrossRef]
  49. Syrjala, S. A New Approach for the Simulation of Melting in Extruders. Int. Comm. Heat Mass Transf. 2000, 27, 623–634. [Google Scholar] [CrossRef]
  50. Pearson, J.R.A. Heat transfer in flowing polymers Progress in Heat and Mass Transfer. In Selected Papers of the 1970 International Seminar; Elsevier: Amsterdam, The Netherlands, 1972; pp. 73–87. [Google Scholar] [CrossRef]
  51. Coelho, P.; Pinho, F. A generalized brinkman number for non-Newtonian duct flows. J. Nonnewton. Fluid Mech. 2009, 156, 202–206. [Google Scholar]
  52. Winter, H. Viscous Dissipation in Shear Flows of Molten Polymers. Adv. Heat Transf. 1977, 13, 205–267. [Google Scholar] [CrossRef]
  53. Tso, C.; Mahulikar, S. The role of the Brinkman number in analyzing flow transitions in microchannels. Int. J. Heat Mass Transf. 1999, 42, 1813–1833. [Google Scholar]
  54. Williams, M.L.; Landel, R.F.; Ferry, J.D. The Temperature Dependence of Relaxation Mechanisms in Amorphous Polymers and Other Glass-forming Liquids. J. Am. Chem. Soc. 1955, 77, 3701–3707. [Google Scholar] [CrossRef]
  55. Cross, M.M. Rheology of non-Newtonian fluids: a new flow equation for pseudoplastic systems. J. Colloid Sci. 1965, 20, 417–437. [Google Scholar]
  56. Wilczynski, K. A computer model for single screw plasticating extrusion. Polym. Plast. Technol. Eng. 1996, 35, 449–477. [Google Scholar]
  57. Lewandowski, A.; Wilczynski, K.; Wilczynski, K.J.; Nastaj, A. A composite model for an intermeshing counter-rotating twin-screw extruder and its experimental verification. Polym. Eng. Sci. 2015, 55, 2838–2848. [Google Scholar]
  58. Tsukuda, R.; Sumimoto, S.; Ozawa, T. Thermal conductivity and heat capacity of ABS resin composites. J. Appl. Polym. Sci. 1997, 63, 1279–1286. [Google Scholar]
Figure 1. Definitions of x and z directions for the general equations for melt removal by drag.
Processes 08 01522 g001
Figure 2. Polymer melting in the consecutive cross-sections of a micro-extruder; settings in Table 1 (Column 2). The right-hand side illustrates the concept of melt removal by drag. Blue, solid; red, molten. Melting is done once the solid bed width (X) vanishes.
Processes 08 01522 g002
Figure 3. (a) Variation of velocities in compression and metering section for micro-extrusion (ME) case (blue full line, material properties, dimensions and settings from Table 1, Column 2 and conventional/standard extrusion (SE) case with same screw speed and barrel temperature (red dashed line, material properties, dimensions and settings from Table 1, Column 3; (b) corresponding variation of shear rates that are in the compression section defined based on the relative velocity and the melt layer thickness and in the metering section (strictly as soon as the melting is done) based on the total channel height and the drag flow definition; (c) the associated variation of viscosity; and (d) the associated variation of the Brinkman number.
Processes 08 01522 g003
Figure 4. Extra information for Figure 3 regarding: (a) melting efficiency parameter Φ; (b) melt film layer thickness δ; and (c) solid bed profile. In (b), the overall average melt layer thickness ( δ ¯ ) is also provided as horizontal lines.
Processes 08 01522 g004
Figure 5. Relevance of model with explicit melt layer thickness variation versus an average one (either evaluation at initial value (orange dashed line) or actual overall average of detailed simulation (brown dashed line)): (a) solid bed profile; and (b) Brinkman number. The case of micro-extruder in Figure 3 and Figure 4.
Processes 08 01522 g005
Figure 6. (a) Variation of velocities in compression and metering section for micro-extrusion (ME) case (blue full line, material properties, dimensions and settings from Table 1, Column 2 and conventional/standard extrusion (SE) case with same screw speed and barrel temperature (red dashed line, material properties, dimensions and settings from Table 1, Column 4; (b) corresponding variation of shear rates that are in the compression section defined based on the relative velocity and the melt layer thickness and in the metering section (strictly as soon as the melting is done) based on the total channel height and the drag flow definition; (c) the associated variation of viscosity; and (d) the associated variation of the Brinkman number.
Processes 08 01522 g006
Figure 7. (a) Melting profile for different barrel temperatures considering otherwise the micro-extrusion settings and material parameters of Table 1 (Column 2); and (b) associated Brinkman numbers. Blue (reference) lines as in Figure 4.
Processes 08 01522 g007
Figure 8. (a) Melting profile; and (b) Brinkman number for different screw frequencies under flood feeding considering otherwise the micro-extrusion settings and material parameters of Table 1 (Column 2). Blue (reference) lines as in Figure 4.
Processes 08 01522 g008
Figure 9. (a) Melting profile; and (b) Brinkman number for different compression ratios (C.R. values) considering otherwise the micro-extrusion settings and material parameters of Table 1 (Column 2). Blue (reference) lines as in Figure 4.
Processes 08 01522 g009
Figure 10. (a) Melting profile; (b) variation of Brinkman number; (c) velocity in the x direction Vbx; (d) melt layer thickness δ; and (e) viscosity for different pitch angles considering otherwise the micro-extrusion settings and material parameters of Table 1 (Column 2). Blue (reference) lines as in Figure 4.
Processes 08 01522 g010
Figure 11. (a) Melting profile; and (b) Brinkman number for different polymer solid densities considering otherwise the micro-extrusion settings and material parameters of Table 1 (Column 2). Blue (reference) lines as in Figure 4.
Processes 08 01522 g011
Figure 12. (a) Melting profile; (b) Brinkman number; and (c) melt layer thickness δ for different specific heat capacities (both solid and melt) considering otherwise the micro-extrusion settings and material parameters of Table 1 (Column 2). Blue (reference) lines as in Figure 4.
Processes 08 01522 g012
Figure 13. Variations of (a) the thermal conductivity and (b) specific heat capacities due to the temperature dependencies in (c), also displaying in blue the micro-extrusion reference case results in Table 1 with constant thermochemical properties (423 K always).
Processes 08 01522 g013
Figure 14. For the micro-extrusion settings in Figure 13: (a) melt profile; (b) the variation of the Brinkman number; (c) the melt layer thickness; and (d) the viscosity. Blue lines are for the reference case in Table 1 with constant physicochemical properties. T.D., temperature dependent.
Processes 08 01522 g014
Table 1. Reference equipment dimensions and operational parameters as well as the ABS material parameters for one micro-extruder and two standard extruders with one having the same screw speed and barrel temperature as with micro-extrusion.
Extruder DimensionsMicro Extruder (This Work)Standard Extruder SE I (This Work)Standard Extruder SE II
(Altınkaynak et al. 2011)
Unit
Axial length 662 13331333(mm)
-Feeding (helical length)28012451245(mm)
-Compression (helical length)27416721672(mm)
-Metering (helical length)10814631463(mm)
Screw diameter—initial2863.563.5(mm)
Screw diameter—final 1663.5 63.5 (mm)
Helical length 69043804380(mm)
H—Channel depth—initial68.898.89(mm)
H—Channel depth—final23.183.18(mm)
W—Channel width165353(mm)
θ—Pitch angle 0.3080.3080.308(rad)
Axial length 662 13331333(mm)
-Feeding (helical length)28012451245(mm)
Operational parameters
Q—Volumetric Flow rate8.6 × 10−41.43 × 10−25.7 × 10−2(m 3 h−1)
N—Screw Speed151560(rpm)
Tb—Barrel Temperature473 473503(K)
Material parameters
D1—Material parameter Cross-WLF3.6 × 10113.6 × 10113.6 × 1011(Pa s)
A1—Material parameter Cross-WLF27.227.227.2(-)
A2—Material parameter Cross-WLF92.692.692.6(-)
Ta—Material parameter Cross-WLF373373373(K)
τ * —Critical stress at the transition to shear thinning290002900029000(Pa)
γ c r —Critical shear rate 1.1 × 10−11.1 × 10−13.8 × 10⁻¹(s −1)
n—Power-law index0.330.330.33(-)
ρs—Density (solid)105010501050(kg m −3)
ρm—Density (melt)940940940(kg m −3)
cs—Specific heat capacity 23502350 2350 (J kg −1 K −1]
k—Thermal conductivity 0.180.180.18(W m −1 K −1)
λ —Heat of fusion000(J kg −1)
Tm—Melt Temperature423423423(K)
T0—Initial polymer Temperature 300300300(K)
Table 2. Overview of individual effects for finalization melting.
VariableEntity of the Variation [%]Variation in the Complete Melting Point Position [%] Variation in Br at the Beginning of the Compression Section [%]
Barrel temperature+10 +0.3−51.5
−10−1.8+173.0
Screw frequency+33 −12.8+9.2
−33+9.3−13.2
Compression ratio+33−15.30
−33+11.20
Pitch angle+20−5.6−6.4
−20+6.5+8.3
Volumetric feeding rate +15+12.8+4.8
−15−11.4−3.2
Channel width+10+2.9+3.5
−10−3.2−3.8
Density+15+5.5−6.7
−15−6.5+10.2
Specific heat capacity+10 +3.8−5.1
−10−4.2+7.7
Thermal conductivity+20−4.9−13.2
−20+6.0+20.9
Power-law index +20 −15.3+74.6
−20+11.2−37.3
Publisher’s Note: MDPI stays neutral with regard to jurisdictional claims in published maps and institutional affiliations.

