Impact of Process Parameters and Bulk Properties on Quality of Dried Hops

 and
and
Abstract
1. Introduction
2. Materials and Methods
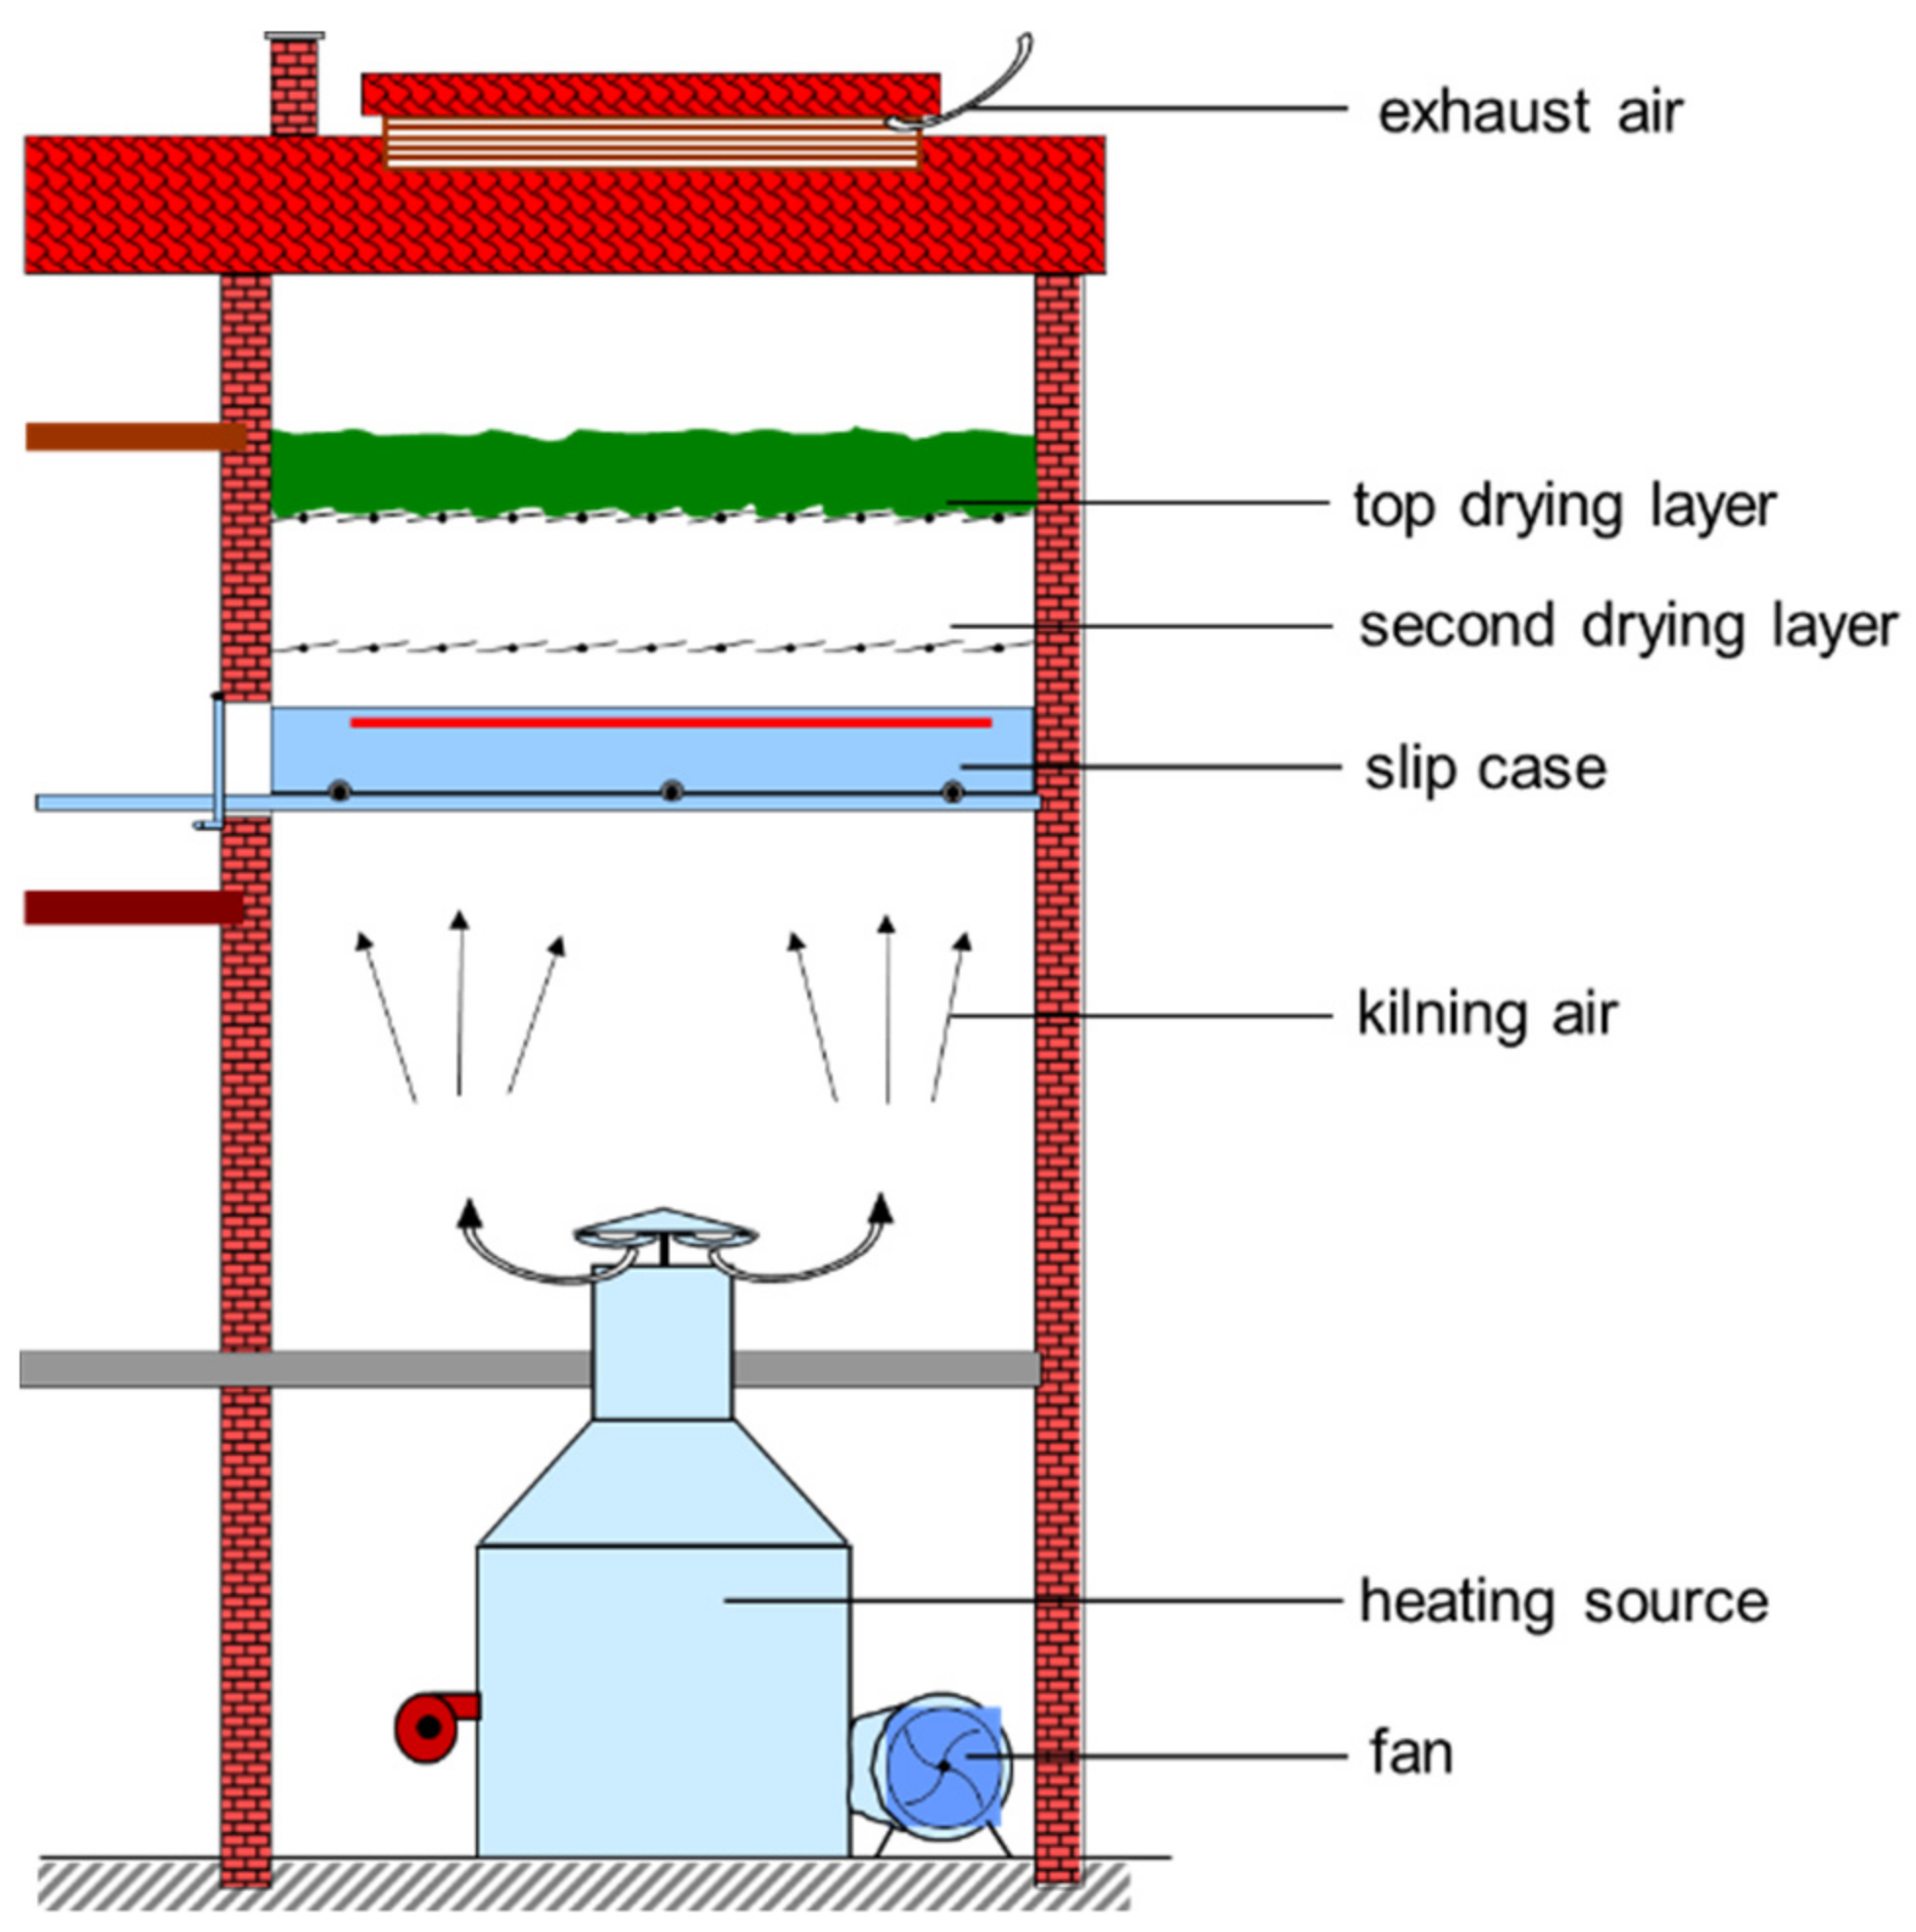
2.1. Dryer
2.2. Sampling
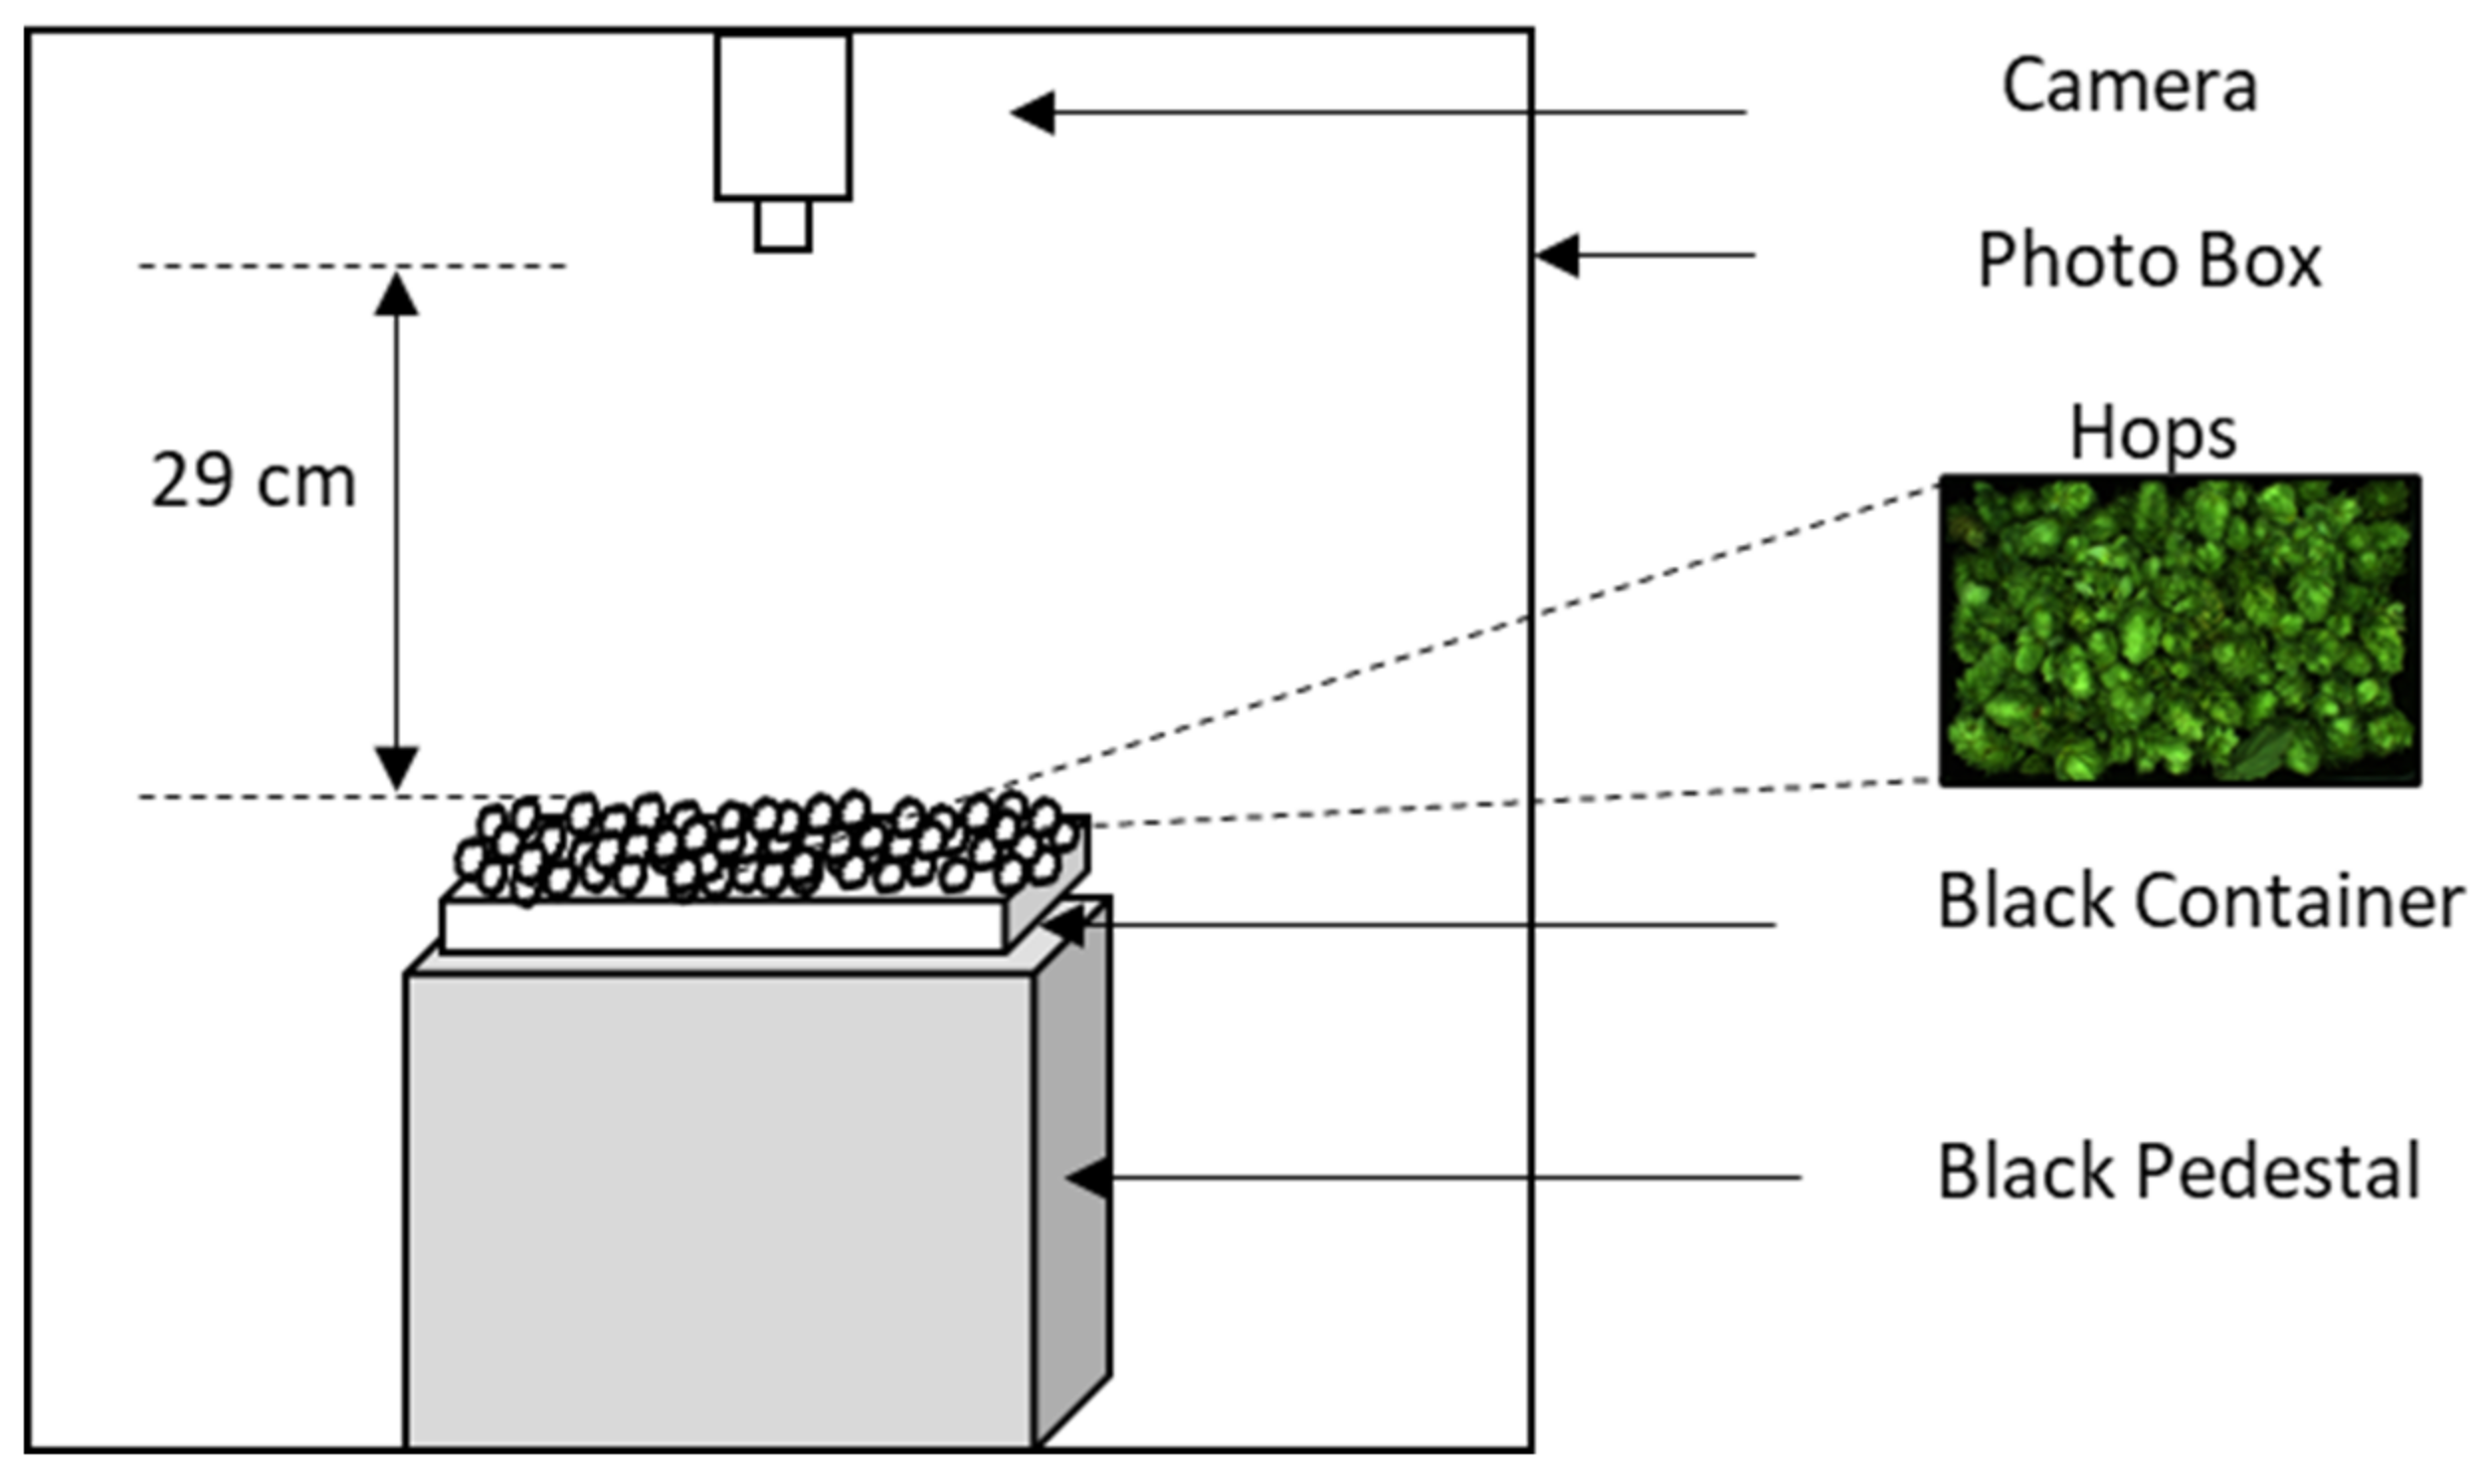
2.3. Imaging
2.4. Gas Chromatography
2.5. Energy Consumption
3. Results and Discussion
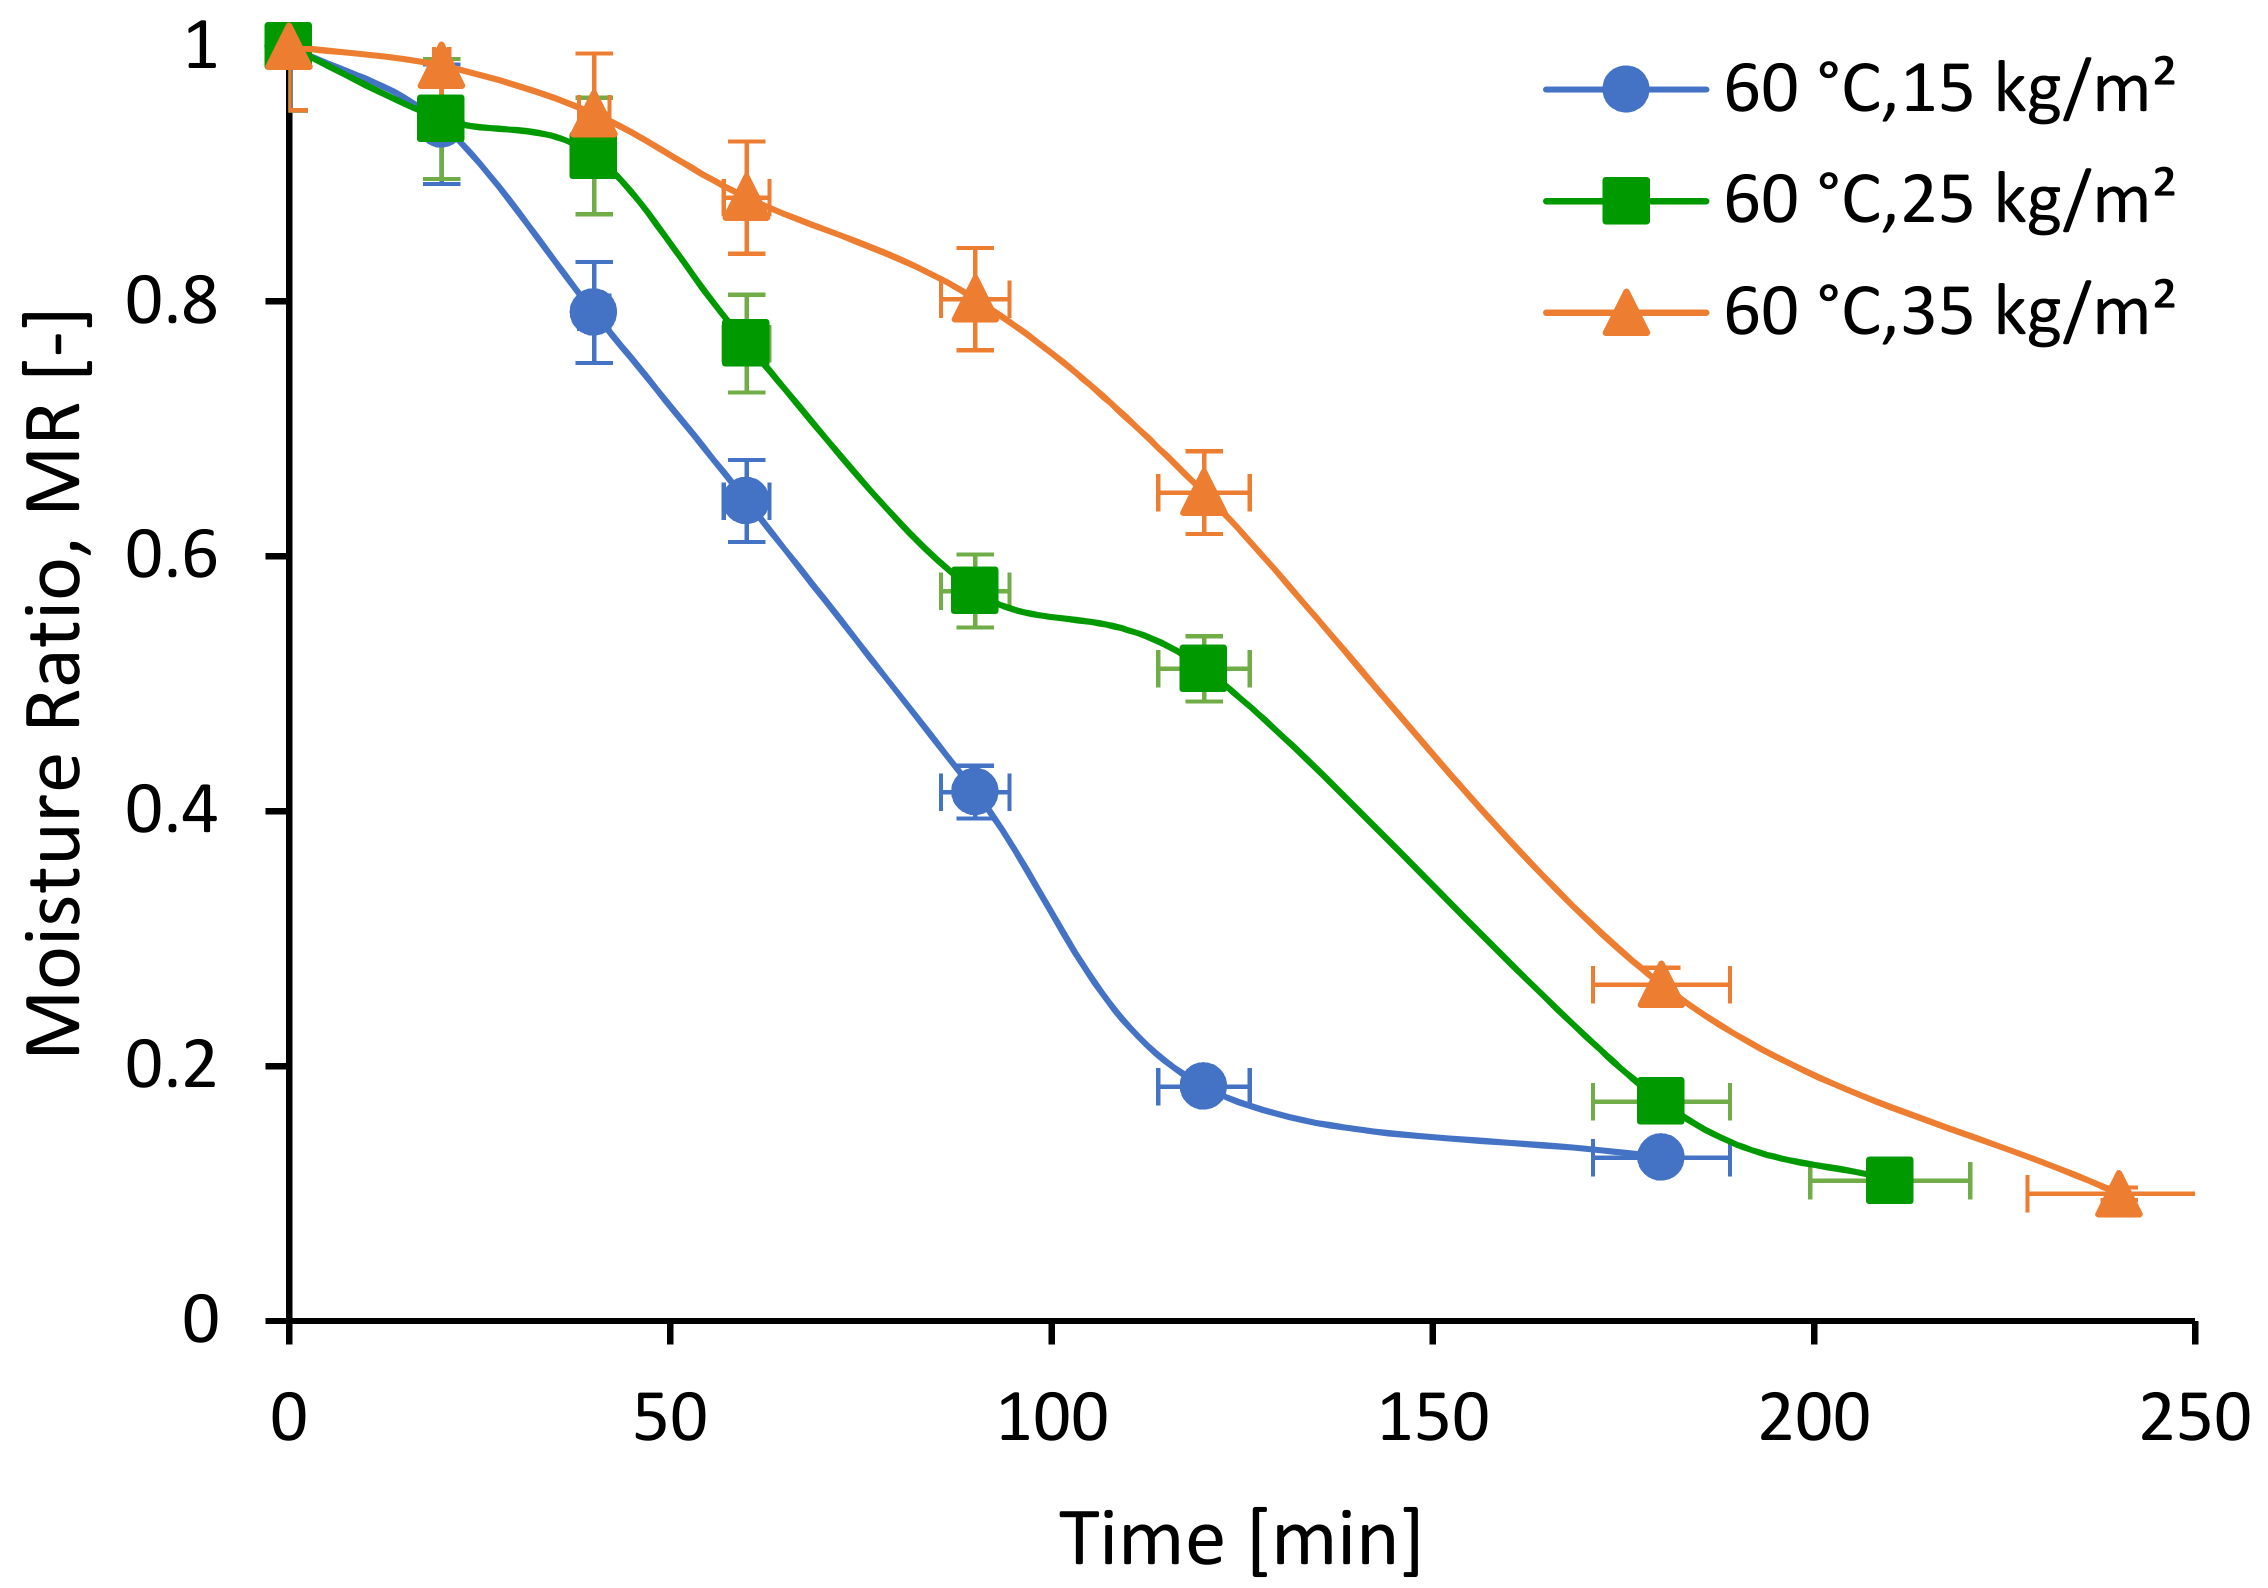
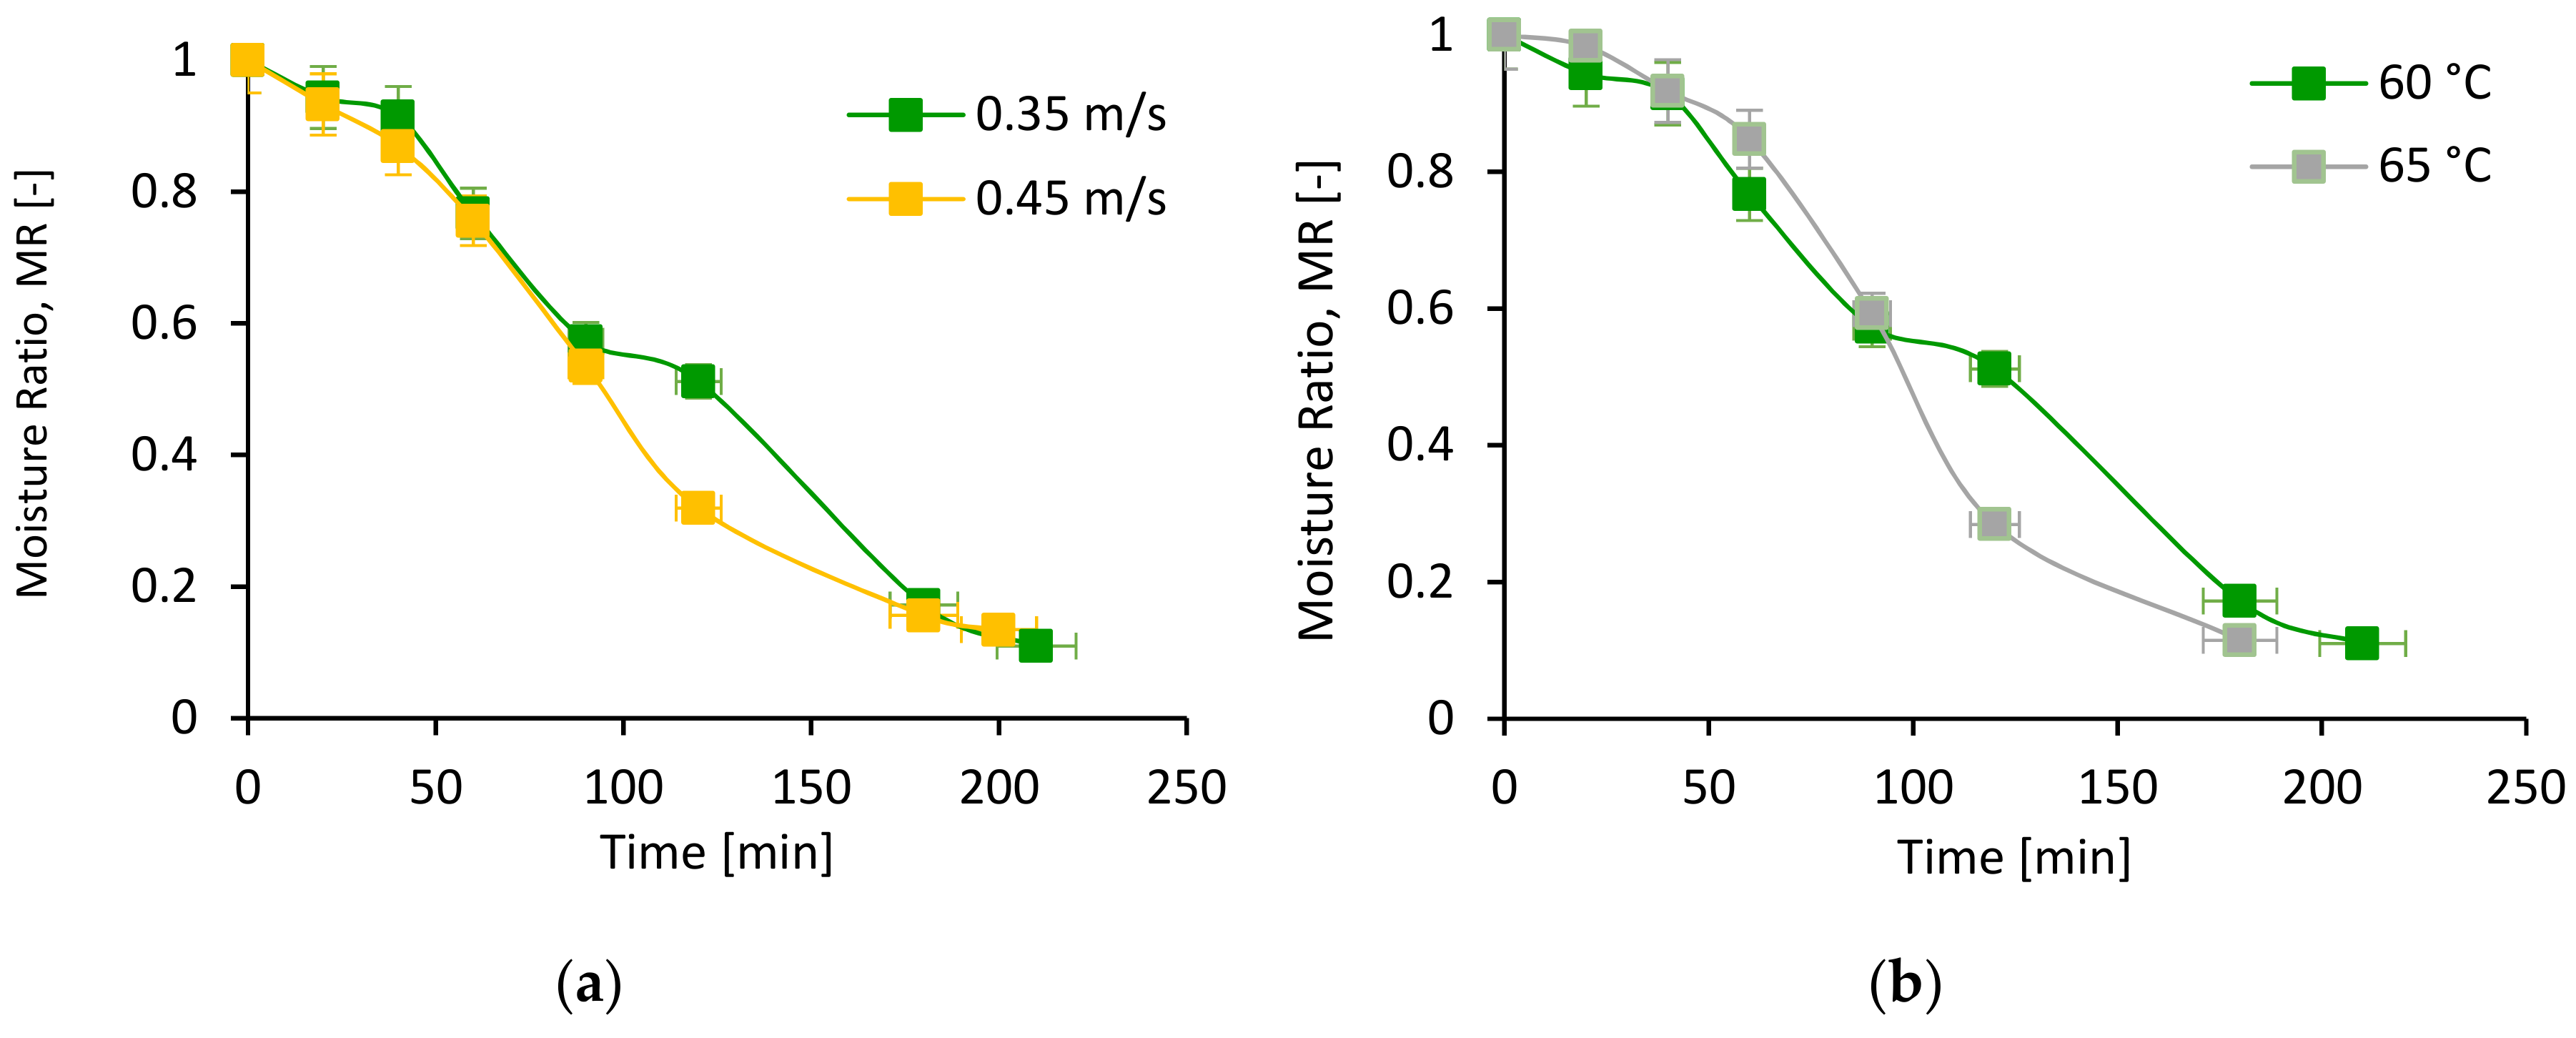
3.1. Drying Behavior
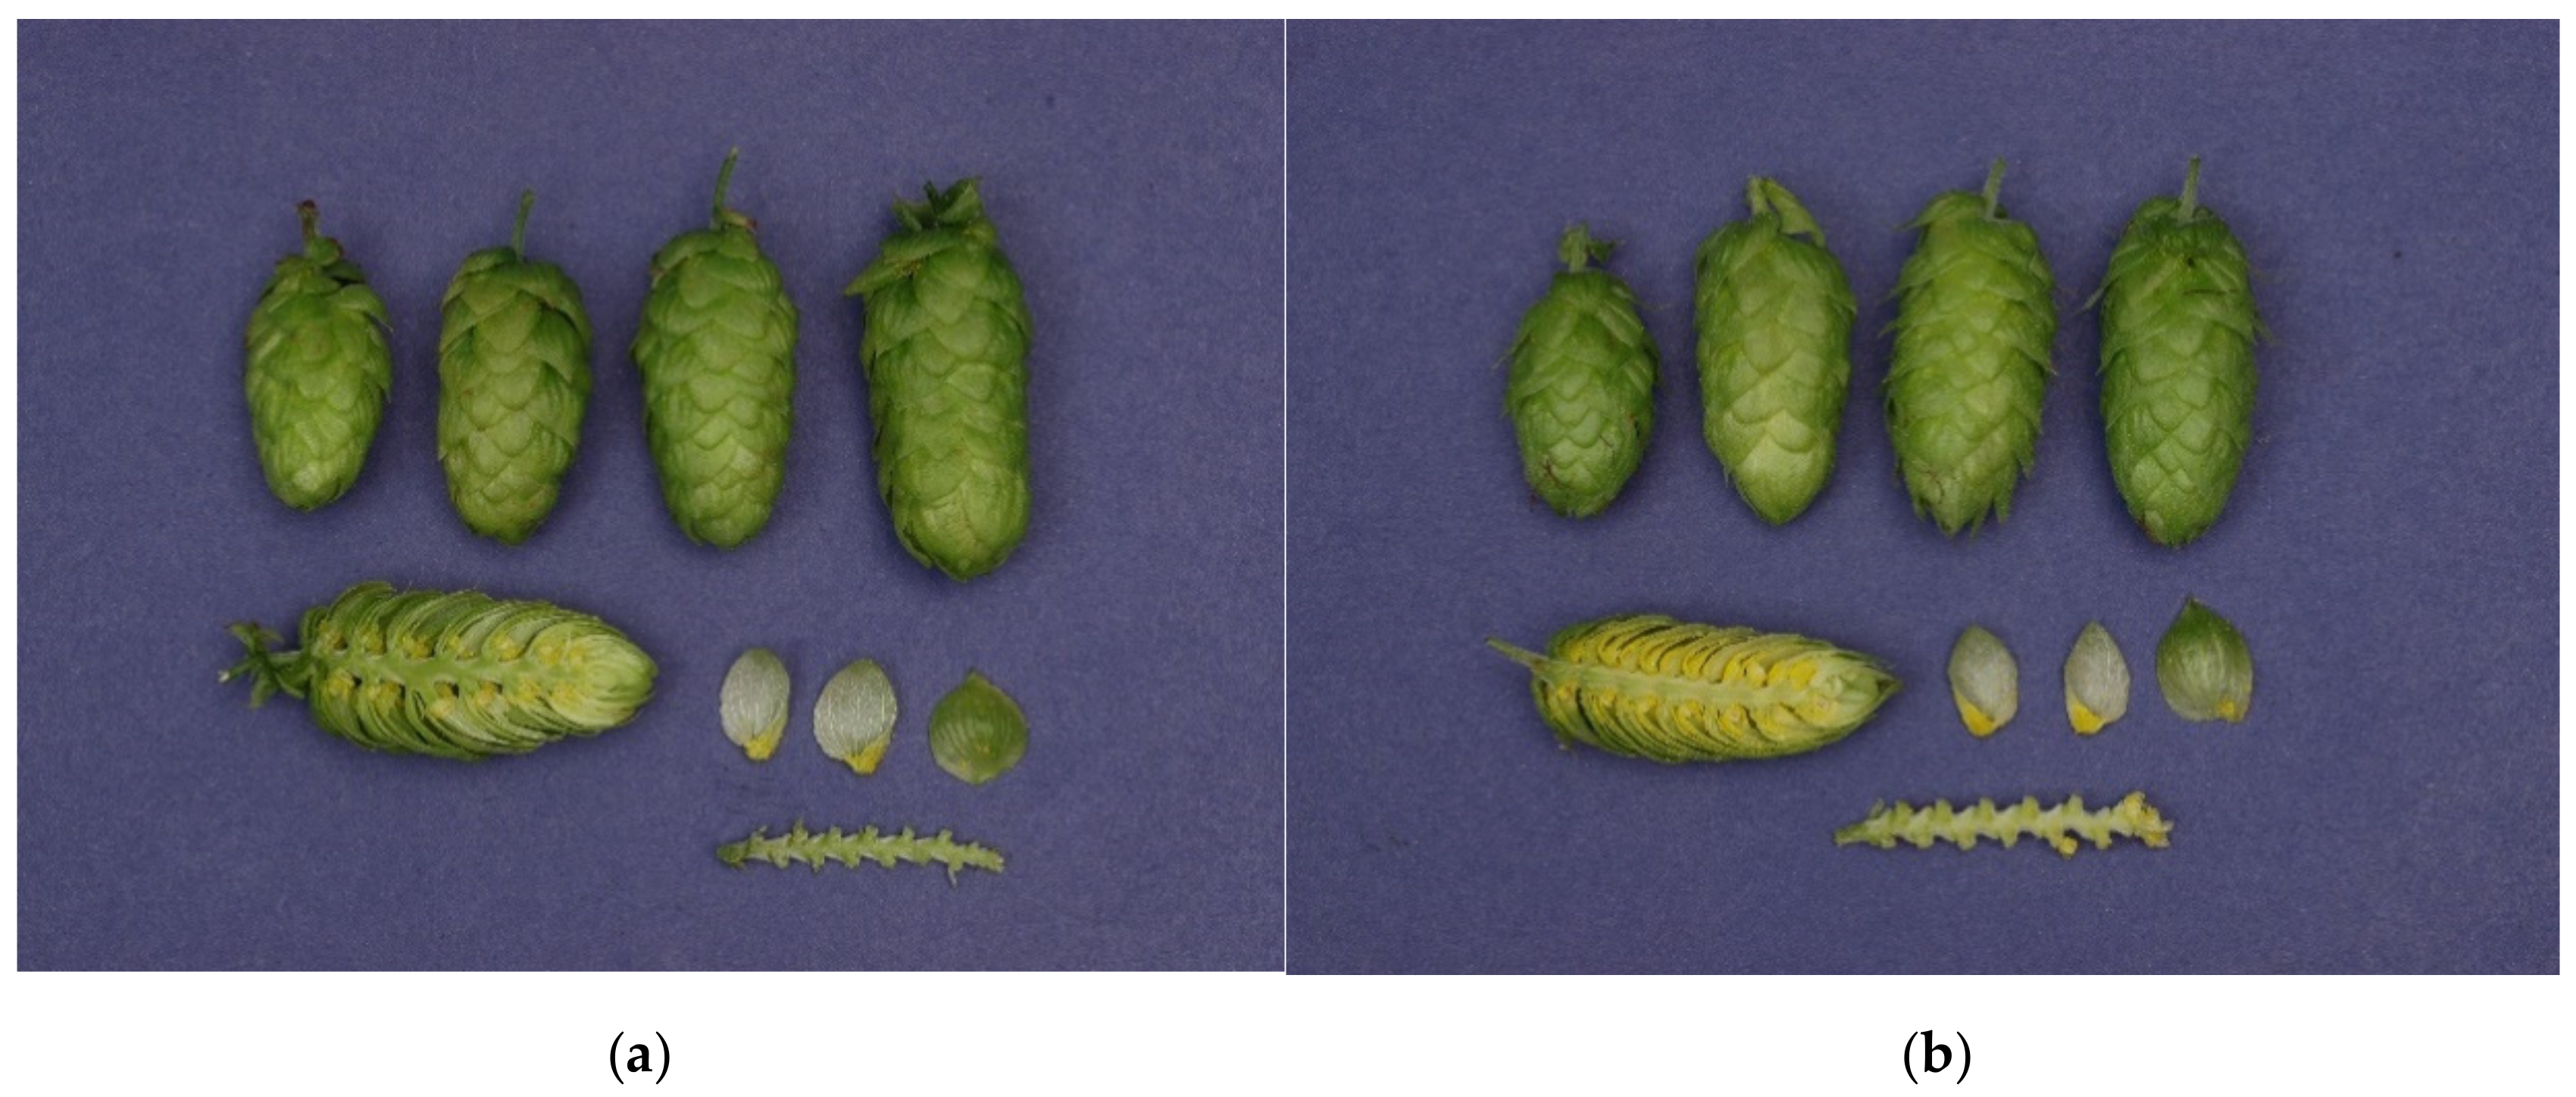
3.2. Hop Cone Size
3.3. Chemical Analysis
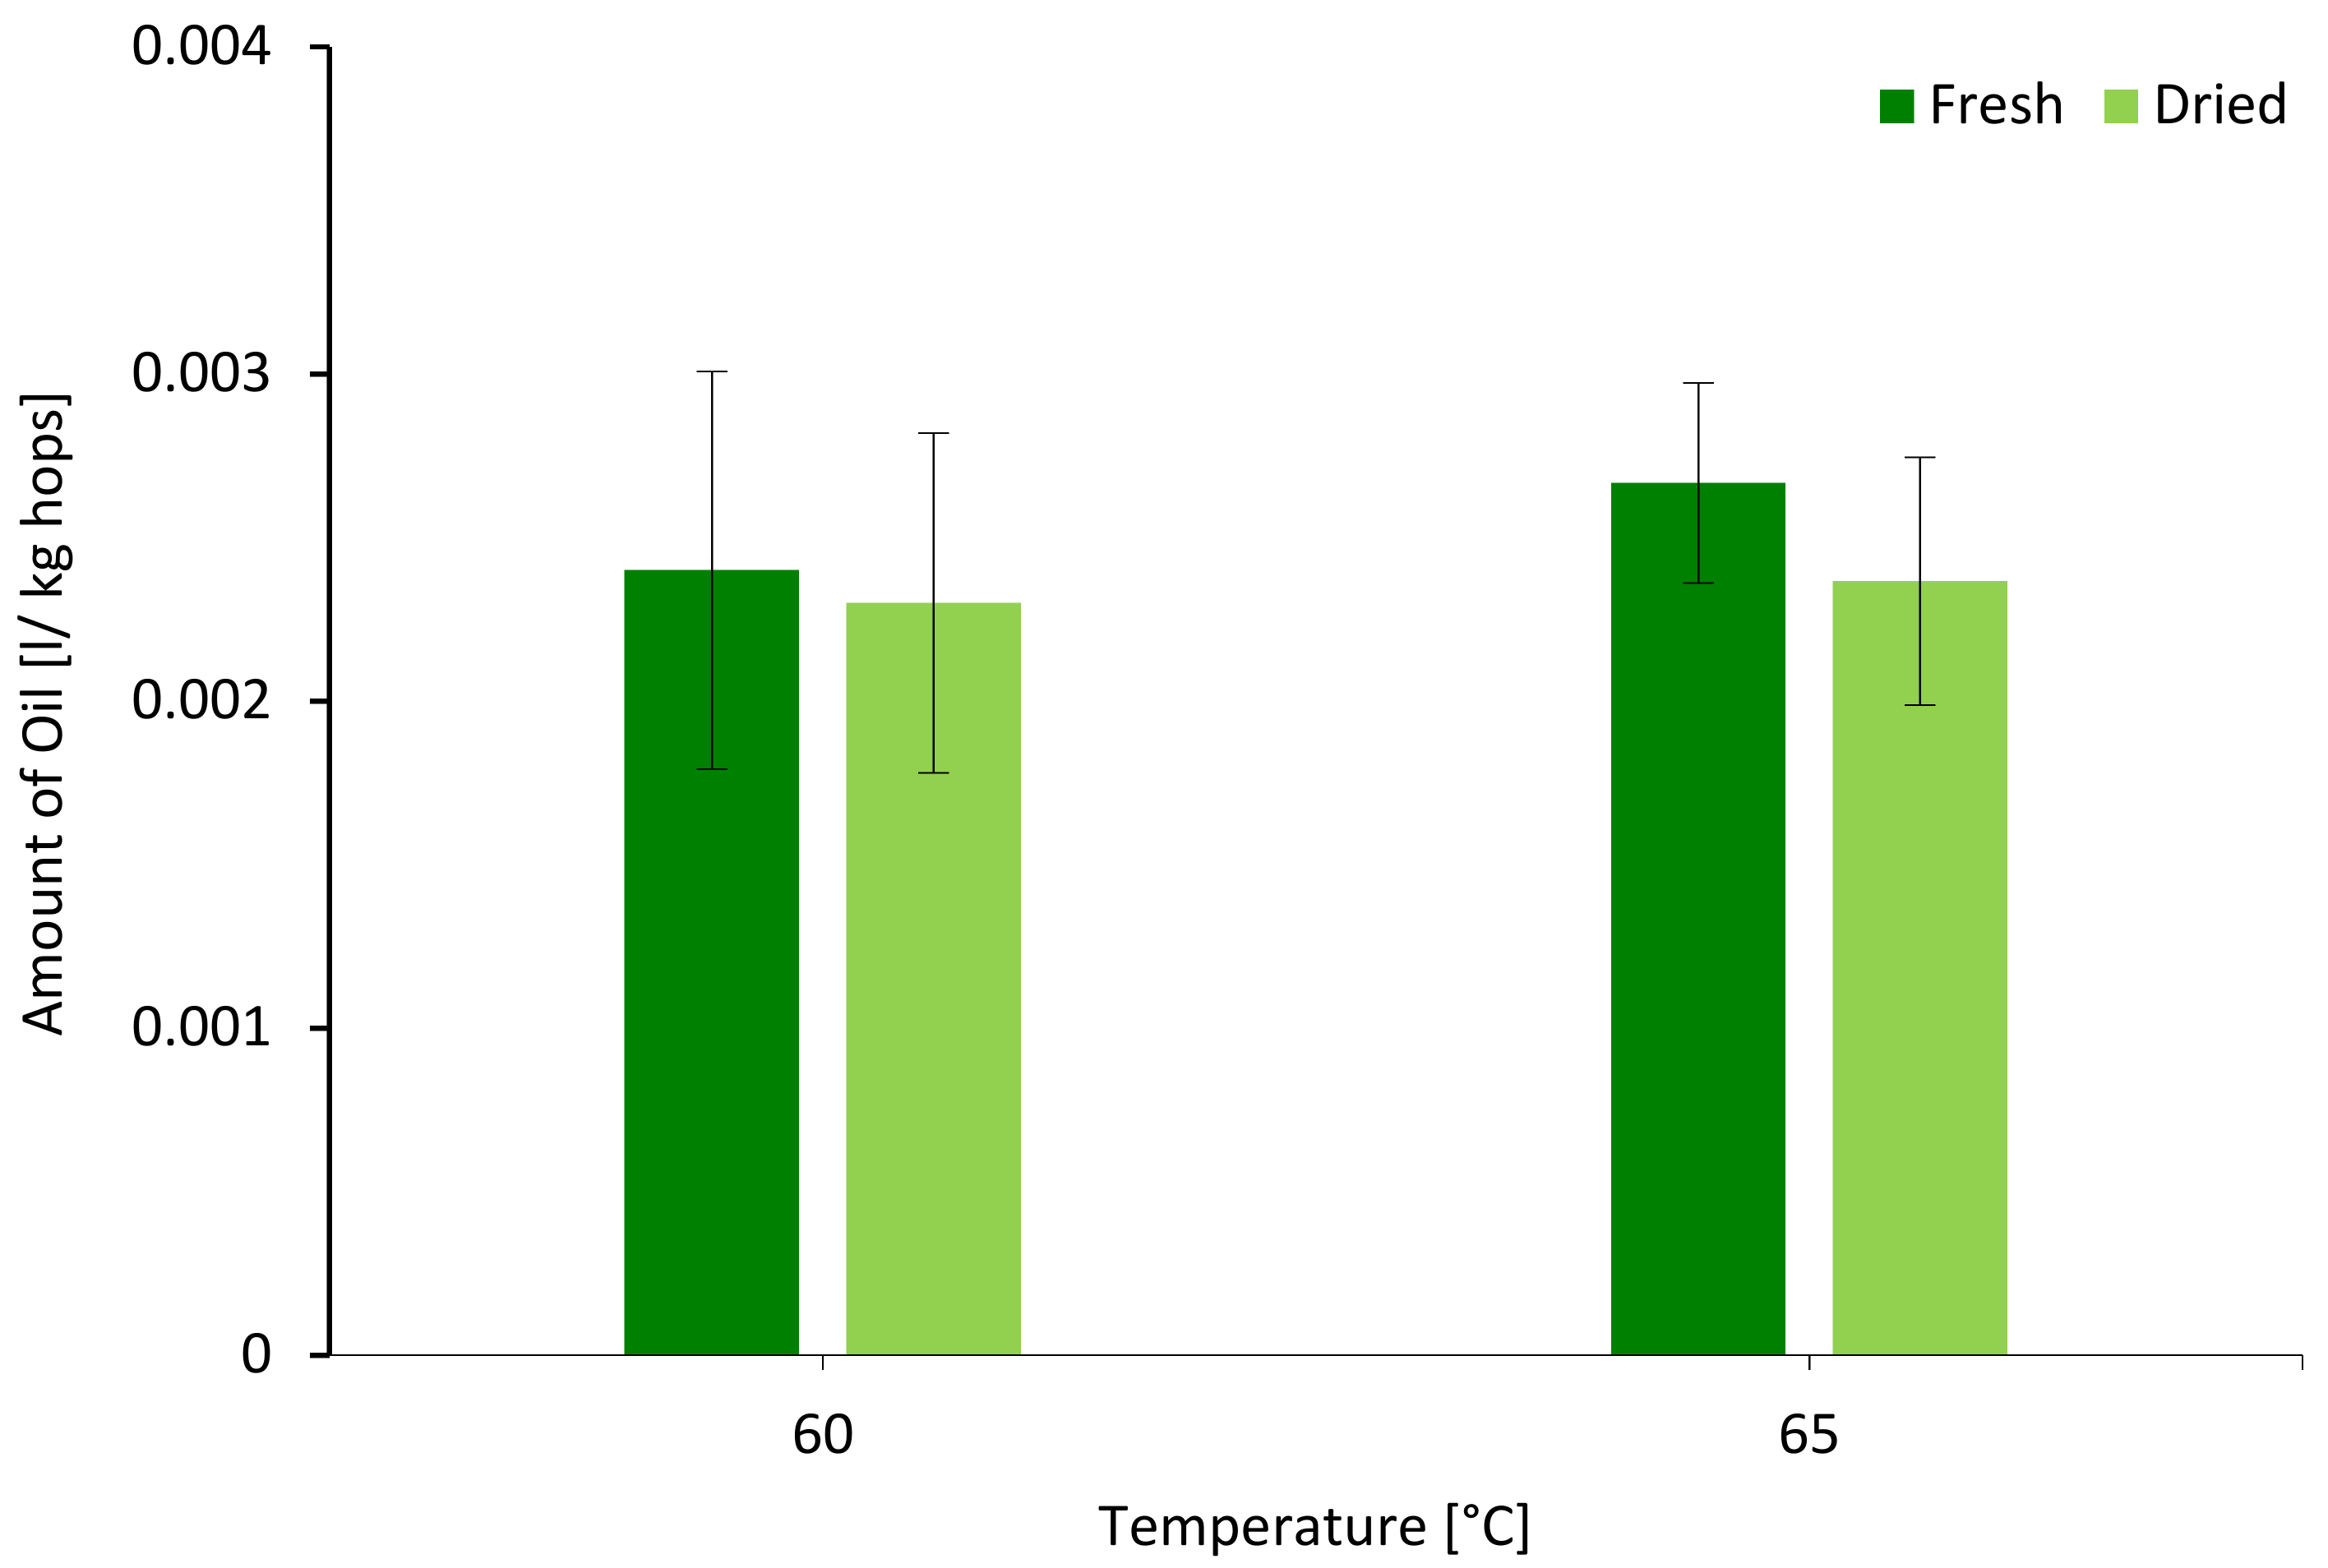
3.3.1. Oil Content
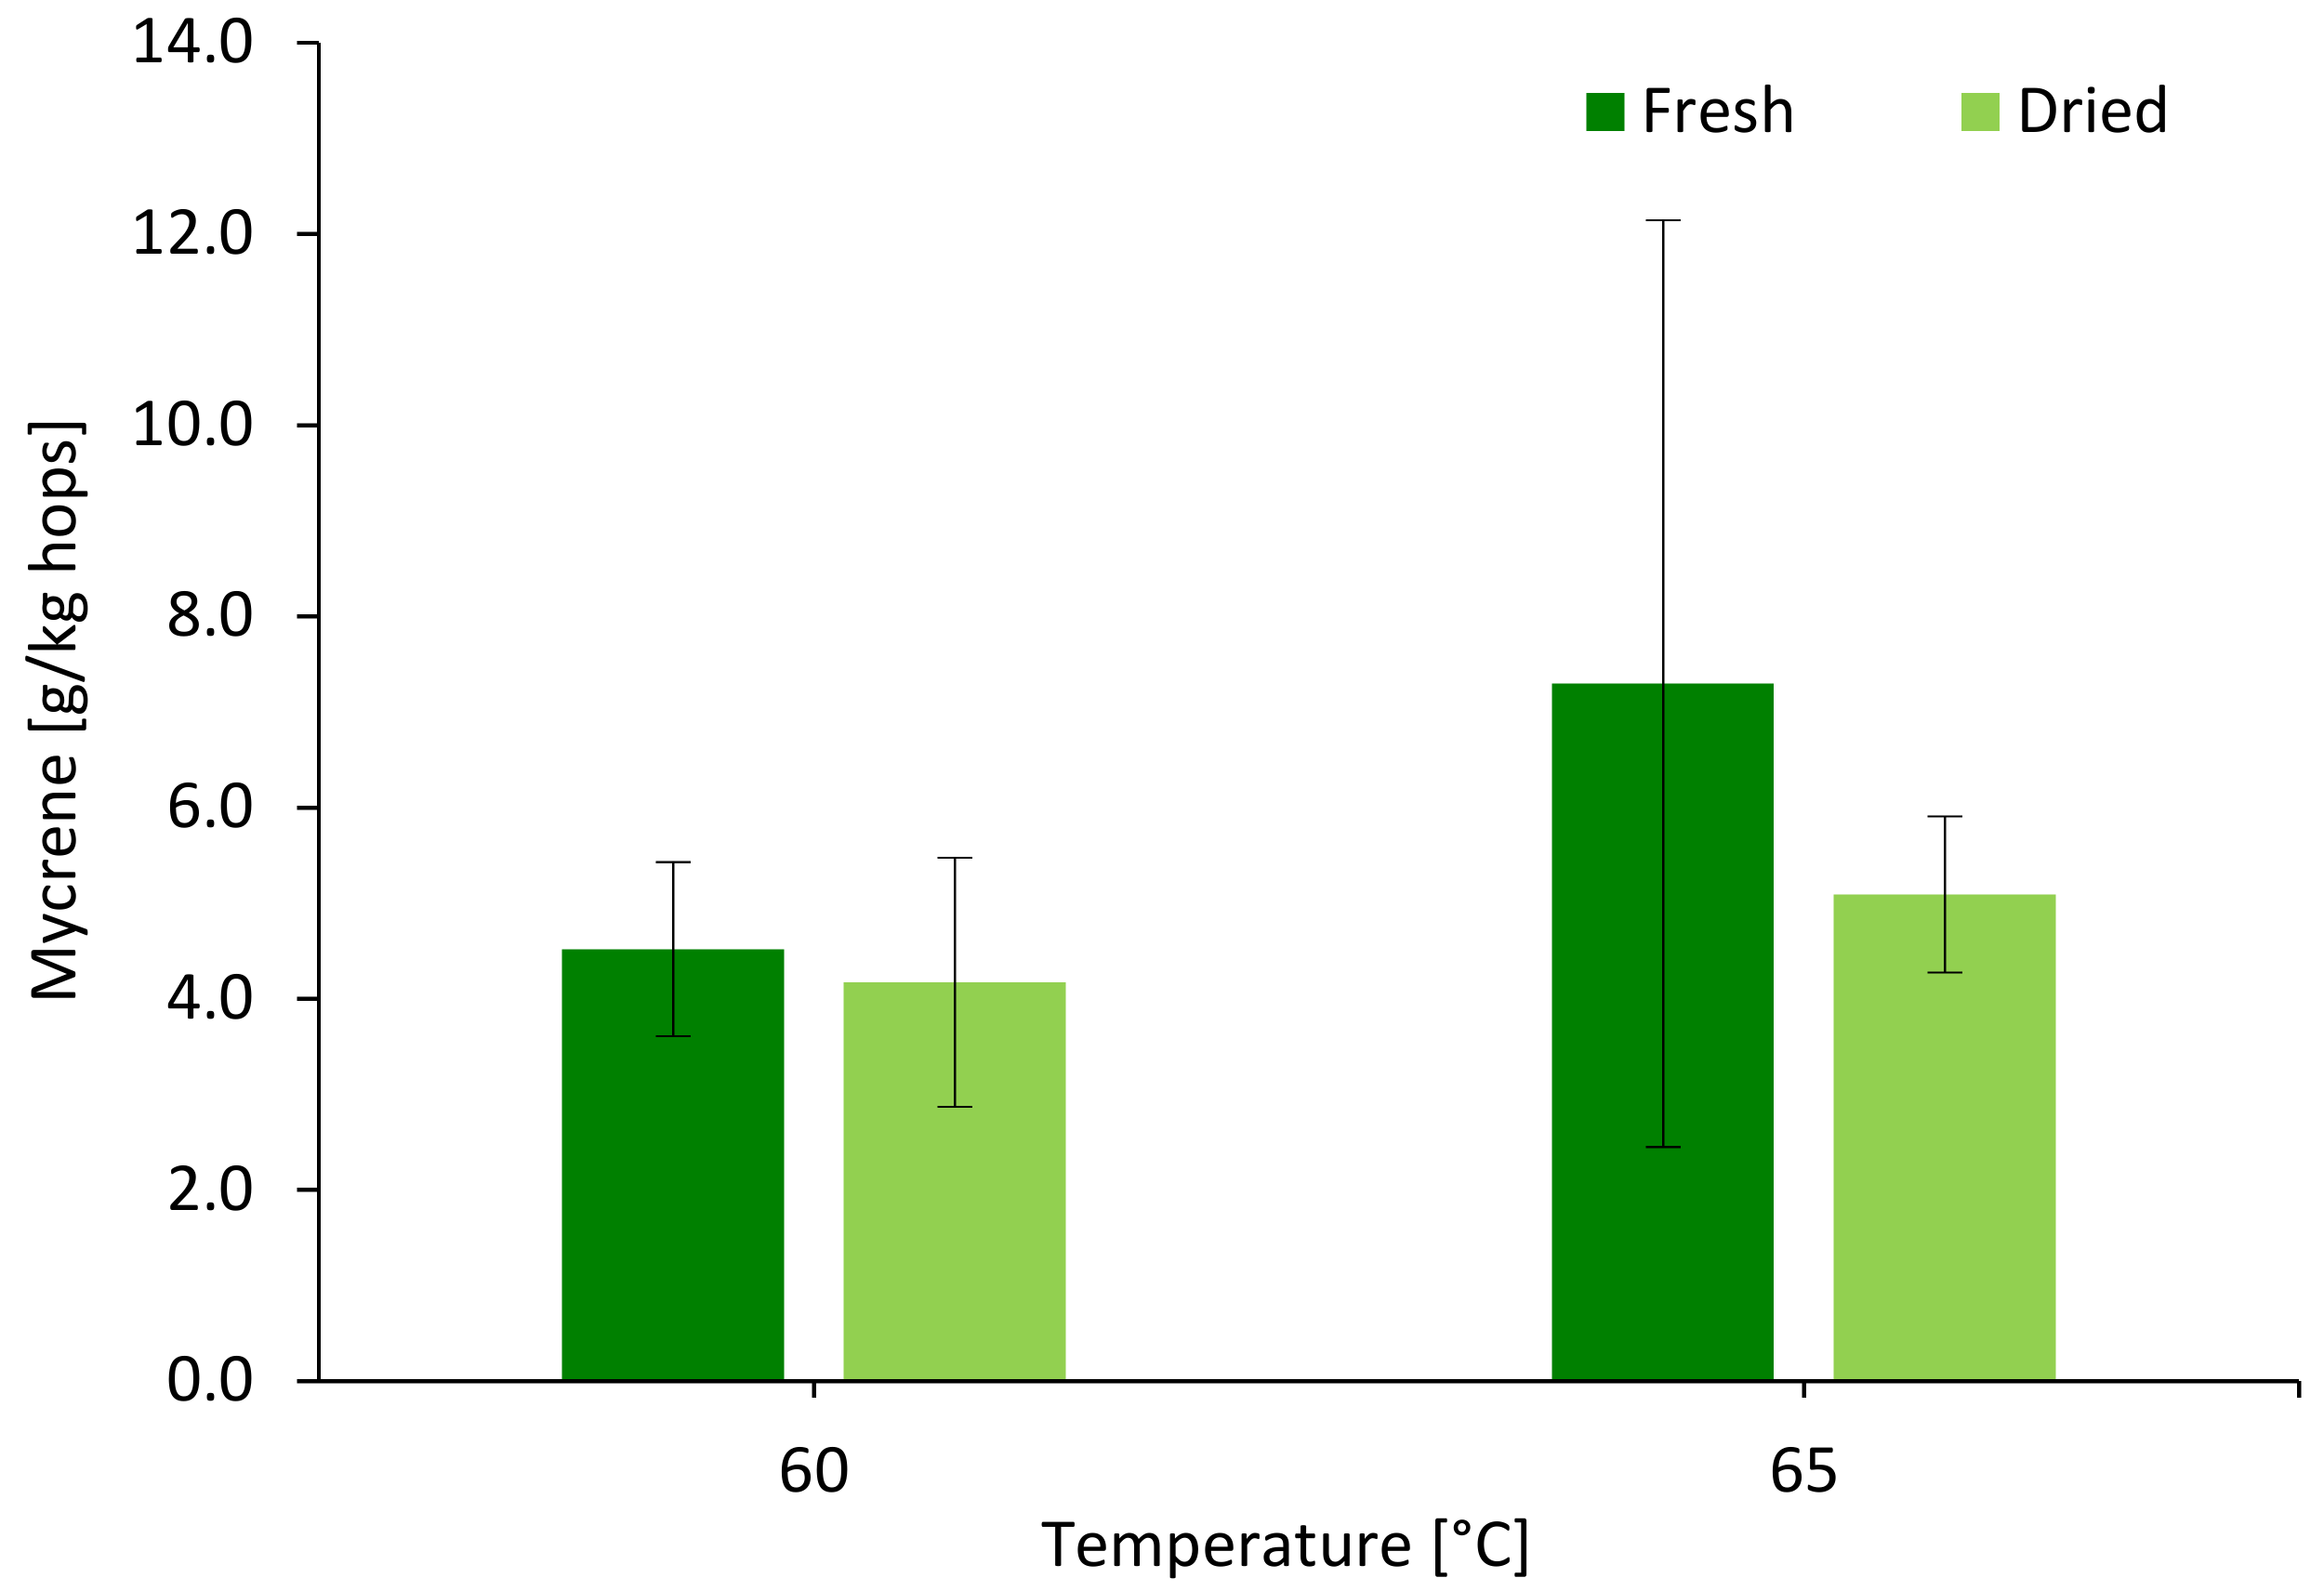
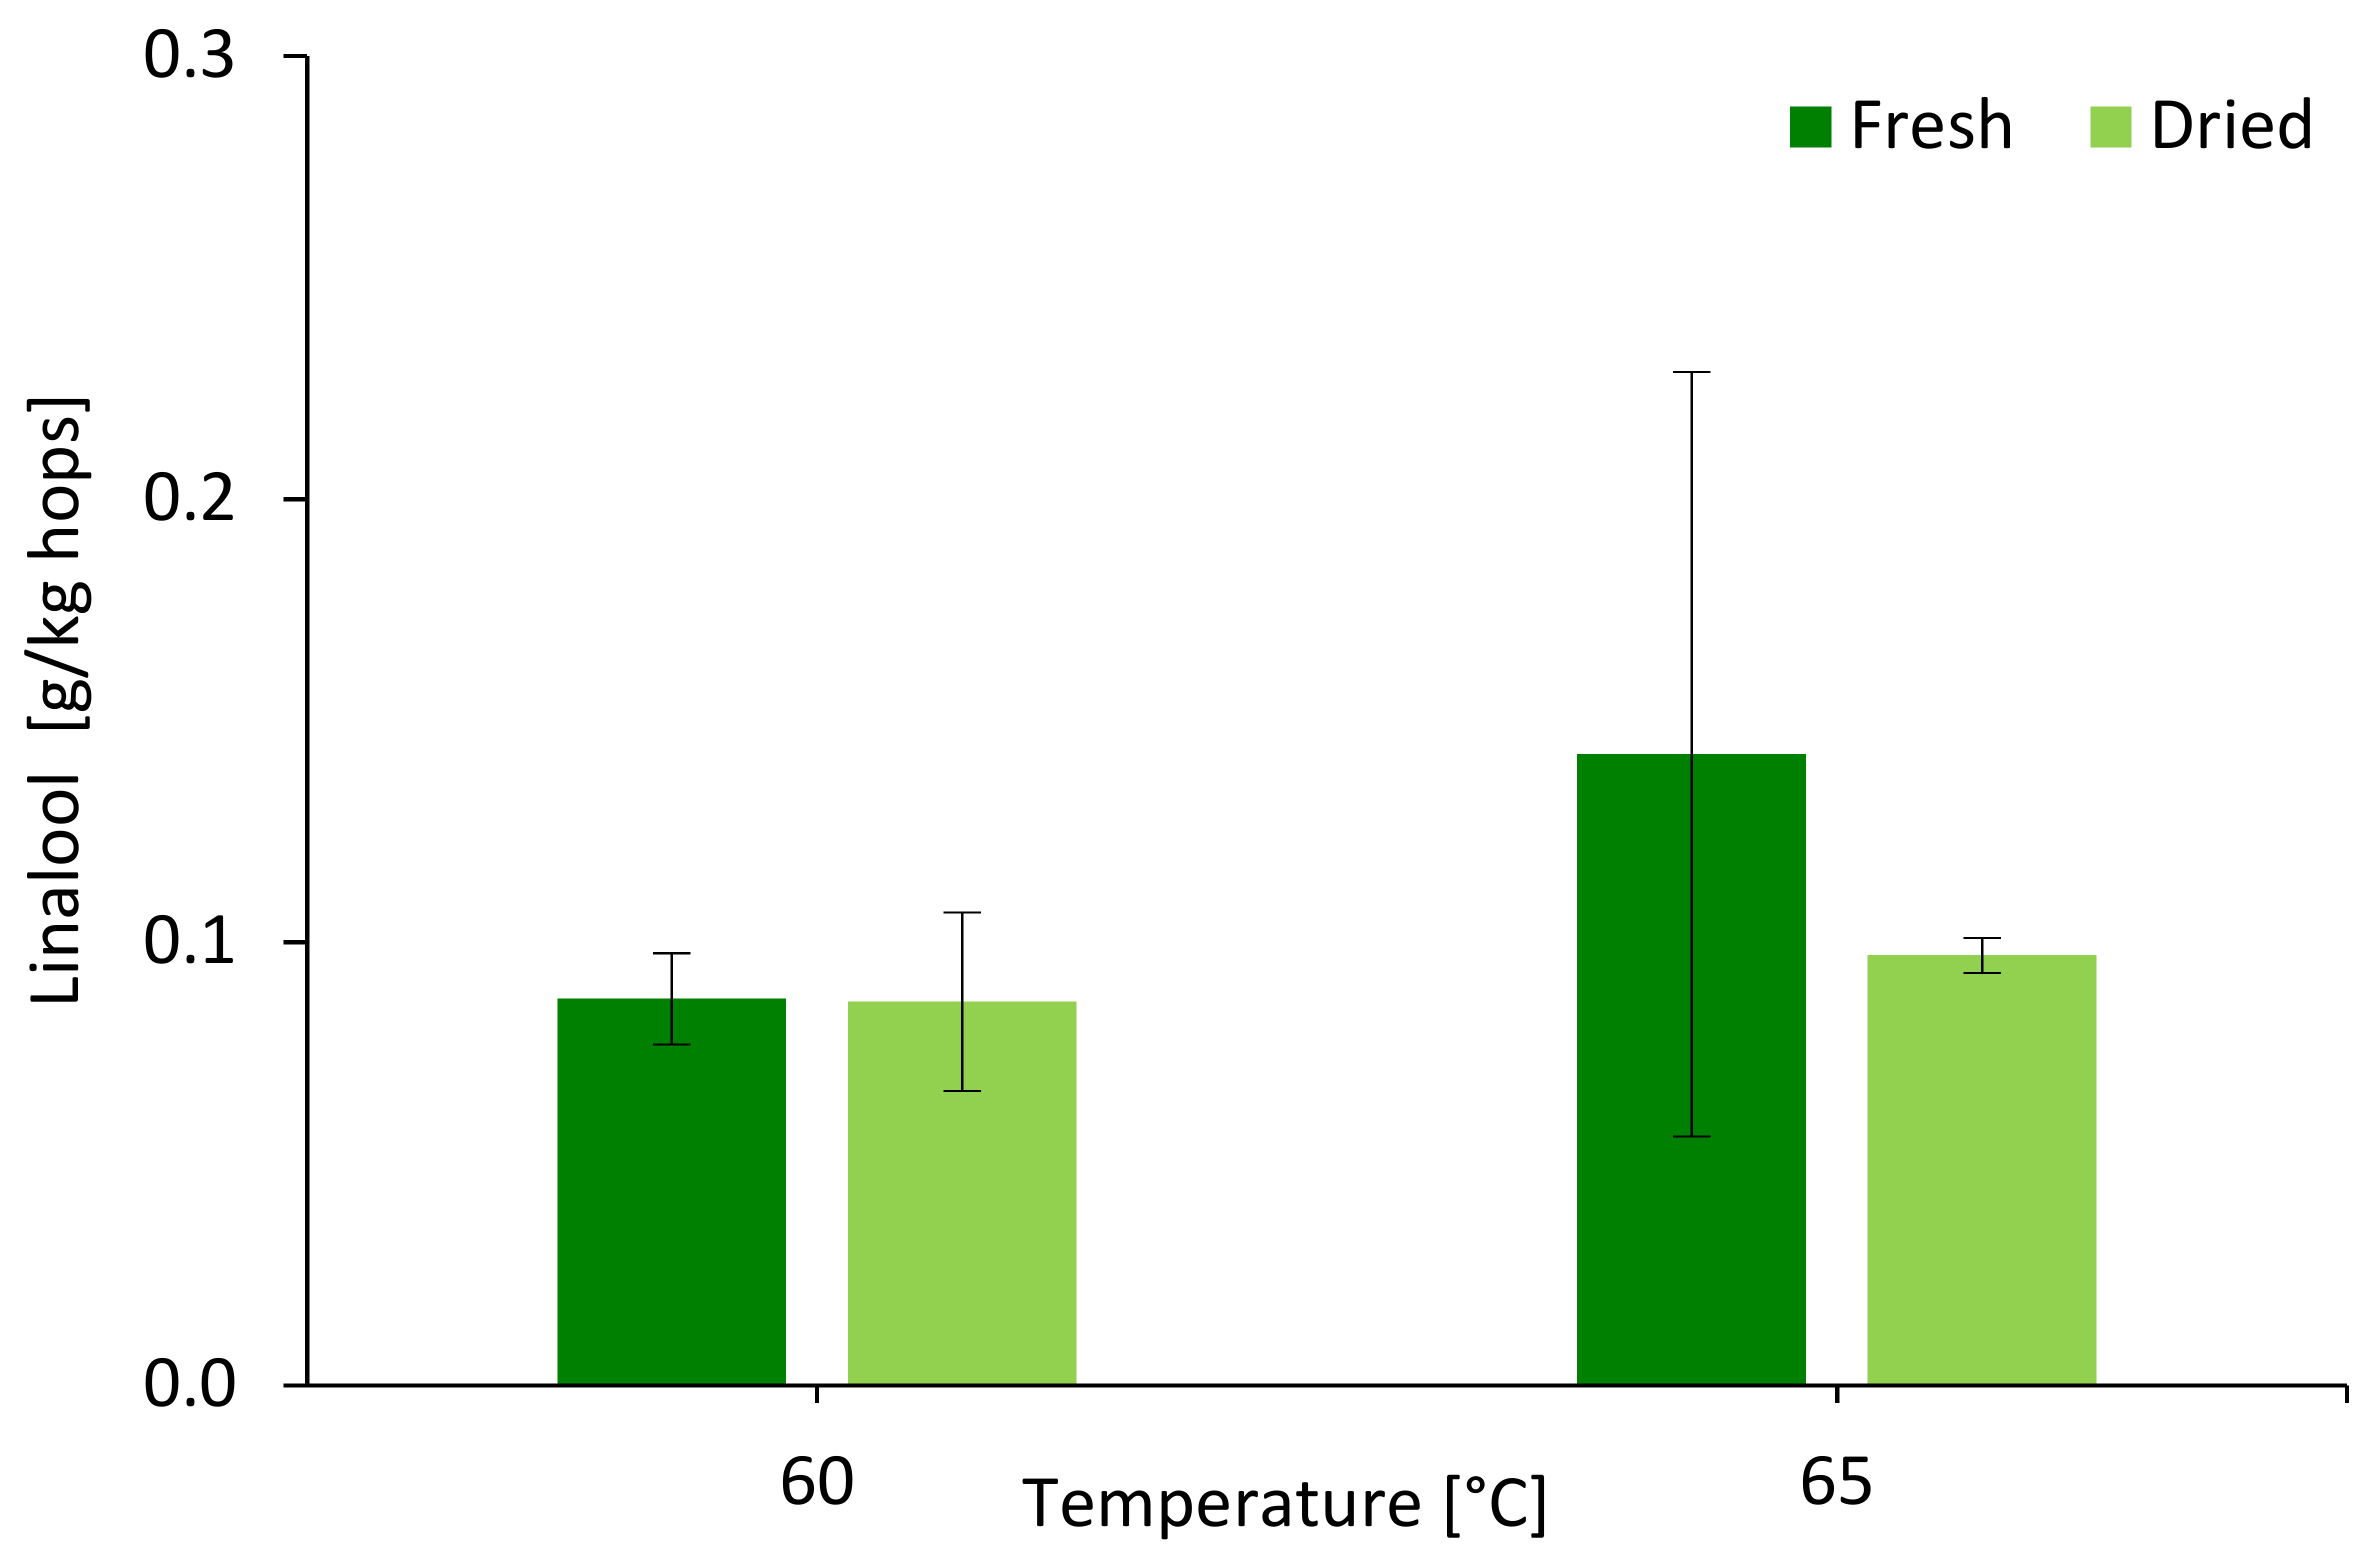
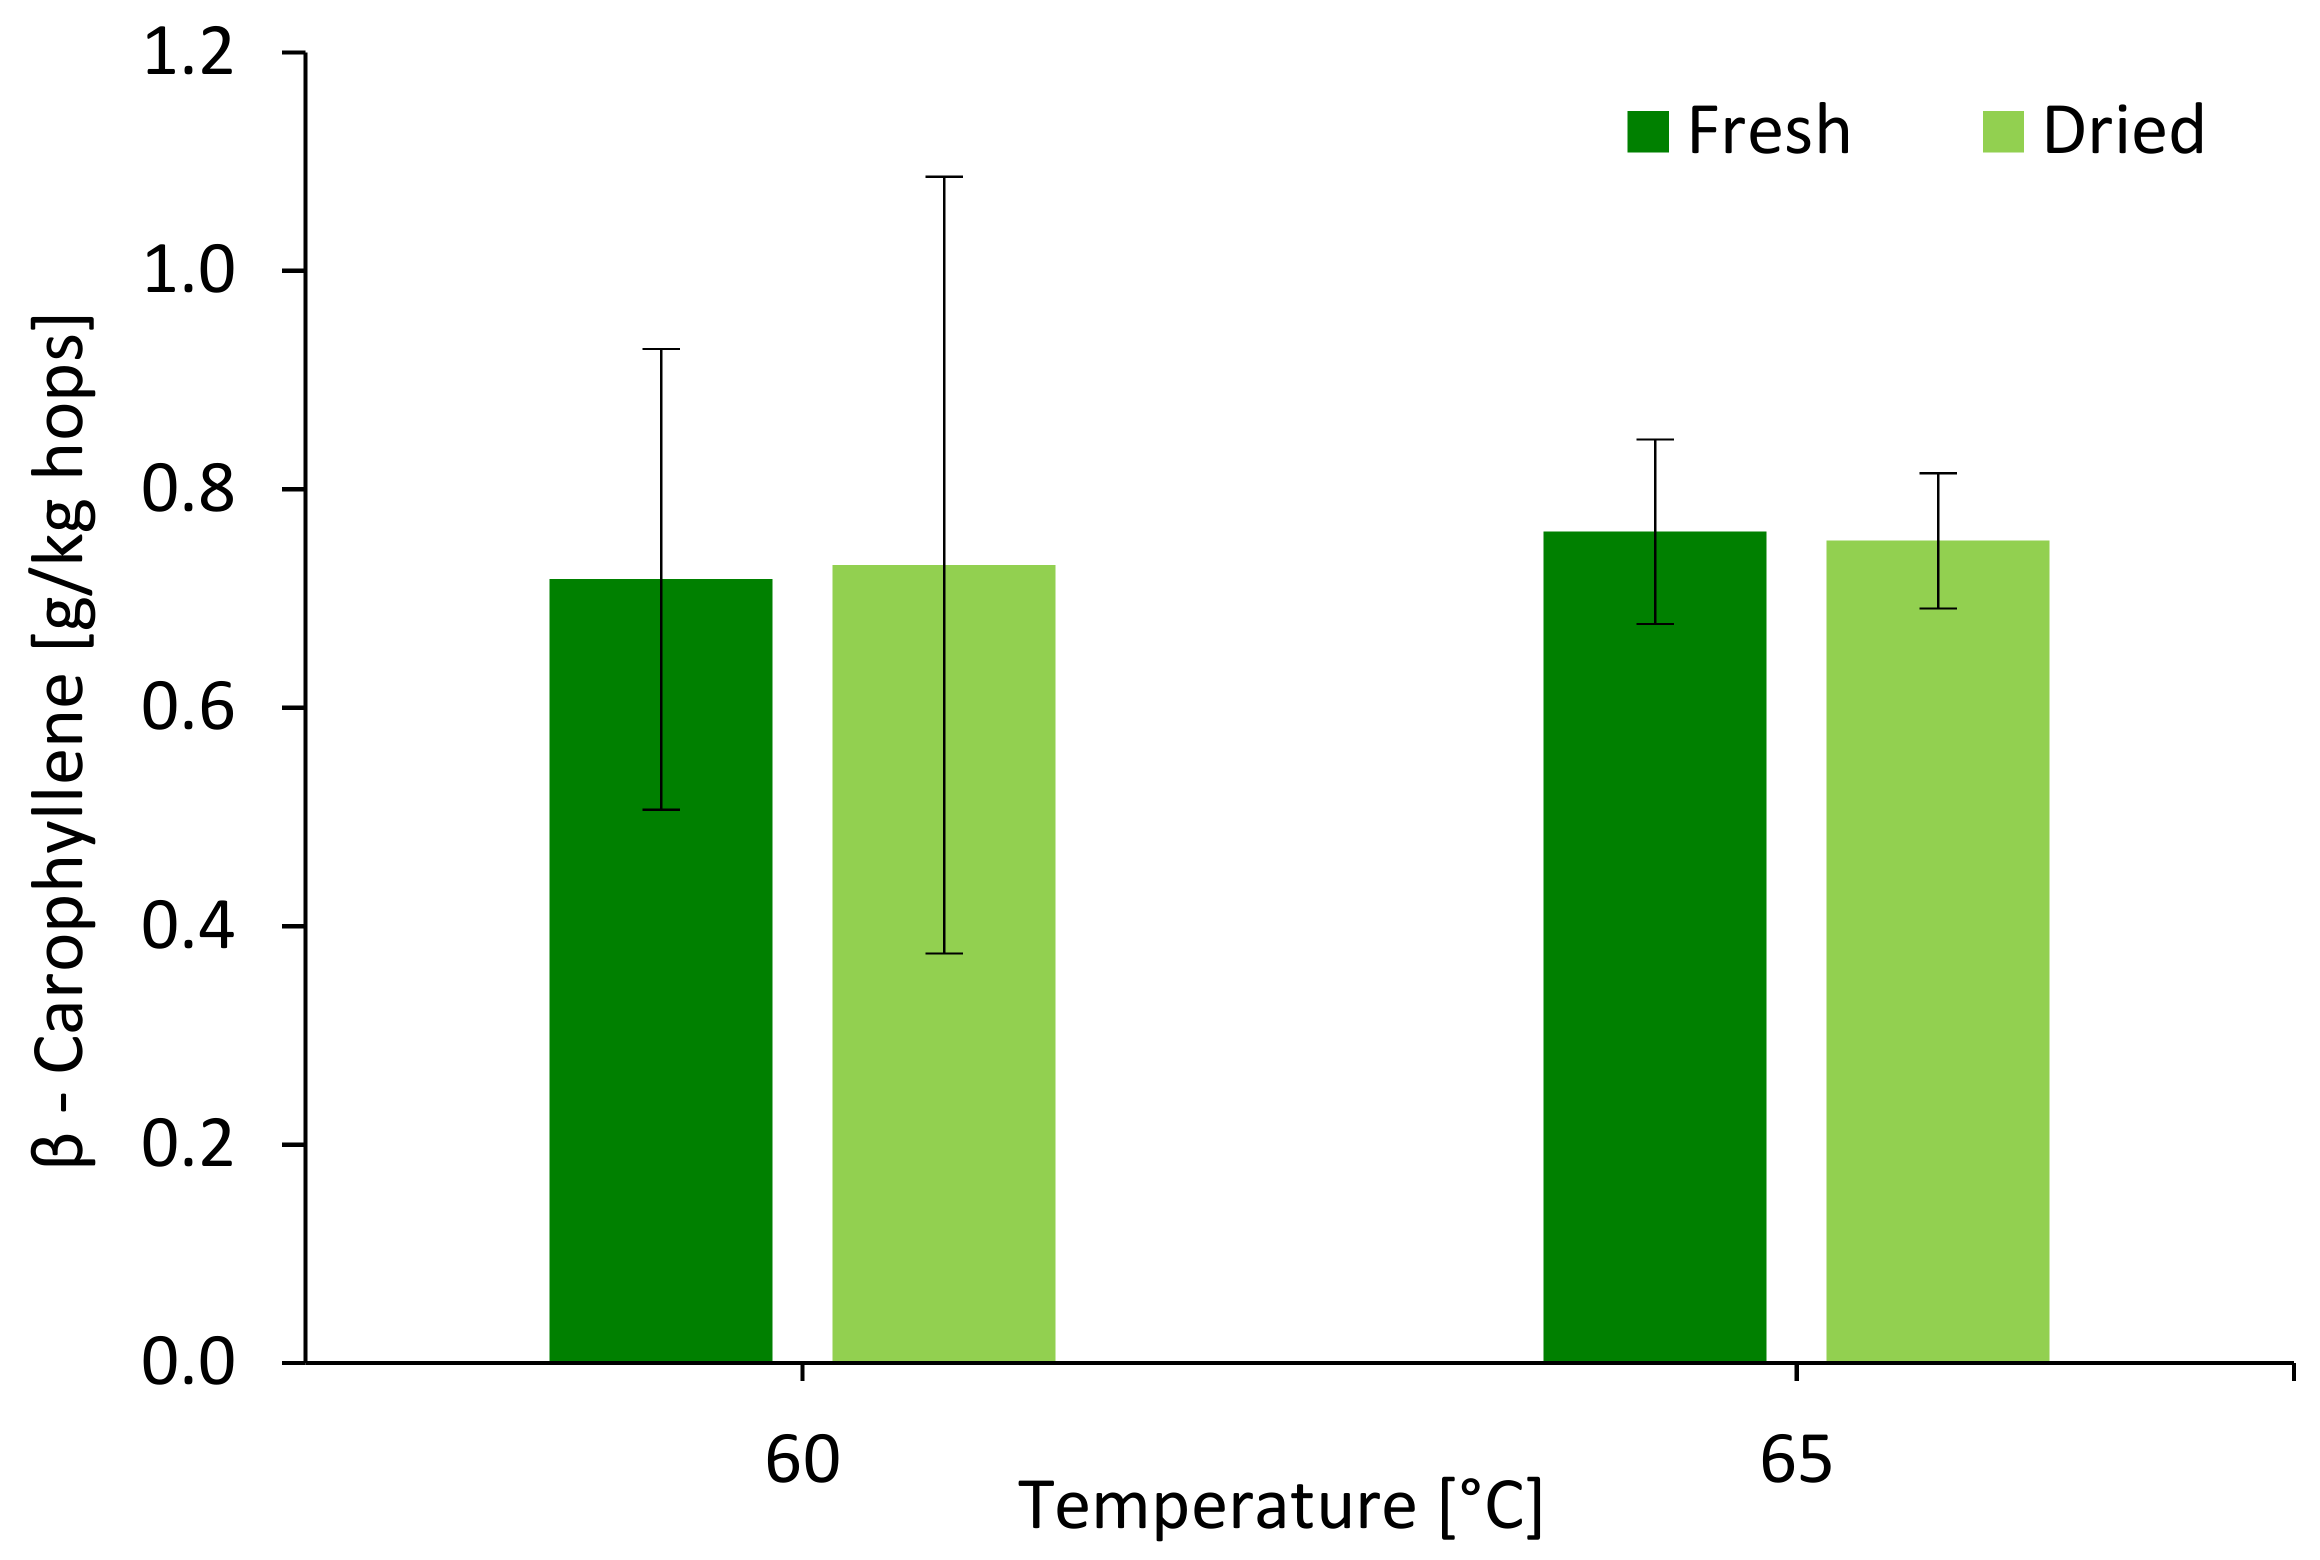
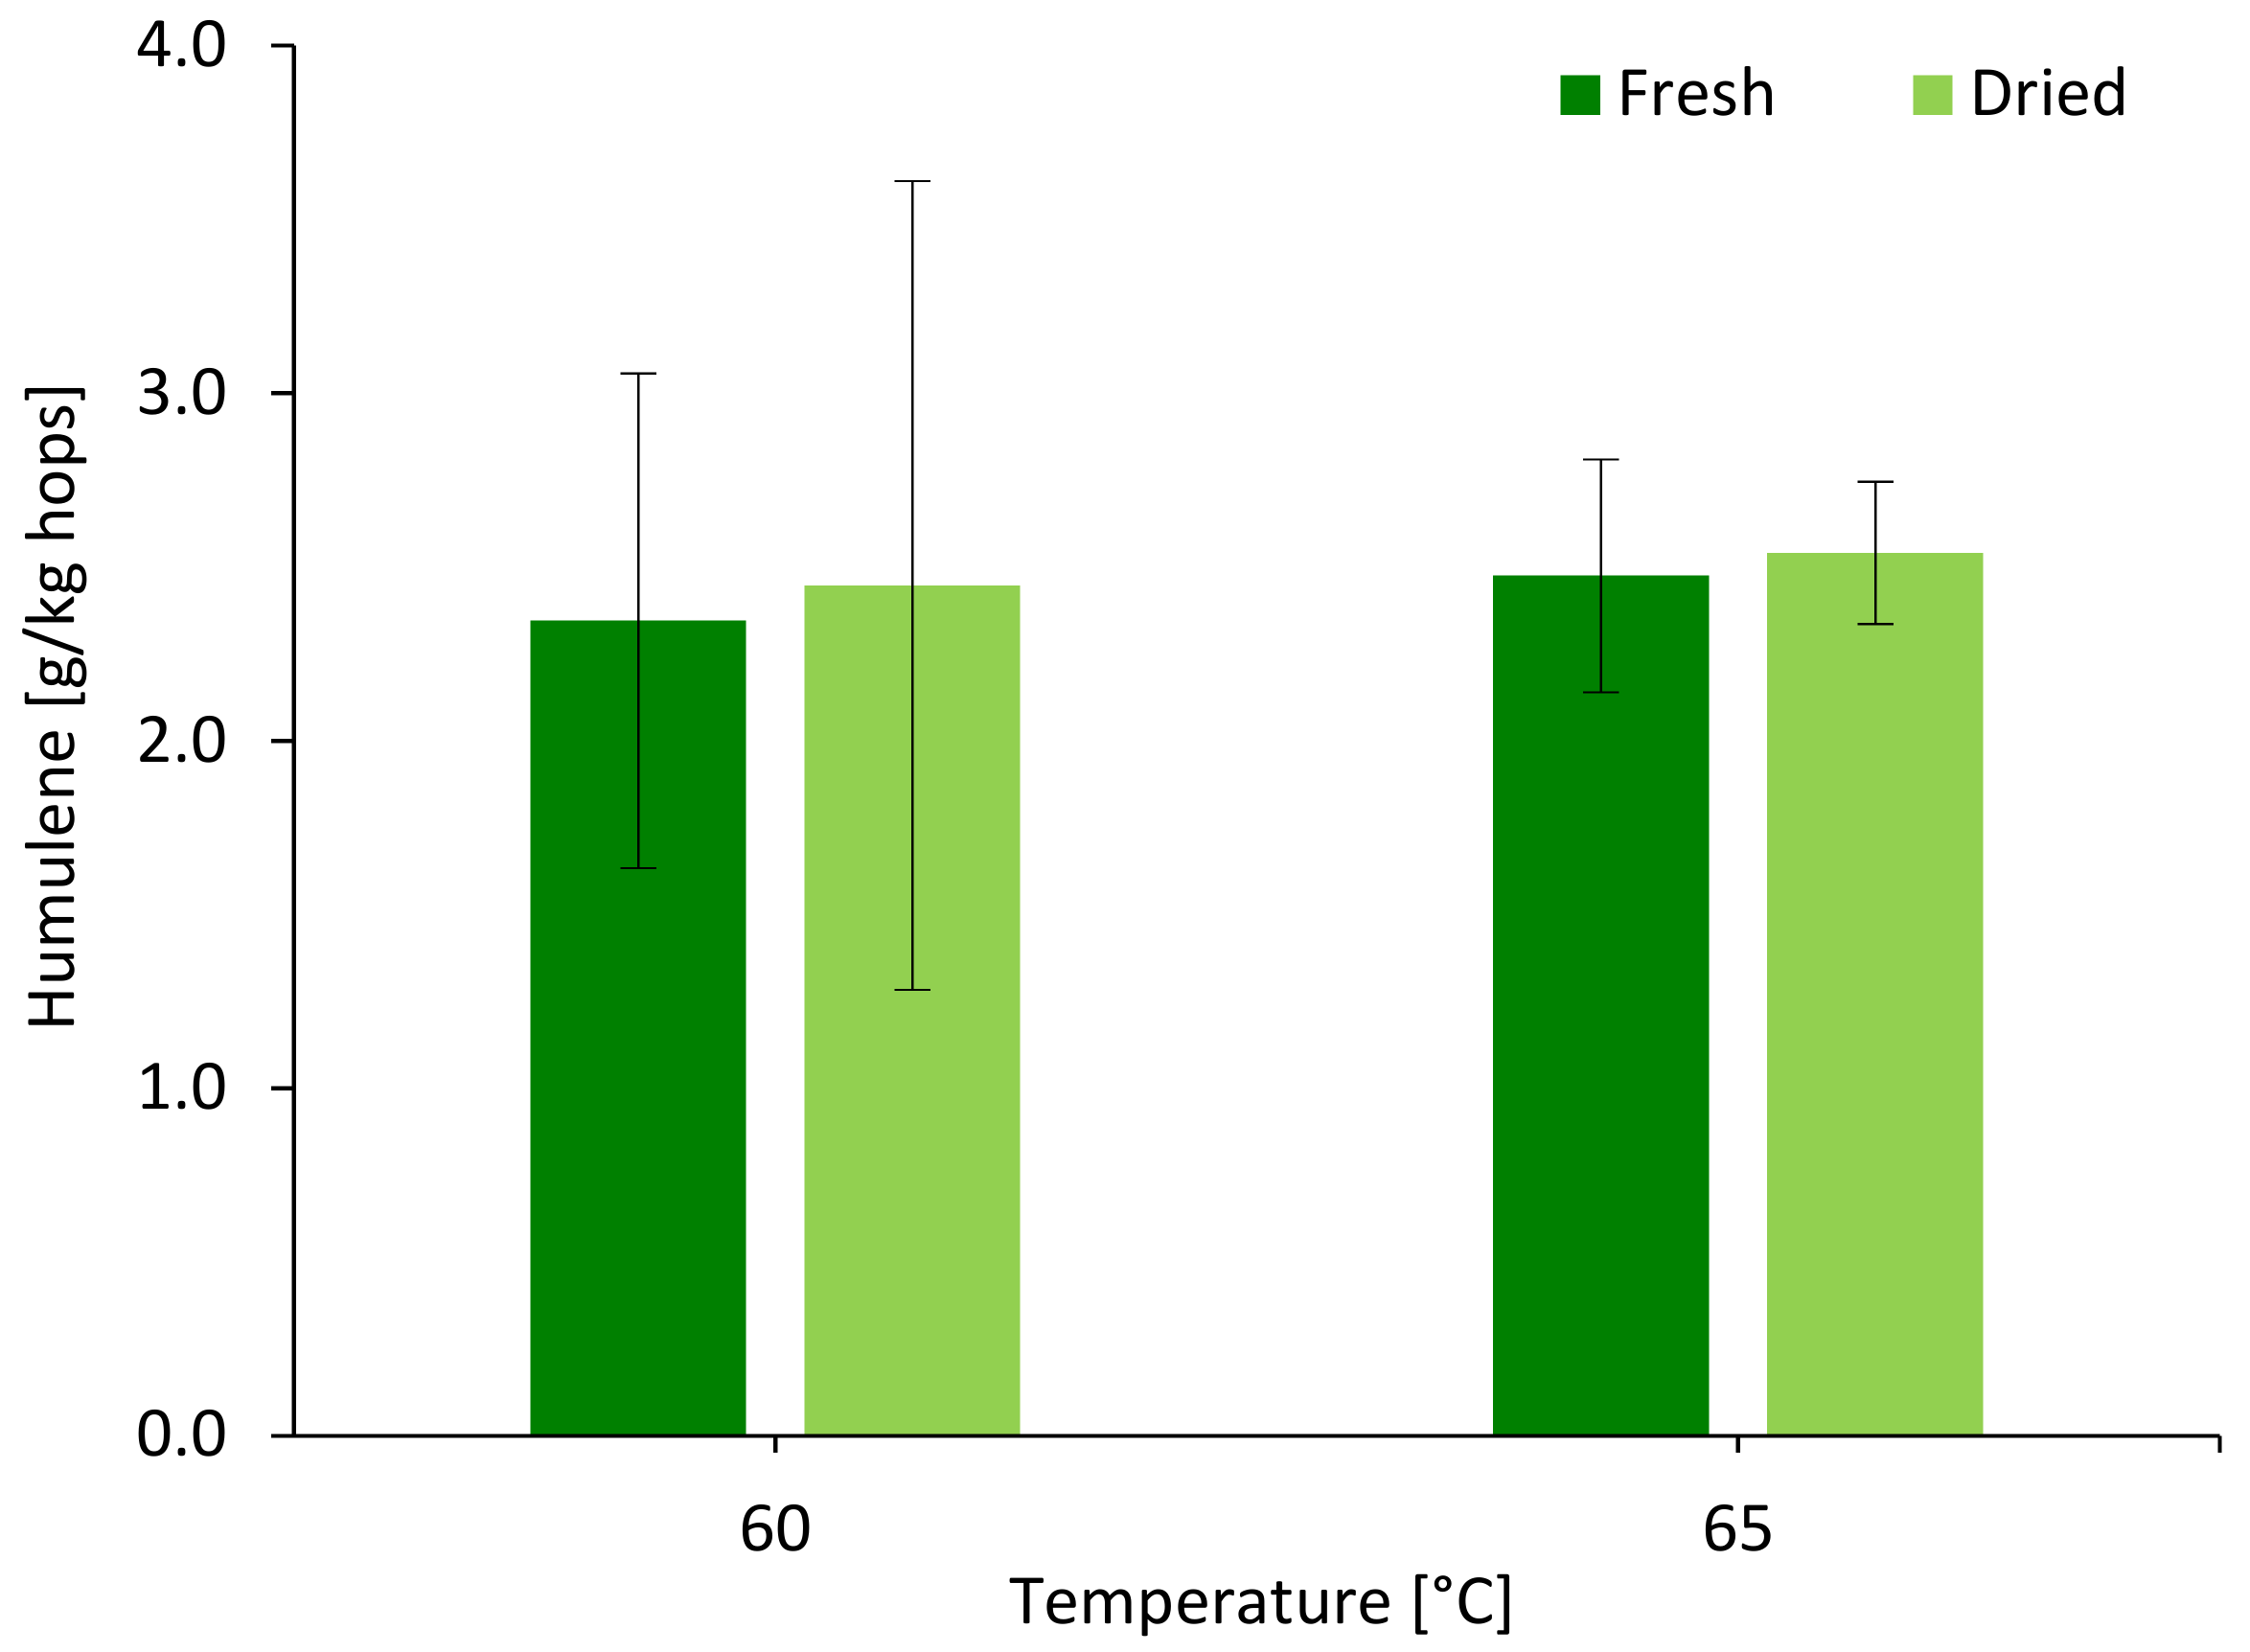
3.3.2. Gas Chromatography of Essential Oils
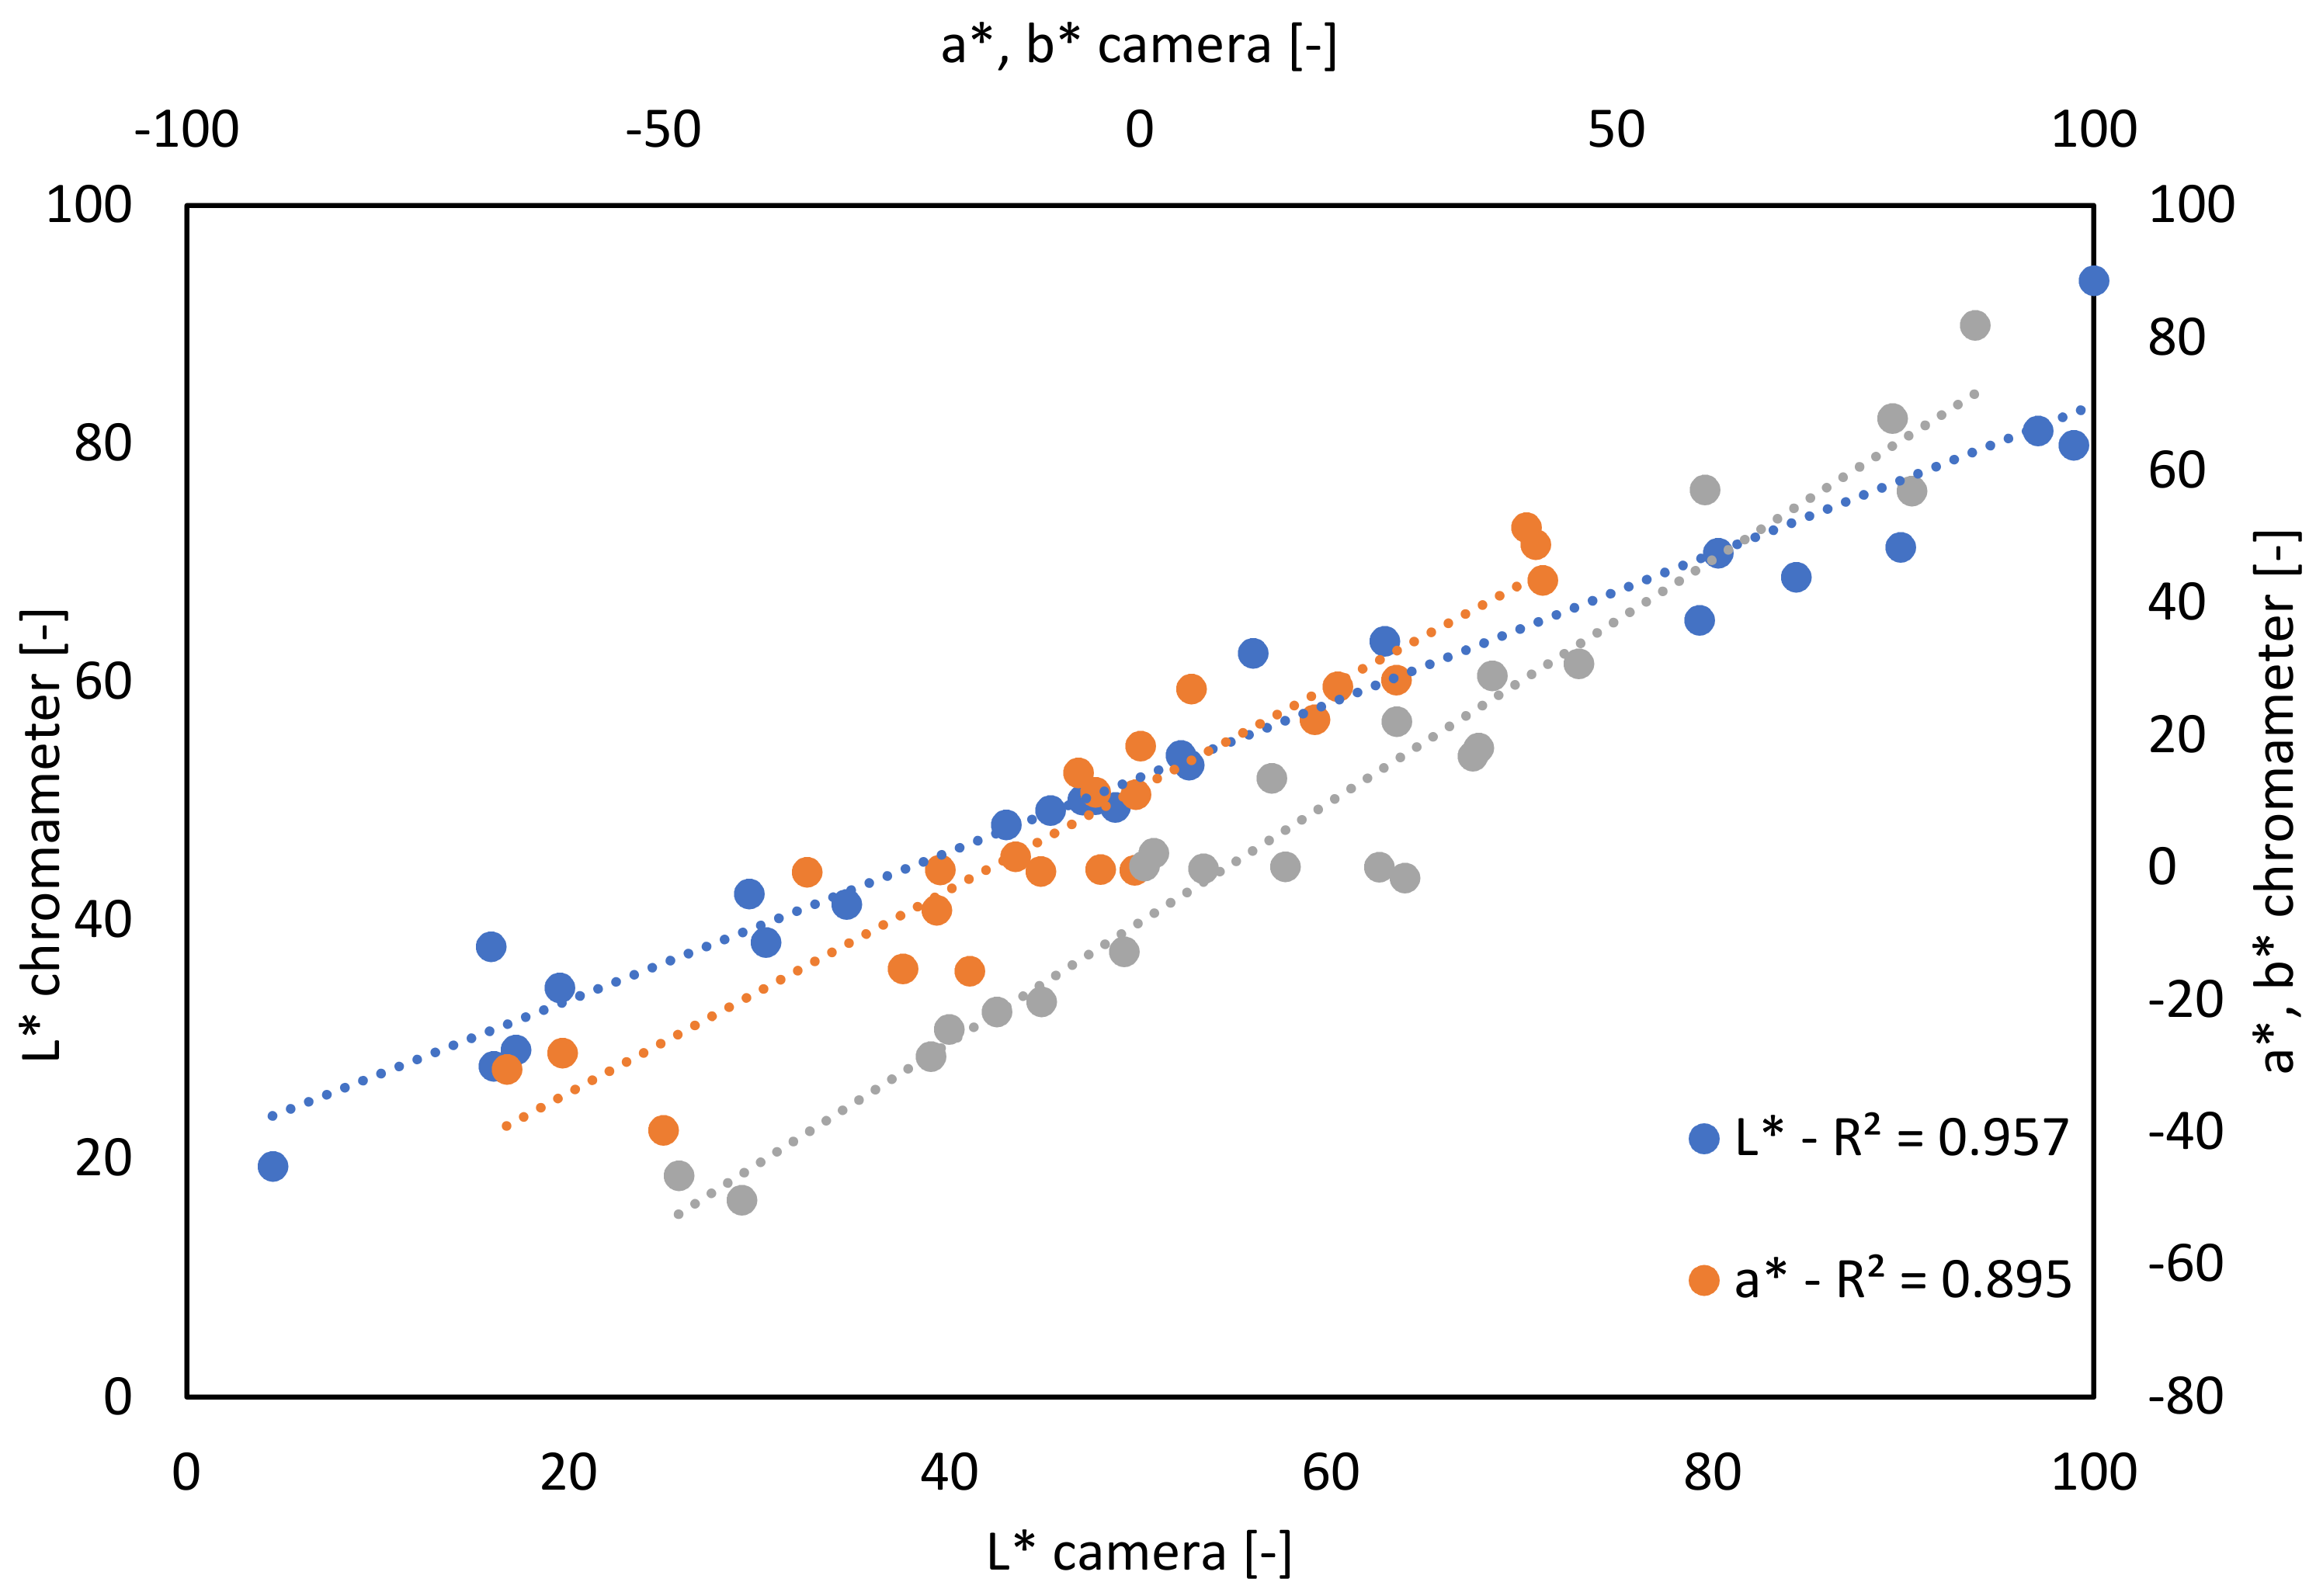
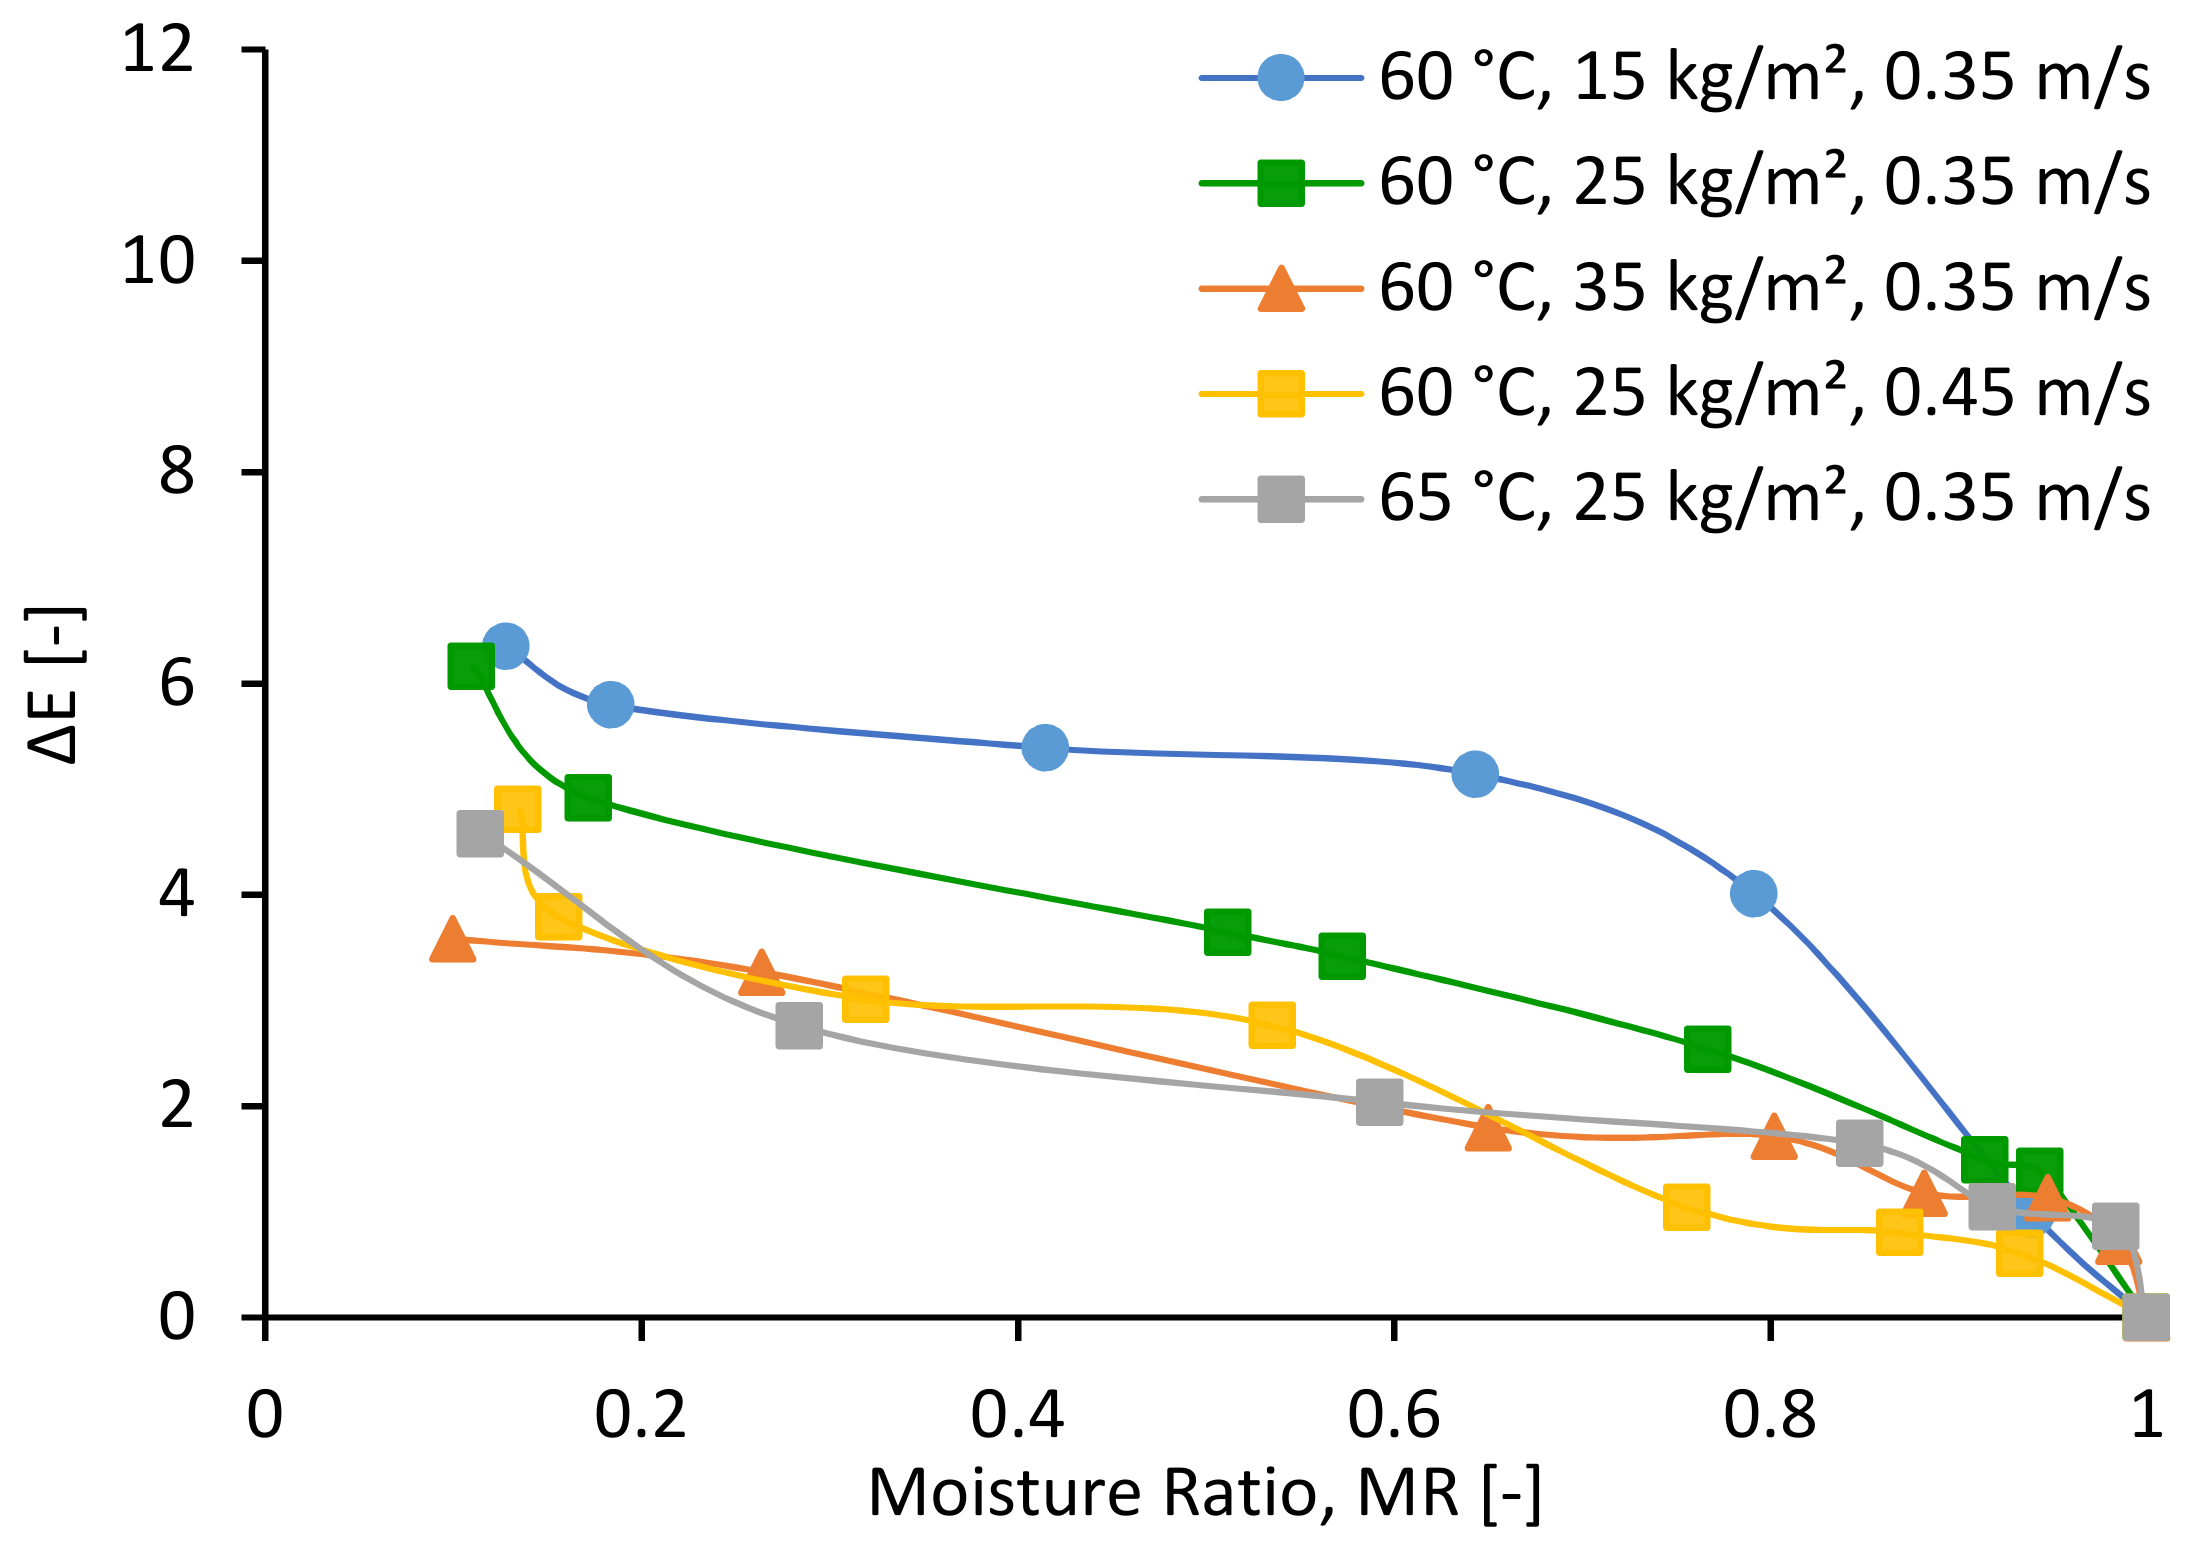
3.4. Color Development
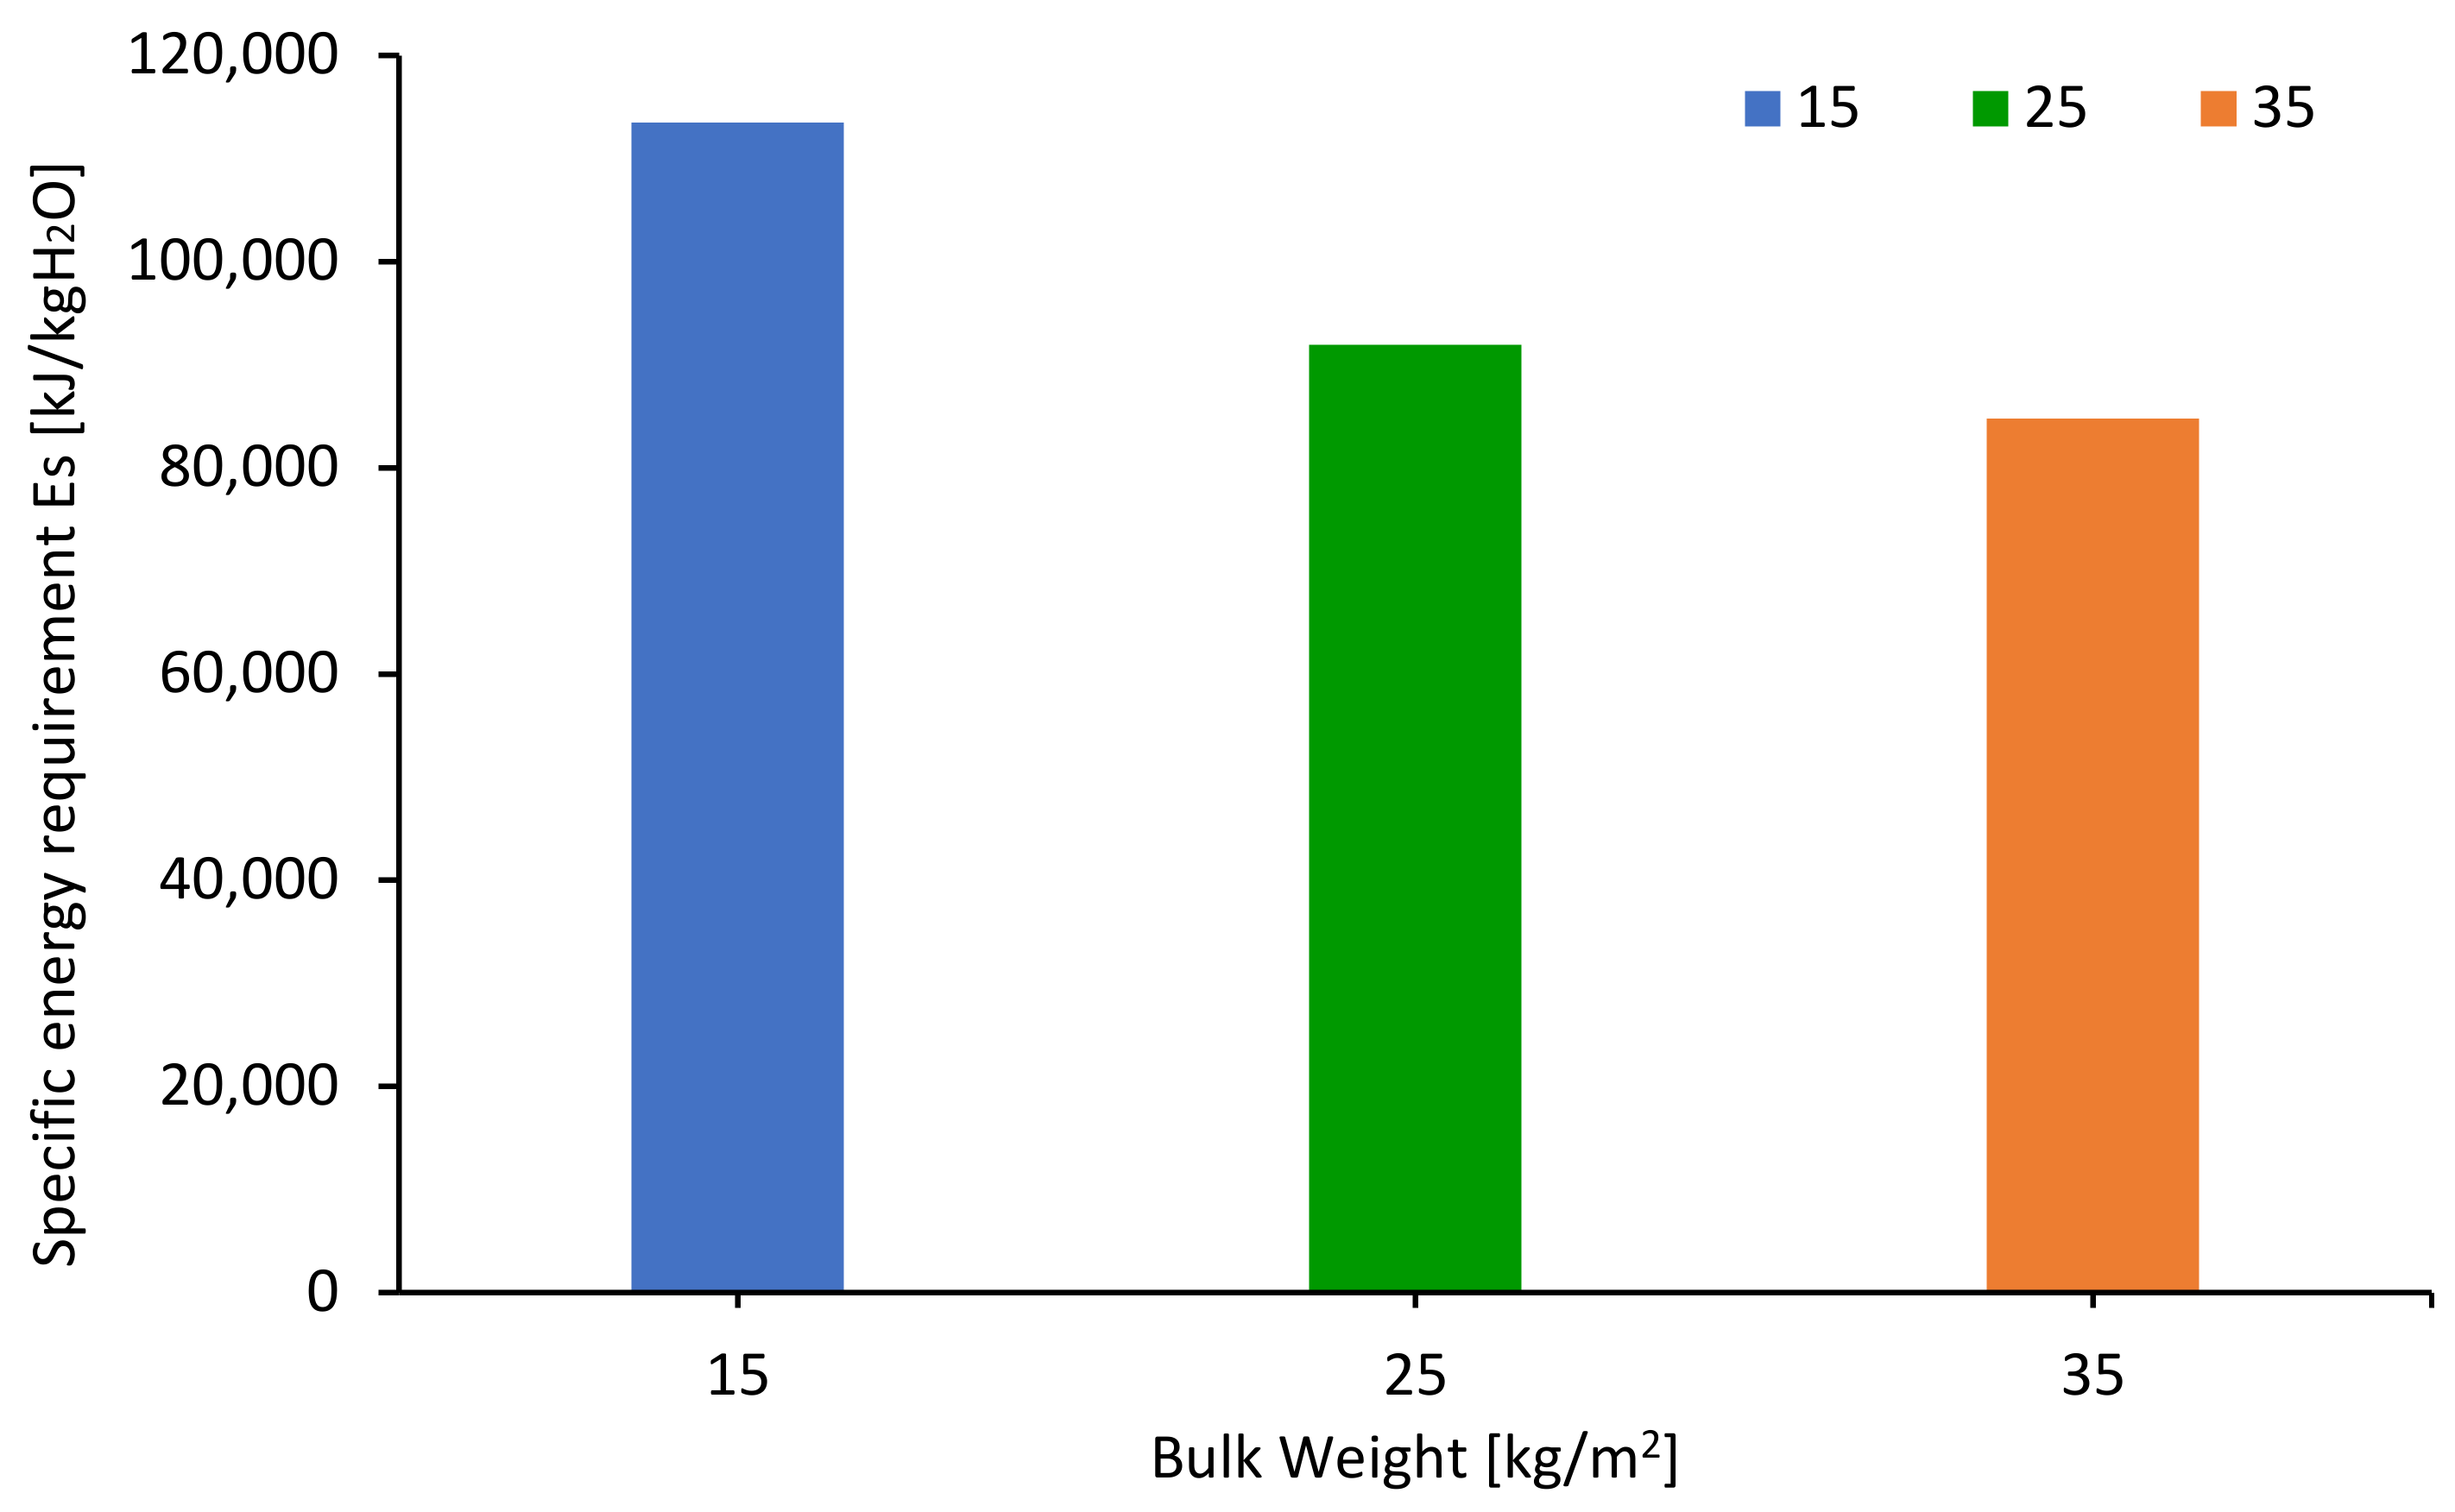
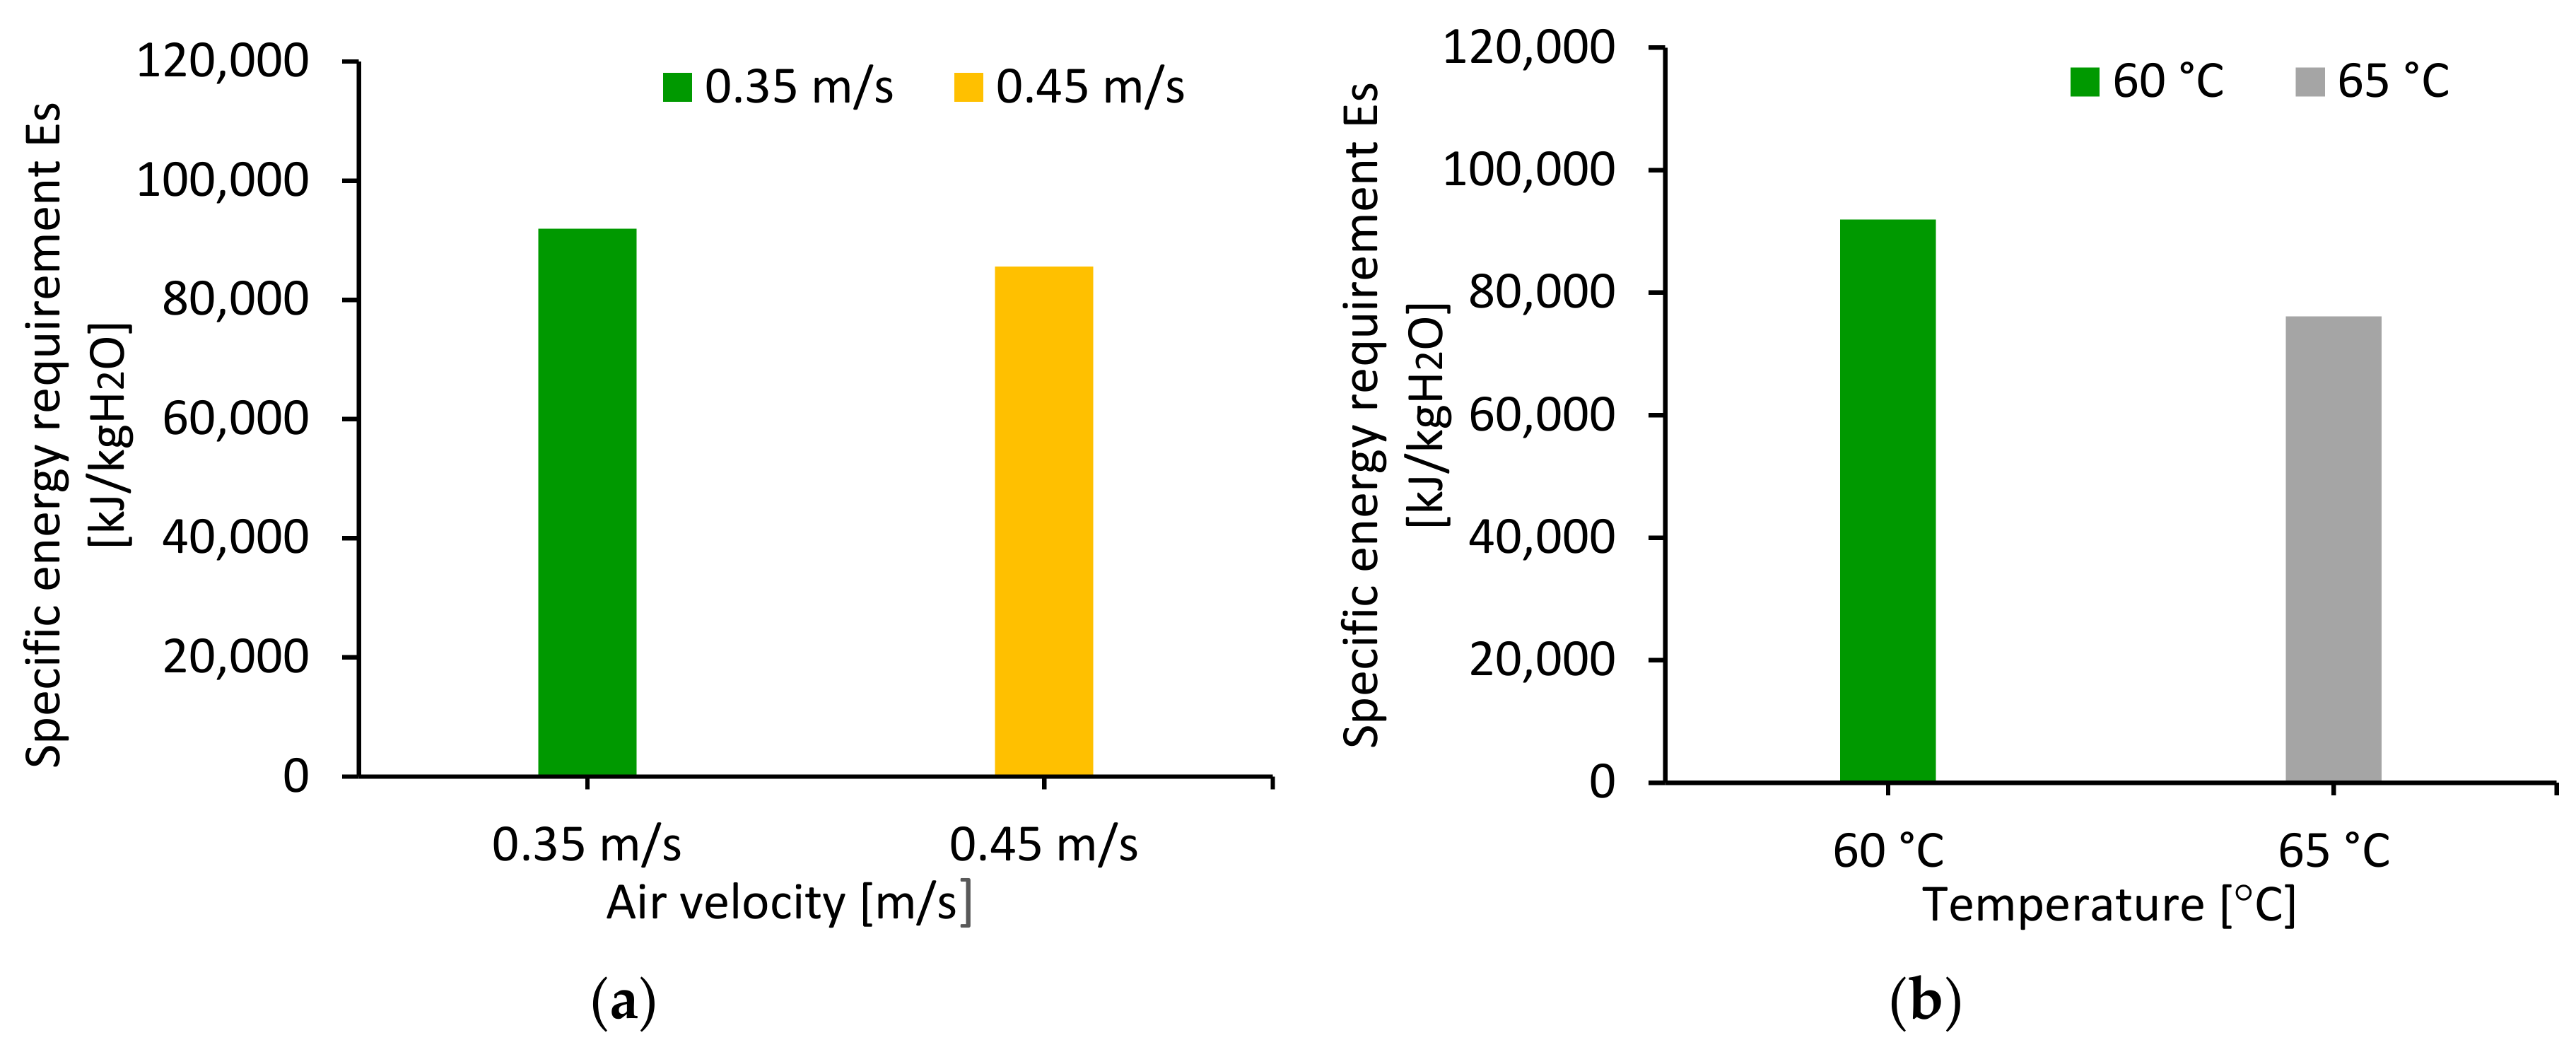
3.5. Energy Consumption
4. General Discussion
5. Conclusions
Author Contributions
Funding
Acknowledgments
Conflicts of Interest
References
- Schieberle, P.; Steinhaus, M. Characterization of the Odor-Active Constituents in Fresh and Processed Hops (variety Spalter Select). In Gas Chromatography-Olfactometry; Leland, J.V., Schieberle, P., Buettner, A., Acree, T.E., Eds.; American Chemical Society: Washington, DC, USA, 2001; pp. 23–32. ISBN 0-8412-3713-1. [Google Scholar]
- Schönberger, C.; Kostelecky, T. 125th Anniversary Review: The Role of Hops in Brewing. Inst. Brew. Distill. 2011, 117, 259–267. [Google Scholar] [CrossRef]
- Sturm, B.; Raut, S.; Kulig, B.; Münsterer, J.; Kammhuber, K.; Hensel, O.; Crichton, S.O. In-process investigation of the dynamics in drying behavior and quality development of hops using visual and environmental sensors combined with chemometrics. Comput. Electron. Agric. 2020, 175, 105547. [Google Scholar] [CrossRef]
- Steinhaus, M.; Schieberle, P. Comparison of the most odor-active compounds in fresh and dried hop cones (Humulus lupulus L. variety spalter select) based on GC-olfactometry and odor dilution techniques. J. Agric. Food Chem. 2000, 48, 1776–1783. [Google Scholar] [CrossRef] [PubMed]
- Rubottom, L. Hop Kilning Temperature Sensitivity of Dextrin-Reducing Enzymes in Hops. Master’s Thesis, Oregon State University, Corvallis, OR, USA, 2020. [Google Scholar]
- Biendl, M.; Forster, A.; Gahr, A.; Lutz, A.; Schimdt, R.; Schönberger, C.; Schüll, F. Pocket Guide 2016 Hops from Germany; German Hop Growers Association: Wolnzach, Germany, 2016. [Google Scholar]
- Hofmann, R.; Weber, S.; Rettberg, N.; Thörner, S.; Garbe, L.A.; Folz, R. Optimization of the Hop Kilning Process to Improve Energy Effi ciency and Recover Hop Oils. Brew. Sci. 2013, 66, 23–30. [Google Scholar]
- Crichton, S.; Münsterer, J.; Kammhuber, K.; Sturm, B. Measurement of hop moisture content and chromaticity during drying with VNIR hyperspectral imaging. In Proceedings of the International Conference on Agricultural Engineering, CIGR—AgEng, Aarhus, Denmark, 26–29 June 2016. [Google Scholar]
- Münsterer, J. Trocknung und Konditionierung von Hopfen, 2020. Available online: https://www.lfl.bayern.de/mam/cms07/publikationen/daten/informationen/trocknung-konditionierung-hopfen_lfl-information.pdf (accessed on 7 October 2020).
- Münsterer, J. Optimale Trocknung und Konditionierung von Hopfen; Bayerische Landesanstalt für Landwirtschaft (LfL): Freising, Germany, 2006. [Google Scholar]
- Heřmánek, P.; Rybka, A.; Honzík, I. Determination of moisture ratio in parts of the hop cone during the drying process in belt dryer. Agron. Res. 2018, 16, 723–727. [Google Scholar] [CrossRef]
- Nicolaï, B.M.; Defraeye, T.; de Ketelaere, B.; Herremans, E.; Hertog, M.L.A.T.M.; Saeys, W.; Torricelli, A.; Vandendriessche, T.; Verboven, P. Nondestructive measurement of fruit and vegetable quality. Annu. Rev. Food Sci. Technol. 2014, 5, 285–312. [Google Scholar] [CrossRef]
- LfL. Annual Report 2018—Special Crop: Hops, 2019. Available online: https://www.lfl.bayern.de/mam/cms07/ipz/dateien/hopfen_jahresbericht_englisch_2019.pdf (accessed on 27 May 2020).
- Münsterer, J. Kosteneinsparung bei der Hopfentrocknung durch alternative Energiequellen und Wärmerückgewinnung. Available online: https://www.lfl.bayern.de/mam/cms07/ipz/dateien/hopfen_alternative_energiequellen.pdf (accessed on 7 October 2020).
- AOAC International. Official Methods of Analysis of AOAC International, 20th ed.; AOAC International: Rockville, MD, USA, 2016; ISBN 0935584870. [Google Scholar]
- Diamante, L.M.; Munro, P.A. Mathematical modelling of the thin layer solar drying of sweet potato slices. Solar Energy 1993, 51, 271–276. [Google Scholar] [CrossRef]
- Raut, S.; von Gersdorff, G.J.E.; Münsterer, J.; Kammhuber, K.; Hensel, O.; Sturm, B. Influence of Pre-Drying Storage Time on Essential Oil Components in Dried Hops (Humulus lupulus L.). J. Sci. Food Agric. 2020. [Google Scholar] [CrossRef]
- Nasirahmadi, A.; Behroozi-Khazaei, N. Identification of bean varieties according to color features using artificial neural network. Span. J. Agric. Res. 2013, 11, 670. [Google Scholar] [CrossRef]
- Ruzon, M. RGB2lab. Mathworks. 2009. Available online: https://www.mathworks.com/matlabcentral/fileexchange/24009-rgb2lab (accessed on 13 November 2020).
- Sturm, B.; Hofacker, W.C.; Hensel, O. Optimizing the Drying Parameters for Hot-Air–Dried Apples. Dry. Technol. 2012, 30, 1570–1582. [Google Scholar] [CrossRef]
- Martin, A. Chapter 4. Colour Management in the Graphic Technologies. In Graphic Design and Print Production Fundamentals; BCcampus: Vancouver, BC, Canada, 2017. [Google Scholar]
- Aghbashlo, M.; kianmehr, M.H.; Samimi-Akhijahani, H. Influence of drying conditions on the effective moisture diffusivity, energy of activation and energy consumption during the thin-layer drying of berberis fruit (Berberidaceae). Energy Convers. Manag. 2008, 49, 2865–2871. [Google Scholar] [CrossRef]
- Ndisya, J.; Mbuge, D.; Kulig, B.; Gitau, A.; Hensel, O.; Sturm, B. Hot air drying of purple-speckled Cocoyam (Colocasia esculenta (L.) Schott) slices: Optimisation of drying conditions for improved product quality and energy savings. Therm. Sci. Eng. Prog. 2020, 18, 100557. [Google Scholar] [CrossRef]
- Münsterer, J. Neue Erkenntnisse zur Leistungssteigerung und Energieeffizienz von Hopfentrocknungsanlagen; Bayerische Landesanstalt für Landwirtschaft (LfL): Wolnzach, Germany, 2015. [Google Scholar]
- Contreras, C.; Martín-Esparza, M.E.; Chiralt, A.; Martínez-Navarrete, N. Influence of microwave application on convective drying: Effects on drying kinetics, and optical and mechanical properties of apple and strawberry. J. Food Eng. 2008, 88, 55–64. [Google Scholar] [CrossRef]
- Müller, J. Convective drying of medicinal, aromatic and spice plants: A review. Stewart Postharvest Rev. 2007, 3, 1–6. [Google Scholar] [CrossRef]
- Ratti, C. Shrinkage during drying of foodstuffs. J. Food Eng. 1994, 23, 91–105. [Google Scholar] [CrossRef]
- Sturm, B.; Nunez Vega, A.-M.; Hofacker, W. Influence of process control strategies on drying kinetics, colour and shrinkage of air dried apples. Appl. Therm. Eng. 2014, 62, 455–460. [Google Scholar] [CrossRef]
- Von Gersdorff, G.J.; Shrestha, L.; Raut, S.; Retz, S.K.; Hensel, O.; Sturm, B. Impact of processing temperature on drying behavior and quality changes in organic beef. In Proceedings of the 21st International Drying Symposium, València, Spain, 11–14 September 2018; Cárcel, J.A., Ed.; Universitat: València, Spain, 2018. ISBN 9788490486887. [Google Scholar]
- Md Saleh, R.; Kulig, B.; Hensel, O.; Sturm, B. Investigation of dynamic quality changes and optimization of drying parameters of carrots (Daucus carota var. laguna). J. Food Process. Eng. 2019, 48, 1. [Google Scholar] [CrossRef]
- Pusat, S.; Akkoyunlu, M.T.; Erdem, H.H.; Teke, I. Effects of Bed Height and Particle Size on Drying of a Turkish Lignite. Int. J. Coal Prep. Util. 2015, 35, 196–205. [Google Scholar] [CrossRef]
- Tahmasebi, A.; Yu, J.; Han, Y.; Li, X. A study of chemical structure changes of Chinese lignite during fluidized-bed drying in nitrogen and air. Fuel Process. Technol. 2012, 101, 85–93. [Google Scholar] [CrossRef]
- Górnicki, K.; Kaleta, A. Resistance of Bulk Grain to Airflow—A Review. Part I: Equations for Airflow Resistance. Ann. Wars. Univ. Life Sci. 2015, 31–41. [Google Scholar] [CrossRef]
- Jekayinfa, S.O. Effect of Airflow Rate, Moisture Content and Pressure Drop on the Airflow Resistance of Locust Bean Seed. Agric. Eng. Int. CIGR Ej. 2006, VIII, 1–9. [Google Scholar]
- Kashaninejad, M.; Maghsoudlou, Y.; Khomeiri, M.; Tabil, L.G. Resistance to airflow through bulk pistachio nuts (Kalleghochi variety) as affected by moisture content, airflow rate, bed depth and fill method. Powder Technol. 2010, 203, 359–364. [Google Scholar] [CrossRef]
- Kammhuber, K. Analytical Aroma Characterization of the New Hüller “Special Flavor Hops”. In Proceedings of the Scientific Commission. International Hop Growers’ Convention, Kiev, Ukraine, 4–9 June 2013; Seigner, E., Ed.; Hop Research Center Hüll—Bavarian State Research Center for Agriculture (LfL): Wolnzach, Germany, 2013; pp. 37–39. [Google Scholar]
- Rodolfi, M.; Chiancone, B.; Liberatore, C.M.; Fabbri, A.; Cirlini, M.; Ganino, T. Changes in chemical profile of Cascade hop cones according to the growing area. Journal of the Science of Food and Agriculture. J. Sci. Food Agric. 2019, 99, 6011–6019. [Google Scholar] [CrossRef] [PubMed]
- Bayerische Landesanstalt für Landwirtschaft. Hopfen für alle Biere der Welt; Bavarian State Research Center for Agriculture (LfL): Wolnzach, Germany, 2011. [Google Scholar]
- Sellami, I.H.; Wannes, W.A.; Bettaieb, I.; Berrima, S.; Chahed, T.; Marzouk, B.; Limam, F. Qualitative and quantitative changes in the essential oil of Laurus nobilis L. leaves as affected by different drying methods. Food Chem. 2011, 126, 691–697. [Google Scholar] [CrossRef]
- Prusinowska, R.; Śmigielski, K. Losses of essential oils and antioxidants during the drying of herbs and spices. A review. Eng. Sci. Technol. 2015. [Google Scholar] [CrossRef]
- Aberl, A. Methodenentwicklung der Headspace-Trap-GC-MS Analyse zur schnellen quantitativen Bestimmung flüchtiger Verbindungen in Hopfen und Bier—Mit Korrelationsanalyse der Hopfenölkomponenten. Ph.D. Thesis, Technischen Universitaet Munchen, München, Germany, 2016. [Google Scholar]
- Münsterer, J. Flavour-Hopfen optimal trocknen (in German). Brauwelt 2017, 36, 1063–1066. [Google Scholar]
- Kammhuber, K.; Lutz, A.; Münsterer, J. Einfluss von Erntezeitpunkt und Trocknung auf den Brauwert der Flavor-Hopfensorten Hallertau Blanc, Mandarina Bavaria und Polaris; Bavarian State Research Center for Agriculture (LfL): Wolnzach, Germany, 2017. (In German) [Google Scholar]
- Kammhuber, K. Was Beeinflusst das Hopfenaroma—Eine Analytische und Sensorische Annäherung; Bavarian State Research Center for Agriculture (LfL): Wolnzach, Germany, 2018. (In German) [Google Scholar]
- Krottenthaler, M. Entwicklung moderner Technologien zur Optimierung der Würze- und Bierqualität; Habilitationsschrift; Hochschule Weihenstephan-Triesdorf: Freising, Germany, 2007. (In German) [Google Scholar]
- Rettberg, N.; Biendl, M.; Garbe, L.-A. Hop Aroma and Hoppy Beer Flavor: Chemical Backgrounds and Analytical Tools—A Review. J. Am. Soc. Brew. Chem. 2018, 76, 1–20. [Google Scholar] [CrossRef]
- Kaltner, D. Untersuchungen zur Ausbildung des Hopfenaromas und technologische Maßnahmen zur Erzeugung Hopfenaromatischer Biere. Ph.D. Thesis, Technische Universität München, Muenchen, Geramy, 2000. (In German). [Google Scholar]
- Hanke, S. Linalool—A Key Contributor to Hop Aroma. Global Emerging Issues. 2009. Available online: https://www.mbaa.com/brewresources/Documents/Linalool.pdf (accessed on 4 October 2020).
- Eyres, G.T.; Marriott, P.J.; Dufour, J.-P. Comparison of odor-active compounds in the spicy fraction of hop (Humulus lupulus L.) essential oil from four different varieties. J. Agric. Food Chem. 2007, 55, 6252–6261. [Google Scholar] [CrossRef]
- Münsterer, J. Neueste Erkenntnisse zur Leistungssteigerung und Energieeffizienz bei der Trocknung von Hopfen. In Proceedings of the 5th Congress of the International Hopgrowers’ Convention IHGC, Bad Gögging, Germany, 31 July–3 August 2015. (In German). [Google Scholar]
- Saxena, A.; Maity, T.; Raju, P.S.; Bawa, A.S. Degradation Kinetics of Colour and Total Carotenoids in Jackfruit (Artocarpus heterophyllus) Bulb Slices During Hot Air Drying. Food Bioprocess Technol. 2012, 5, 672–679. [Google Scholar] [CrossRef]
- Rybáček, V. (Ed.) Hop Production; Elsevier: Amsterdam, The Netherlands; New York, NY, USA, 1991; ISBN 0444987703. [Google Scholar]
- Koyuncu, T.; Pinar, Y.; Lule, F. Convective drying characteristics of azarole red (Crataegus monogyna Jacq.) and yellow (Crataegus aronia Bosc.) fruits. J. Food Eng. 2007, 78, 1471–1475. [Google Scholar] [CrossRef]
- Sturm, B.; Münsterer, J.; Kammhuber, K.; Crichton, S. Impact of bulk weight on drying behaviour and hop quality after drying. In Proceedings of the International Conference on Agricultural Engineering, CIGR—AgEng, Aarhus, Denmark, 26–29 June 2016. [Google Scholar]


| Temperature [°C]-Velocity [m/s] | Bulk Weight [kg/m2] | ||
|---|---|---|---|
| 15 | 25 | 35 | |
| 60-0.35 | X | X | X |
| 60-0.45 | X | ||
| 65-0.35 | X | ||
| Interval | 60 °C-0.35 m/s | 60 °C-0.45 m/s | 65 °C-0.35 m/s | ||
|---|---|---|---|---|---|
| 15 kg | 25 kg | 35 kg | 25 kg | 25 kg | |
| Time Section in Minutes | |||||
| 20 min | 0–60 | 0–60 | 0–60 | 0–60 | 0–60 |
| 30 min | 60–120 | 60–120 | 60–120 | 60–120 | 60–120 |
| 60 min | 120–180 | 120–180 | 120–180 | 120–180 | 120–180 |
| End | 180 | 210 | 240 | 200 | 180 |
| Cone Size | Average Cone Length [cm] | Average Cone Diameter [cm] | Average Weight of One Cone [g] | Average Hop Weight [g] |
|---|---|---|---|---|
| Small | 1.6 | 0.9 | 0.3 | 20.6 |
| Medium | 2.7 | 1.3 | 0.7 | 22.7 |
| Large | 3.9 | 1.3 | 1.1 | 4.3 |
| Total Weight | 47.57 |
| Temperature [°C] | Amount of Oil [L/kg hops] | |
|---|---|---|
| Fresh | Dried | |
| 60 | 0.0024 | 0.0023 |
| SD | 0.0006 | 0.0005 |
| 65 | 0.0027 | 0.0024 |
| SD | 0.0003 | 0.0004 |
| Temperature [°C] | Essential Oils [g/kg hops] | |||||||
|---|---|---|---|---|---|---|---|---|
| Myrcene | Linalool | β-Caryophyllene | Humulene | |||||
| Fresh | Dried | Fresh | Dried | Fresh | Dried | Fresh | Dried | |
| 60 | 4.52 | 4.17 | 0.09 | 0.09 | 0.72 | 0.73 | 2.35 | 2.45 |
| SD | 0.90 | 1.30 | 0.01 | 0.08 | 0.21 | 0.35 | 0.71 | 1.16 |
| 65 | 7.30 | 5.09 | 0.14 | 0.10 | 0.76 | 0.75 | 2.47 | 2.54 |
| SD | 4.84 | 0.81 | 0.02 | 0.004 | 0.08 | 0.06 | 0.33 | 0.20 |
Publisher’s Note: MDPI stays neutral with regard to jurisdictional claims in published maps and institutional affiliations. |
© 2020 by the authors. Licensee MDPI, Basel, Switzerland. This article is an open access article distributed under the terms and conditions of the Creative Commons Attribution (CC BY) license (http://creativecommons.org/licenses/by/4.0/).
Share and Cite
Raut, S.; Gersdorff, G.J.E.v.; Münsterer, J.; Kammhuber, K.; Hensel, O.; Sturm, B. Impact of Process Parameters and Bulk Properties on Quality of Dried Hops. Processes 2020, 8, 1507. https://doi.org/10.3390/pr8111507
Raut S, Gersdorff GJEv, Münsterer J, Kammhuber K, Hensel O, Sturm B. Impact of Process Parameters and Bulk Properties on Quality of Dried Hops. Processes. 2020; 8(11):1507. https://doi.org/10.3390/pr8111507
Chicago/Turabian StyleRaut, Sharvari, Gardis J. E. von Gersdorff, Jakob Münsterer, Klaus Kammhuber, Oliver Hensel, and Barbara Sturm. 2020. "Impact of Process Parameters and Bulk Properties on Quality of Dried Hops" Processes 8, no. 11: 1507. https://doi.org/10.3390/pr8111507
APA StyleRaut, S., Gersdorff, G. J. E. v., Münsterer, J., Kammhuber, K., Hensel, O., & Sturm, B. (2020). Impact of Process Parameters and Bulk Properties on Quality of Dried Hops. Processes, 8(11), 1507. https://doi.org/10.3390/pr8111507