Communication

A Charge-Based Mechanistic Study into the Effects of Process Parameters on Fiber Accumulating Geometry for a Melt Electrohydrodynamic Process

Department of Mechanical Engineering, Stevens Institute of Technology, Hoboken, NJ 07030, USA
*
Author to whom correspondence should be addressed.
Processes 2020, 8(11), 1440; https://doi.org/10.3390/pr8111440
Submission received: 9 October 2020 / Revised: 4 November 2020 / Accepted: 9 November 2020 / Published: 11 November 2020
(This article belongs to the Section Materials Processes)

Abstract

:
Melt electrohydrodynamic processes, in conjunction with a moveable collector, have promising engineered tissue applications. However, the residual charges within the fibers deteriorate its printing fidelity. To clarify the mechanism through which the residual charges play roles and exclude the confounding effects of collector movement, a stationary printing mode is adopted in which fibers deposit on a stationary collector. Effects of process parameters on generalizable printing outcomes are studied herein. The fiber deposit bears a unique shape signature typified by a central cone surrounded by an outer ring and is characterized by a ratio of its height and base diameter Hdep/Ddep. Results indicate Hdep/Ddep increases with collector temperature and decreases slightly with voltage. Moreover, the steady-state dynamic jet deposition process is recorded and analyzed at different collector temperatures. A charge-based polarization mechanism describing the effect of collector temperature on the fiber accumulating shape is apparent in both initial and steady-state phases of fiber deposition. Therefore, a key outcome of this study is the identification and mechanistic understanding of collector temperature as a tunable process variable that can yield predictable structural outcomes. This may have cross-cutting potential for additive manufacturing process applications such as the melt electrowriting of layered scaffolds.

1. Introduction

Melt electrowriting processes, as an emergent technology utilizing the principle of electro-hydrodynamics and additive manufacturing [1,2], have aroused wide interest due to its ability to produce polymeric scaffold with tunable microarchitecture [3,4,5,6] and morphology [7,8,9,10,11]. Moreover, the solvent-free characteristic of the process makes it amenable for a broad application scope for engineered tissues [12,13,14,15,16,17,18]. However, the printing fidelity of the engineered scaffold notably deteriorates when the printing toolpath is designed for larger layering dimensions [19] or smaller feature pore sizes [20]. When the layering height of engineered scaffold exceeds a threshold (maximum 7 mm), the scaffold will lose its fidelity in the layering direction [19]. However, when pore size or the interfiber distance is small enough, the jet exposed to interaction from the preexisting fibers will deviate from its prescribed path, thus losing printing fidelity in the lateral direction [20]. This deterioration is attributed to many factors, including the jet instability and fiber sagging [21]. Among them, the most important factor is the residual charge entrapped within the scaffold [19], whose effects include the two primary aspects, charge amount and distribution. Considering the principle of electrohydrodynamic process and the semi-conductivity of processed polymeric melt, the jetted fiber carries a net positive charge [22,23]. However, due to the effect of external electric field, the existence of negative charges and its separation from positive charges (charge polarization), becomes critically important in affecting the interaction between the jet and deposit (i.e., whatever has been printed on the collector). While the amount of charge governs the jet-deposit repulsion, the charge polarization dictates the jet-deposit attraction. These two competing, coexisting effects define the distinctive behavior of jet deposition and the various printing outcomes.
Two methods have been studied to mitigate the effects of residual charge towards improving the printing fidelity, including dynamic control of an external electric field [19] and manipulation of substrate conductivity [20]. However, there are still several theoretical problems that need to b answered. First, although control of the external electric field and other process variables is beneficial in taming the in-flight jet [1,24], the formation of final printing outcomes depends more on the interaction between the jet and deposit, which has not been clarified. Second, the interaction on the jet from the deposit depends not only on the charge amount, but also the charge distribution within the deposit, or charge polarization, which has not previously been studied with rigor. Lastly, although the charge amount within the fiber can be tuned by changing substrate conductivity, it is inflexible, or even unfeasible to obtain a desired substrate material with appropriate conductivity. Moreover, this method has little effect when the jet deposits on layers away from the substrate.
To address these problems, a stationary printing mode is applied to elucidate the charge polarization mechanism and how it determines interaction between the jet and deposit, thus printing outcomes. Unlike a typical melt electrowriting process, the collector is kept motionless throughout the printing process, and the effect of any other process parameters can be reflected by the geometry of fiber accumulation. In this way, any effects due to a relative movement between jet and deposit, including jet lag and fluctuation in jet speed, can be eliminated, thus giving a more explainable result. Collector temperature is extensively studied considering its significant effect on charge polarization, and printing outcomes.

2. Materials and Methods

2.1. Material Preparation

Poly (ε-Caprolactone) (PCL, Capa 6500) is in the form of pellet with an average molecular weight (Mw) of 45,600 g/mol and polydiversity of 1.219 (Perstorp UK Ltd., Warrington, UK). A glass Luer-lock 5 mL syringe (Hamilton Company, Reno, NV, USA) is loaded with 5 g PCL pellets. An industrial heat gun (Steinel Inc., Bloomington, MN, USA) set at 160 °C is used to heat the syringe barrel with its needle-end upwards from bottom to top, until roughly half of the pellets melt into transparent liquid. The plunger is then pushed upwards so that the melt fills the space among the remainder pellets and expels the air out of the syringe barrel. The syringe is then placed vertically with its needle-end upwards in a laboratory convective oven (Sheldon Manufacturing Inc., Cornelius, OR, USA) set at 70 °C and heated overnight to remove any bubbles that may affect the process stability and the structural formability of fibers. After each experiment, the syringe is kept at room temperature to avoid unnecessary thermal degradation during storage.

2.2. Melt Electrohydrodynamic System Configuration

The electrohydrodynamic system applied in this paper is schematized in Figure 1. The barrel of the syringe is heated by the industrial heat gun set at 160 °C through a heating tunnel. The bottom of the heating tunnel is penetrated by the needle of the syringe and the exposed needle length is 2 mm. The plunger of the syringe is propelled by a programmable extrusion pump (Harvard Apparatus, Holliston, MA, USA). The needle of the syringe and the aluminum collector plate (203 mm × 203 mm × 3.3 mm) are connected to the positive and negative terminals of the high voltage supply (Gamma High Voltage Research Inc., Ormond Beach, FL, USA), respectively. The collector plate (shown in Figure 1) is fixed on a heat exchange element (DigiKey Electronics, Thief River Falls, MN, USA, 172 mm × 162 mm × 20 mm), which is mounted on an XY moving platform consisting of two X slides (Velmex Inc., Bloomfield, NY, USA). The inlet of the heat exchange element is connected to the faucet, which can adjust the temperature of the inflow water. The outflow water is discharged down the drain. Each time the situation of infill water is altered by turning the knob of the faucet, the temperature of the collector plate is monitored until it stabilizes at the target level for 15 min. Three levels of collector temperature are selected, which are referred to as high (30 ± 0.5 °C), medium (23.5 ± 0.5 °C), and low (16 ± 0.5 °C) collector temperature in this paper. The ambient temperature is kept at 23.5 ± 1 °C. The important parameters enabling the melt electrohydrodynamic process are shown in Table 1.

2.3. Imaging and Data Measurement

A 1080P, 60FPS, industry microscope camera with 0.5× to 4.5× objective (Lapsun, Hong Kong, CN) is used to take high resolution images and videos (Videos S1 and S2) of printing process. All the temperatures are measured by the thermometer (Cole-Parmer, Vernon Hills, IL, USA). The macroscopic dimensions of samples are measured by the slide caliper. Error bars in the figures represent the standard deviation of samples. At least 3 samples are measured for each data points. When necessary, data groups are compared pairwise using a t-test with Excel. The statistical significance is characterized by the probability p-value.

3. Results

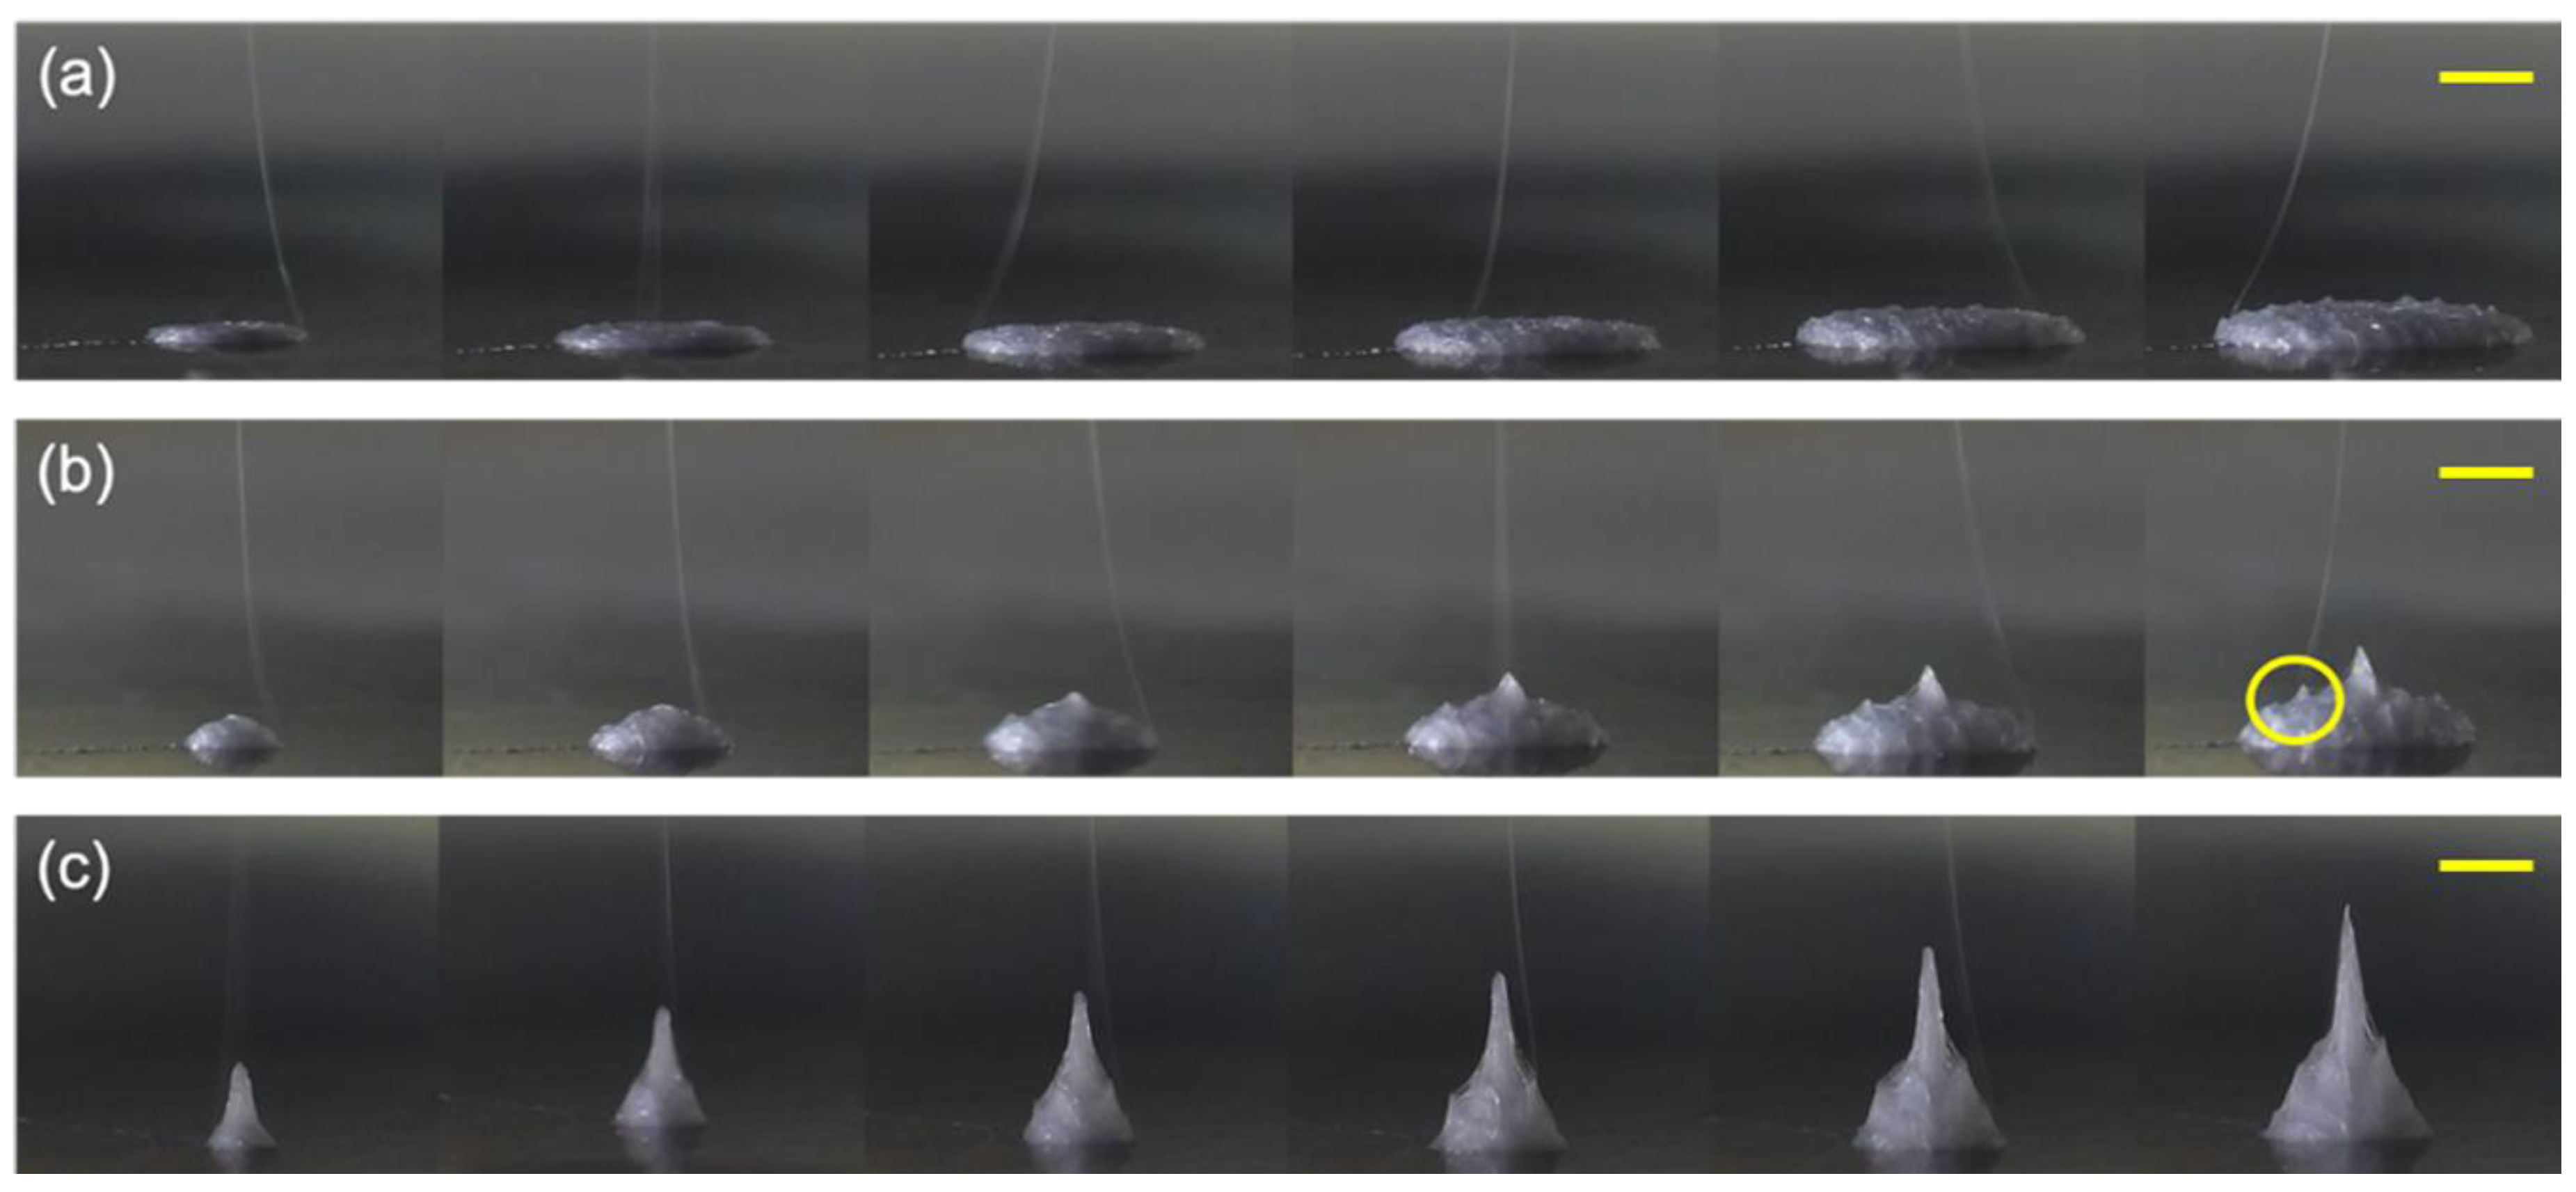
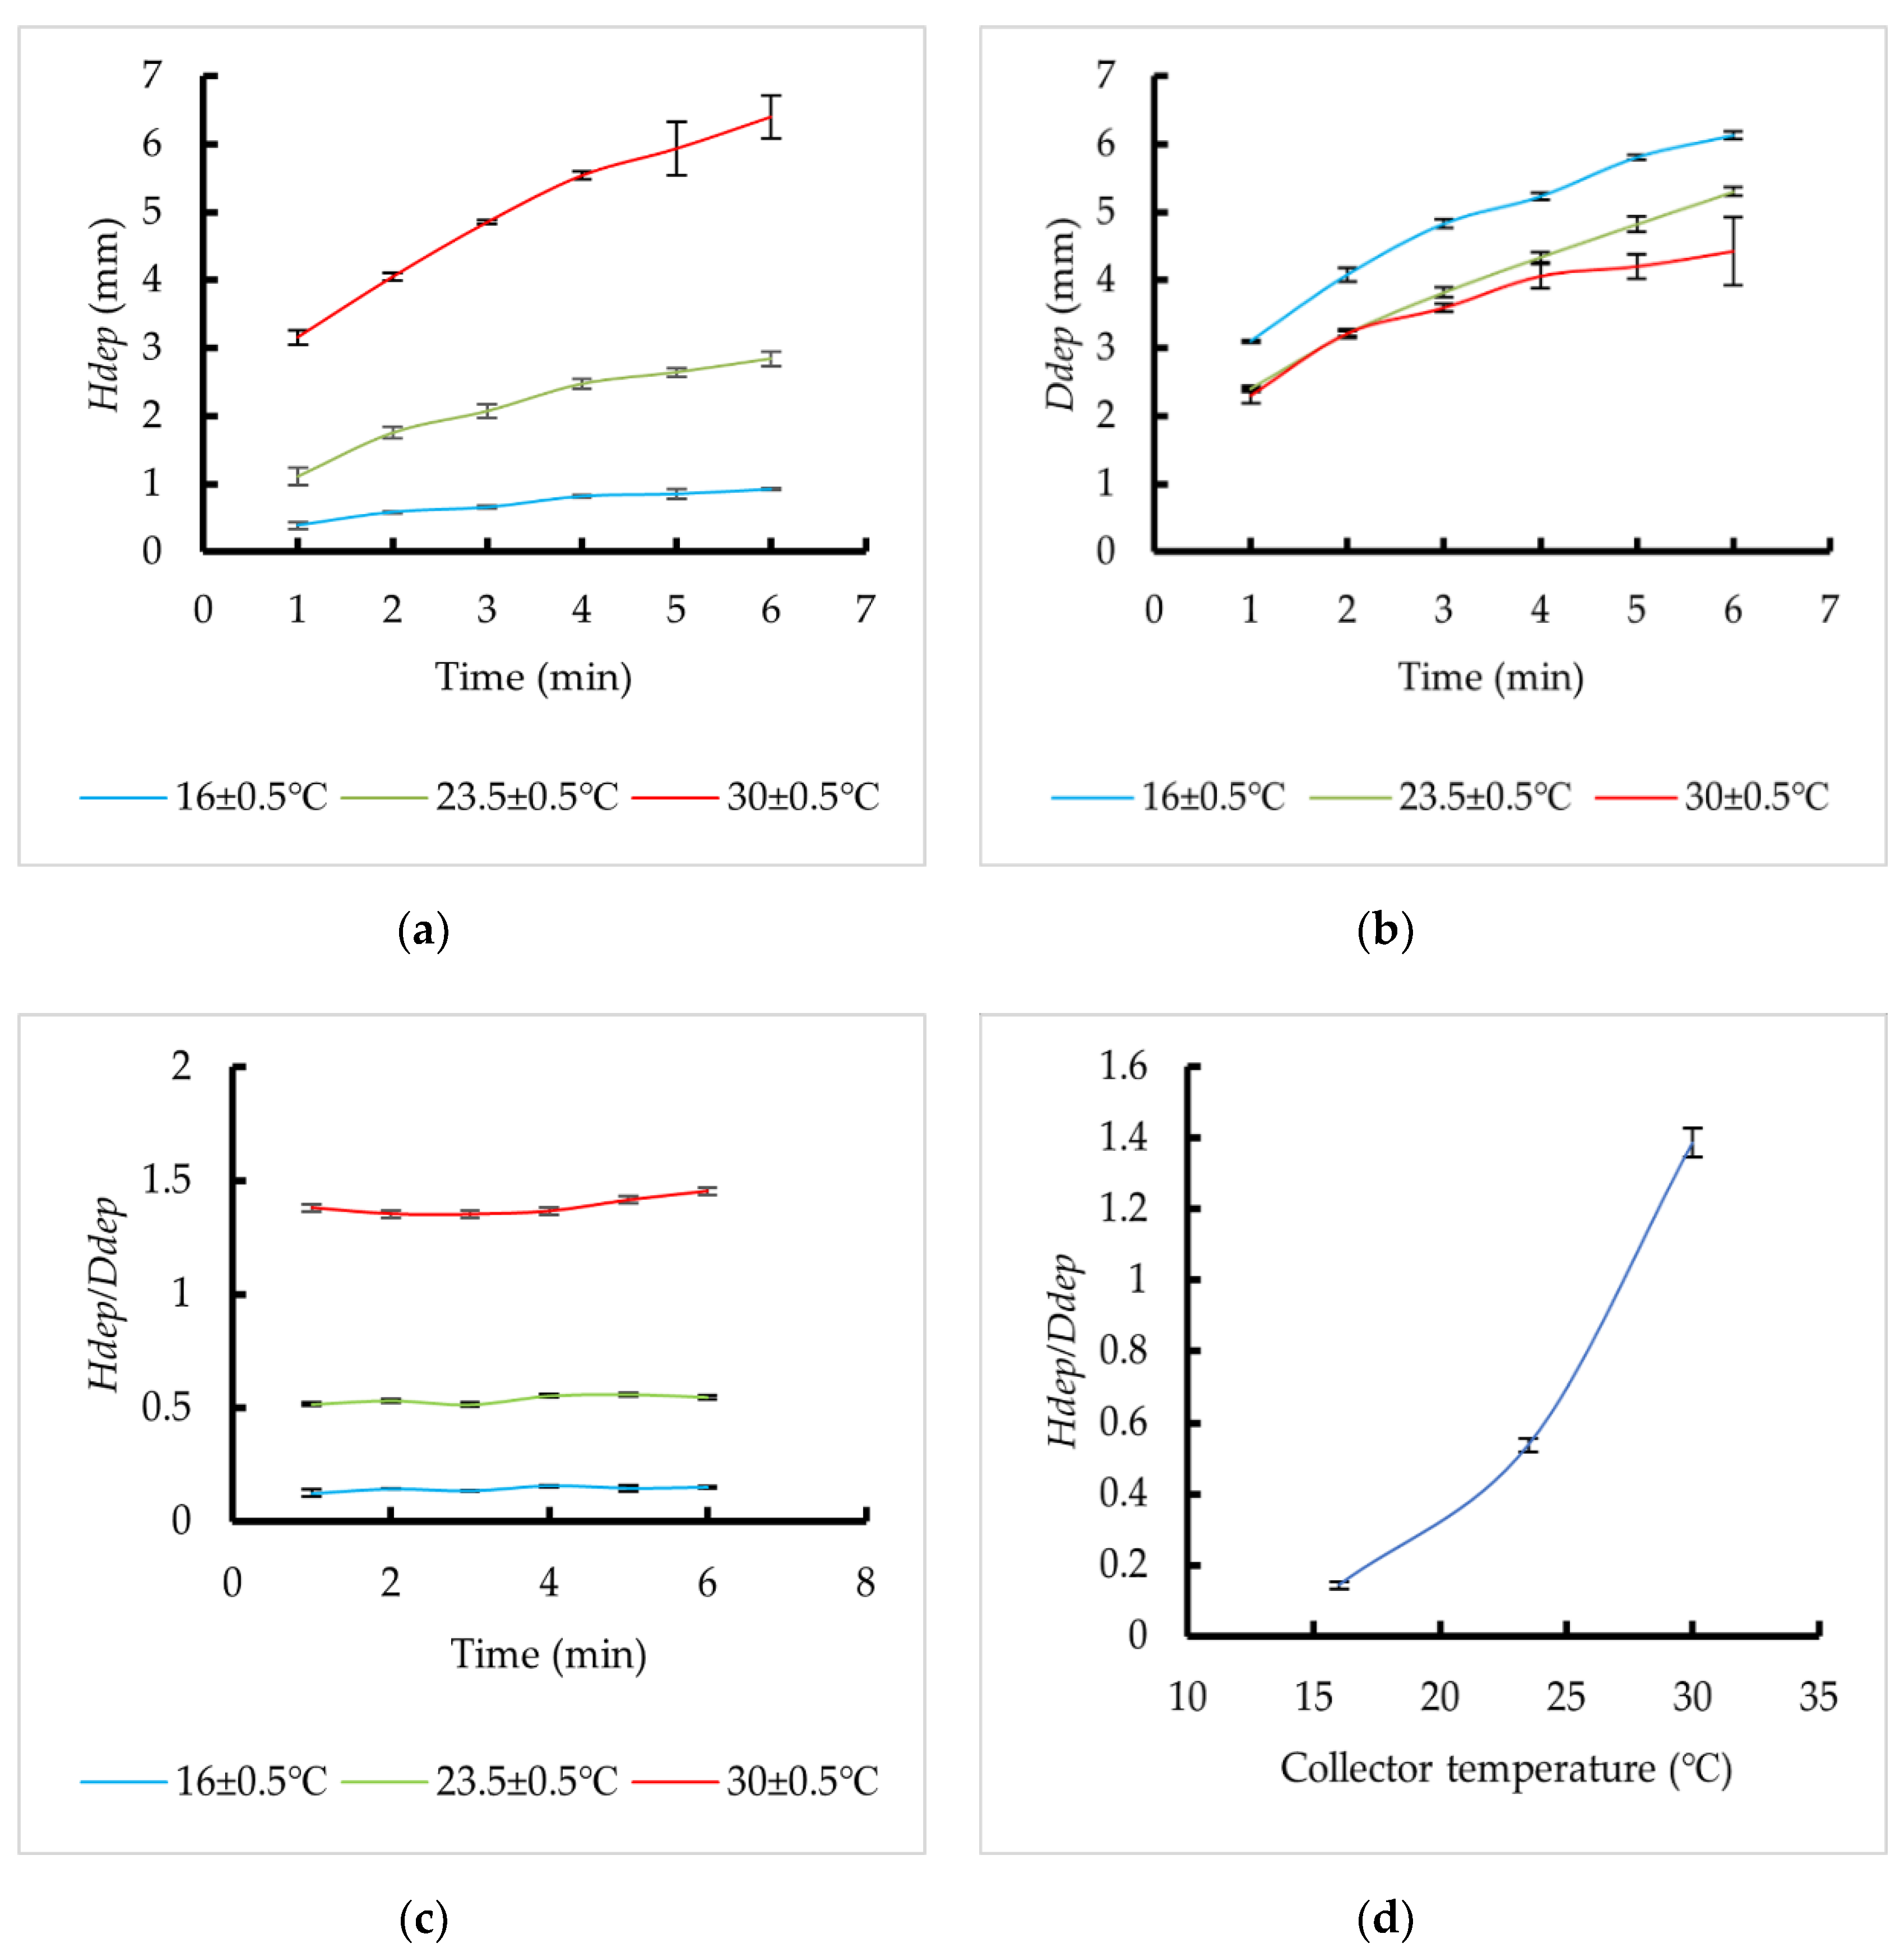
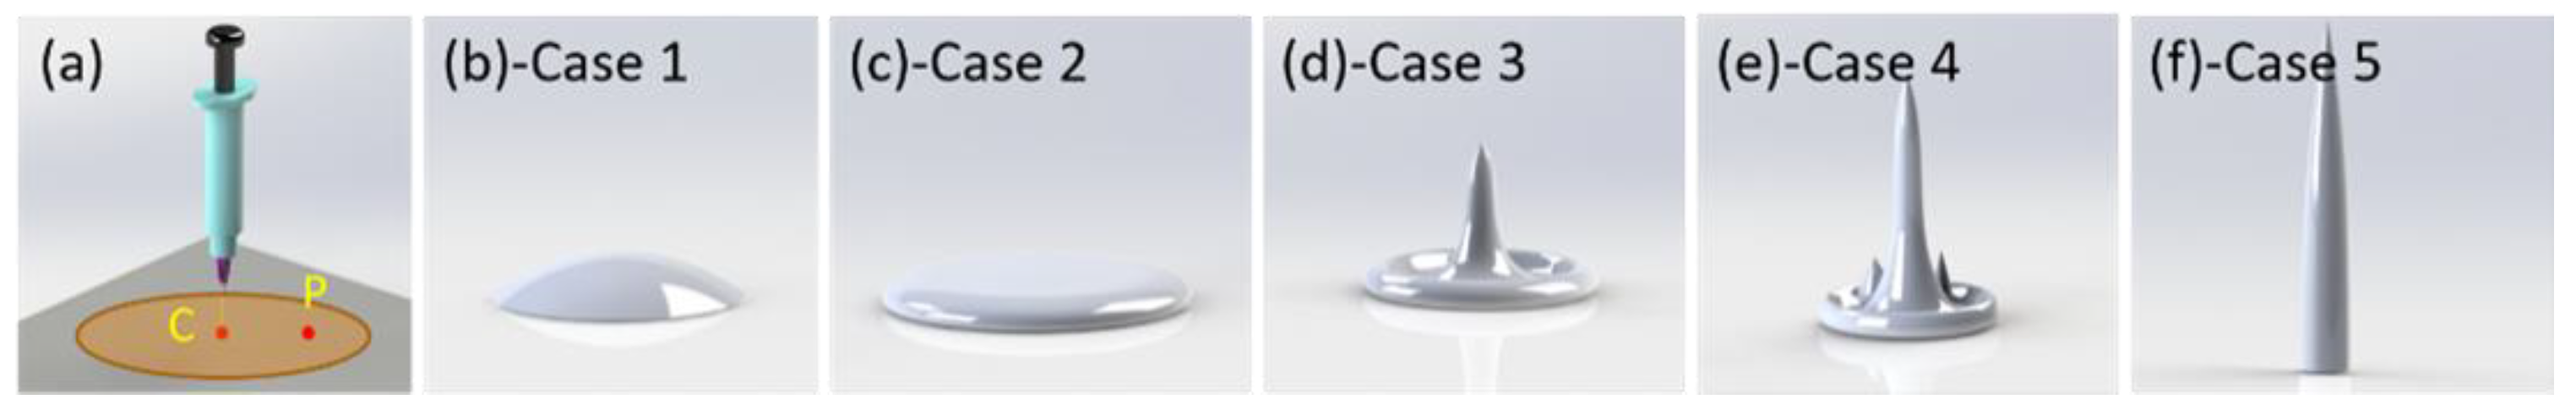
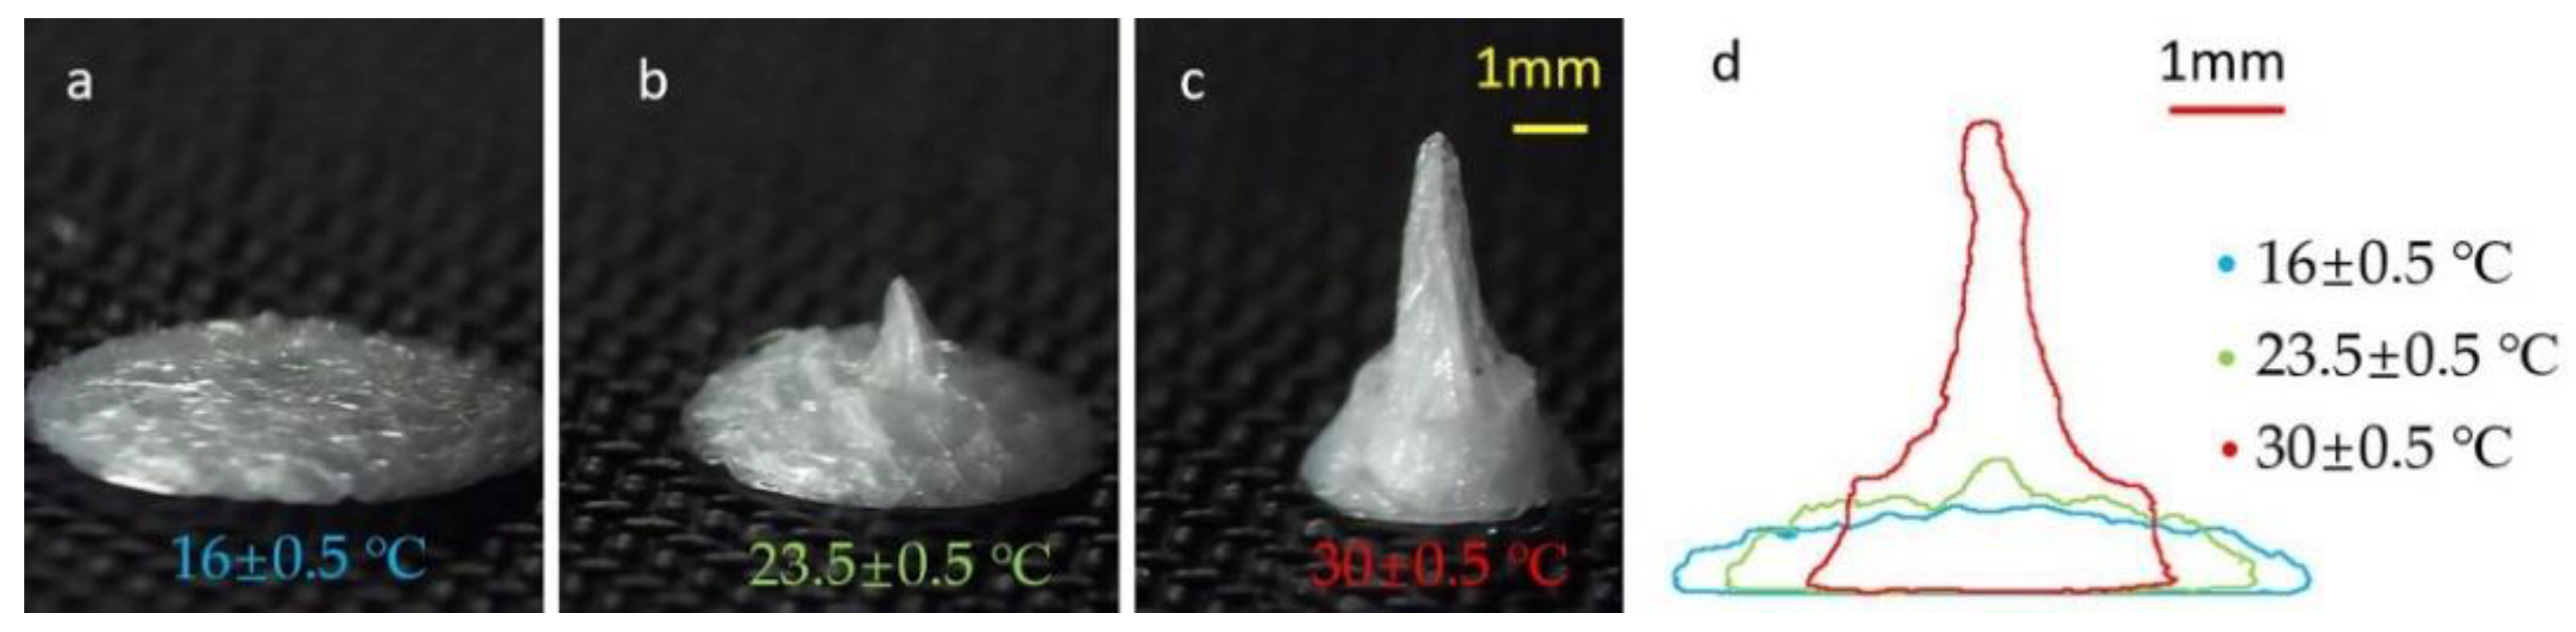
3.1. Effect of Deposition Time and Collector Temperature on Bulk Geometry of the Fiber Deposit

In a previous study, the bulk geometry of the fiber deposit based on melt electrospun fiber accumulation on a stationary collector is qualitatively determined to vary as a function of the substrate conductivity [20]. In contrast, this stationary printing mode study quantitatively measures the effect of varying collector temperature on the evolution of the bulk geometry on a bare aluminum collector plate with uniform conductivity. In order to tune the collector temperature parameter, water channel lines within the heat exchange element are prescribed varying temperatures in order to reach steady-state collector temperatures of 16 ± 0.5 °C, 23.5 ± 0.5 °C, and 30 ± 0.5 °C, with other parameters prescribed according to Table 1. The general observation here is that the shape of the bulk fiber deposit geometry is typically a high central cone encircled by an outer ring. Between the central cone and outer ring, several lower cones can also be vaguely identified upon closer inspection (highlighted in Figure 2b). When the temperature is 16 °C, the height difference between the central cone and outer ring is insignificant and the bulk geometry assumes a disk (Figure 3a), while, as the temperature increases, the identification of a characteristic cone-and-ring feature becomes apparent (Figure 3c). A side view profile comparison is shown in Figure 3d. The evolution of bulk geometry with deposition time is shown in Figure 2. To quantify the bulk geometry of the fiber deposit, three parameters are measured or calculated including its height (Hdep), base diameter (Ddep), and their ratio (Hdep/Ddep), as is shown in Figure 4. From Figure 4, both Hdep and Ddep increase as the deposition time increases, while Hdep/Ddep remains relatively constant, which is consistent with Figure 2. As the collector temperature increases, Hdep significantly increases and Ddep decreases, which results in the increase of Hdep/Ddep (Figure 4d).

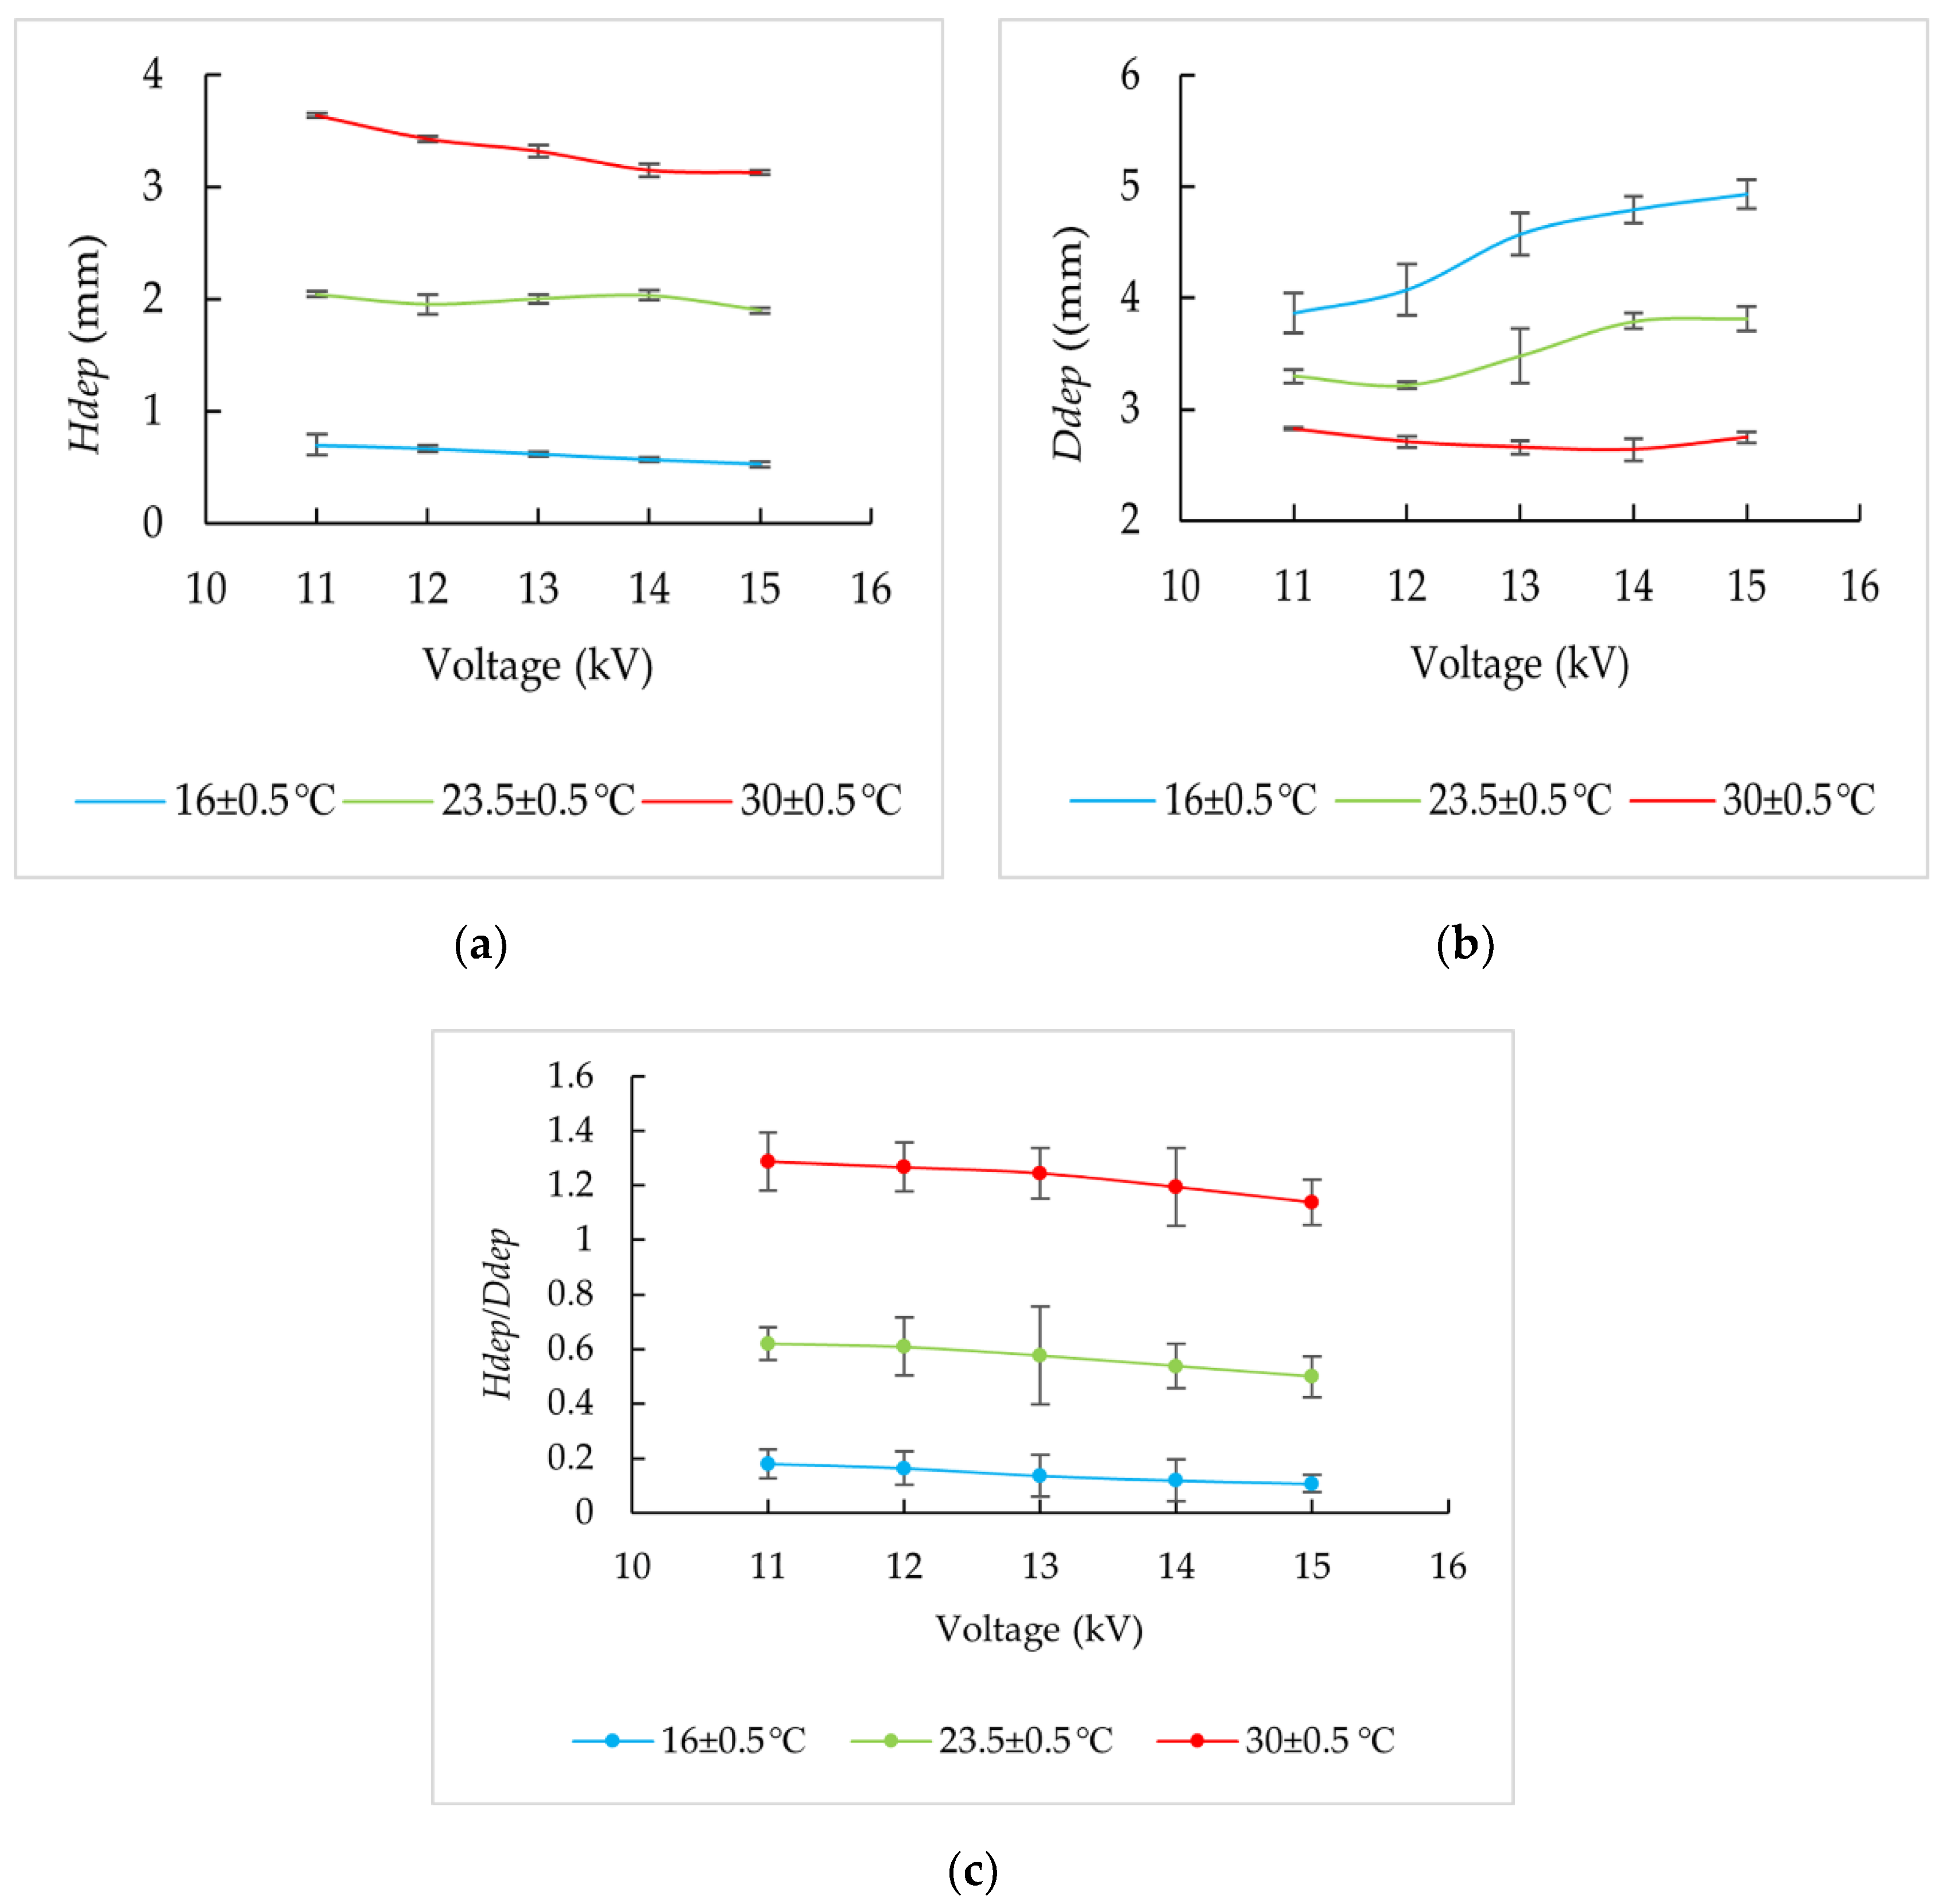
3.2. Effect of Voltage on Bulk Geometry of Fiber Deposit

For an enhanced understanding of the formation of fiber accumulation geometry, the effect of applied voltage on its three geometric parameters Hdep, Ddep, and Hdep/Ddep is studied. The deposition time is kept at 4 min, and the applied voltage is maintained within an operational range of 11 to 15 kV with the lower bound yielding fiber pulsing phenomena [25], and the upper bound with resultant sparking or termination of the electrospinning. As is shown in Figure 5, as the voltage increases, the height of the fiber accumulation and Hdep/Ddep decreases slightly while the base diameter increases (almost unchanged at 30 °C).

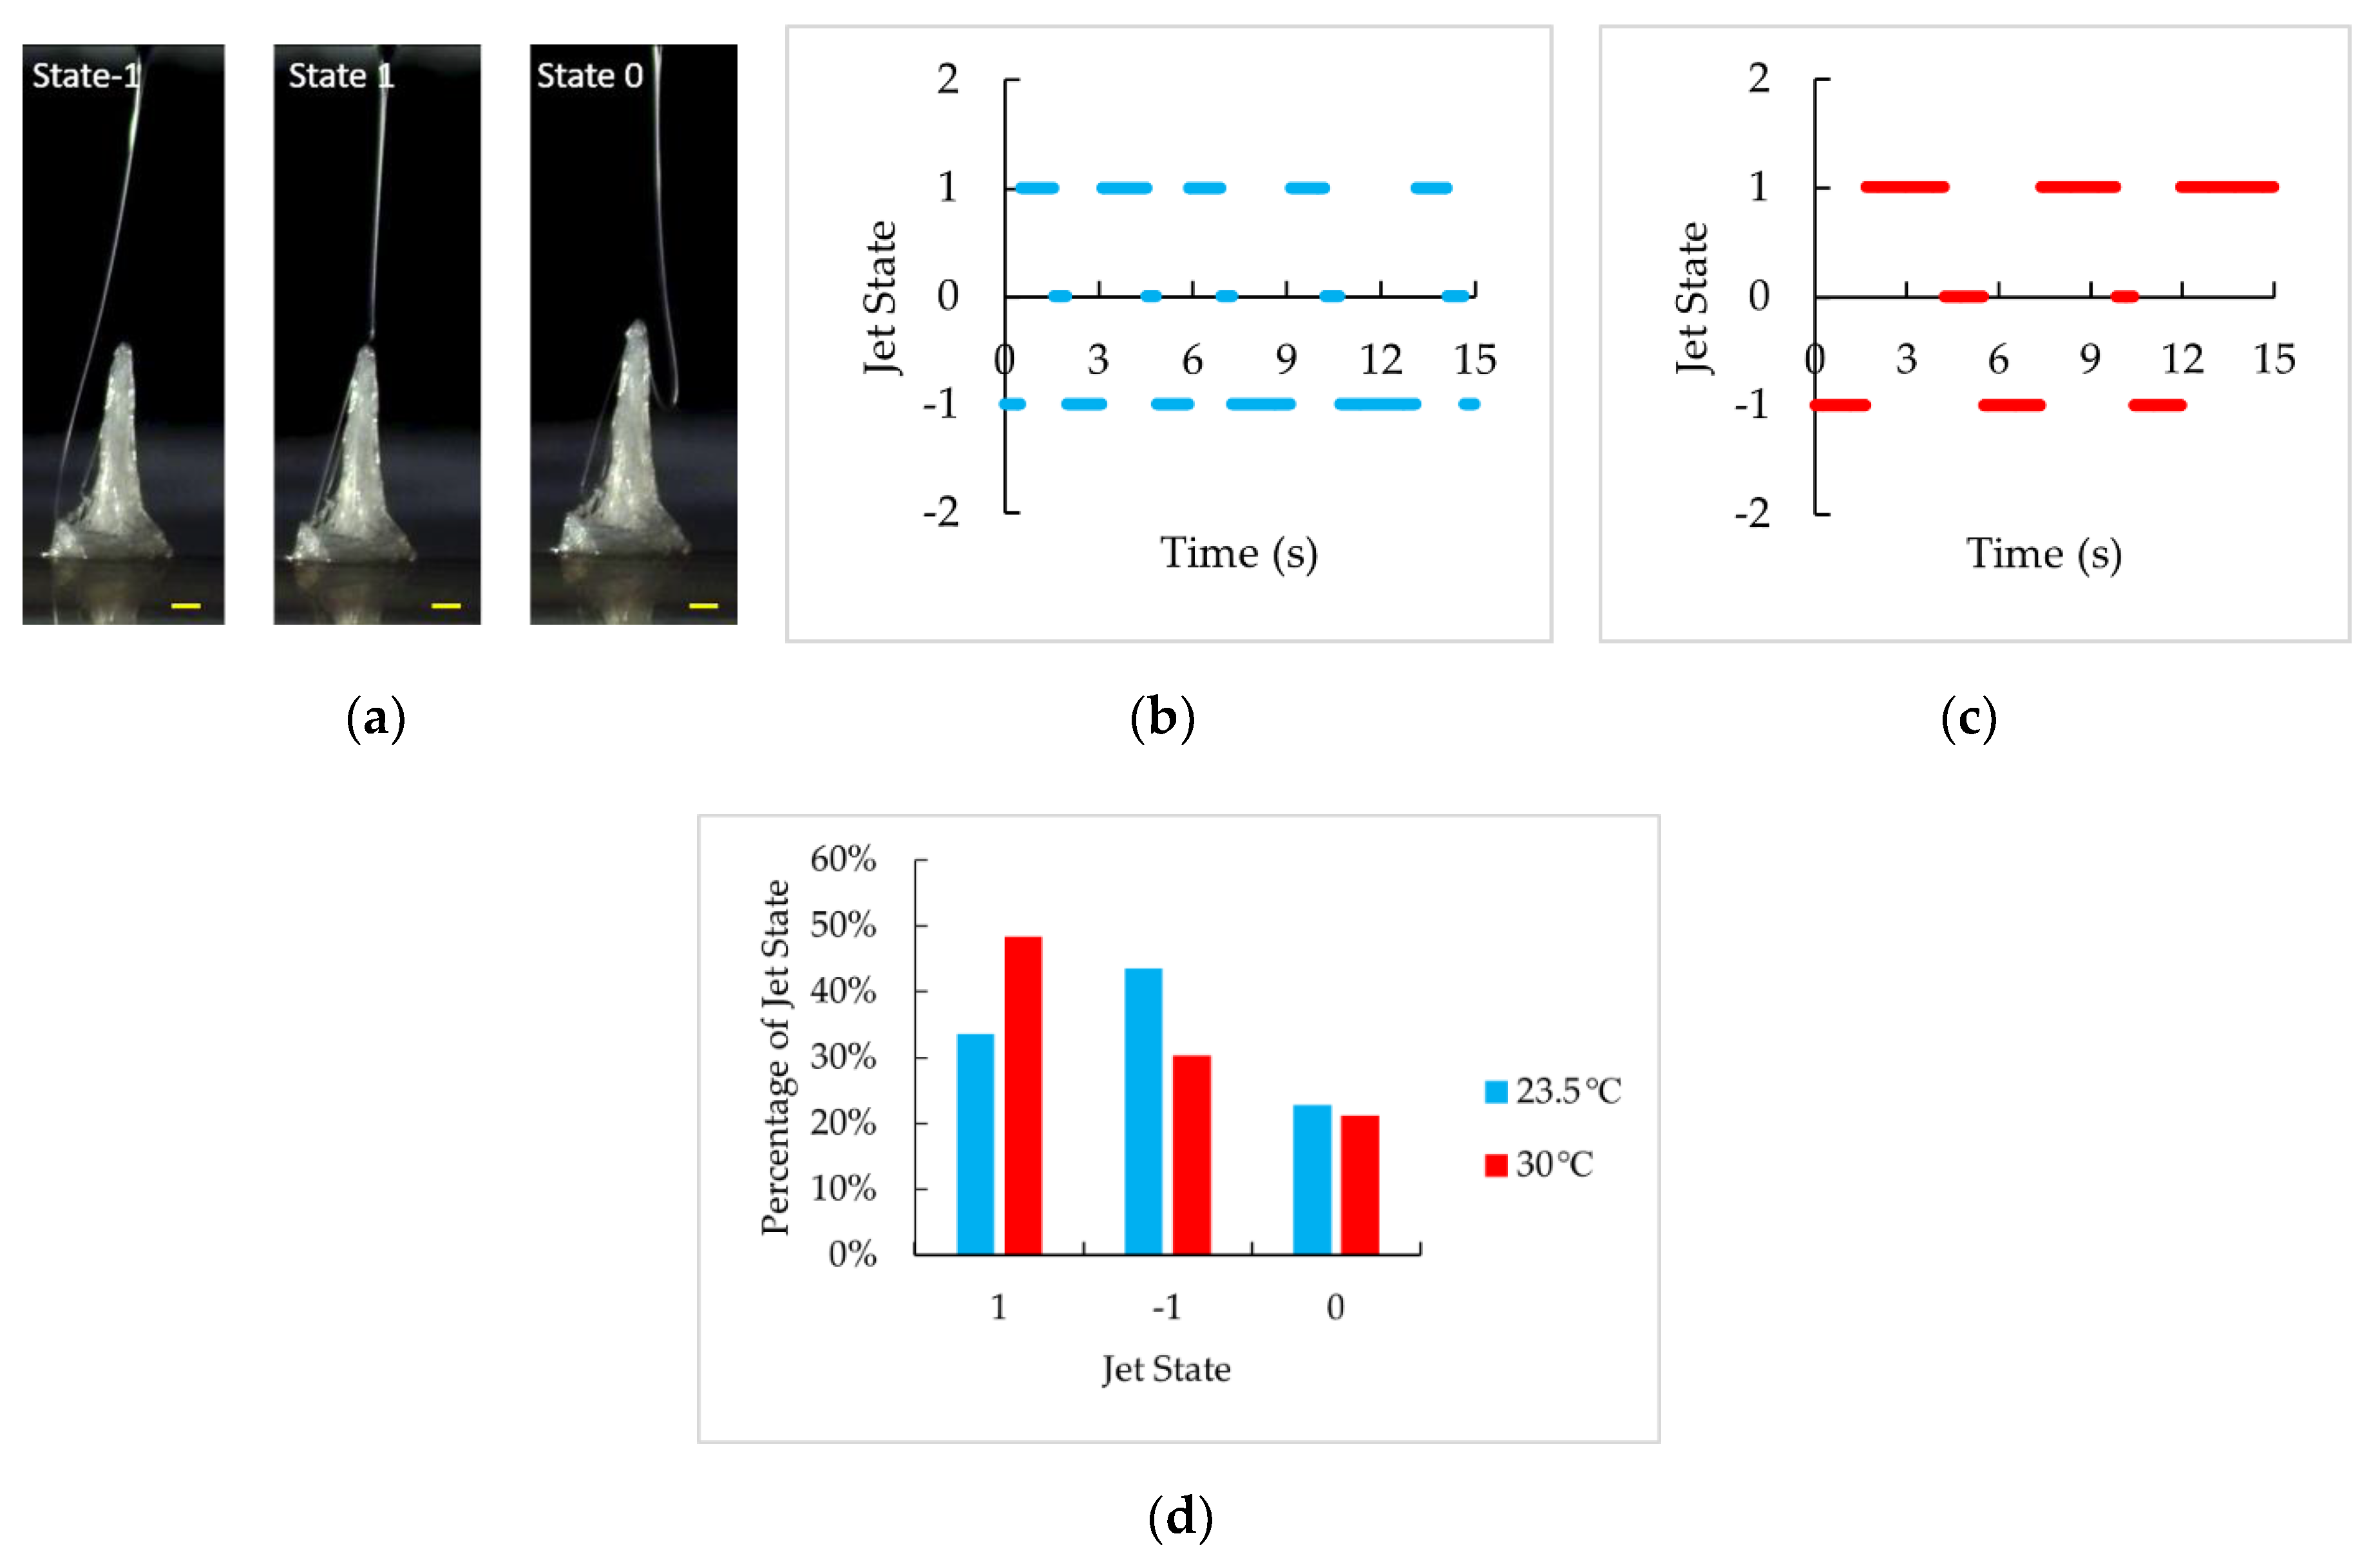
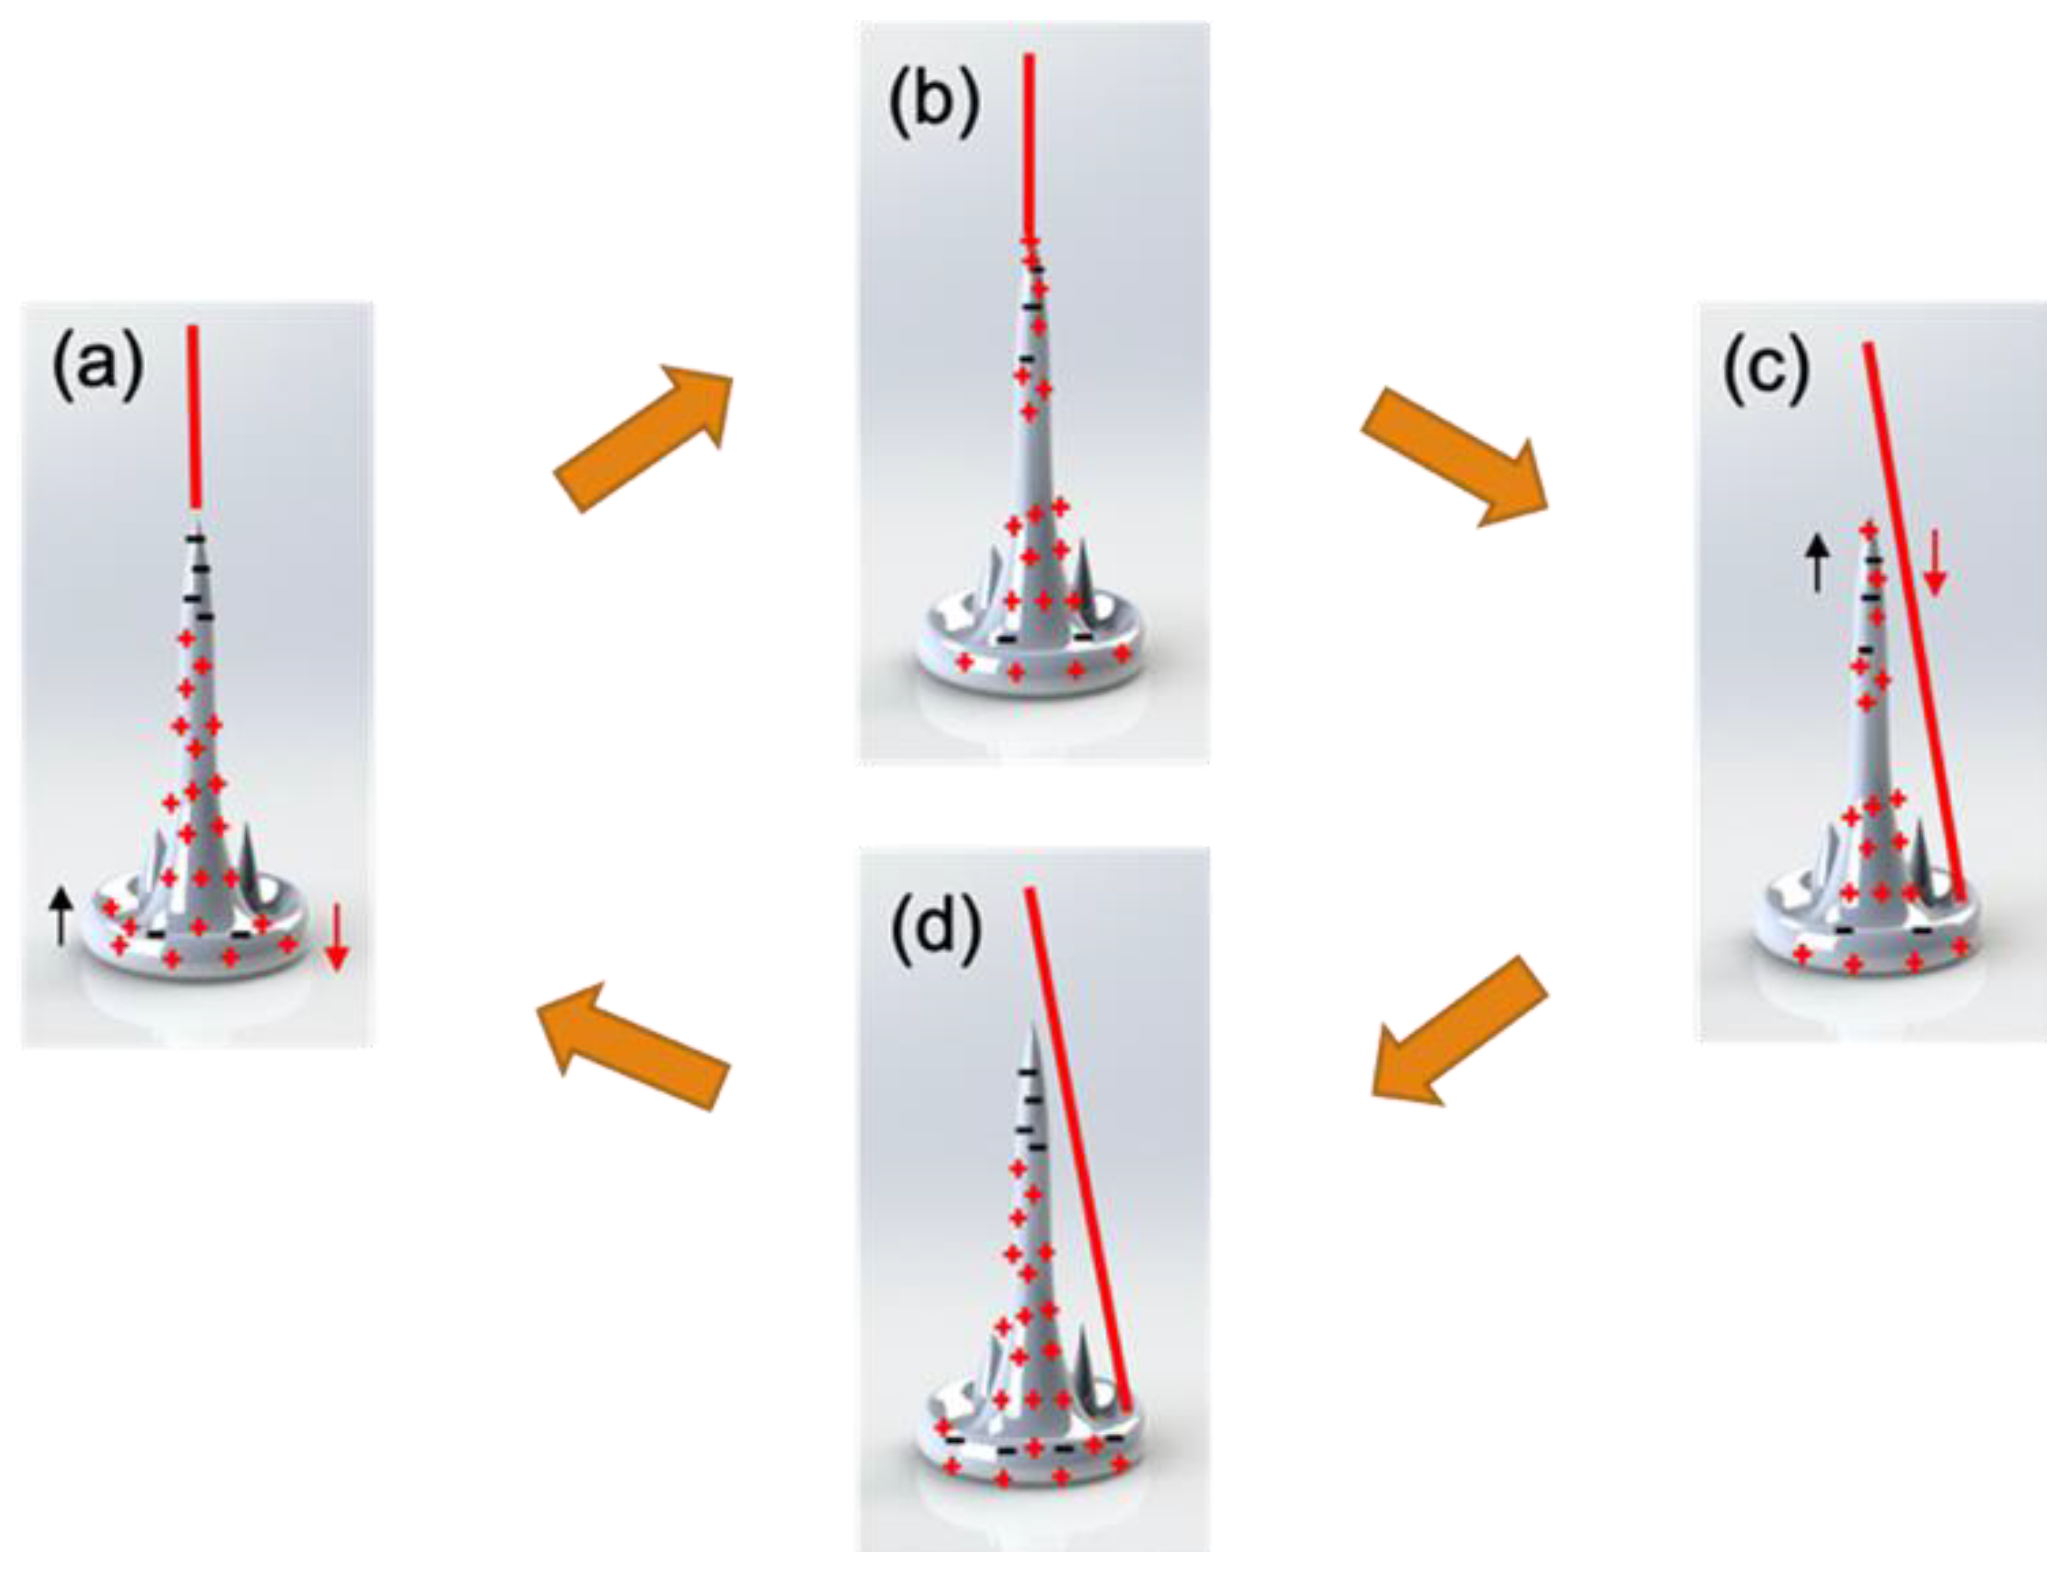
3.3. Observation of Jet States and Its Dependence on Collector Temperature

To further clarify the geometric formation of fiber accumulation, how the jet is deposited on the cumulative fiber deposits is characterized over a period of deposition time. Observation indicates that at 23.5 °C and 30 °C when the cone-and-ring feature of the cumulative fiber deposits becomes discernible, the jet will swiftly switch between different states and alternately deposit on the central cone and outer ring during the printing process. Based on this, the jet states are categorized as 1, −1 and 0 (shown in Figure 6), which represents the jet resides on the central cone, outer ring or in the transition state, respectively. Two 15 s videos (Video S1 for 23.5 °C and Video S2 for 30 °C) are recorded and analyzed for their constituent frames. Results show that state 1, 0, and −1 arise sequentially and cyclically (1→0→−1→1→0→−1···). In other words, between states 1→−1, the jet deposition point descends from the central cone to the outer ring, featuring an observable transition state (0). However, ascending from −1→1 is transient, whereby the jet deposition point effectively “jumps” directly from the outer ring to the central cone. It is also noteworthy that, at 30 °C, the deposition point switches between the central cone and outer ring less frequently and resides longer at the central cone compared to that at 23.5 °C (Figure 6c).

4. Discussion

In this study, the stationary printing mode of operation represents an idiosyncratic and predictable process, during which the whipping motion of the jet, along with the distortion of the jet due to its impact with the collector [26], play significant roles in determining the geometric formation of the cumulative fiber deposits. Furthermore, the competing charge effects of jet attraction and repulsion with the fiber deposits also contribute to the process outcomes. To frame the initial deposition behavior of fibers in a probabilistic manner, the schematic in Figure 7a depicts a central point C on the collector directly below the needle and a typical deposition point p located at an arbitrary radial distance from point C. Moreover, the orange circular area represents the sets of all probabilistic points where the fibers may be deposited. Based on this framework, the probability of the fiber deposition will generally decrease radially outward. To be sure, the initial cumulative fiber deposits represents a statistical average over a significant process duration rather than an outcome that can be predicted at an instantaneous point in time. In an ideal Case 1 where the absence of charge effects is hypothesized, the combined effects of whipping motion of the jet and buckling impact from the collector will presumably result in a dome-like fiber deposition shape, regardless of the collector temperature (Figure 7b). However, when the charge effect is considered, collector temperature makes a difference. Along the spectrum of possible fiber deposit shapes as a function of collector temperature, four other discrete cases can be considered in this study.
For a low collector temperature setting (around 16 °C) in Case 2, the introduction of fiber repulsion weakens the dependence of deposition probability at each point in the orange area in Figure 7a on its location, and results in a characteristic disc-like fiber deposition shape (Figure 7c). Instantaneously, the fibers may have a higher probability of depositing at some existing points of transient material accumulation. However, the weak polarization and the accumulated fiber repulsion redirect the fiber trajectory away from these existing material deposits, yielding a relatively uniform thickness of fiber deposition. By contrast, in Case 4 (Figure 7e) at high collector temperatures (around 30 °C), the involvement of polarization strengthens the dependence of deposition probability at each point in the orange area in Figure 7a on its location, which can be explained as follows. Due to the difference of deposition probability at each point, points at the center are more likely to accumulate more material, thus forming a protuberance, where the local electric field is stronger. In turn, the local stronger electric field makes the protuberance polarized even more heavily, which means more negative charges are separated and move upwardly over a further distance. The result is that the upper part of the protuberance accumulates more negative charge and attracts the jet to be deposited there more frequently and makes it even higher. From the perspective of probability, the fiber is most likely deposited at the point right below the needle (C in Figure 7a), less at its surrounding area (orange area in Figure 7a) and least at the outer part (outside the orange perimeter in Figure 7a), thus resulting in a maximum cone peak at the center, several local maximum cone peaks around it, and bound by an outermost ring (Figure 7e). Herein, the increment in collector temperature modifies the jet trajectory to one that is increasingly attracted by the fiber accumulation, especially by the central peak. The result is that the fiber deposits have a lower probability of spiraling down, yielding relative increases in Hdep and decreases in Ddep. Case 3 at medium temperature (around 23.5 °C) in Figure 7d is a transitioning state from Case 2 to Case 4. Finally, if extremely high collector temperatures are prescribed as in Case 5 in Figure 7f, the jet will be attracted by the fiber deposit tightly, stop whipping and deposit continuously at the point right below the needle, thus the fiber accumulation will be like a pole.
The probabilistic behavior explains the initiation of different shapes of fiber deposit. After the initial shape has been formed (after 2 min), the jet deposition reaches a steady state and becomes more predictable. Since the prescribed range of collector temperatures in this study results in the fiber deposit shapes illustrated in Figure 7c–e and Case 3 in Figure 7d represents a typical state of fiber accumulation, the jet deposition behavior in steady state for this case is dynamically recorded and analyzed. Results indicate that the location of jet deposition point is determined by the polarization state of the deposit (shown in Figure 8), and switches between the central cone and the outer periphery ring (Figure 6b,c). In Figure 8a, the jet has just returned to the central cone from the outer ring because the cone has been sufficiently polarized, and the upper part of the cone is abundant with negative charge. The incoming positively charged jet mixes with the negative charge in the cone (Figure 8b), until the increasing positive charge repels the jet to the outer ring (Figure 8c), which has been sufficiently polarized. While the jet is deposited at the outer ring, the charge in the cone is gradually redistributed because of external electric field (Figure 8d). Therefore, the jet is attracted back to the cone again (Figure 8a). This forms a cycle in which deposition and polarization happens cyclically at both the cone and ring. Again, it should be noted that the cone-and-ring model only depicts the jet’s predictable behavior after the basic shape of fiber deposit has already formed (printing time > 2 min), so it provides limited insight into the formation of lower cone shown in Figure 2b, which happens at earlier printing time.
The effect of collector temperature on the dynamic process is mainly represented by the time percentage when the jet stays on the central cone and the switching frequency of jet state. As the collector temperature increases, the extent of polarization also increases, which means that the negative charges move the cone upwards over a further distance; therefore, the net positively charged jet will reside on the cone for a longer period (Figure 6c), and the jet deposition switches less frequently between the cone and ring (Figure 6a,b).
Based on the analysis on the formation of fiber accumulation and our previous study, effects of process parameters on its geometry are apparent [20]. Change of any parameter that helps improvement of polarization will increase Hdep and change of any parameter that produces more positive charge will increase Ddep. Moreover, the relative significance of these two effects determines the shape of fiber deposit, which will result in a cone-and-ring structure if large, and a flat disk structure if small. Therefore, Hdep/Ddep can be regarded as an indicator of the strength ratio of the extent of polarization to the charge repulsion effect (or the strength ratio of fiber attraction to repulsion). Fundamentally, substrate conductivity will affect the amount of net positive charge, while collector temperature will affect the extent of polarization. The increase of substrate conductivity and collector temperature helps to decrease the amount of net positive charge and promote the polarization, respectively, which helps the formation of cone-and-ring structure. In contrast, when the substrate conductivity and collector temperature decreases, the amount of net positive charge increases and the extent of polarization decreases, which is beneficial to the formation of disk-like structure. As is shown in Figure 4, since the collector temperature mainly affects the extent of polarization, Hdep, instead of Ddep, is significantly affected. Due to the weakening of polarization as the collector temperature decreases, the jet is subject to weaker attraction from the cone, more material will be deposited on the periphery, and Ddep correspondingly increases.
It is evident that, in addition to collector temperature, the extent of polarization is also affected by the local electric field strength. Considering its effect on net positive charge, as the voltage increases, both Hdep and Ddep are expected to increase. However, the results from studying the effect of voltage on fiber accumulation geometry (Figure 5) are inconsistent with the expectation of Hdep and can be explained as follows. First, an increment in the voltage yields an increase in the jet speed, whose stronger impact on the area of existing fiber deposit effectively decreases its height. Second, an increment in the voltage leads to an intensification in the whipping motion, which makes the jet more likely to spiral down along the periphery. Both the decrease of Hdep and increase of Ddep result in smaller Hdep/Ddep (Figure 5). However, compared to voltage, collector temperature is a more tunable process variable sensitive to affecting the shape of fiber accumulation. By changing the collector temperature from 16 °C to 30 °C, Hdep/Ddep increases approximately 10 times from 0.14 to 1.38, while, by changing the voltage from 15kV to 11 kV, Hdep/Ddep increases 1.14 to 1.29.

5. Conclusions

In the stationary printing mode of operation for a melt electrohydrodynamic process, the fiber accumulation geometry, as characterized by the ratio of its height to its base diameter (Hdep/Ddep), is found to be affected by the two key process variables of collector temperature and voltage. Within the experimental variable ranges studied herein, collector temperature is determined to be a more tunable process variable with significant downstream formation of the fiber deposition shape. Specifically, the collector temperature plays a mechanistic role by affecting the charge polarization process in the initial deposit and thus affecting the probabilistic deposition behavior of the jet. By dynamically observing the steady-state deposition process, the jet is found to alternatingly deposit between the central cone and outer ring as a function of time. As the collector temperature increases, the jet deposition point resides longer on the central cone and switches its states less frequently as predicted by the polarization mechanism. Although the stationary printing mode of operation investigated in this study does not yield engineered porous 3D tissue scaffolds, the advanced approach reveals the generalizable effects of collector temperature on charge polarization on fiber deposition shape. As a result, this work sheds light on the explanation of charged-related phenomena in other melt electrohydrodynamic processes, such as melt electrowriting of microscale porous structures.

Supplementary Materials

The following are available online at https://www.mdpi.com/2227-9717/8/11/1440/s1, Video S1: Video of jet deposition at 23.5 °C, Video S2: Video of jet deposition at 30 °C.

Author Contributions

Conceptualization, K.C. and R.C.C.; methodology, K.C.; software, F.Z.; validation, K.C. and F.Z.; formal analysis, K.C.; investigation, K.C.; resources, K.C.; data curation, K.C.; writing—original draft preparation, K.C.; writing—review and editing, K.C. and R.C.C.; visualization, K.C.; supervision, R.C.C.; project administration, R.C.C.; funding acquisition, R.C.C. All authors have read and agreed to the published version of the manuscript.

Funding

The research was funded by the National Science Foundation under Award No. CMMI-MME-1663095 and the U.S. Army Medical Research and Development Command under Award No. USAMRDC-W81XWH-19-1-0158. Any opinions, findings, and conclusions or recommendations expressed in this publication are those of the authors and do not necessarily reflect the views of the National Science Foundation or the U.S. Army Medical Research and Development Command.

Conflicts of Interest

The authors declare no conflict of interest. The funders had no role in the design of the study; in the collection, analyses, or interpretation of data; in the writing of the manuscript, or in the decision to publish the results.

References

  1. Robinson, T.M.; Hutmacher, D.W.; Dalton, P.D. The Next Frontier in Melt Electrospinning: Taming the Jet. Adv. Funct. Mater. 2019, 29, 1904664. [Google Scholar] [CrossRef] [Green Version]
  2. Alexander, F.A., Jr.; Johnson, L.; Williams, K.; Packer, K. A Parameter Study for 3D-Printing Organized Nanofibrous Collagen Scaffolds Using Direct-Write Electrospinning. Materials 2019, 12, 4131. [Google Scholar] [CrossRef] [PubMed] [Green Version]
  3. Piyasin, P.; Yensano, R.; Pinitsoontorn, S. Size-Controllable Melt-Electrospun Polycaprolactone (PCL) Fibers with a Sodium Chloride Additive. Polymers 2019, 11, 1768. [Google Scholar] [CrossRef] [PubMed] [Green Version]
  4. Ibrahim, Y.S.; Hussein, E.A.; Zagho, M.M.; Abdo, G.G.; Elzatahry, A.A. Melt Electrospinning Designs for Nanofiber Fabrication for Different Applications. Int. J. Mol. Sci. 2019, 20, 2455. [Google Scholar] [CrossRef] [PubMed] [Green Version]
  5. Jun, I.; Han, H.; Edwards, J.R.; Jeon, H. Electrospun Fibrous Scaffolds for Tissue Engineering: Viewpoints on Architecture and Fabrication. Int. J. Mol. Sci. 2018, 19, 745. [Google Scholar] [CrossRef] [Green Version]
  6. Mao, M.; He, J.; Li, X.; Zhang, B.; Lei, Q.; Liu, Y.; Li, D. The emerging frontiers and applications of high-resolution 3D printing. Micromachines 2017, 8, 113. [Google Scholar] [CrossRef]
  7. Brown, T.D.; Edin, F.; Detta, N.; Skelton, A.D.; Hutmacher, D.W.; Dalton, P.D. Melt electrospinning of poly(ε-caprolactone) scaffolds: Phenomenological observations associated with collection and direct writing. Mater. Sci. Eng. C 2015, 45, 698–708. [Google Scholar] [CrossRef]
  8. Jin, Y.; Gao, Q.; Xie, C.; Li, G.; Du, J.; Fu, J. Fabrication of heterogeneous scaffolds using melt electrospinning writing: Design and optimization. Mater. Des. 2020, 185, 108274. [Google Scholar] [CrossRef]
  9. Tourlomousis, F.; Jia, C.; Karydis, T.; Mershin, A.; Wang, H.; Kalyon, D.M.; Chang, R.C. Machine learning metrology of cell confinement in melt electrowritten three-dimensional biomaterial substrates. Microsyst. Nanoeng. 2019, 5, 15. [Google Scholar] [CrossRef] [Green Version]
  10. Chen, H.; De Botelho, A.; Braga, F.; Van Blitterswijk, C.; Mota, C.; Wieringa, P.A.; Moroni, L. Direct Writing Electrospinning of Scaffolds with Multidimensional Fiber Architecture for Hierarchical Tissue Engineering. ACS Appl. Mater. Interfaces 2017, 9, 38187–38200. [Google Scholar] [CrossRef]
  11. Rogalski, J.J. PA6 Nanofibre Production: A Comparison between Rotary Jet Spinning and Electrospinning. Fibers 2018, 6, 37. [Google Scholar] [CrossRef] [Green Version]
  12. Muerza-Cascante, M.L.; Haylock, D.; Hutmacher, D.W.; Dalton, P.D. Melt Electrospinning and Its Technologization in Tissue Engineering. Tissue Eng. Part B Rev. 2015, 21, 187–202. [Google Scholar] [CrossRef] [PubMed]
  13. Paşcu, E.I.; Cahill, P.A.; Stokes, J.; McGuinness, G.B. Towards functional 3D-stacked electrospun composite scaffolds of PHBV, silk fibroin and nanohydroxyapatite: Mechanical properties and surface osteogenic differentiation. J. Biomater. Appl. 2016, 30, 1334–1339. [Google Scholar] [CrossRef] [PubMed]
  14. Gwiazda, M.; Kumar, S.; Świeszkowski, W.; Ivanovski, S.; Vaquette, C. The effect of melt electrospun writing fiber orientation onto cellular organization and mechanical properties for application in Anterior Cruciate Ligament tissue engineering. J. Mech. Behav. Biomed. Mater. 2020, 104. [Google Scholar] [CrossRef]
  15. Su, Y.; Zhang, Z.; Wan, Y.; Zhang, Y.; Wang, Z.; Klausen, L.H.; Huang, P.; Dong, M.; Han, X.; Cui, B.; et al. A hierarchically ordered compacted coil scaffold for tissue regeneration. NPG Asia Mater. 2020, 12, 4–13. [Google Scholar] [CrossRef]
  16. Zaiss, S.; Brown, T.D.; Reichert, J.C.; Berner, A. Poly(ε-caprolactone) scaffolds fabricated by melt electrospinning for bone tissue engineering. Materials 2016, 9, 232. [Google Scholar] [CrossRef] [Green Version]
  17. Afghah, F.; Dikyol, C.; Altunbek, M.; Koc, B. Biomimicry in Bio-Manufacturing: Developments in Melt Electrospinning Writing Technology Towards Hybrid Biomanufacturing. Appl. Sci. 2019, 9, 3540. [Google Scholar] [CrossRef] [Green Version]
  18. Applications, B.; Partheniadis, I.; Nikolakakis, I.; Laidmäe, I. A Mini-Review: Needleless Electrospinning of Nanofibers for Pharmaceutical and Biomedical Applications. Processes 2020, 8, 673. [Google Scholar] [CrossRef]
  19. Wunner, F.M.; Wille, M.; Noonan, T.G.; Bas, O.; Dalton, P.D.; De-juan-pardo, E.M.; Hutmacher, D.W. Melt Electrospinning Writing of Highly Ordered Large Volume Scaffold Architectures. Adv. Mater. 2018, 30, 1706570. [Google Scholar] [CrossRef]
  20. Ding, H.; Cao, K.; Zhang, F.; Boettcher, W.; Chang, R.C. A Fundamental Study of Charge Effects on Melt Electrowritten Polymer Fibers. Mater. Des. 2019, 178, 107857. [Google Scholar] [CrossRef]
  21. Nguyen, N.T.; Kim, J.H. Identification of sagging in melt-electrospinning of microfiber scaffold. Mater. Sci. Eng. C 2019, 103, 109785. [Google Scholar] [CrossRef] [PubMed]
  22. Collins, G.; Federici, J.; Imura, Y.; Catalani, L.H. Charge generation, charge transport, and residual charge in the electrospinning of polymers: A review of issues and complications. J. Appl. Phys. 2012, 111. [Google Scholar] [CrossRef]
  23. Lubasova, D.; Netravali, A.N. A Novel Method for Electrospinning Nanofibrous 3-D Structures. Fibers 2020, 8, 27. [Google Scholar] [CrossRef]
  24. Li, X.; Zheng, Y.; Mu, X.; Xin, B.; Lin, L. Investigation into Jet Motion and Fiber Properties Induced by Electric Fields in Melt Electrospinning. Ind. Eng. Chem. Res. 2020, 59, 2163–2170. [Google Scholar] [CrossRef]
  25. Hochleitner, G.; Youssef, A.; Hrynevich, A.; Haigh, J.N.; Jungst, T.; Groll, J.; Dalton, P.D. Fibre pulsing during melt electrospinning writing. BioNanoMaterials 2016, 17, 159–171. [Google Scholar] [CrossRef]
  26. Tourlomousis, F.; Ding, H.; Kalyon, D.M.; Chang, R.C. Melt Electrospinning Writing Process Guided by a “Printability Number”. J. Manuf. Sci. Eng. 2017, 139, 081004. [Google Scholar] [CrossRef] [Green Version]
Figure 1. Schematic representations of the melt electrohydrodynamic system and the cold plate: (a) composition of melt electrohydrodynamic system; (b) cold plate with its dimensions.
Processes 08 01440 g001
Figure 2. Evolution of the fiber deposit with deposition time. (ac) printed at 16, 23.5, 30 °C, respectively. Left to right: 1, 2, 3, 4, 5, 6 min. The yellow circle indicates the existence of lower cones around the central cone. The scale bars denote 2 mm.
Processes 08 01440 g002
Figure 3. Comparison of fiber accumulating shape at different collector temperatures (Deposition time: 6 min. From (ac), the photographs of samples at 16, 23.5 and 30 °C are shown. (d) The side view profiles at different collector temperatures are extracted and superimposed. The scale bars denote 1 mm).
Processes 08 01440 g003
Figure 4. Effect of deposition time and collector temperature on the formation of fiber accumulation geometry: (a) effects of deposition time on Hdep; (b) effects of deposition time on Ddep; (c) effects of deposition time on Hdep/Ddep; (d) effects of collector temperature on Hdep/Ddep. As the deposition time increases, both Hdep and Ddep increase in (a) and (b), while their ratios Hdep/Ddep are relatively constant in (c). As the collector temperature increases, Hdep/Ddep increases significantly.
Processes 08 01440 g004
Figure 5. Effect of voltage on the formation of fiber accumulation geometry: (a) effects of voltage on Hdep; (b) effects of voltage on Ddep; (c) effects of voltage on Hdep/Ddep. As the voltage increases, Hdep decreases slightly and Ddep increases slightly, except for 30 °C. The calculated ratio, Hdep/Ddep, decreases slightly.
Processes 08 01440 g005
Figure 6. Effect of collector temperature on the dynamic jet deposition process (printing time 5–5.25 min): (a) jet states −1, 1, and 0 at 30 °C; The scale bars denote 1 mm. (b) evolution of jet state at 23.5 °C; (c) evolution of jet state at 30 °C; (d) percentage of different jet states at 23.5 °C and 30 °C. State 1, −1 and 0 represents the jet deposition point is on the central cone, outer cone or transitioning from the central cone to the outer ring on the fiber deposits.
Processes 08 01440 g006
Figure 7. Imaginary schematic of initial fiber deposit shape based on probabilistic jet deposition behavior: (a) deposition area under the needle; (b) ideal Case 1 without fiber attraction and repulsion; (c) Case 2 at low collector temperature with strong repulsion but weak attraction; (d) Case 3 at medium collector temperature with comparable attraction and repulsion; (e) Case 4 at high collector temperature with strong attraction but weak repulsion; (f) Case 5 at super high collector temperature with super strong attraction and little repulsion).
Processes 08 01440 g007
Figure 8. Cyclic change of jet state and deposit polarization state in steady-state printing phase: (a) the jet is attracted back from the outer ring to central cone, wherein the central cone is sufficiently polarized; (b) the jet is deposited on the cone, wherein the central cone becomes gradually positively charged; (c) the jet is repelled away from the central cone to the outer ring, wherein the outer ring is sufficiently polarized; (d) the jet is deposited on the outer ring, wherein the outer ring becomes gradually positively charged.
Processes 08 01440 g008
Table 1. The parameters and their values or range in the melt electrohydrodynamic process.
ParametersValues
Polymer temperature (Tp)94.7 ± 1 °C (measured)
Applied Voltage (V)12 kV, unless otherwise stated
Volumetric flow rate (Qv)25 µL/h
Tip-to-collector distance (Dtc)20 mm
Inter-fiber distance (Sf)60–500 µm
Set temperature (Ts)160 °C
Publisher’s Note: MDPI stays neutral with regard to jurisdictional claims in published maps and institutional affiliations.

