Study on Production, Domestic and Ecological Benefits of Reservoir Water Supply Based on Emergy Analysis


Abstract
1. Introduction
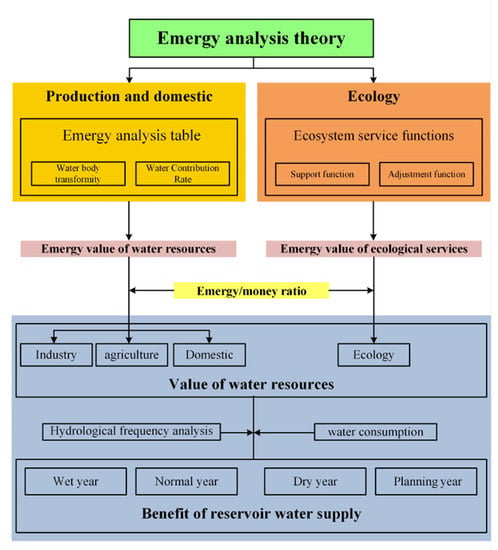
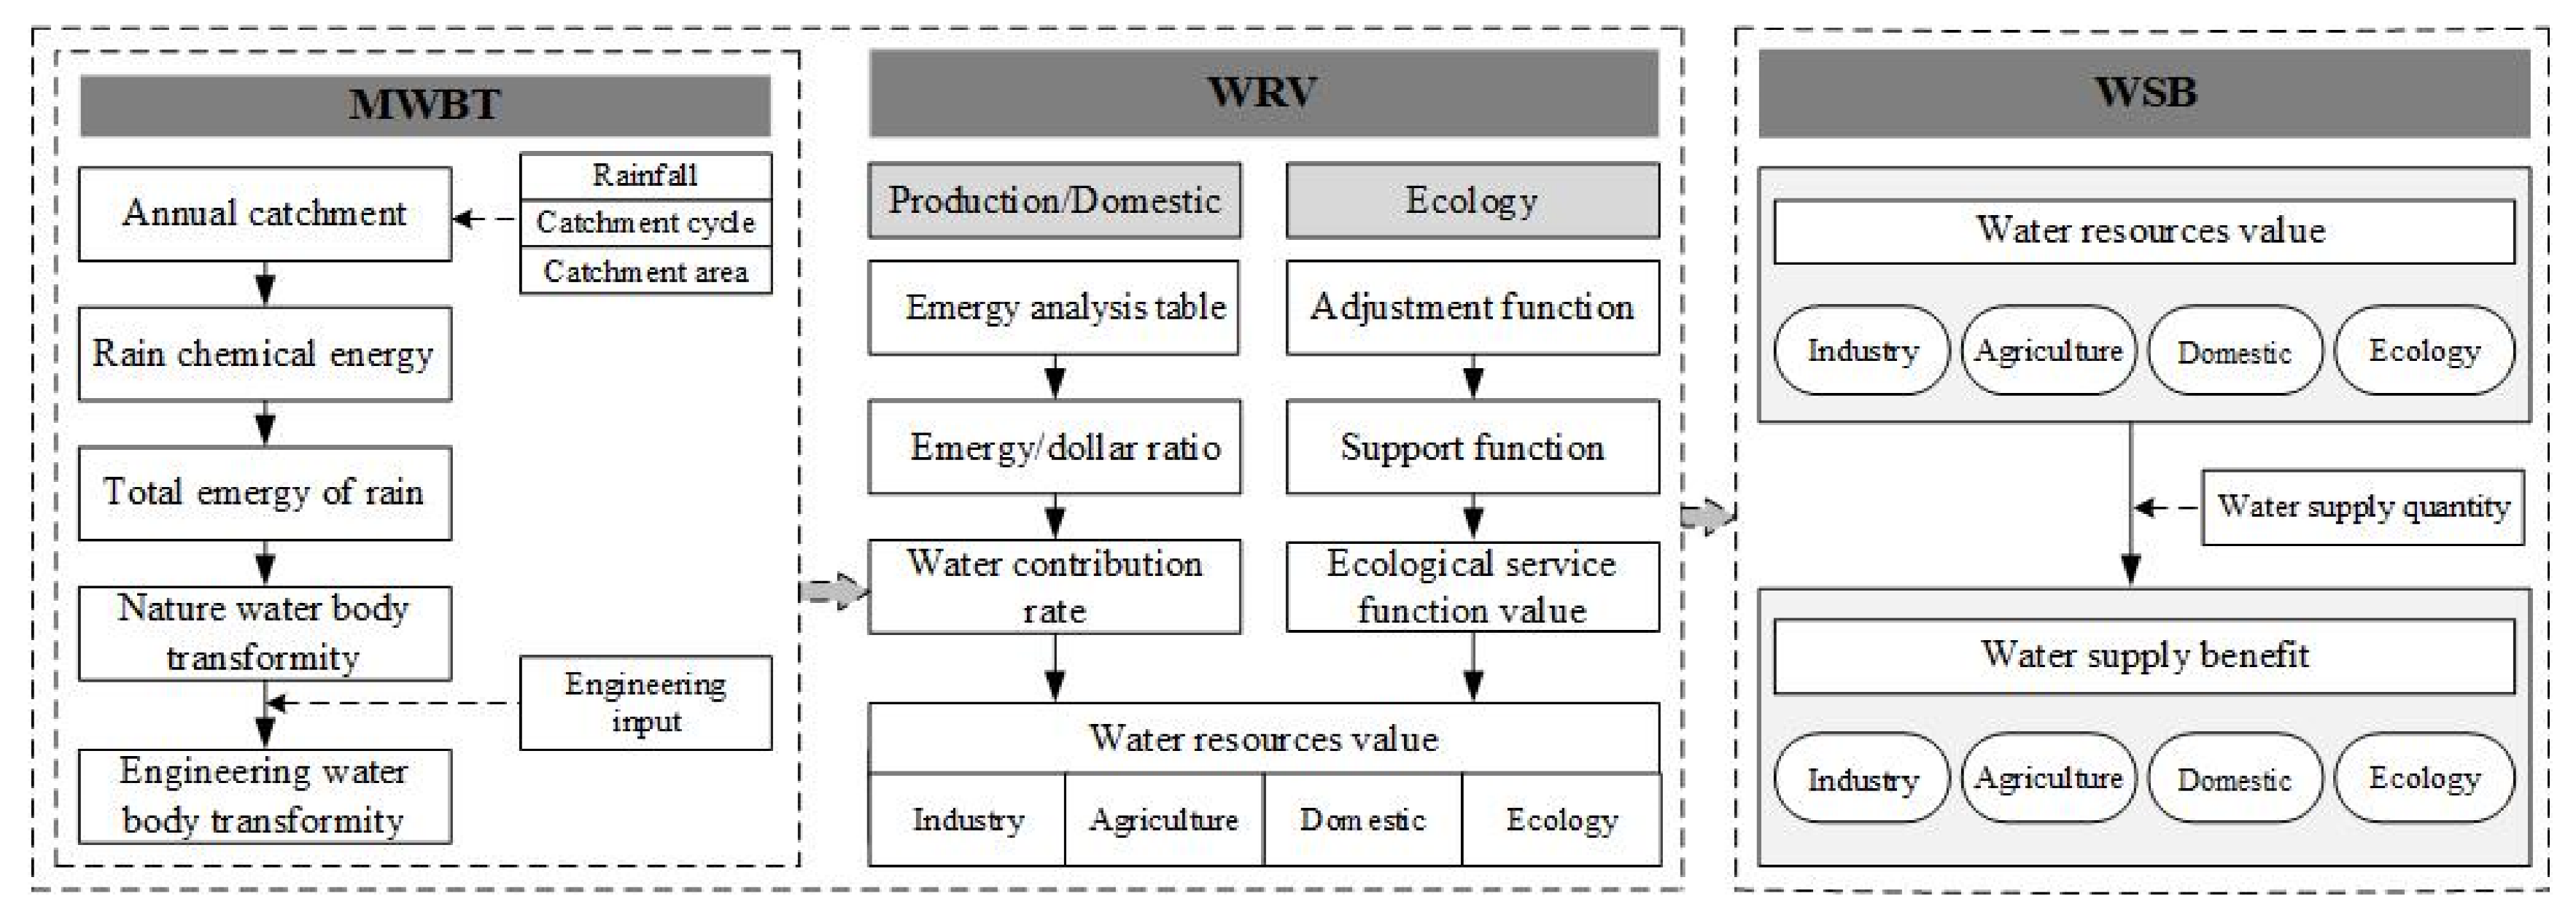
2. Methods
2.1. Multisource Water Body Transformity Module
- (1)
- Natural water transformity
- (2)
- Engineering water transformity
2.2. Water Value Accounting Module
2.2.1. Production and Domestic Water Resources Value
- (1)
- Emergy/Money Ratio (EDR)
- (2)
- Water contribution rate (WCR)
- (3)
- Water resources value (WRV)
2.2.2. Ecological Water Resources Value Accounting
- (1)
- Support service function
- a.
- Biology diversity Value. Biology is an important part of the ecosystem and biological gene bank is a huge treasure trove of information, which contains a variety of genetic materials. The calculation is as follows:In the above formula, is the biological diversity value, in units of sej; is the total number of biological species in the study area; is the proportion of biological activity area to global area, in %; is the transformity of global species, using 1.26 × 1025 sej/species [22].
- b.
- Net primary productivity value. Net primary productivity is the energy value that producers can use for growth development and reproduction. It is also the material basis for the survival and reproduction of other biological members in the ecosystem. The calculation is as follows:In the above formula, is the net primary productivity value, in units of sej; is the area of aquatic plants in the study area, in units of m2; is the biomass per unit area of aquatic plants in the waters, in units of g/m2; is the transformity of biomass, using 5.11 × 10⁶ sej/g [14].
- c.
- Value of carbon fixation and oxygen release. Photosynthesis is of great significance for achieving energy conversion in nature, maintaining carbon-oxygen balance in the atmosphere and maintaining residents’ activities. Water plays an irreplaceable role in photosynthesis. Without water, there will be no photosynthesis. The calculation is as follows:In the above formula, , is carbon fixation and oxygen release coefficient respectively; is the average productivity of vegetation, in units of g/hm2; is vegetation area, in units of hm2; , is the transformity of carbon dioxide and oxygen respectively, in units of sej/g.
- d.
- Value of nitrogen releasing from sediment. It is greatly significant to reduce water eutrophication. The nitrogen release value of sediment can be calculated as follows:In the above formula, is annual runoff, in units of m3; is the concentration of nitrogen released from the sediment, in units of mg/L; is the transformity of nitrogen, using 3.8 × 10⁸ sej/g [23].The calculation formula of ecological support service value is as follows:
- (2)
- Adjustment service function
- a.
- Self-purification value. Water has a certain self-purification capacity, and the amount of pollutants in water naturally degraded and reduced is the self-purification value of water body. The calculation is as follows:where, is the self-purification value of water body, in units of sej; , is the pollutant content of upstream and downstream section surface water, in units of g/m3; is the transformity of each pollutant, in units of sej/g; is the river flow, in units of m3.
- b.
- Value loss of water pollution (negative value). The biggest difference between sewage and purified water lies in the difference of emergy transformity, which is mainly because the work of domestic water production process changes the transformity the water body, making it sewage. Therefore, the value of loss water pollution can be obtained by superscalar of pollutant and corresponding emergy transformity. The calculation is as follows:where, is the value loss of water pollution, in units of sej; , is the measured pollutant concentration in the section and the water quality standard value in the functional area where the section is located, in units of g/m3.
- c.
- Climatic regulation value. When the water body evaporates, it takes a lot of heat away and changes the climate conditions, such as inducing rainfall and increasing humidity. Therefore, the energy of water evaporation is the energy of water regulating the climate, that is, the emergy of water evaporation is the benefit of regulating climate. The calculation is as follows:In the above formula, is the climatic regulation value, in units of sej; is the latent heat of evaporation, and its relationship with temperature t is L = 2507.4 − 2.39t, in units of j/g; is evaporative water, in units of g; is the emergy transformity of vapor, using 12.20 sej/J [24].
- d.
- Sediment transportation value. Sediment transportation is an important hydrological phenomenon in rivers, which has a significant impact on river changes. The sediment transport of river provides conditions for further flood discharge and drainage and greatly improving the flood carrying capacity of the river. The value of sediment transportation is calculated as follows:In the above formula, is the sediment transportation value, in units of sej; R is the annual runoff of the river, in units of m3; S is the sediment-carrying capacity of flow, in units of g/m3; is the transformity of sediment, in units of sej/g.Ecological regulation service value is calculated, as follows:Ecological water resources value is calculated, as follows:In the above formula, is the ecological support service value, in units of sej; is the ecological regulation service value, in units of sej; W is the regional surface quantity, in units of m3.
2.3. Water Supply Efficiency Quantitative Model
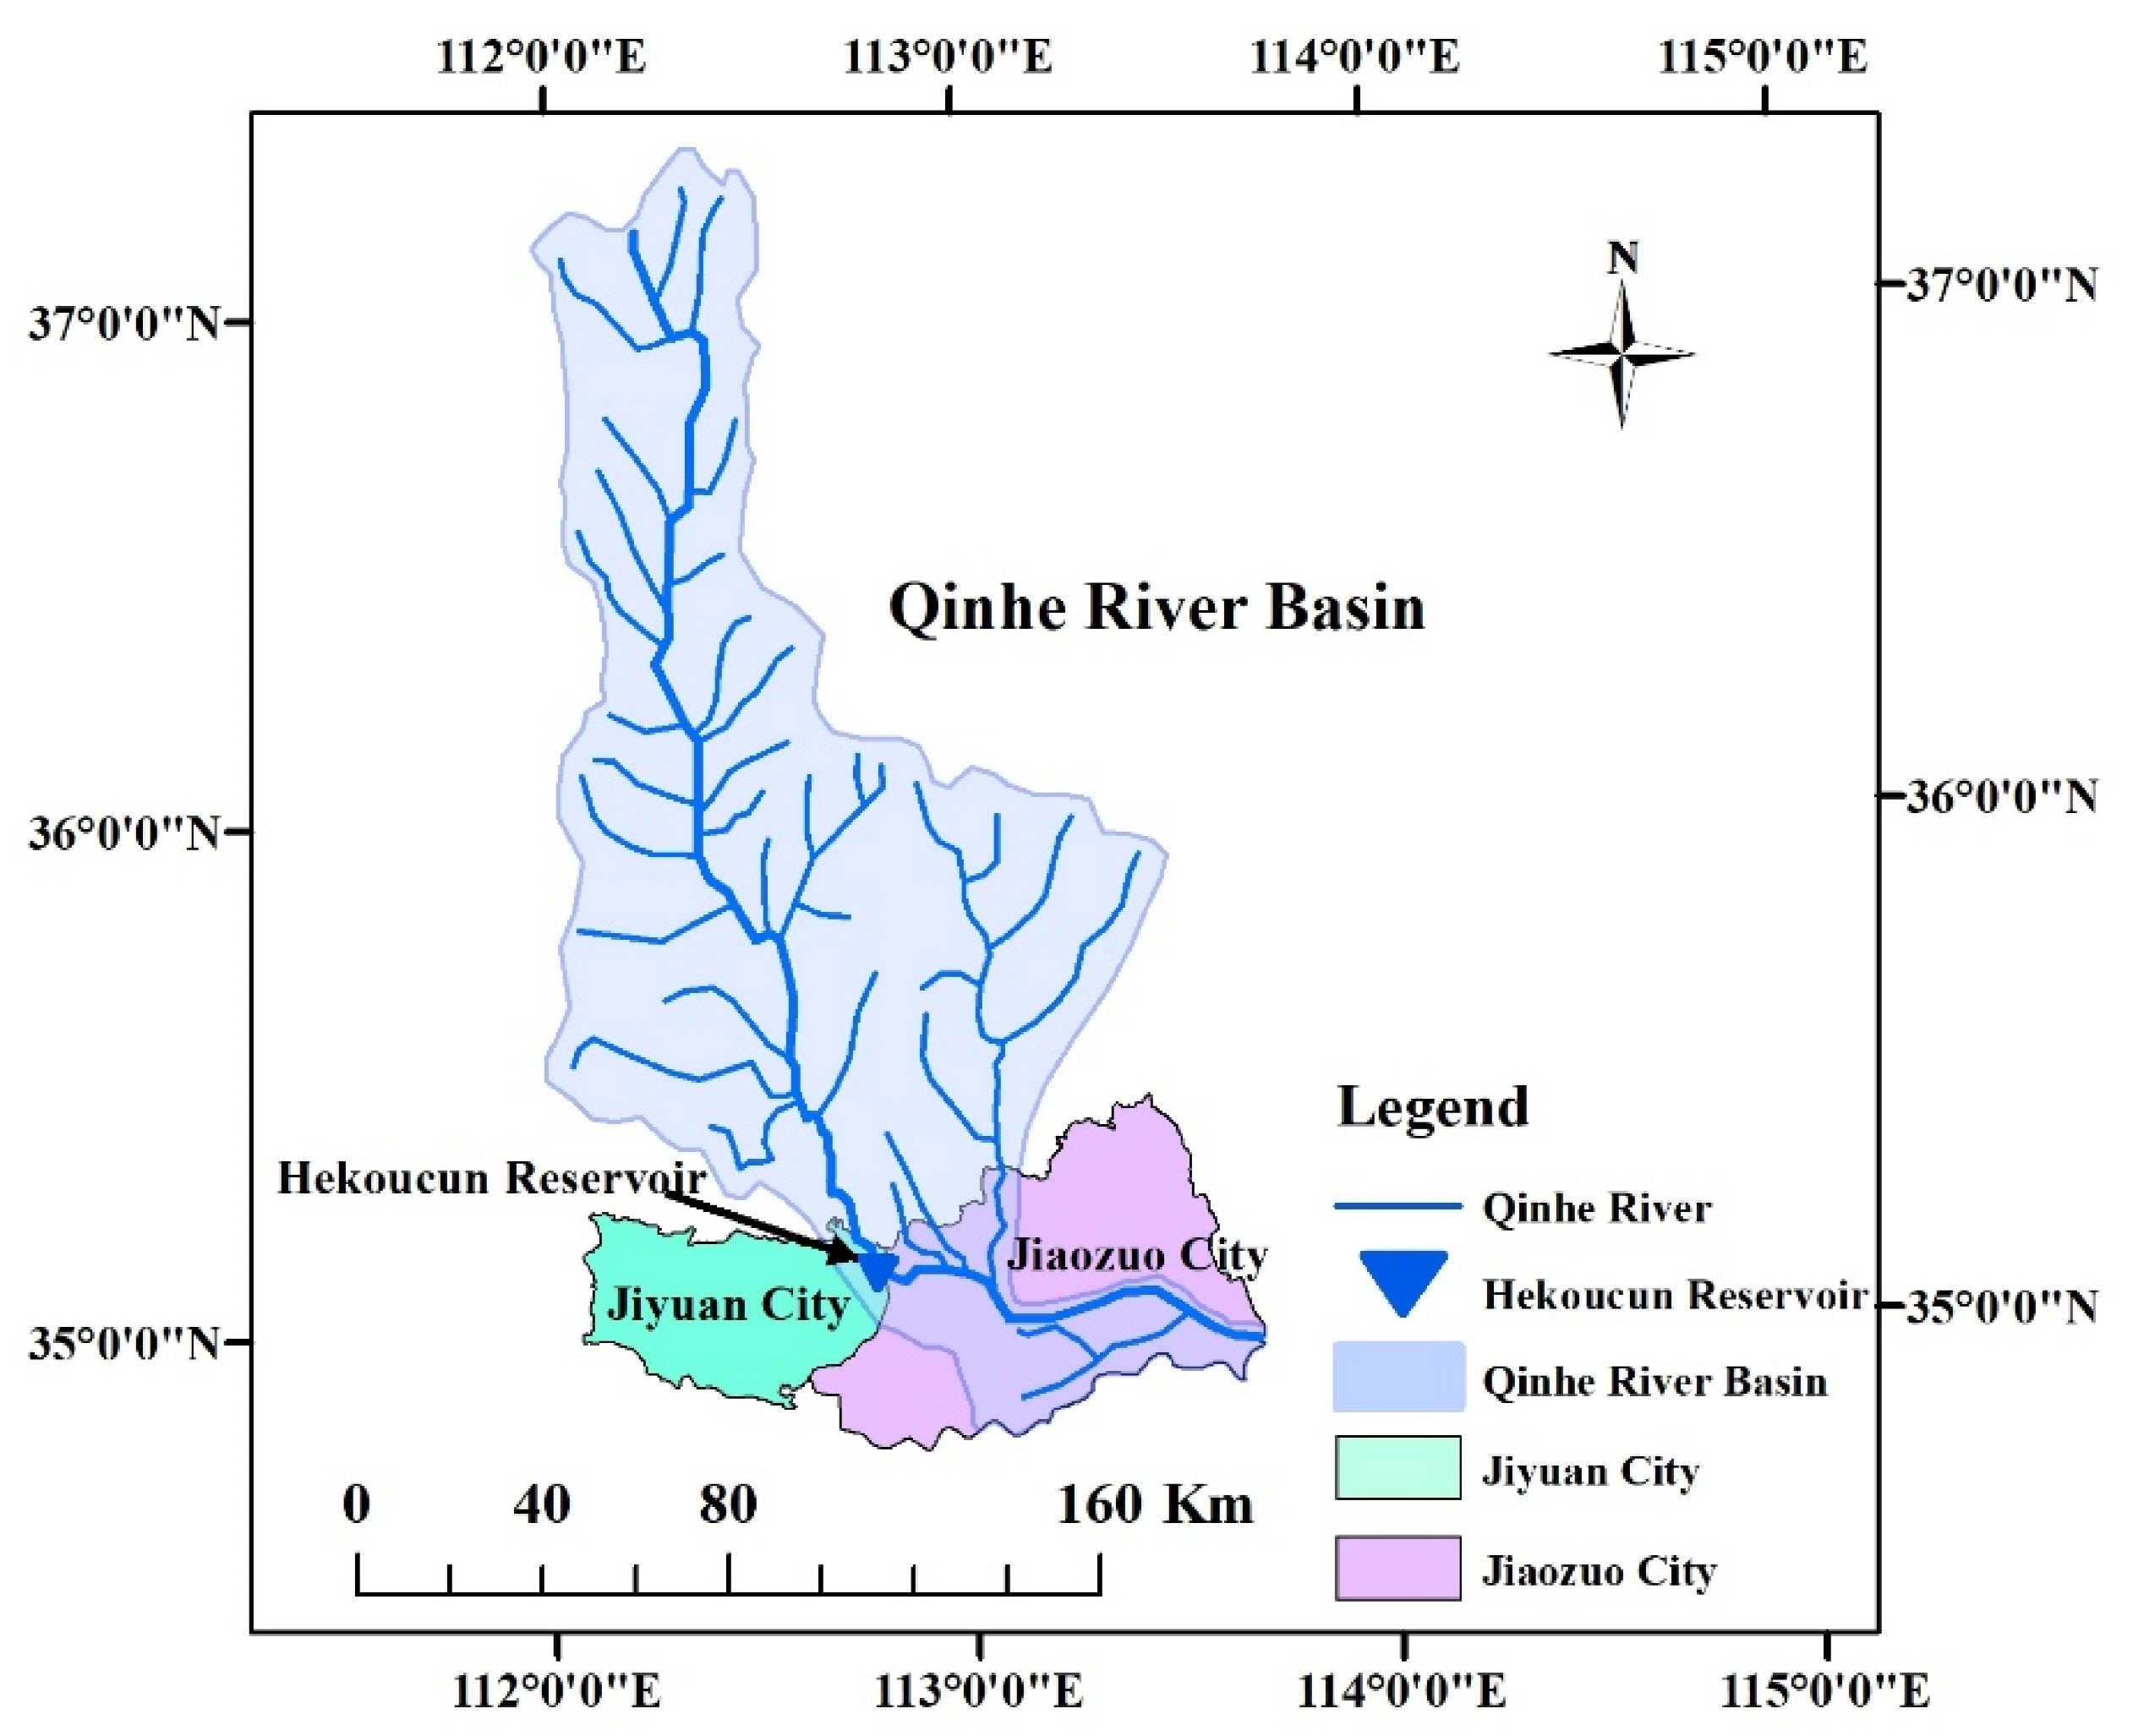
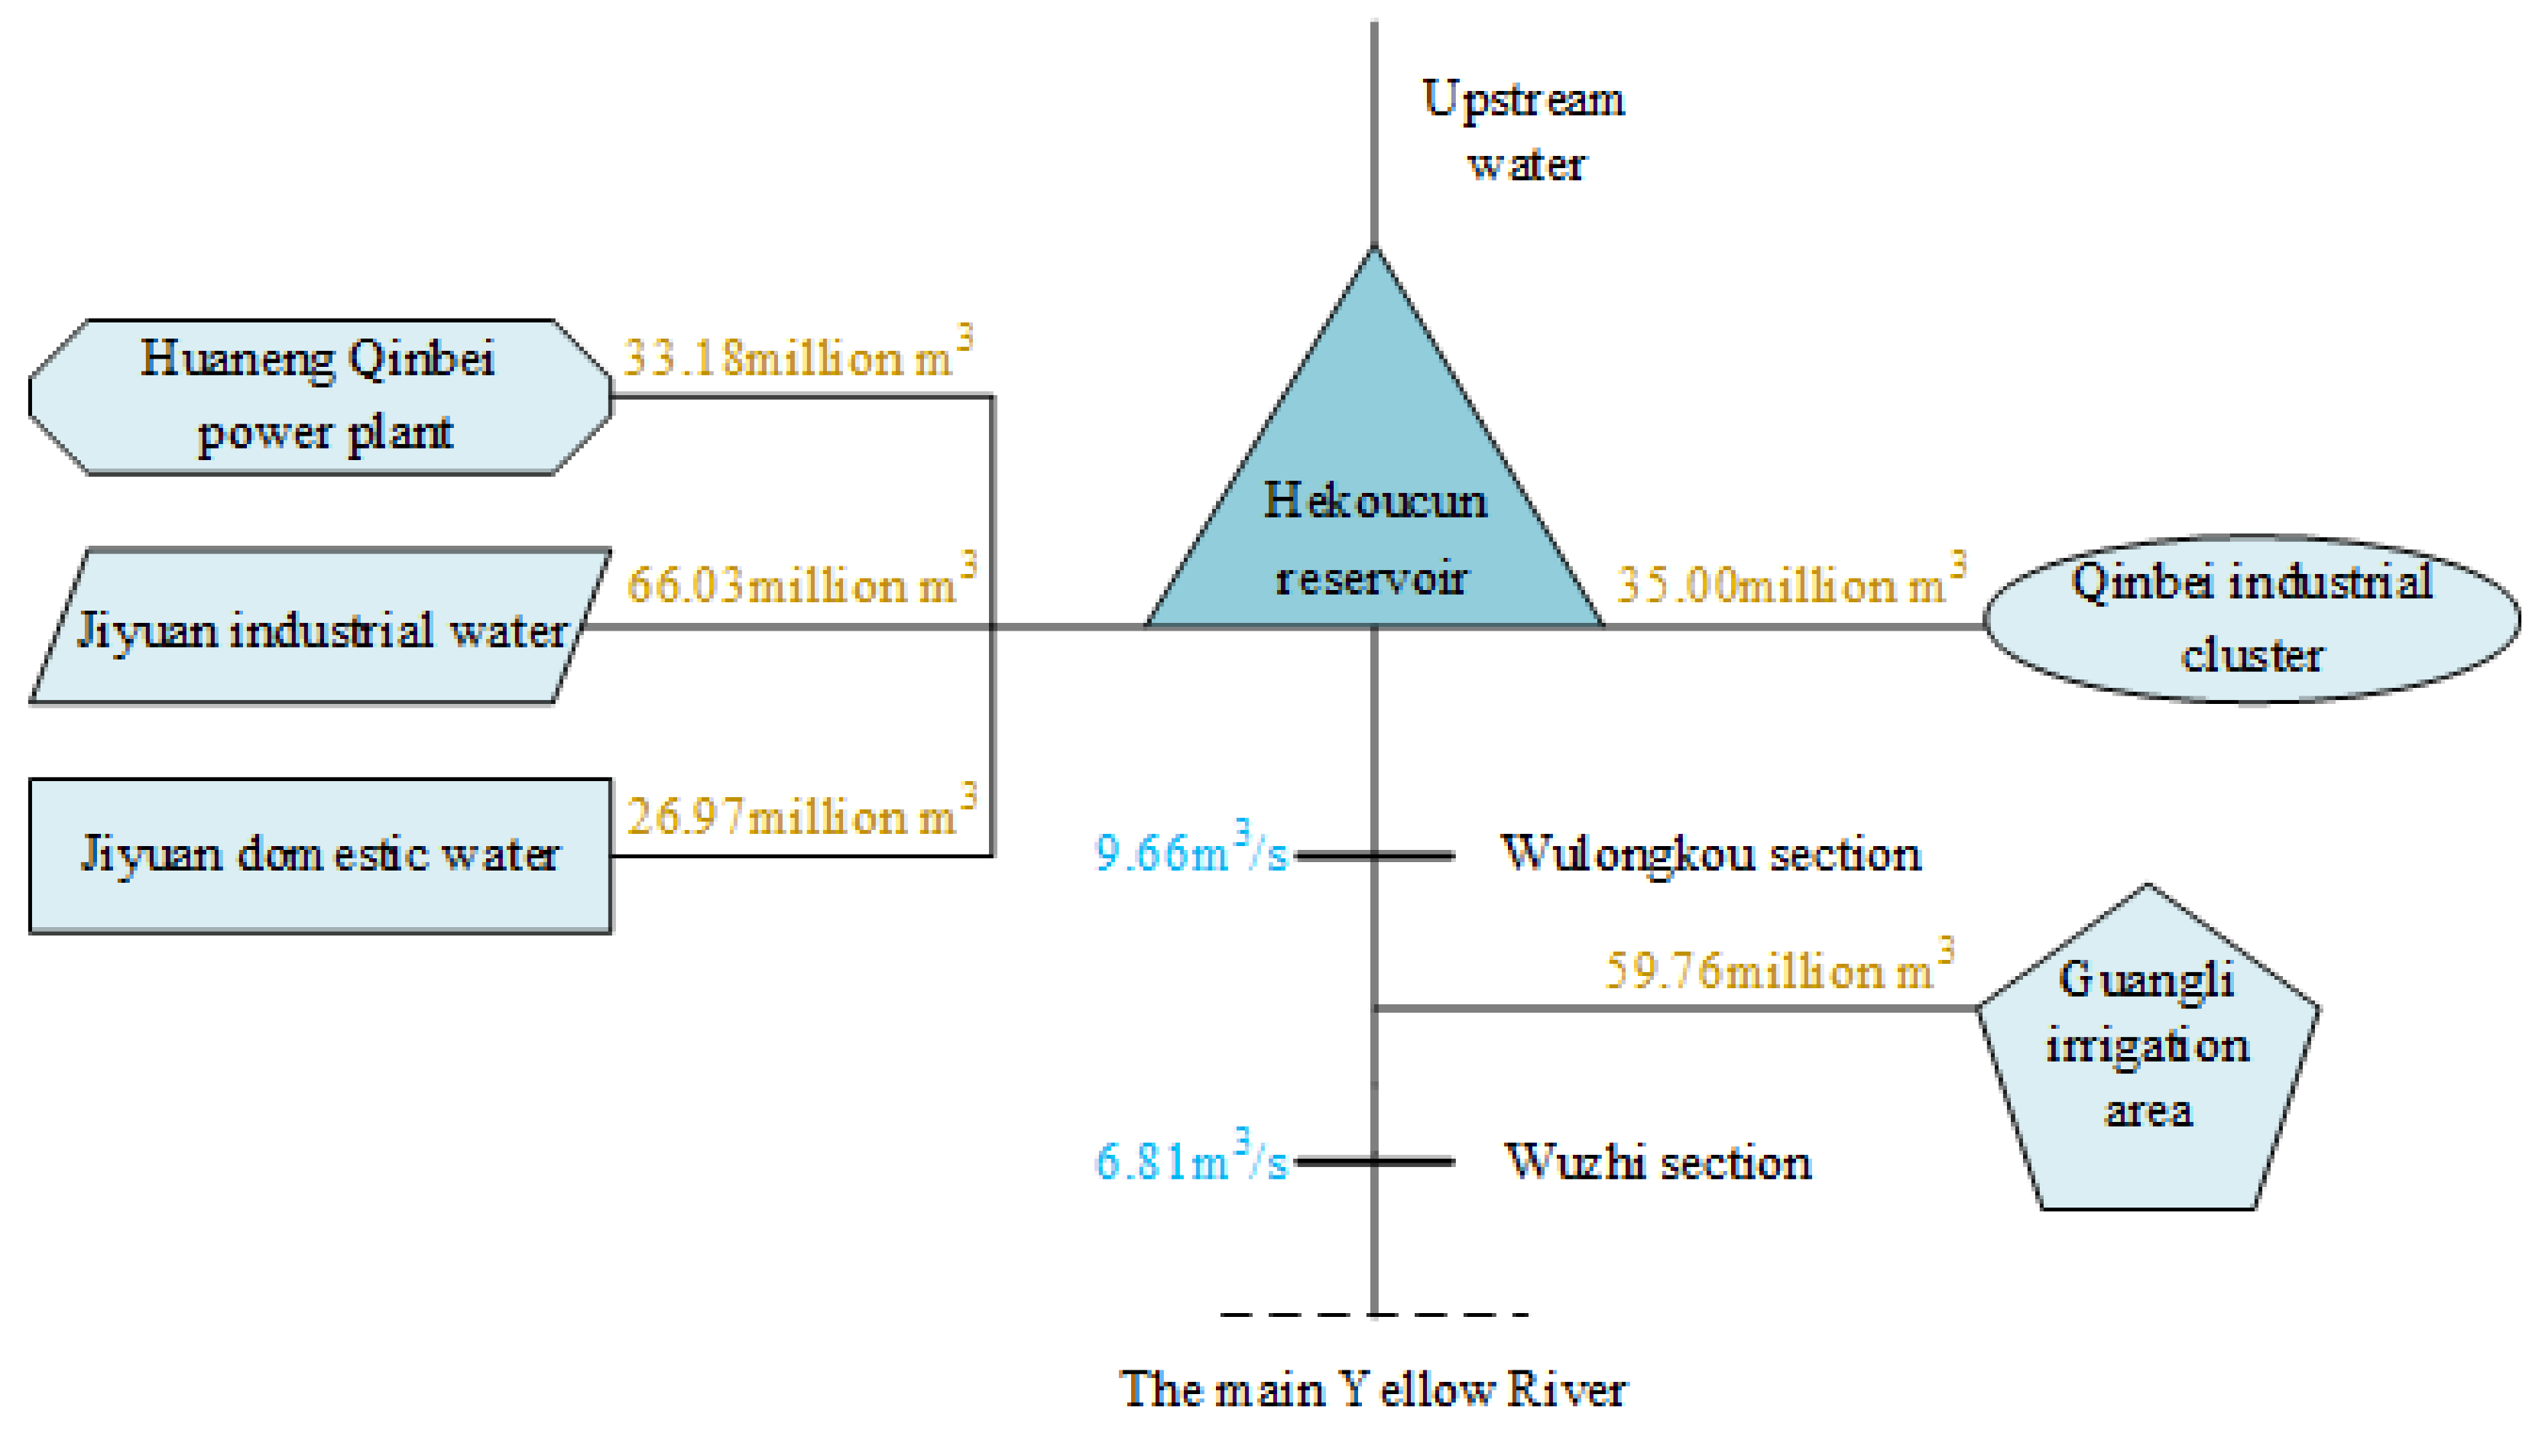
3. Study Area and Data
4. Result
4.1. Natural and Engineering Water Body Transformity
4.2. Production, Domestic and Ecological Water Resources Value
- (1)
- Production and domestic
- (2)
- Ecology
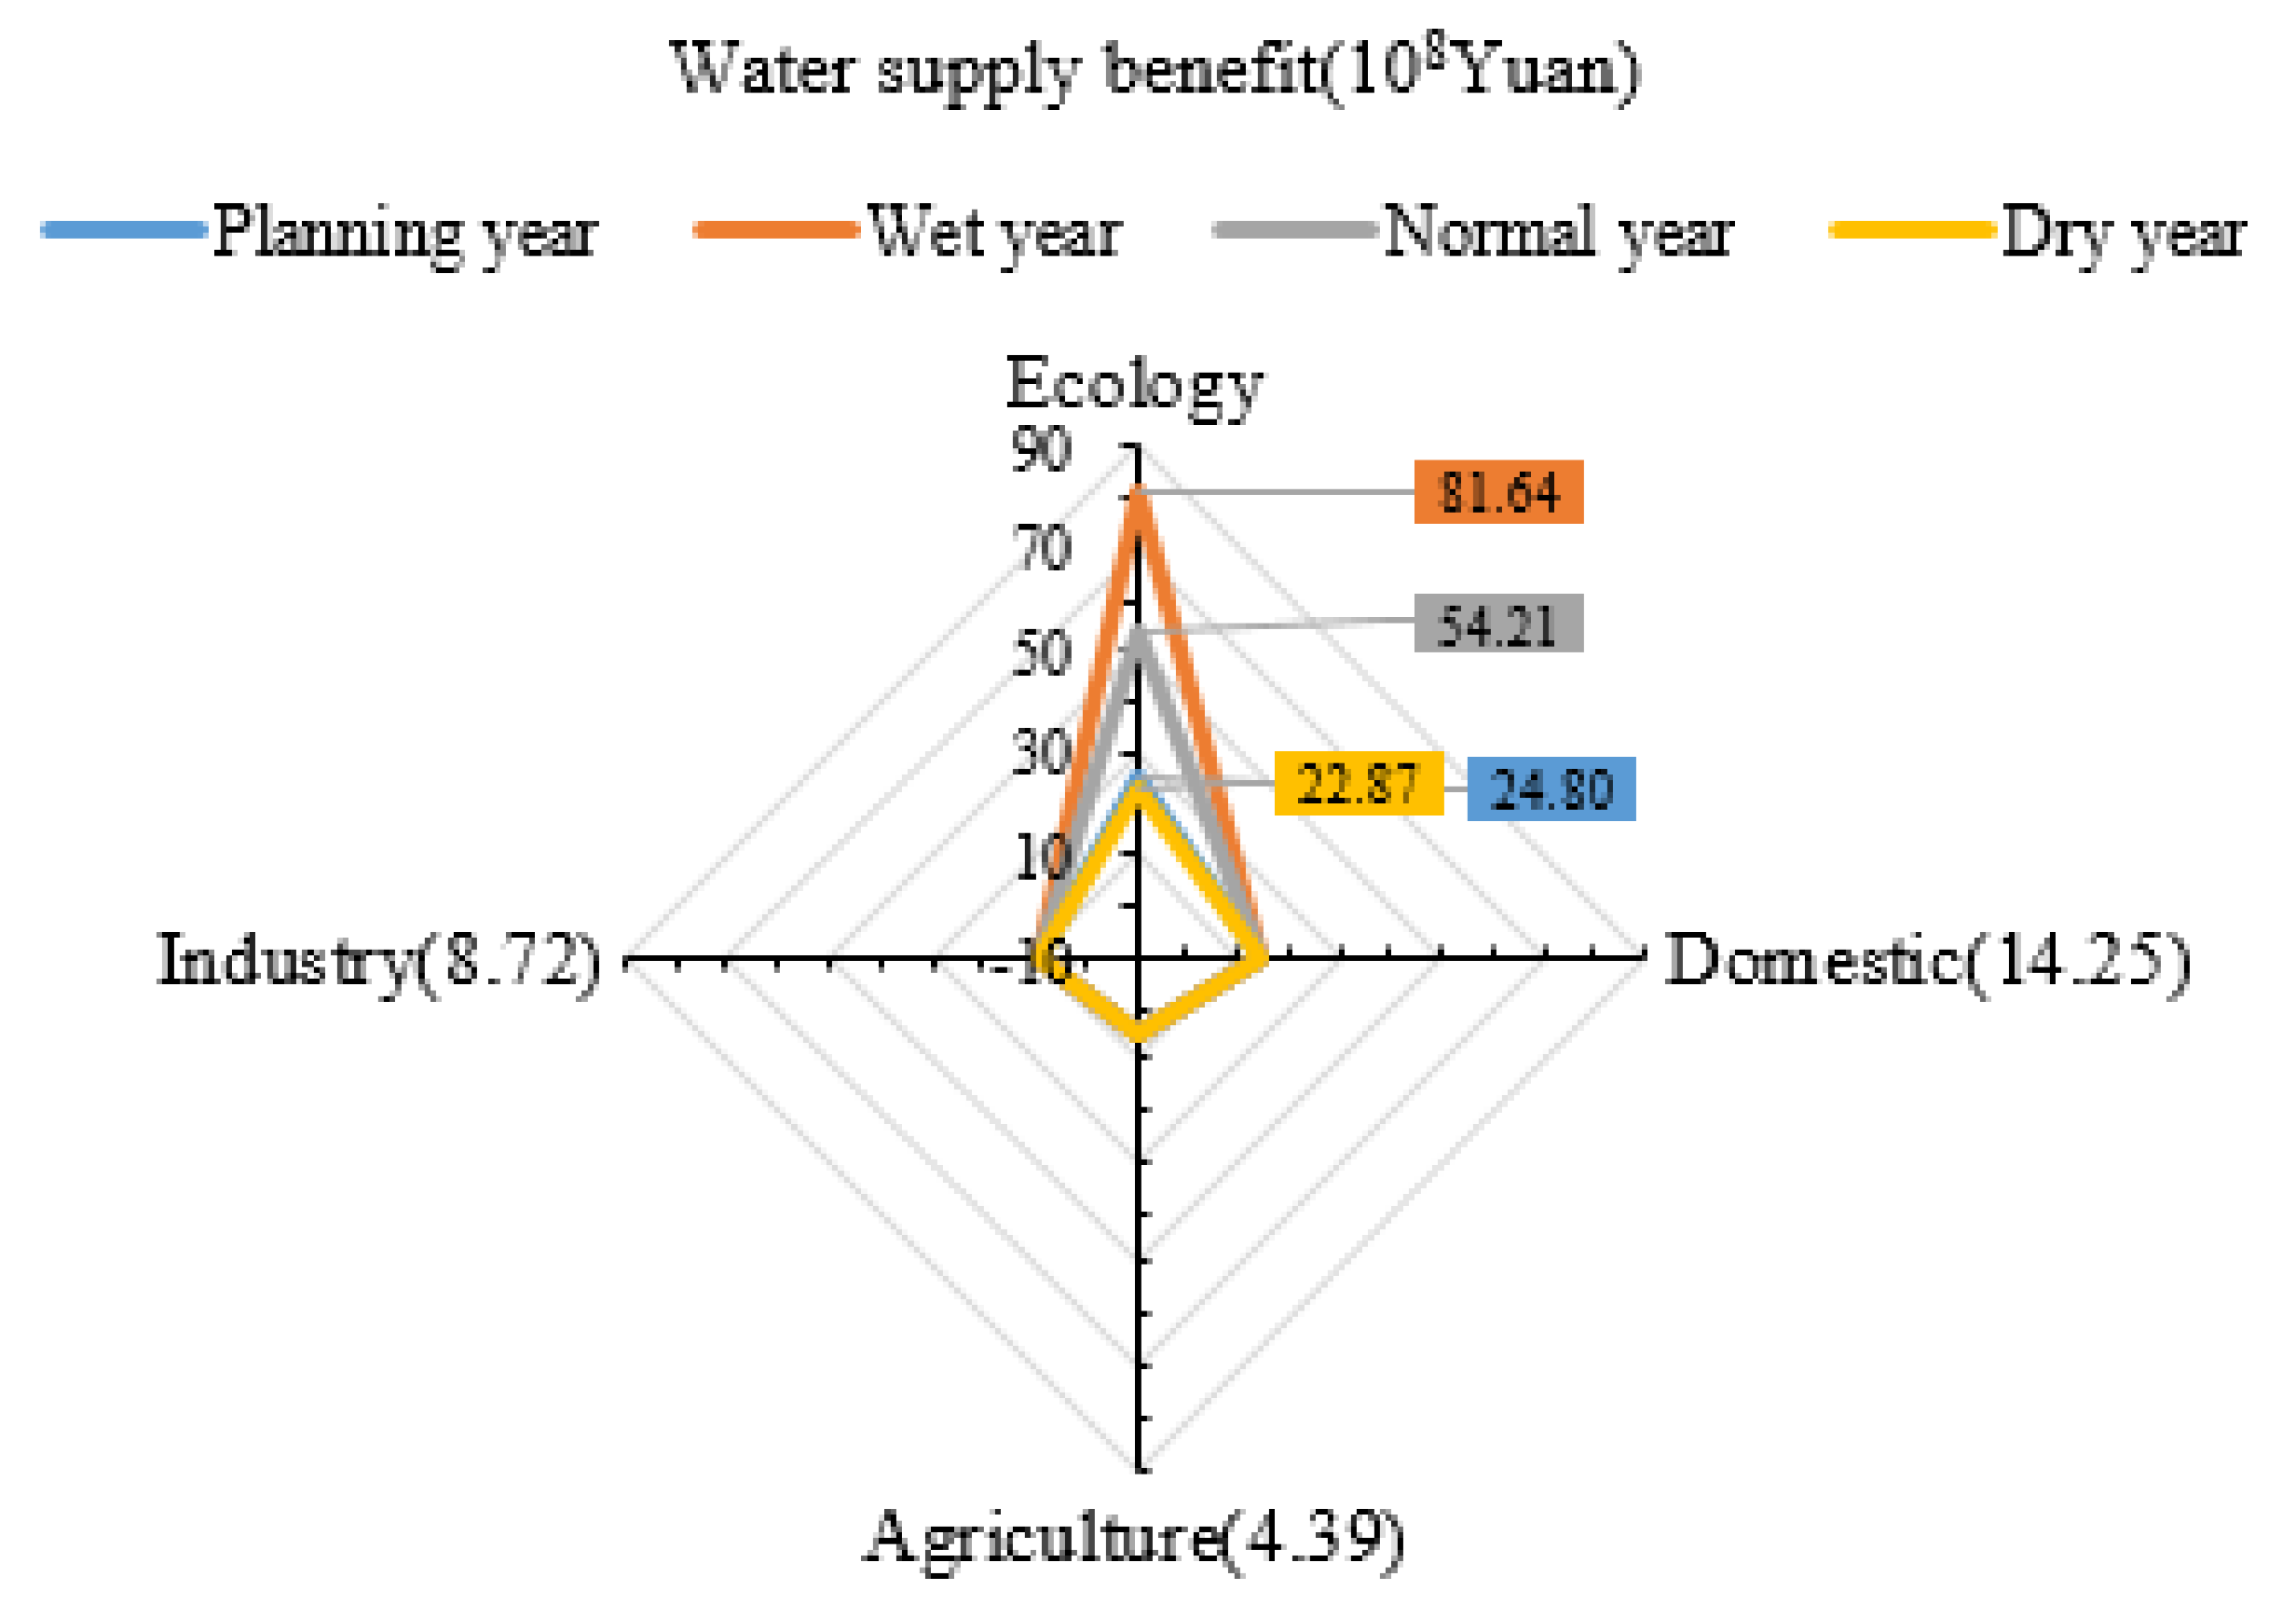
4.3. Benefits of Water Supply in Hekoucun Reservoir
5. Discussion
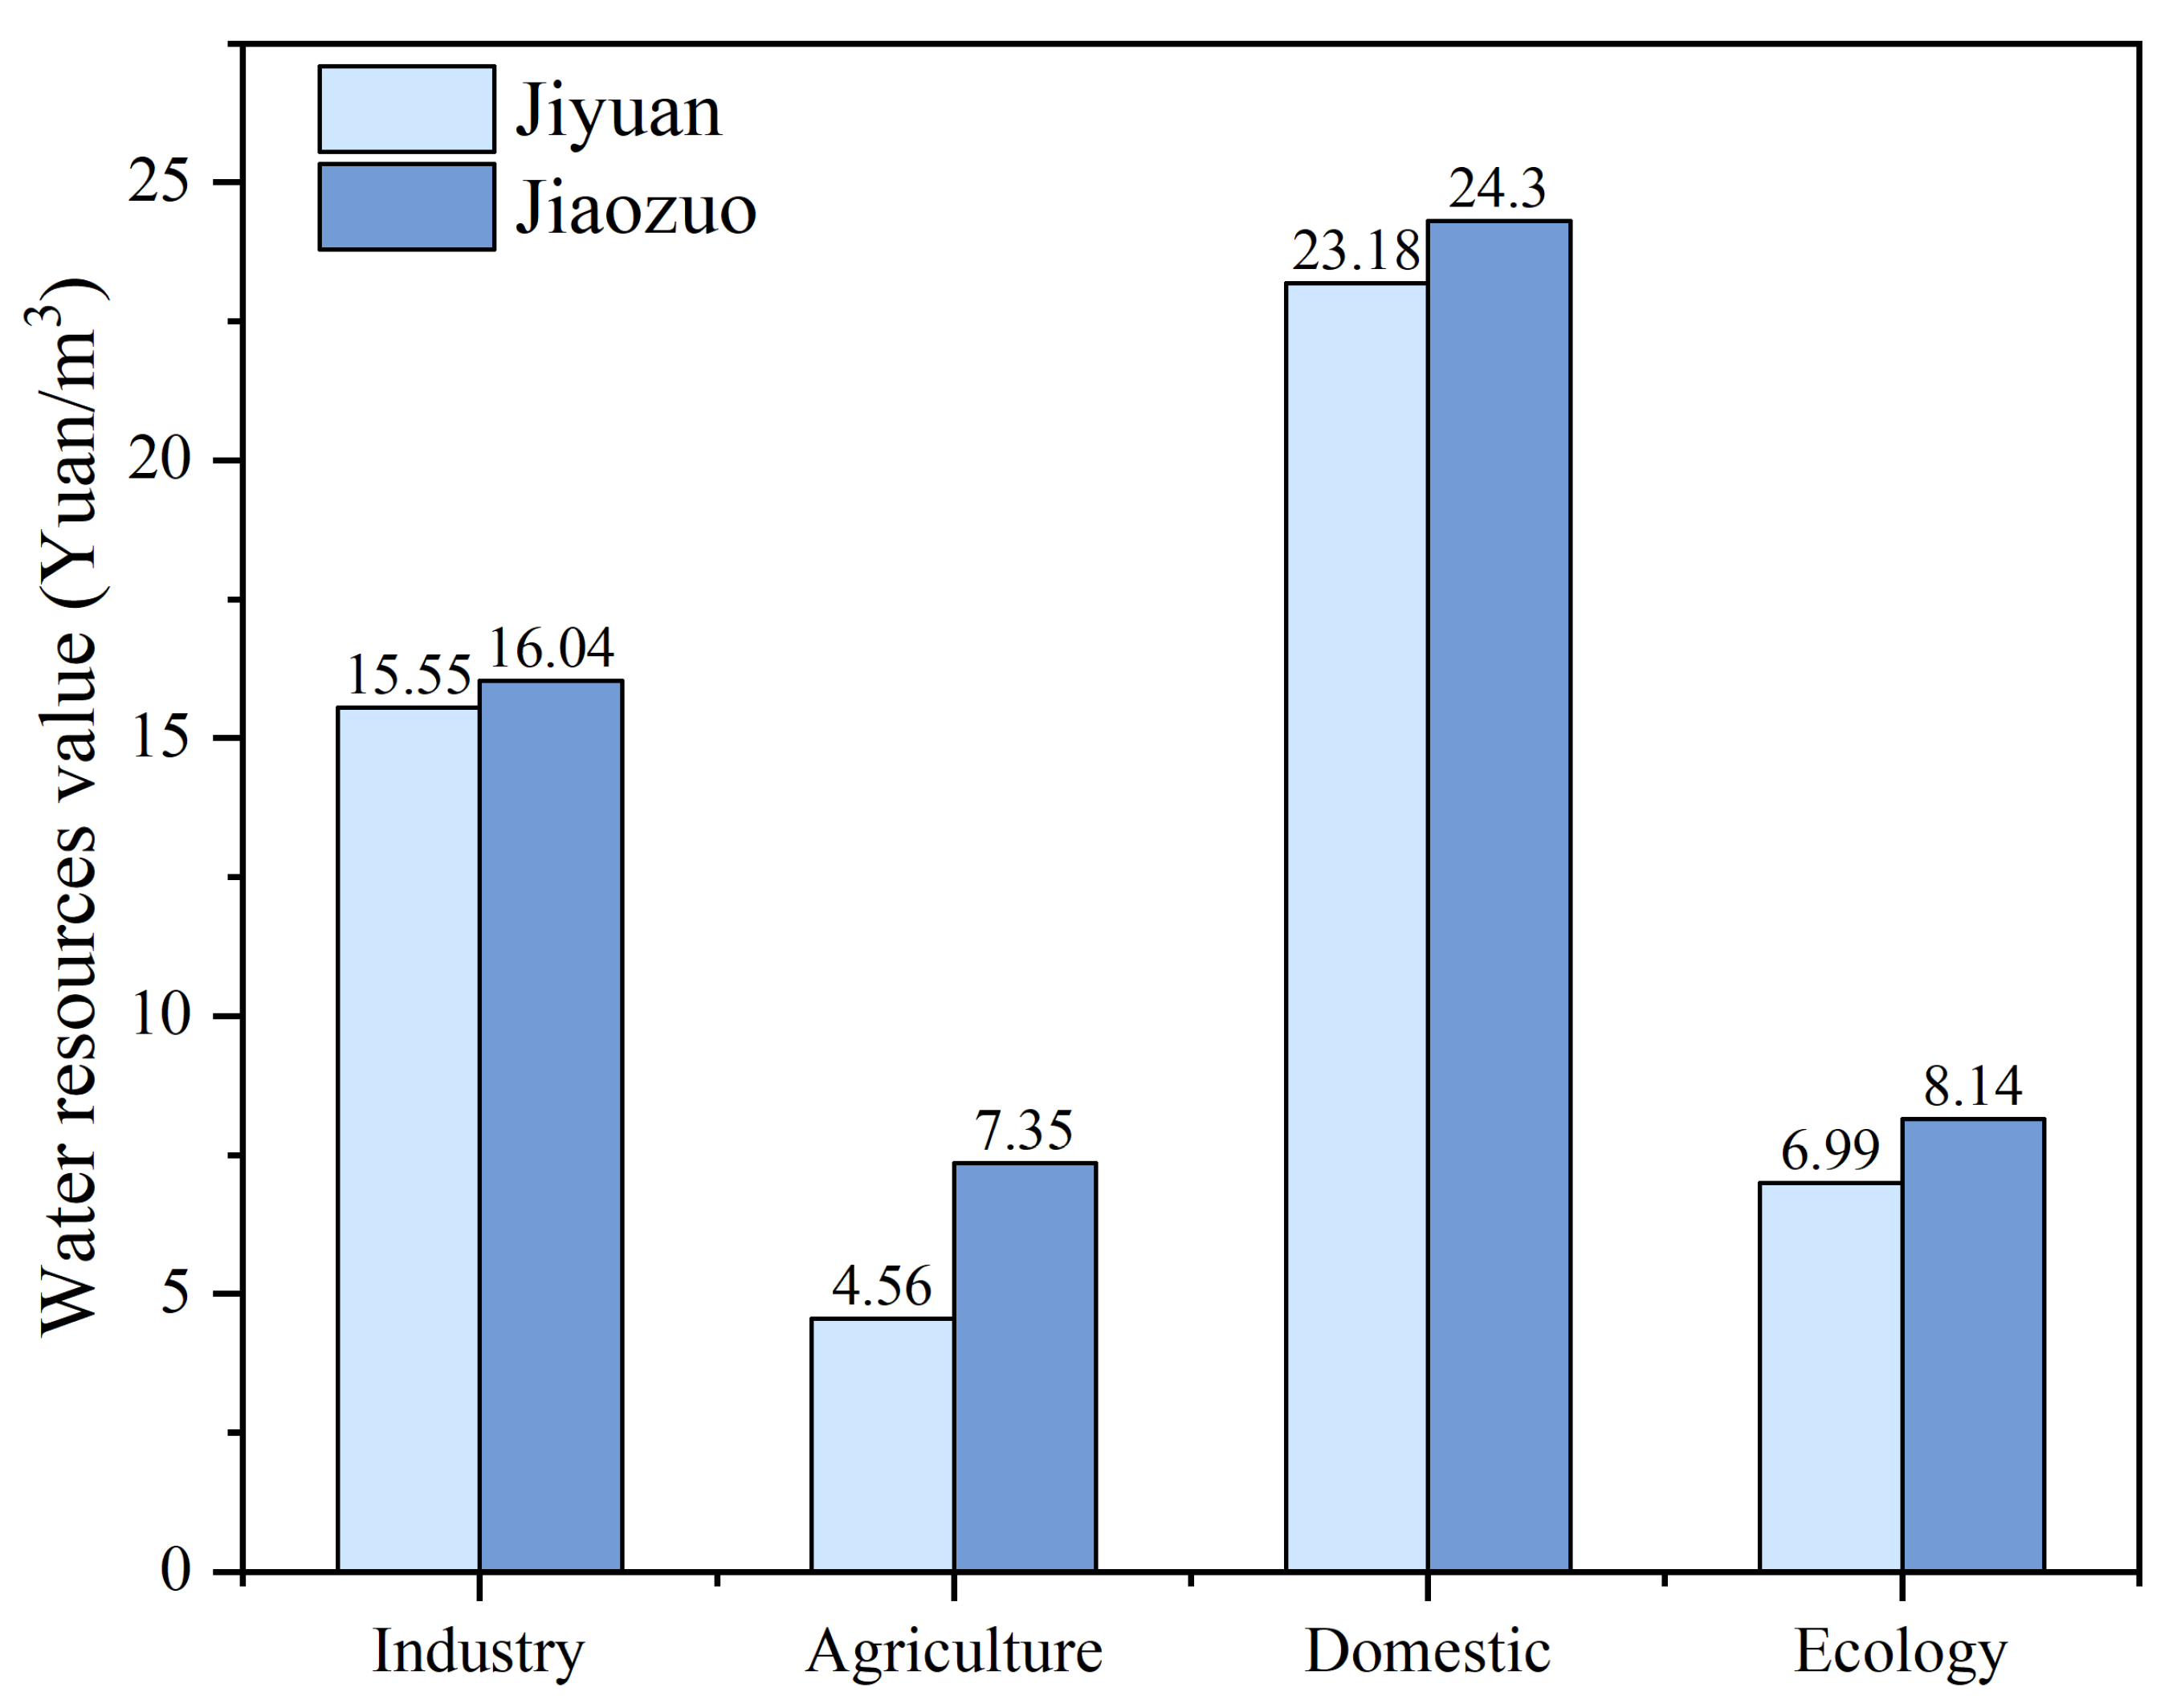
5.1. Differences in Water Resources among Industries
5.2. Reservoir Water Supply Benefit Analysis
6. Conclusions
Author Contributions
Funding
Acknowledgments
Conflicts of Interest
References
- Sivakumar, B. Water crisis: From conflict to cooperation—An overview. Hydrol. Sci. J. 2011, 56, 531–552. [Google Scholar] [CrossRef]
- Brunner, M.I.; Gurung, A.B.; Zappa, M.; Zekollari, H.; Farinotti, D.; Stähli, M. Present and future water scarcity in Switzerland: Potential for alleviation through reservoirs and lakes. Sci. Total. Environ. 2019, 666, 1033–1047. [Google Scholar] [CrossRef] [PubMed]
- Eliasson, J. The rising pressure of global water shortages. Nat. Cell Biol. 2014, 517, 6. [Google Scholar] [CrossRef] [PubMed]
- Harmancioglu, N.B. Overview of Water Policy Developments: Pre- and Post-2015 Development Agenda. Water Resour. Manag. 2017, 31, 3001–3021. [Google Scholar] [CrossRef]
- Navarro-Ortega, A.; Acuña, V.; Bellin, A.; Burek, P.; Cassiani, G.; Choukr-Allah, R.; Dolédec, S.; Elosegi, A.; Ferrari, F.; Ginebreda, A.; et al. Managing the effects of multiple stressors on aquatic ecosystems under water scarcity. The GLOBAQUA project. Sci. Total. Environ. 2015, 503, 3–9. [Google Scholar] [CrossRef]
- Guan, X.; Liu, W.; Chen, M. Study on the ecological compensation standard for river basin water environment based on total pollutants control. Ecol. Indic. 2016, 69, 446–452. [Google Scholar] [CrossRef]
- Hu, Z.; Chen, Y.; Yao, L.; Wei, C.; Li, C. Optimal allocation of regional water resources: From a perspective of equity–efficiency tradeoff. Resour. Conserv. Recycl. 2016, 109, 102–113. [Google Scholar] [CrossRef]
- Meng, B.; Liu, J.; Bao, K.; Sun, B. Water fluxes of Nenjiang River Basin with ecological network analysis: Conflict and coordination between agricultural development and wetland restoration. J. Clean. Prod. 2019, 213, 933–943. [Google Scholar] [CrossRef]
- Pulidovelazquez, M.; Alvarez-Mendiola, E.; Andreu, J. Design of Efficient Water Pricing Policies Integrating Basinwide Resource Opportunity Costs. J. Water Resour. Plan. Manag. 2013, 139, 583–592. [Google Scholar] [CrossRef]
- Wang, W.; Xie, H.; Zhang, N.; Xiang, N. Sustainable water use and water shadow price in China’s urban industry. Resour. Conserv. Recycl. 2018, 128, 489–498. [Google Scholar] [CrossRef]
- Odum, H.T. Environmental Accounting: Emergy and Environmental Decision Making; Wiley New York: New York, NY, USA, 1996. [Google Scholar]
- Amaral, L.P.; Martins, N.; Gouveia, J.B. A review of emergy theory, its application and latest developments. Renew. Sustain. Energy Rev. 2016, 54, 882–888. [Google Scholar] [CrossRef]
- Di, D.; Wu, Z.; Guo, X.; Lv, C.; Huiliang, W. Value Stream Analysis and Emergy Evaluation of the Water Resource Eco-Economic System in the Yellow River Basin. Water 2019, 11, 710. [Google Scholar] [CrossRef]
- Sannigrahi, S.; Chakraborti, S.; Joshi, P.K.; Keesstra, S.; Sen, S.; Paul, S.K.; Kreuter, U.; Sutton, P.C.; Jha, S.; Dang, K.B. Ecosystem service value assessment of a natural reserve region for strengthening protection and conservation. J. Environ. Manag. 2019, 244, 208–227. [Google Scholar] [CrossRef] [PubMed]
- Boerema, A.; Rebelo, A.J.; Bodi, M.B.; Esler, K.J.; Meire, P. Are ecosystem services adequately quantified? J. Appl. Ecol. 2017, 54, 358–370. [Google Scholar] [CrossRef]
- Costanza, R.; De Groot, R.; Braat, L.; Kubiszewski, I.; Fioramonti, L.; Sutton, P.; Farber, S.; Grasso, M. Twenty years of ecosystem services: How far have we come and how far do we still need to go? Ecosyst. Serv. 2017, 28, 1–16. [Google Scholar] [CrossRef]
- Xie, J.; Wu, B.; Annandale, G.W. Rapid Reservoir Storage–Based Benefit Calculations. J. Water Resour. Plan. Manag. 2013, 139, 712–722. [Google Scholar] [CrossRef]
- Chen, D.; Chen, J.; Luo, Z.; Lv, Z. Emergy Evaluation of the Natural Value of Water Resources in Chinese Rivers. Environ. Manag. 2009, 44, 288–297. [Google Scholar] [CrossRef]
- Lv, H.; Guan, X.; Meng, Y. Study on economic value of urban land resources based on emergy and econometric theories. Environ. Dev. Sustain. 2020, 1–24. [Google Scholar] [CrossRef]
- Guan, X.; Hou, S.; Meng, Y.; Liu, W. Study on the quantification of ecological compensation in a river basin considering different industries based on water pollution loss value. Environ. Sci. Pollut. Res. 2019, 26, 30954–30966. [Google Scholar] [CrossRef]
- Costanza, R.; Darge, R.C.; De Groot, R.; Farber, S.; Grasso, M.; Hannon, B.; Limburg, K.E.; Naeem, S.; Oneill, R.V.; Paruelo, J.M. The value of the world’s ecosystem services and natural capital. Nature 1997, 387, 253–260. [Google Scholar] [CrossRef]
- Jonsson, M.; Malmqvist, B. Mechanisms behind positive diversity effects on ecosystem functioning: Testing the facilitation and interference hypotheses. Oecologia 2003, 134, 554–559. [Google Scholar] [CrossRef] [PubMed]
- Wu, Z.; Di, D.; Lv, C.; Guo, X.; Wang, H. Defining and evaluating the social value of regional water resources in terms of emergy. Hydrol. Res. 2019, 21, 73–90. [Google Scholar] [CrossRef]
- Wu, Z.; Di, D.; Wang, H.; Wu, M.; He, C. Analysis and emergy assessment of the eco-environmental benefits of rivers. Ecol. Indic. 2019, 106, 105472. [Google Scholar] [CrossRef]


| Hekoucun Reservoir Water Supply Households | ||||
|---|---|---|---|---|
| Items | Agricultural | Industrial | Domestic | Ecological Flow |
| Jiyuan | 0 | 6603 | 2697 | 9.66 |
| Jiaozuo | 5976 | 2485 | 1015 | 6.81 |
| Items | Area (km2) | Rainfall (mm) | Surface Water Resources (108 m3) | Ground Water Resources (108 m3) | Total Water Resources (108 m3) |
|---|---|---|---|---|---|
| Jiyuan | 1898.71 | 664.8 | 1.60 | 1.43 | 3.03 |
| Jiaozuo | 4070.10 | 580.0 | 2.91 | 5.27 | 8.18 |
| Items | Jiyuan | Jiaozuo | ||
|---|---|---|---|---|
| Surface | Underground | Surface | Underground | |
| Natural water body | 7.04 | 14.24 | 7.27 | 13.70 |
| Engineering water body | 13.25 | 16.54 | 12.08 | 15.48 |
| Items | Raw Data | Unit | Transformity (sej/unit) | Emergy (1020) | |
|---|---|---|---|---|---|
| 1 | Total inputs | 1 × 10²² | |||
| 1.1 | Renewable environmental resources | 1.40 × 10²⁰ | |||
| 1.1.1 | Solar | 1.07 × 10¹⁹ | J | 1 * | 1.07 × 10¹⁹ |
| 1.1.2 | Wind | 1.60 × 10¹⁶ | J | 6.33 × 10² * | 9.99 × 10¹⁸ |
| 1.1.3 | Industrial water | 6.11 × 10⁷ | m3 | 1.19 × 10²⁰ | |
| 1.1.3.1 | Engineering water from surface water | 2.50 × 10⁷ | m3 | 1.33 × 10¹² | 6.73 × 10¹⁹ |
| 1.1.3.2 | Engineering water from groundwater | 3.61 × 10⁷ | m3 | 1.65 × 10¹² | 5.22 × 10¹⁹ |
| 1.2 | Nonrenewable environmental resources | 9.9 × 10²¹ | |||
| 1.2.1 | Raw coal and coal products, other fuels | 9.68 × 10¹⁶ | J | 4.00 × 10⁴ * | 3.87 × 10²¹ |
| 1.2.2 | Natural gas | 1.04 × 10¹⁵ | J | 4.80 × 10⁴ * | 4.99 × 10¹⁹ |
| 1.2.3 | Gasoline and other fuel oil | 1.61 × 10¹⁴ | J | 6.60 × 10⁵ * | 1.06 × 10²⁰ |
| 1.2.4 | Electric power | 2.58 × 10¹⁶ | J | 1.60 × 10⁵ * | 4.12 × 10²¹ |
| 1.2.5 | Raw materials, labor, Depreciation of fixed assets | 4.01 × 10⁹ | Yuan | 4.35 × 10¹¹ | 1.74 × 10²¹ |
| 2 | Total outputs | 4.66 × 10²² | |||
| 2.1 | Raw coal production | 5.08 × 10¹⁶ | J | 4.00 × 10⁴ * | 2.03 × 10²¹ |
| 2.2 | generated energy | 8.61 × 10¹⁶ | J | 1.60 × 10⁵ * | 1.38 × 10²² |
| 2.3 | Steel | 6.77 × 10¹² | g | 1.40 × 10⁹ * | 9.48 × 10²¹ |
| 2.4 | Aluminum | 5.07 × 10¹⁰ | g | 1.60 × 10¹⁰ * | 8.11 × 10²⁰ |
| 2.5 | Petrol and diesel | 1.03 × 10¹⁶ | J | 6.60 × 10⁴ * | 6.77 × 10²⁰ |
| 2.7 | Fuel oil | 1.10 × 10¹⁵ | J | 5.40 × 10⁴ * | 5.96 × 10¹⁹ |
| 2.8 | Nonferrous Metals | 1.32 × 10¹¹ | g | 3.57 × 10⁹ * | 4.72 × 10²⁰ |
| 2.9 | Gas | 9.05 × 10¹⁴ | J | 6.02 × 10⁴ * | 5.45 × 10¹⁹ |
| 2.10 | Cement | 3.77 × 10¹² | g | 2.07 × 10⁹ * | 7.80 × 10²¹ |
| 2.11 | Glass | 1.69 × 10¹¹ | g | 8.40 × 10⁸ * | 1.42 × 10²⁰ |
| 2.12 | Plastic | 2.20 × 10¹⁰ | g | 3.80 × 10⁸ * | 8.35 × 10¹⁸ |
| 2.13 | Ceramic | 2.50 × 10⁹ | g | 1.85 × 10⁹ * | 4.63 × 10¹⁸ |
| 2.14 | Agrochemistry product | 2.72 × 10¹⁰ | g | 2.38 × 10⁹ | 6.47 × 10¹⁹ |
| 2.15 | Machine paper and cardboard | 4.88 × 10¹¹ | g | 3.90 × 10⁹ * | 1.90 × 10²¹ |
| 2.16 | Tap water | 1.21 × 10¹³ | g | 3.05 × 10⁷ * | 3.70 × 10²⁰ |
| 2.17 | Chemical preparation and detergent | 6.17 × 10¹² | g | 1.00 × 10⁹ * | 6.17 × 10²¹ |
| 2.18 | Food | 2.38 × 10⁹ | Yuan | 4.35 × 10¹¹ | 1.04 × 10²¹ |
| 2.19 | Textile product | 1.07 × 10⁹ | Yuan | 4.35 × 10¹¹ | 4.65 × 10²⁰ |
| 2.20 | Wood processing and machine manufacturing | 6.53 × 10⁸ | Yuan | 4.35 × 10¹¹ | 2.84 × 10²⁰ |
| 2.21 | Mechanical product | 6.7 × 10¹⁵ | t | 6.7 × 10¹⁵ * | 7.82 × 10²⁰ |
| 2.22 | Transportation equipment manufacturing | 5.50 × 10⁸ | Yuan | 4.35 × 10¹¹ | 2.39 × 10²⁰ |
| WCR % | 1.32 |
| Items. | Jiyuan | Jiaozuo | ||||
|---|---|---|---|---|---|---|
| Industrial | Agriculture | Domestic | Industrial | Agriculture | Domestic | |
| EDR (sej/Yuan) | 4.35 × 10¹¹ | 4.35 × 10¹¹ | 4.35 × 10¹¹ | 3.37 × 10¹¹ | 3.37 × 10¹¹ | 3.37 × 10¹¹ |
| WCR (%) | 1.32 | 13.03 | 21.77 | 1.30 | 21.75 | 23.52 |
| WRV (Yuan/m3) | 15.55 | 4.56 | 23.68 | 16.04 | 7.35 | 24.30 |
| Class I | Class II | Emergy(sej) | Money(Yuan) |
|---|---|---|---|
| Adjustment service value | Water Self-purification | 1.36 × 10¹⁹ | 4.04 × 10⁷ |
| water pollution loss | 2.21 × 10¹⁹ | 6.57 × 10⁷ | |
| regulation climatic | 6.48 × 10¹⁹ | 1.92 × 10⁸ | |
| Sediment transportation | 1.31 × 10²⁰ | 3.01 × 10⁸ | |
| Subtotal | 1.87 × 10²⁰ | 4.68 × 10⁸ | |
| Support service value | biodiversity | 1.02 × 10²¹ | 3.04 × 10⁹ |
| Net primary productivity | 8.61 × 10¹⁸ | 2.56 × 10⁷ | |
| carbon fixation and oxygen release | 3.58 × 10¹⁹ | 1.06 × 10⁸ | |
| Nitrogen releasing in sediment | 2.37 × 10¹⁹ | 7.05 × 10⁷ | |
| Subtotal | 1.09 × 10²¹ | 3.24 × 10⁹ | |
| Total | 1.28 × 10²¹ | 3.71 × 10⁹ | |
| Ecological water value (Yuan/m3) | 8.14 | ||
| Items | Industry | Agriculture | Domestic | Ecology |
|---|---|---|---|---|
| Reservoir water supply benefits | 14.25 | 4.39 | 8.72 | 24.80 |
Publisher’s Note: MDPI stays neutral with regard to jurisdictional claims in published maps and institutional affiliations. |
© 2020 by the authors. Licensee MDPI, Basel, Switzerland. This article is an open access article distributed under the terms and conditions of the Creative Commons Attribution (CC BY) license (http://creativecommons.org/licenses/by/4.0/).
Share and Cite
Guan, X.; Jiang, P.; Meng, Y.; Qin, H.; Lv, H. Study on Production, Domestic and Ecological Benefits of Reservoir Water Supply Based on Emergy Analysis. Processes 2020, 8, 1435. https://doi.org/10.3390/pr8111435
Guan X, Jiang P, Meng Y, Qin H, Lv H. Study on Production, Domestic and Ecological Benefits of Reservoir Water Supply Based on Emergy Analysis. Processes. 2020; 8(11):1435. https://doi.org/10.3390/pr8111435
Chicago/Turabian StyleGuan, Xinjian, Pengkun Jiang, Yu Meng, Haidong Qin, and Hong Lv. 2020. "Study on Production, Domestic and Ecological Benefits of Reservoir Water Supply Based on Emergy Analysis" Processes 8, no. 11: 1435. https://doi.org/10.3390/pr8111435
APA StyleGuan, X., Jiang, P., Meng, Y., Qin, H., & Lv, H. (2020). Study on Production, Domestic and Ecological Benefits of Reservoir Water Supply Based on Emergy Analysis. Processes, 8(11), 1435. https://doi.org/10.3390/pr8111435