Article

Thermal Decontamination of Spent Activated Carbon Contaminated with Radiocarbon and Tritium

1
Korea Atomic Energy Research Institute, Daedukdaero 989, Yuseong, Daejeon 305-353, Korea
2
Hi-Air Korea Co. Ltd., Gomoro 324, Jinlye, Gimhae 50875, Korea
*
Author to whom correspondence should be addressed.
Processes 2020, 8(11), 1359; https://doi.org/10.3390/pr8111359
Submission received: 8 October 2020 / Revised: 26 October 2020 / Accepted: 26 October 2020 / Published: 28 October 2020
(This article belongs to the Section Materials Processes)

Abstract

:
The thermal desorption of tritium (3H, T) and radiocarbon (14C) from spent activated carbon was investigated and three thermal desorption steps were established: the vaporization of homogeneously condensed molecules, the desorption of molecules physically binding with the carbon surface, and the decomposition of chemisorbed molecules. A model-free kinetic analysis was conducted to establish the optimum condition of vacuum thermal desorption. Physisorbed species, including tritiated water (HTO) and 14CO2, were effectively removed by vacuum thermal desorption. However, a fraction of 14C, which may take the form of carbon molecules in pyrocarbon form during the heating process, was not removed, even at a high temperature of 1000 °C under a vacuum of 0.3–0.5 Pa. Oxidative peeling of the pore surfaces by filling the evacuated pores with pure oxygen via vacuum thermal desorption and heating to 700 °C was found to be effective for reducing the level of 14C to a level below the established free-release criterion (1 Bq/g) when treating spent activated carbon with 14C radioactivity levels of 162 and 128 Bq/g. The reactivation of the spent granular activated carbon (GAC) by vacuum thermal desorption followed by surface oxidation was also confirmed by the slightly enhanced pore volumes when compared to those of virgin spent activated carbon.

Graphical Abstract

1. Introduction

Activated carbon (AC), a porous carbon material, acts as a sponge for different types of gases. The gases are attracted to the carbon material via Van der Waals forces. AC has a wide range of applications for separating certain gases from gaseous effluents and storing them in pores [1]. In nuclear power plants, AC beds are commonly used to adsorb radioactive noble gases such as 86Kr and 134Xe as well as radioiodine sources such as 131I and 133I from gaseous effluents [2,3]. AC beds retain those short-half-life radioactive gases while they rapidly decay to nonradioactive species. During operation, spent AC are generated as a type of radioactive waste to be disposed of in a radioactive waste repository. Although adsorbed radioactive noble gases and radioiodine decay to nonradioactive elements, spent AC retains radioactive species with a long half-life, such as 3H (tritium, T) and 14C (radiocarbon), and these must be disposed of in a radioactive waste repository.
Tritium (T) is a radioactive isotope of hydrogen and is a pure beta emitter with a half-life of 12.3 years. 14C is a radioactive isotope of carbon and is a pure beta emitter with a half-life of 5730 years. 14C with an extremely long half-life is easily transferred during biological processes, and the metabolism of 14C in the human body follows that of ordinary carbon [4]. The disposal of waste containing significant amounts of 14C will thus be more difficult than that of waste containing only short-lived nuclides. The minimization and segregation of waste containing long-lived nuclides (e.g., 14C) are therefore important factors for an effective waste management approach. A challenge during the effective management of spent AC is the removal of 14C in order to minimize the radioactive waste with long-half-life radionuclides [5].
Isotopes are atoms of the same element that contain an identical number of protons but a different number of neutrons. Despite having different numbers of neutrons, isotopes of the same element have very similar properties. The adsorption and desorption characteristics of HTO and 14CO2 and hydrocarbons having 14C such as 14CH4 in AC are similar to those of nonradioactive H2O, CO2 and hydrocarbons such as CH4, respectively. This study investigated the thermal desorption characteristics of 3H- and 14C-bearing species in spent AC by observing the desorption characteristics of H2O and CO2 and CmHn by means of TGA (thermogravimetric analysis)-coupled FTIR. The mechanisms of thermal desorption of these adsorbates were suggested based on the thermal desorption rate and the gas-evolution characteristics at elevated temperatures.
The objective of this study was to develop a thermochemical treatment method which converts radioactive spent AC contaminated with 3H and 14C into recyclable AC. The mechanisms and kinetics of the thermal desorption of 3H- and 14C-bearing species in the spent AC were initially observed and the results were applied to establish optimum operating conditions for a thermal decontamination process which could remove 3H and 14C species in spent AC to levels below the free release criteria. A pyrolytic thermochemical decontamination process consisting of a VTD (vacuum thermal desorption) and oxidative pyrolysis for spent AC generated from the off-gas treatment systems of nuclear power plants are proposed in this study, and its performance is demonstrated by a trial treatment of spent AC generated from a CANDU reactor in Korea. In addition, the recyclability of SAC treated by the proposed thermochemical treatment method was assessed by comparing the porosity and surface of treated spent AC with that of virgin AC of the type used in nuclear power plants.

2. Materials and Methods

2.1. Spent Activated Carbon

The AC investigated in this study is a granular type of AC (GAC) impregnated with KI and triethylenediamine (TEDA), which is commonly used for the cleaning of gaseous effluents in nuclear power plants. The size of the GAC used in this study, which was supplied by an activated carbon manufacturing company (NAC Co. Ltd., South Korea), is in the range of 0.5–0.8 mm. Spent GAC samples were prepared by flowing laboratory air through a bed of virgin AC granules for a week to allow them to adsorb moisture and CO2 and CH4 in the air, for which the RH was 40–45%. The analyzed concentrations of CO2 and CH4 in the laboratory air were in the ranges of 350–400 ppm and 2–4 ppm, respectively.

2.2. Analysis of Textural Properties

The recyclability of thermal-decontamination-treated spent AC was investigated by observing changes in the textural properties of the AC during the vacuum thermal desorption (VTD) and partial oxidation (PO) of spent AC. The textural characterization of the samples was conducted using high-resolution N2 adsorption isotherms at 77 K measured using a conventional gas sorption apparatus (3Flex Version 5.00, Micrometrics). Before the measurements, the samples were outgassed for 2 h at 200 °C in the degas port of the adsorption apparatus. From the high-resolution N2 adsorption data, the apparent surface area (SBET), the micropore volume (Vmicro), and the surface area of the micropores (Smicro) were evaluated using the standard BET (Brunauer-Emmett-Teller) equation and the high-resolution αs plot method [6,7,8]. The pore size distribution (PSD) and surface area distribution (SAD) of the GAC samples were evaluated by NLDFT (nonlocal density functional theory) [9,10] using SAIEUS software (Micrometrics).

2.3. TGA-FTIR Analysis

The rate of thermal desorption and the gaseous evolution products created during the course of heating of the GAC sample were investigated using a TGA system (SETSYS-Evolution, SETARAM) coupled with a FTIR gas analysis system (Nicolet FTIR, Thermo Fisher Scientific). The prepared spent GAC samples were heated in a TGA furnace under a high-purity argon-carrying atmosphere (>99.999% Ar). Gases emitted from TGA furnace were passed to the heated gas cell of the FTIR through a heated tube at 200 °C. How the gases evolve at different temperatures during the nonisothermal heating condition was investigated by matching the obtained IR spectrums to those in the literature. Additional nonisothermal TGAs under an ultra-vacuum condition were conducted for a kinetic analysis of the vacuum thermal desorption reactions. A two-stage vacuum pumping system consisting of a primary pump and a secondary pump (turbo-pump, Hi-Cube ECO 30, Pfeiffer) was connected to the outlet of the TGA system for the vacuum TGA study.

2.4. Trial Thermal Desorption

Trial thermal desorption tests of radioactive spent SAC generated from the air cleaning systems of the nuclear power plants were conducted using a vacuum furnace system. The vacuum furnace system consisted of a furnace and two-stage vacuum pumping system (mechanical pump and diffusion pump). Radioactive spent GAC generated from a CANDU reactor in Korea was supplied for trial treatment tests. The corresponding 14C radioactivity levels of the two tested spent SAC samples taken from the CANDU nuclear power plant were 162 and 128 Bq/g. SAC samples have a similar range of radioactivity of 3H (approximately 102 Bg/g).

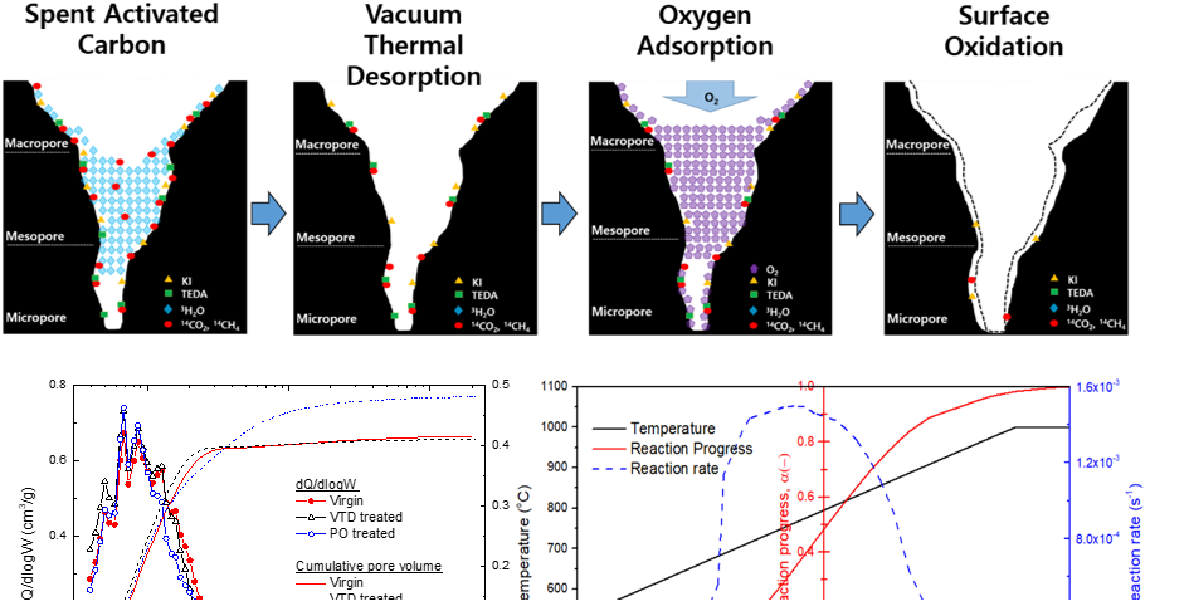
2.5. Kinetic Analysis and Prediction of the Thermal Desorption Reaction

A model-free kinetic analysis was conducted in this study because multiple reactions occur during the thermal desorption of AC. The rate of thermal desorption (Rd) can be given by the rate of the solid-state reaction by [5]
R d = d α d t = A α exp ( E α R T ) f ( α )
where α is the fraction of desorption, Aα is the pre-exponential (frequency) factor, Eα is the activation energy, T is the absolute temperature, R is the gas constant, and f(α) is the reaction model [11,12]. For the TGA study, α is defined as
α = ( m 0 m t ) / ( m 0 m f )
where m0, mt and mf are the initial weight, the weight at processing time t and the final weight, respectively. In a nonisothermal heating system with a constant heating rate (dT/dt = B), the reaction rate is given by the following Equation (3):
d α d T = A α B exp ( E α R T ) f ( α )
The differential isoconversional method by Friedman [13] was used in this study. This method is based on the logarithm shown in Equation (3). The values of the kinetic triplets, Aα, Eα and f(α), which change with the reaction progress α, can be obtained as a function of α by the following Equation (4):
ln [ B ( d α d T ) ] = ln [ A α f ( α ) ] E α R T
Using Equation (4), the values of Aα, Eα and f(α) can be determined without an interpretation of the kinetic model function f(α). An accurate interpretation of the kinetic model is not possible when multiple reactions simultaneously occur because Eα and Aα vary with the reaction progress α. However, a kinetic prediction for the determination of the time and temperature profile to obtain the target conversion α is possible by applying the determined values of the kinetic triplets to the following Equation (5):
t α = 0 t α d t = 0 α d α A α f ( α ) exp ( E α R T )

3. Results and Discussion

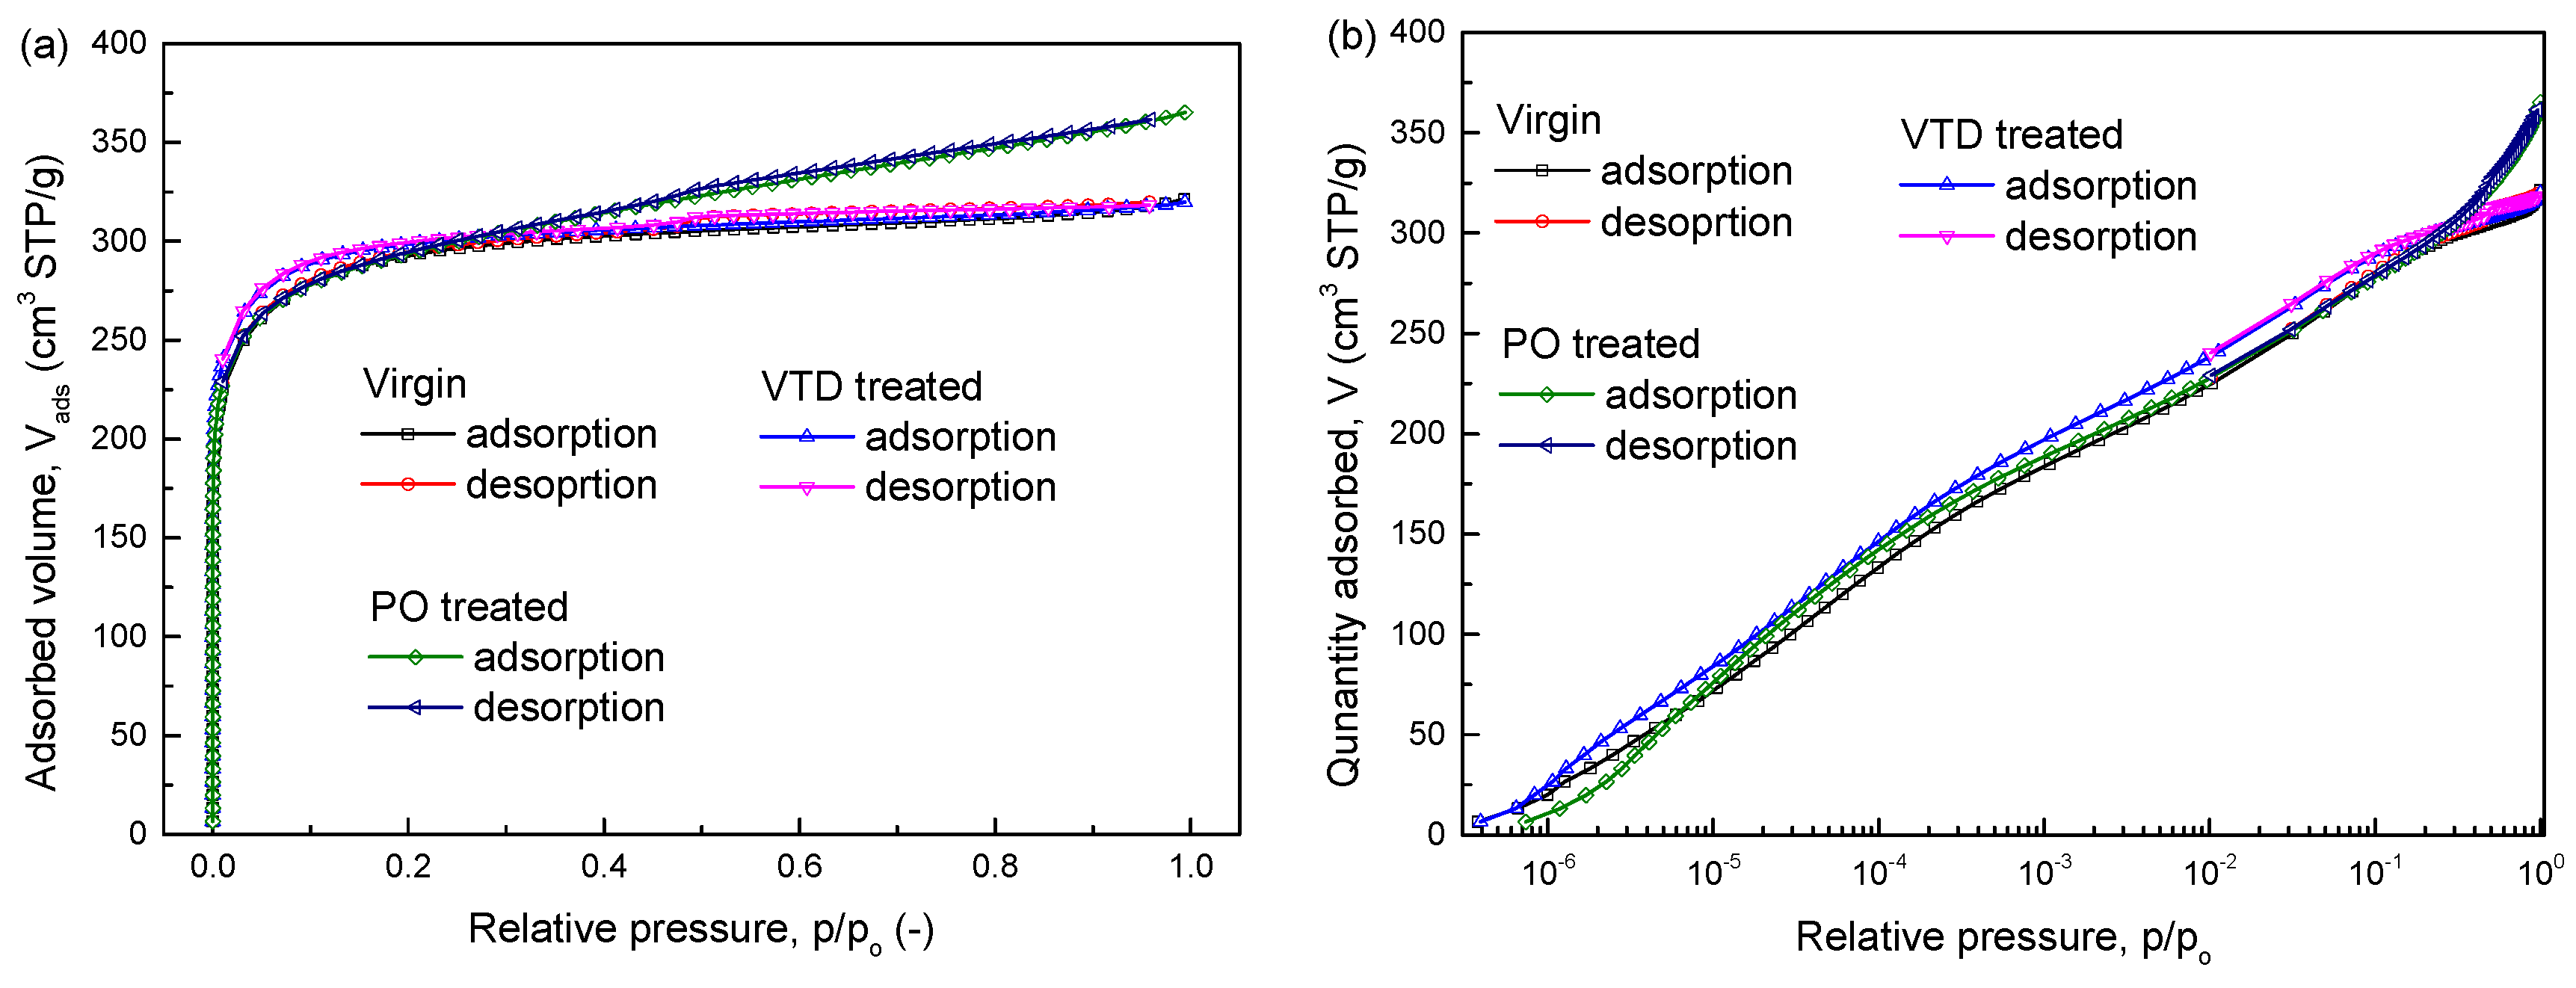
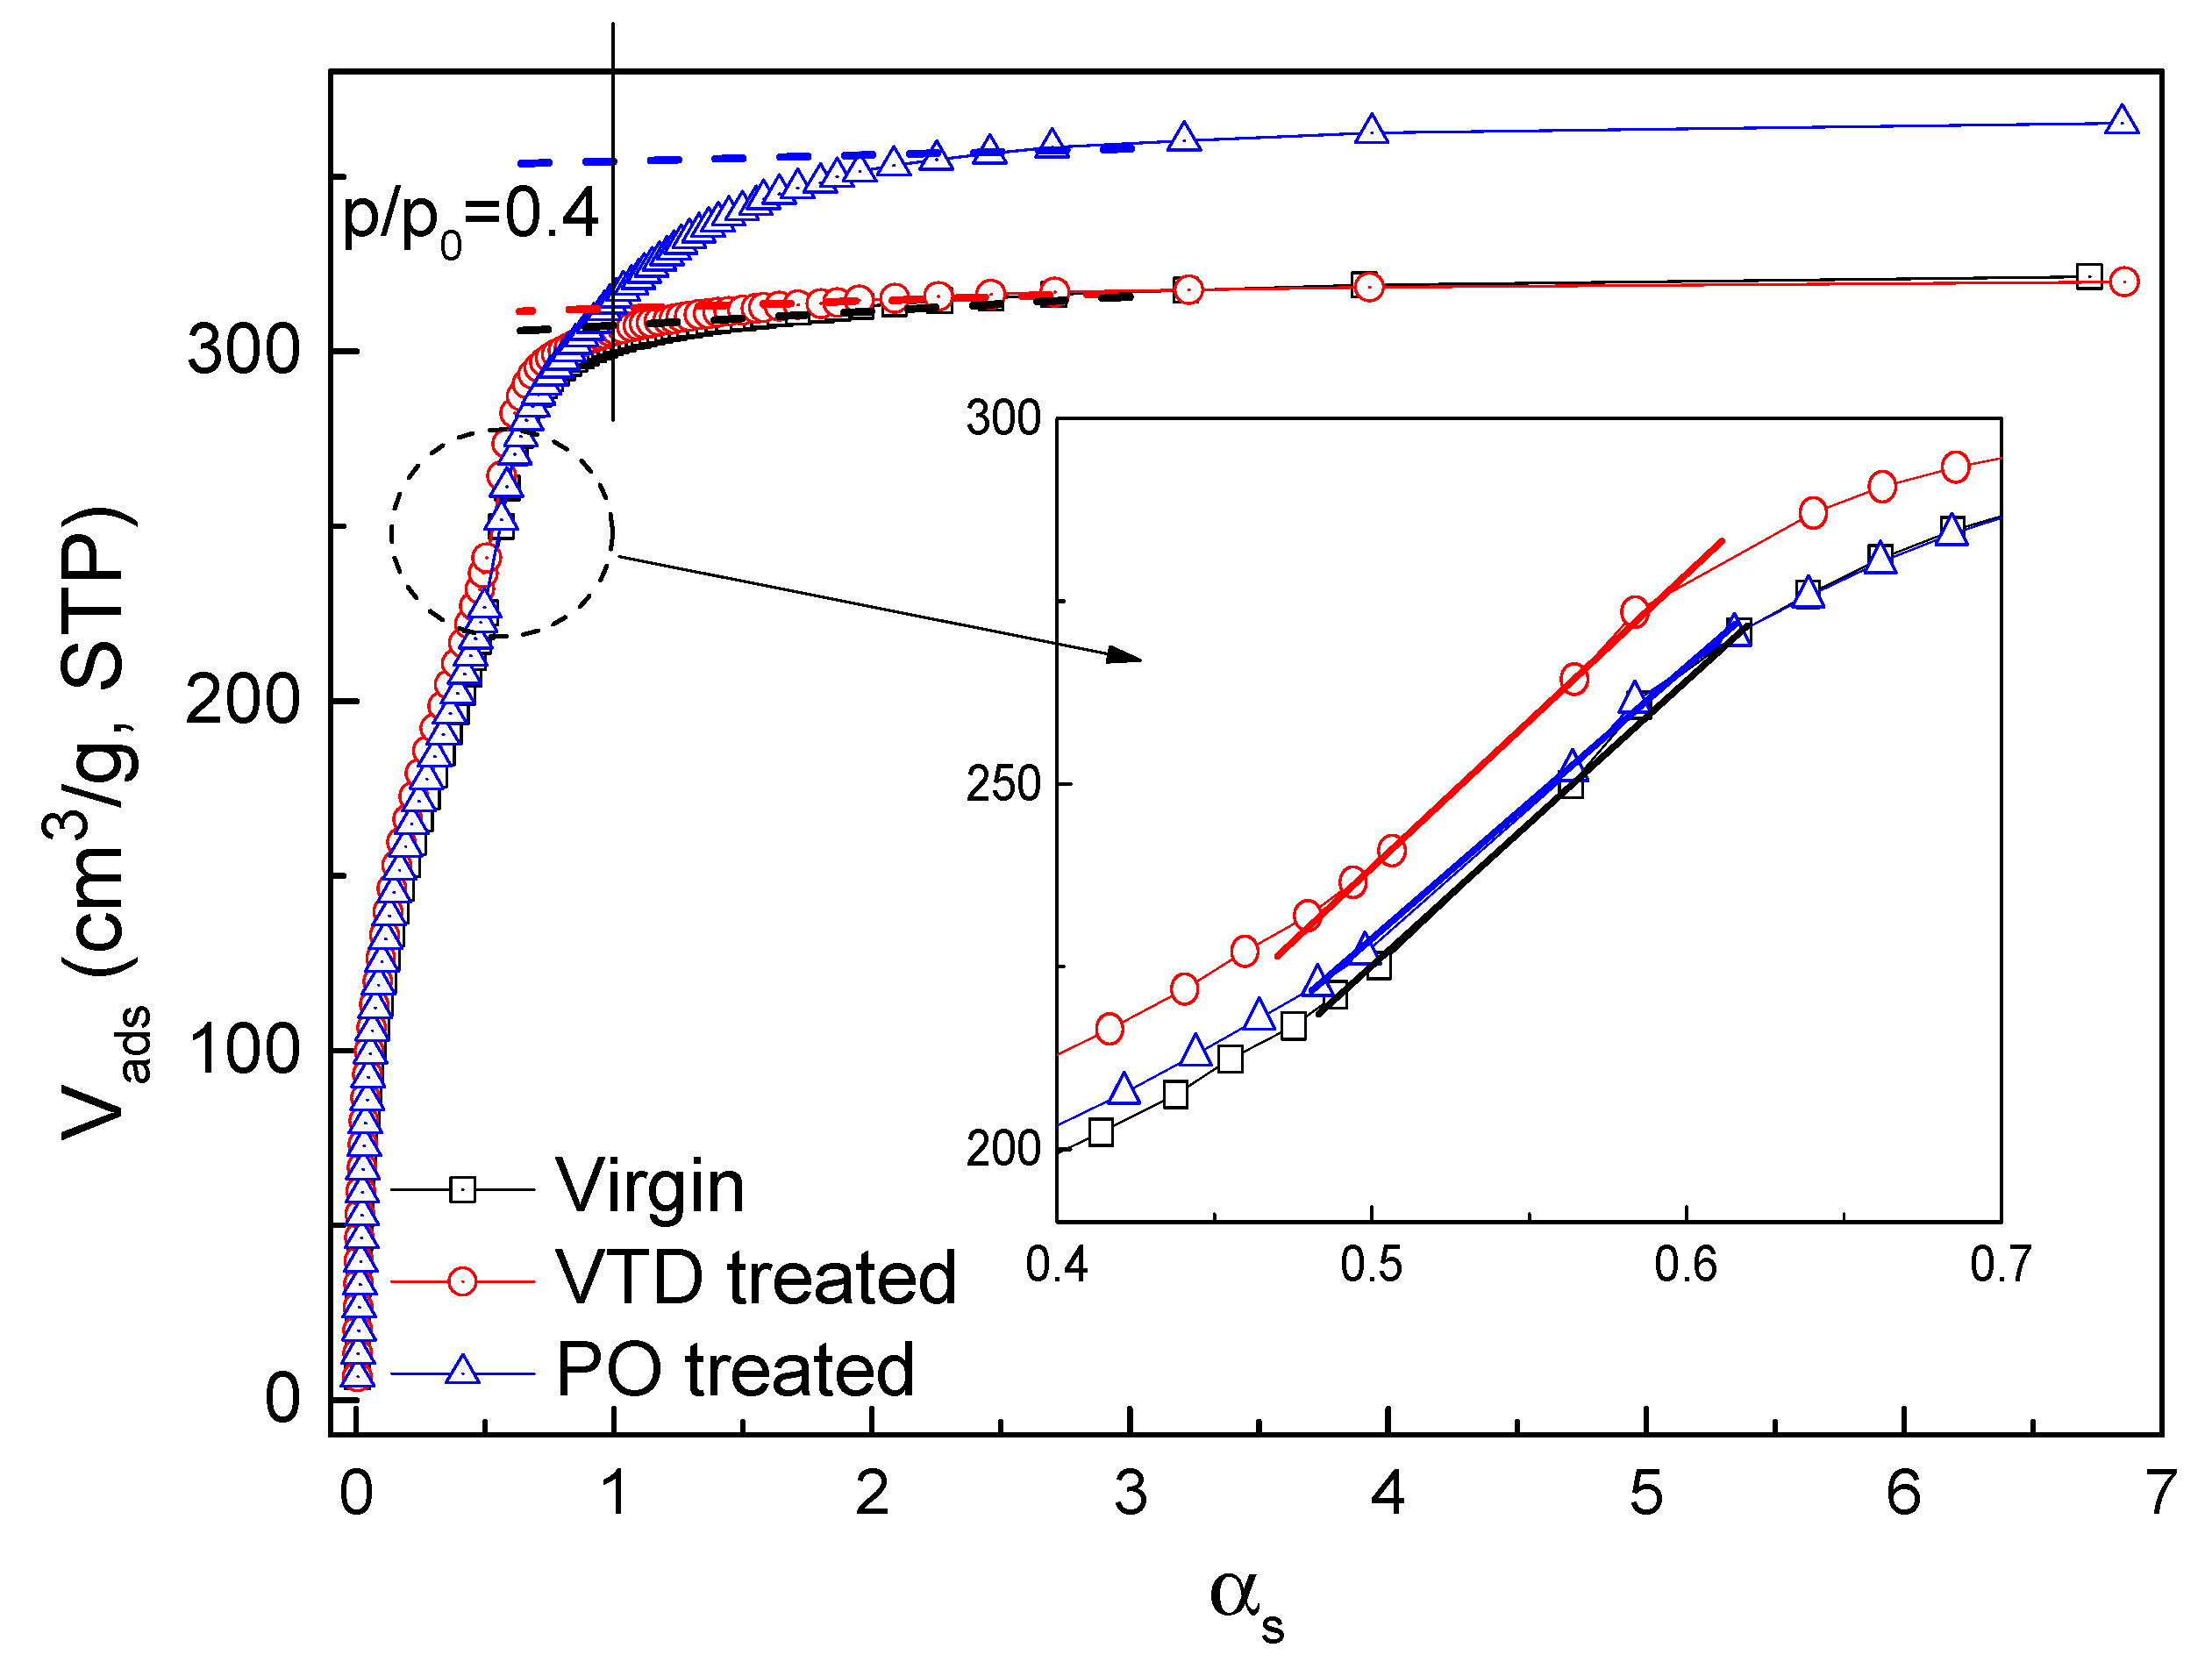
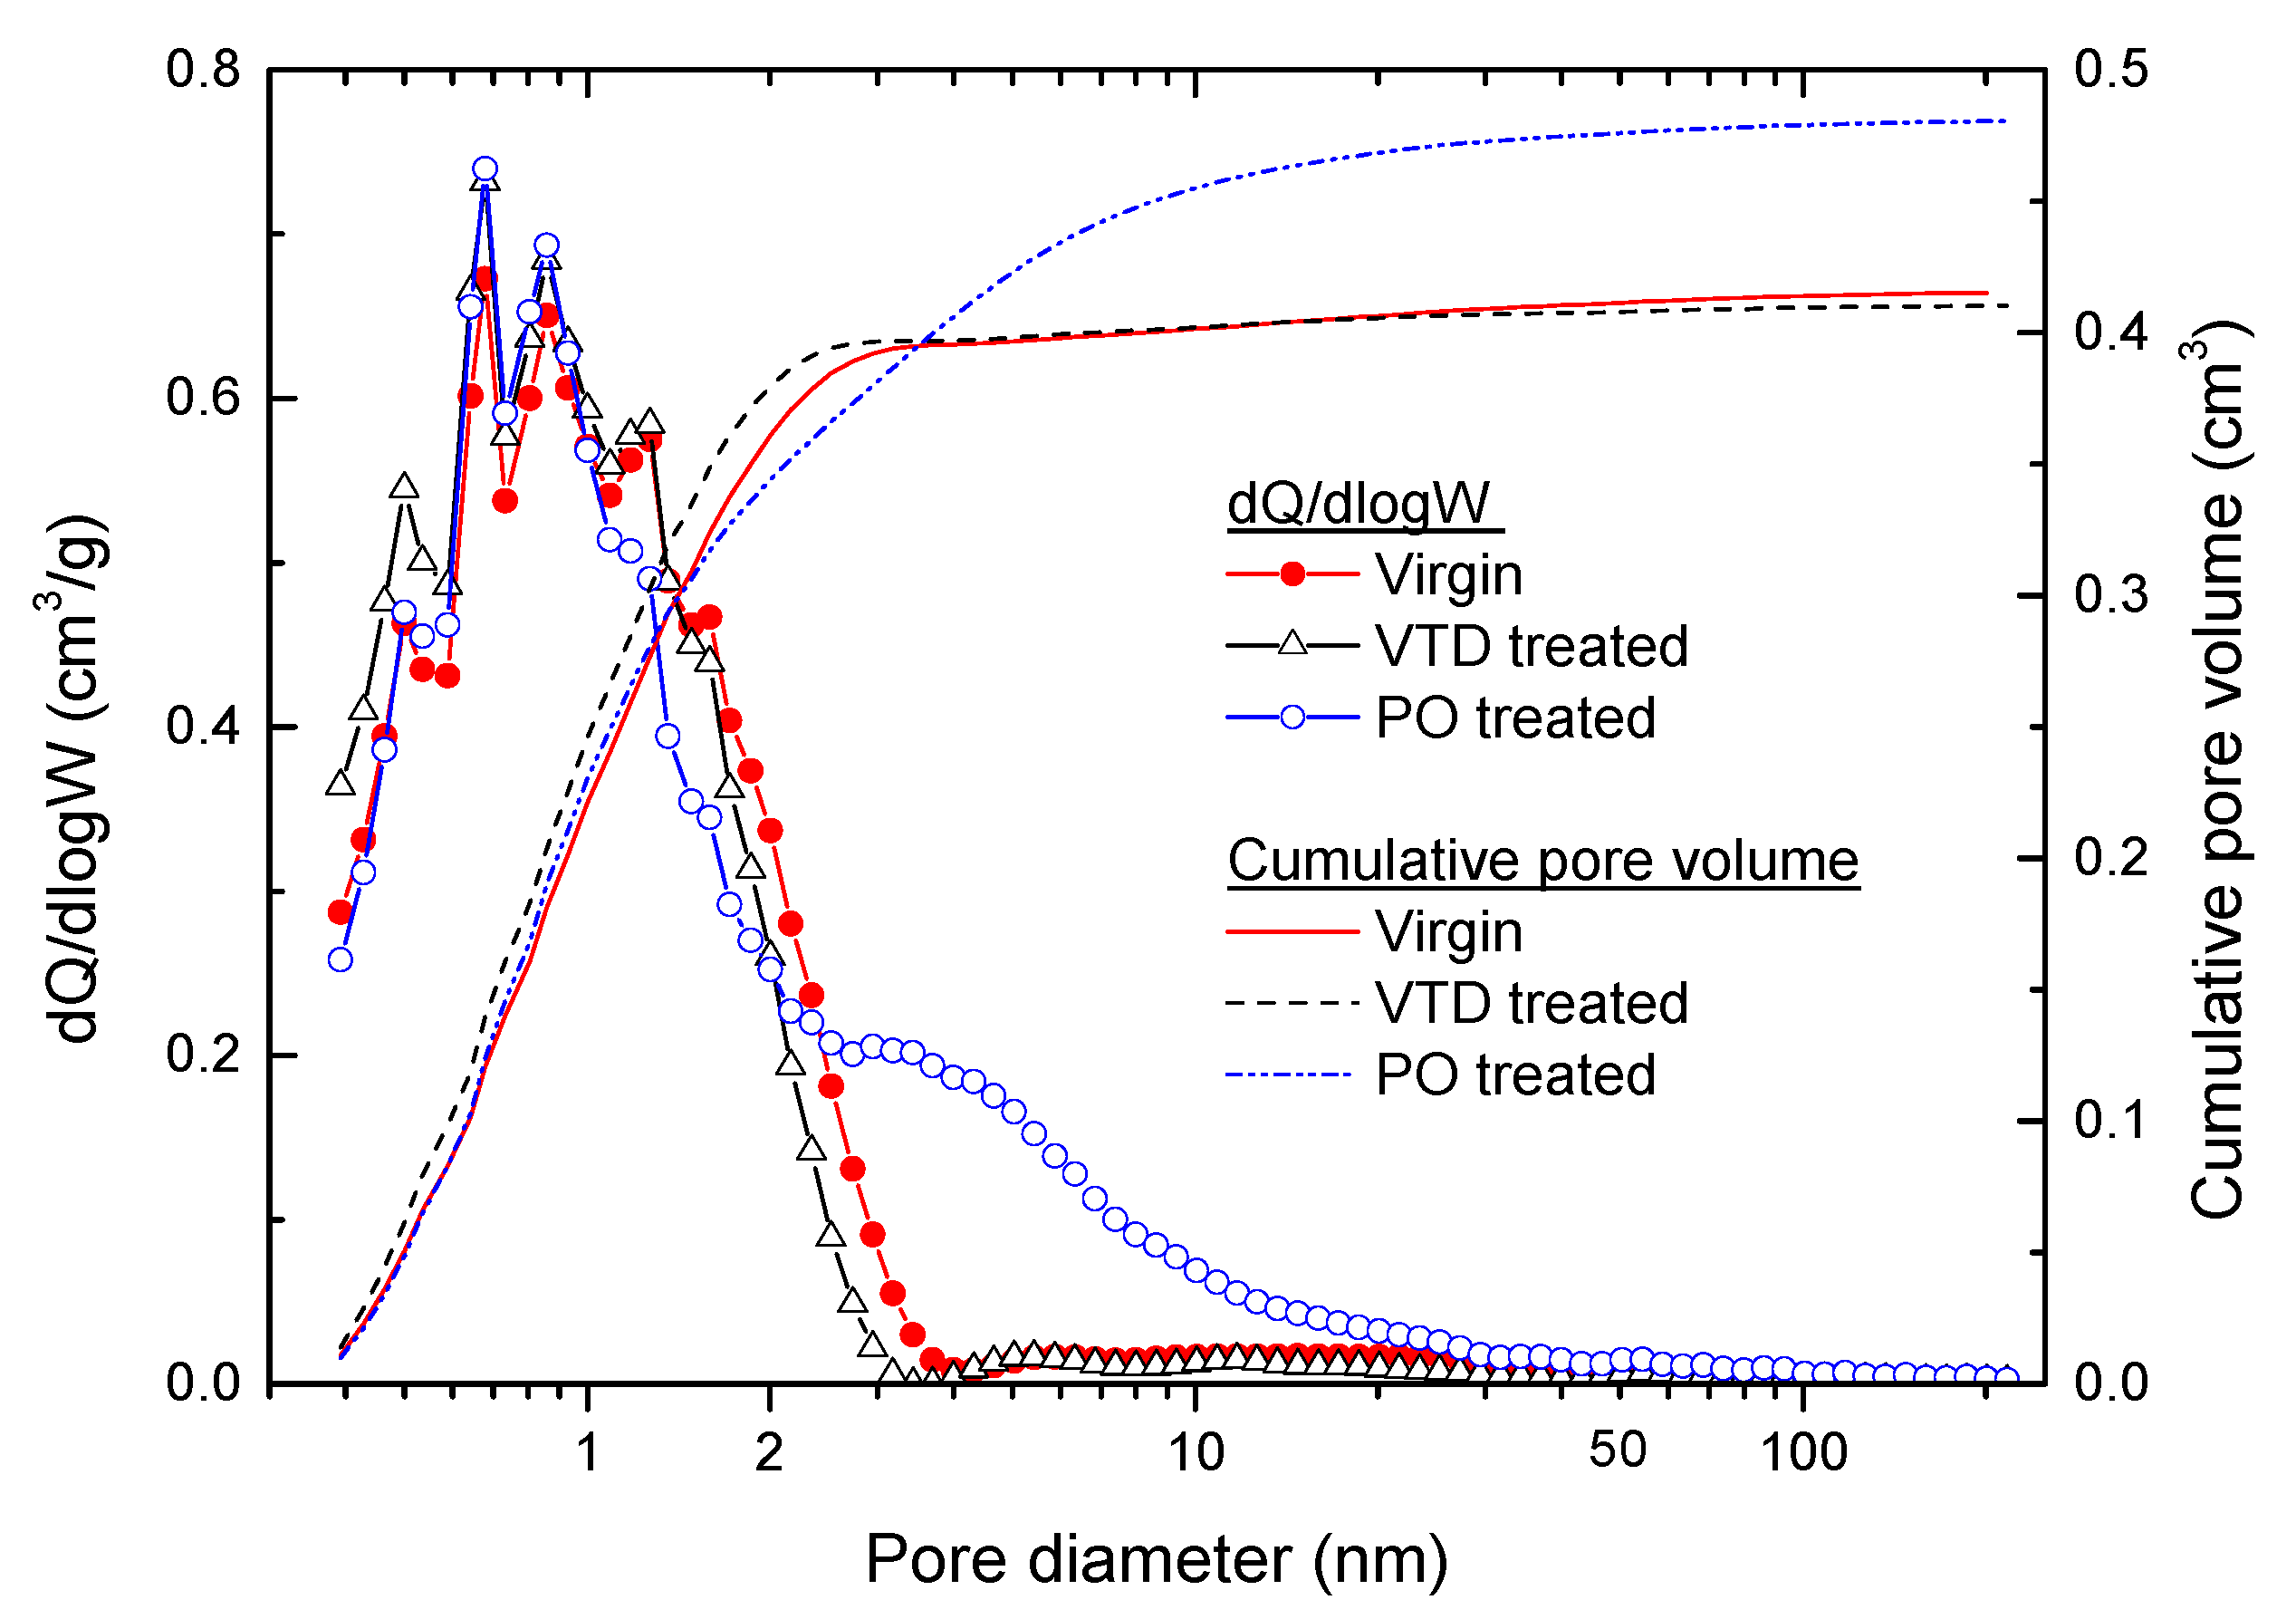
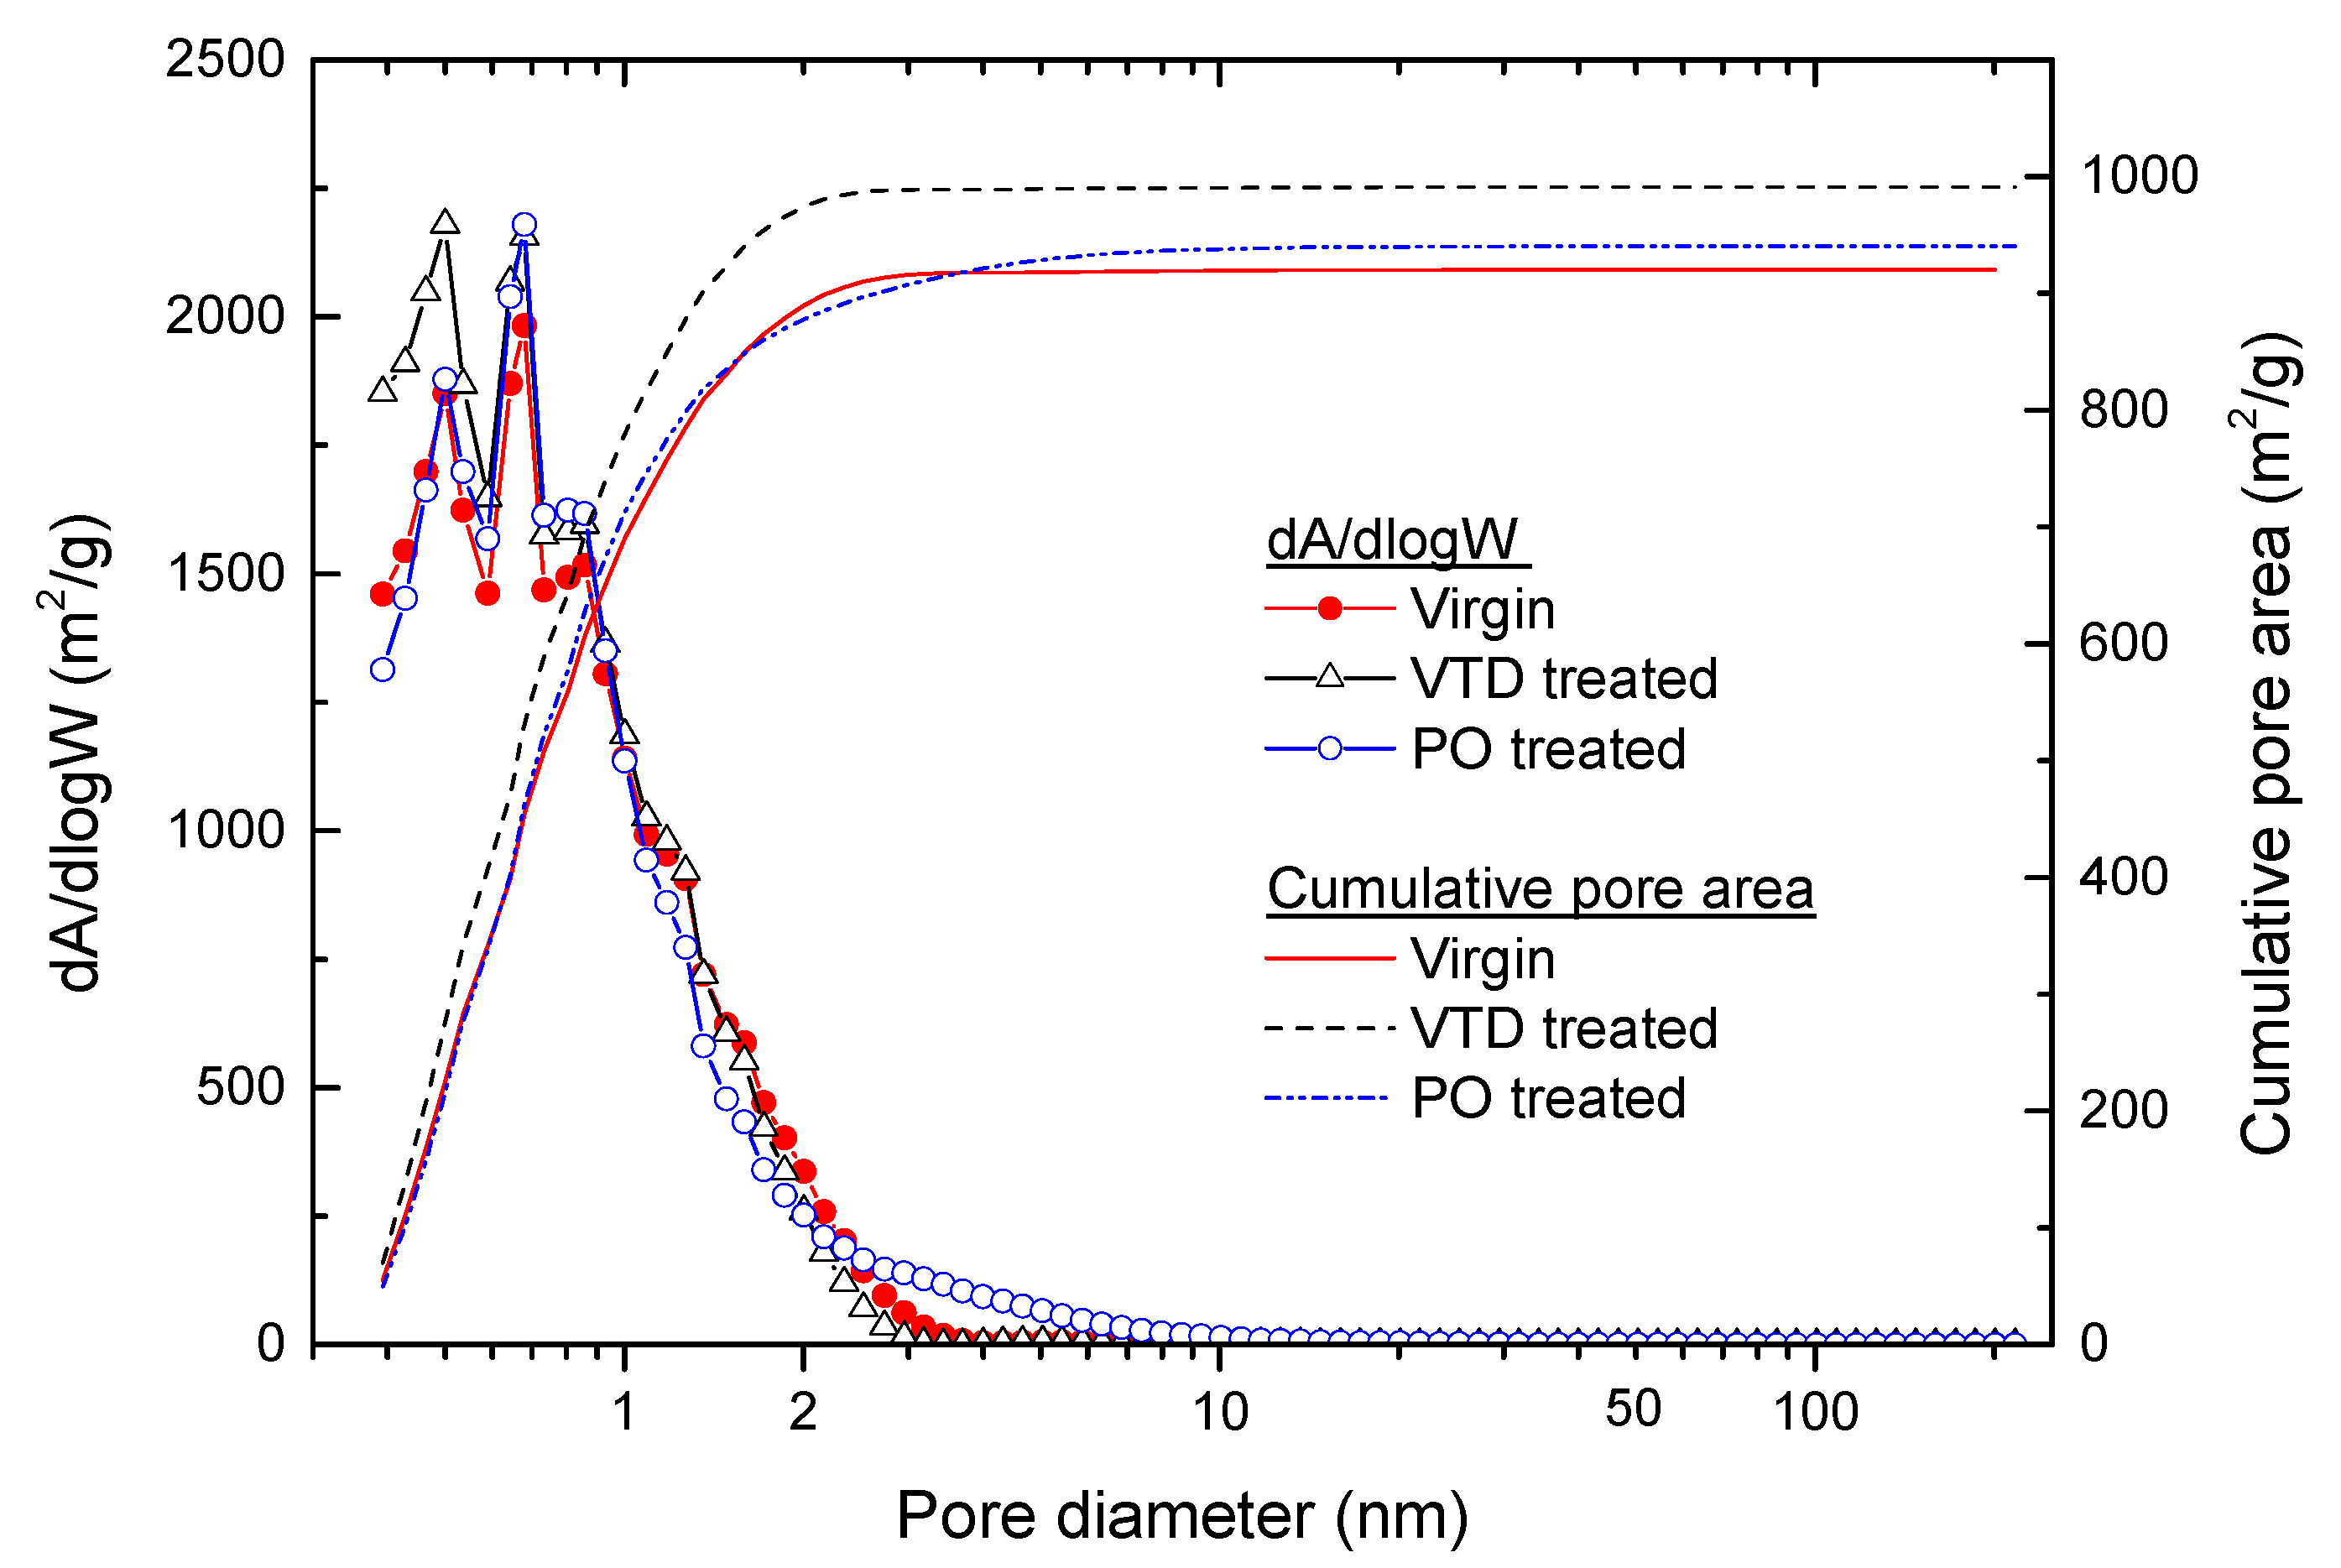
3.1. Changes in the Porous Texture

The investigated thermal decontamination process for the spent AC is a combination of vacuum thermal desorption (VTD) at 1000 °C and 10−2 Pa and the partial oxidation (PO) of VTD-treated AC at 700 °C after the pressurized filling of O2 into the evacuated pores by VTD. The changes in the porous texture of the AC samples after VTD and those after PO were observed by high-resolution N2 adsorption experiments within the relative pressure (p/p0) range of 4 × 10⁻⁷ to 1. The high-resolution adsorption and desorption isotherms of virgin, VTD-treated and PO-treated GAC samples are shown in Figure 1. The adsorption of N2 at 77.4 K on these three GAC samples was very rapid, indicating the accessibility of the pores to nitrogen molecules at 77.4 K. After complete micropore filling at a low pressure (p/p0 ≤ 0.4), the isotherms showed a fairly horizontal plateau. The isotherms for these three samples were typically type I according to the IUPAC classification, characterized by the presence of a highly microporous solid. A hysteresis loop at > p/p0 = 0.4 was found in the three GAC samples, but the desorption points are approximately 0.5% above the corresponding adsorption level at > p/p0 = 0.4, showing no significant hysteresis due to capillary filling. The high-resolution N2 isotherms shown in Figure 1 indicate that the highly microporous characteristics of GAC did not significantly change during the course of the VTD and PO treatment.
A detailed comparison of the microporous textures of GAC samples during the course of thermal desorption treatments was made using the αs–plot method and the NLDFT method. High-resolution αs–plots constructed based on the differences between the high-resolution N2 sorption data from the GAC samples shown in Figure 1 and data from nonporous reference carbon LMA10 [7] are shown in Figure 2. During the adsorption of N2 at 77.4 K by microporous adsorbents, it is generally accepted that the filling of N2 molecules into micropores is completed up to αs = 1 (p/p0 = 0.4). In this study, Vads (adsorbed volume) at p/p0 = 0.4 in Figure 2 was assumed to be Vmicro (volume of micropores). The Vmicro values (in cm3/g, STP) of the virgin, VTD-treated and PO-treated GAC samples were estimated to be 0.483, 0.491 and 0.486, respectively. The changes in the micropore volumes of the GAC samples during the course of the thermal decontamination treatments were negligibly small.
The intercepts of the dotted lines at αs = 1 (p/p0 = 0.4) in Figure 2 can be assumed to be equal to the sum of the pore volumes (Vpore = Vmicro + Vmeso (volume of mesopores)). The change in Vpore after the VTD treatment was negligibly small. However, the difference between Vpore for the virgin (or the Vpore of the VTD-treated sample) and the PO-treated sample was relatively significant. The values of Vmeso (in cm3/g, STP) for the virgin, VTD-treated and PO-treated GAC samples were 0.015, 0.014 and 0.058, respectively. A nearly fourfold increase in the mesopore volume was found after the PO treatment, resulting in approximately a 9% increase in the total pore volume after the partial oxidation treatment.
The surface area (A, in m2/g) was estimated by relating the slope of the straight line from the αs–plots to the adsorbed volume of N2 and the surface area of a reference nonporous material. This is expressed as Equation (6) [8].
A   = k × s l o p e
In Equation (6), the constant k (= 2.62 m2/cm3(STP)) was obtained from the ratio of the BET surface area of the nonporous reference carbon LMA10 used here (ABET = 8.517 m2/g) and the adsorbed N2 volume at αs = 1 (p/p0 = 0.4) (V = 3.25 cm3/g (STP)). N2 sorption isotherm and BET surface area plot for reference carbon LMA10 are shown in Figure S1 [7]. The values of Aext (external surface area) and Amicro (micropore surface area) were estimated from the slopes of the dotted lines and those of the solid lines in Figure 2, respectively. The results of the estimation of the porous texture from the αs–plots are summarized in Table 1. The values of the BET surface area (ABET) as determined by BET plots (Figure S2) are also listed in Table 1. As summarized in Table 1, the micropore surface area was increased by the VTD treatment. However, after the PO treatment of the VTD-treated GAC, the micropore surface area decreased and became similar to that of the virgin GAC sample.
The pore size distribution and pore surface area distribution as estimated by the NLDFT method are shown in Figure 3 and Figure 4, respectively. The differences in the pore volume distributions shown in Figure 3 are in agreement with the changes in the porous texture as estimated by high-resolution αs-plots. The VTD treatment increased the micropore volume slightly, but the total pore volume was similar to that before the VTD treatment. A significant increase in the volume of mesopores (2–50 nm) was noted the PO-treated samples. Figure 4 shows the significant increase in the pore surface area after the VTD treatment. The small increase in the volume of micropores shown in Figure 3 resulted in a significant increase in the pore surface area, as shown in Figure 4. This clearly stems from the fact that the area of the micropores is much greater than that of the mesopores with the same pore volume. It was found from the investigation of the porous textures that the porous structure of GAC can be slightly enhanced by the proposed thermal decontamination treatment process. This suggests that if the radioactive spent GAC can be properly decontaminated to the level of free release by the thermal treatment process proposed in this study, it can be recycled as a highly microporous adsorbent.

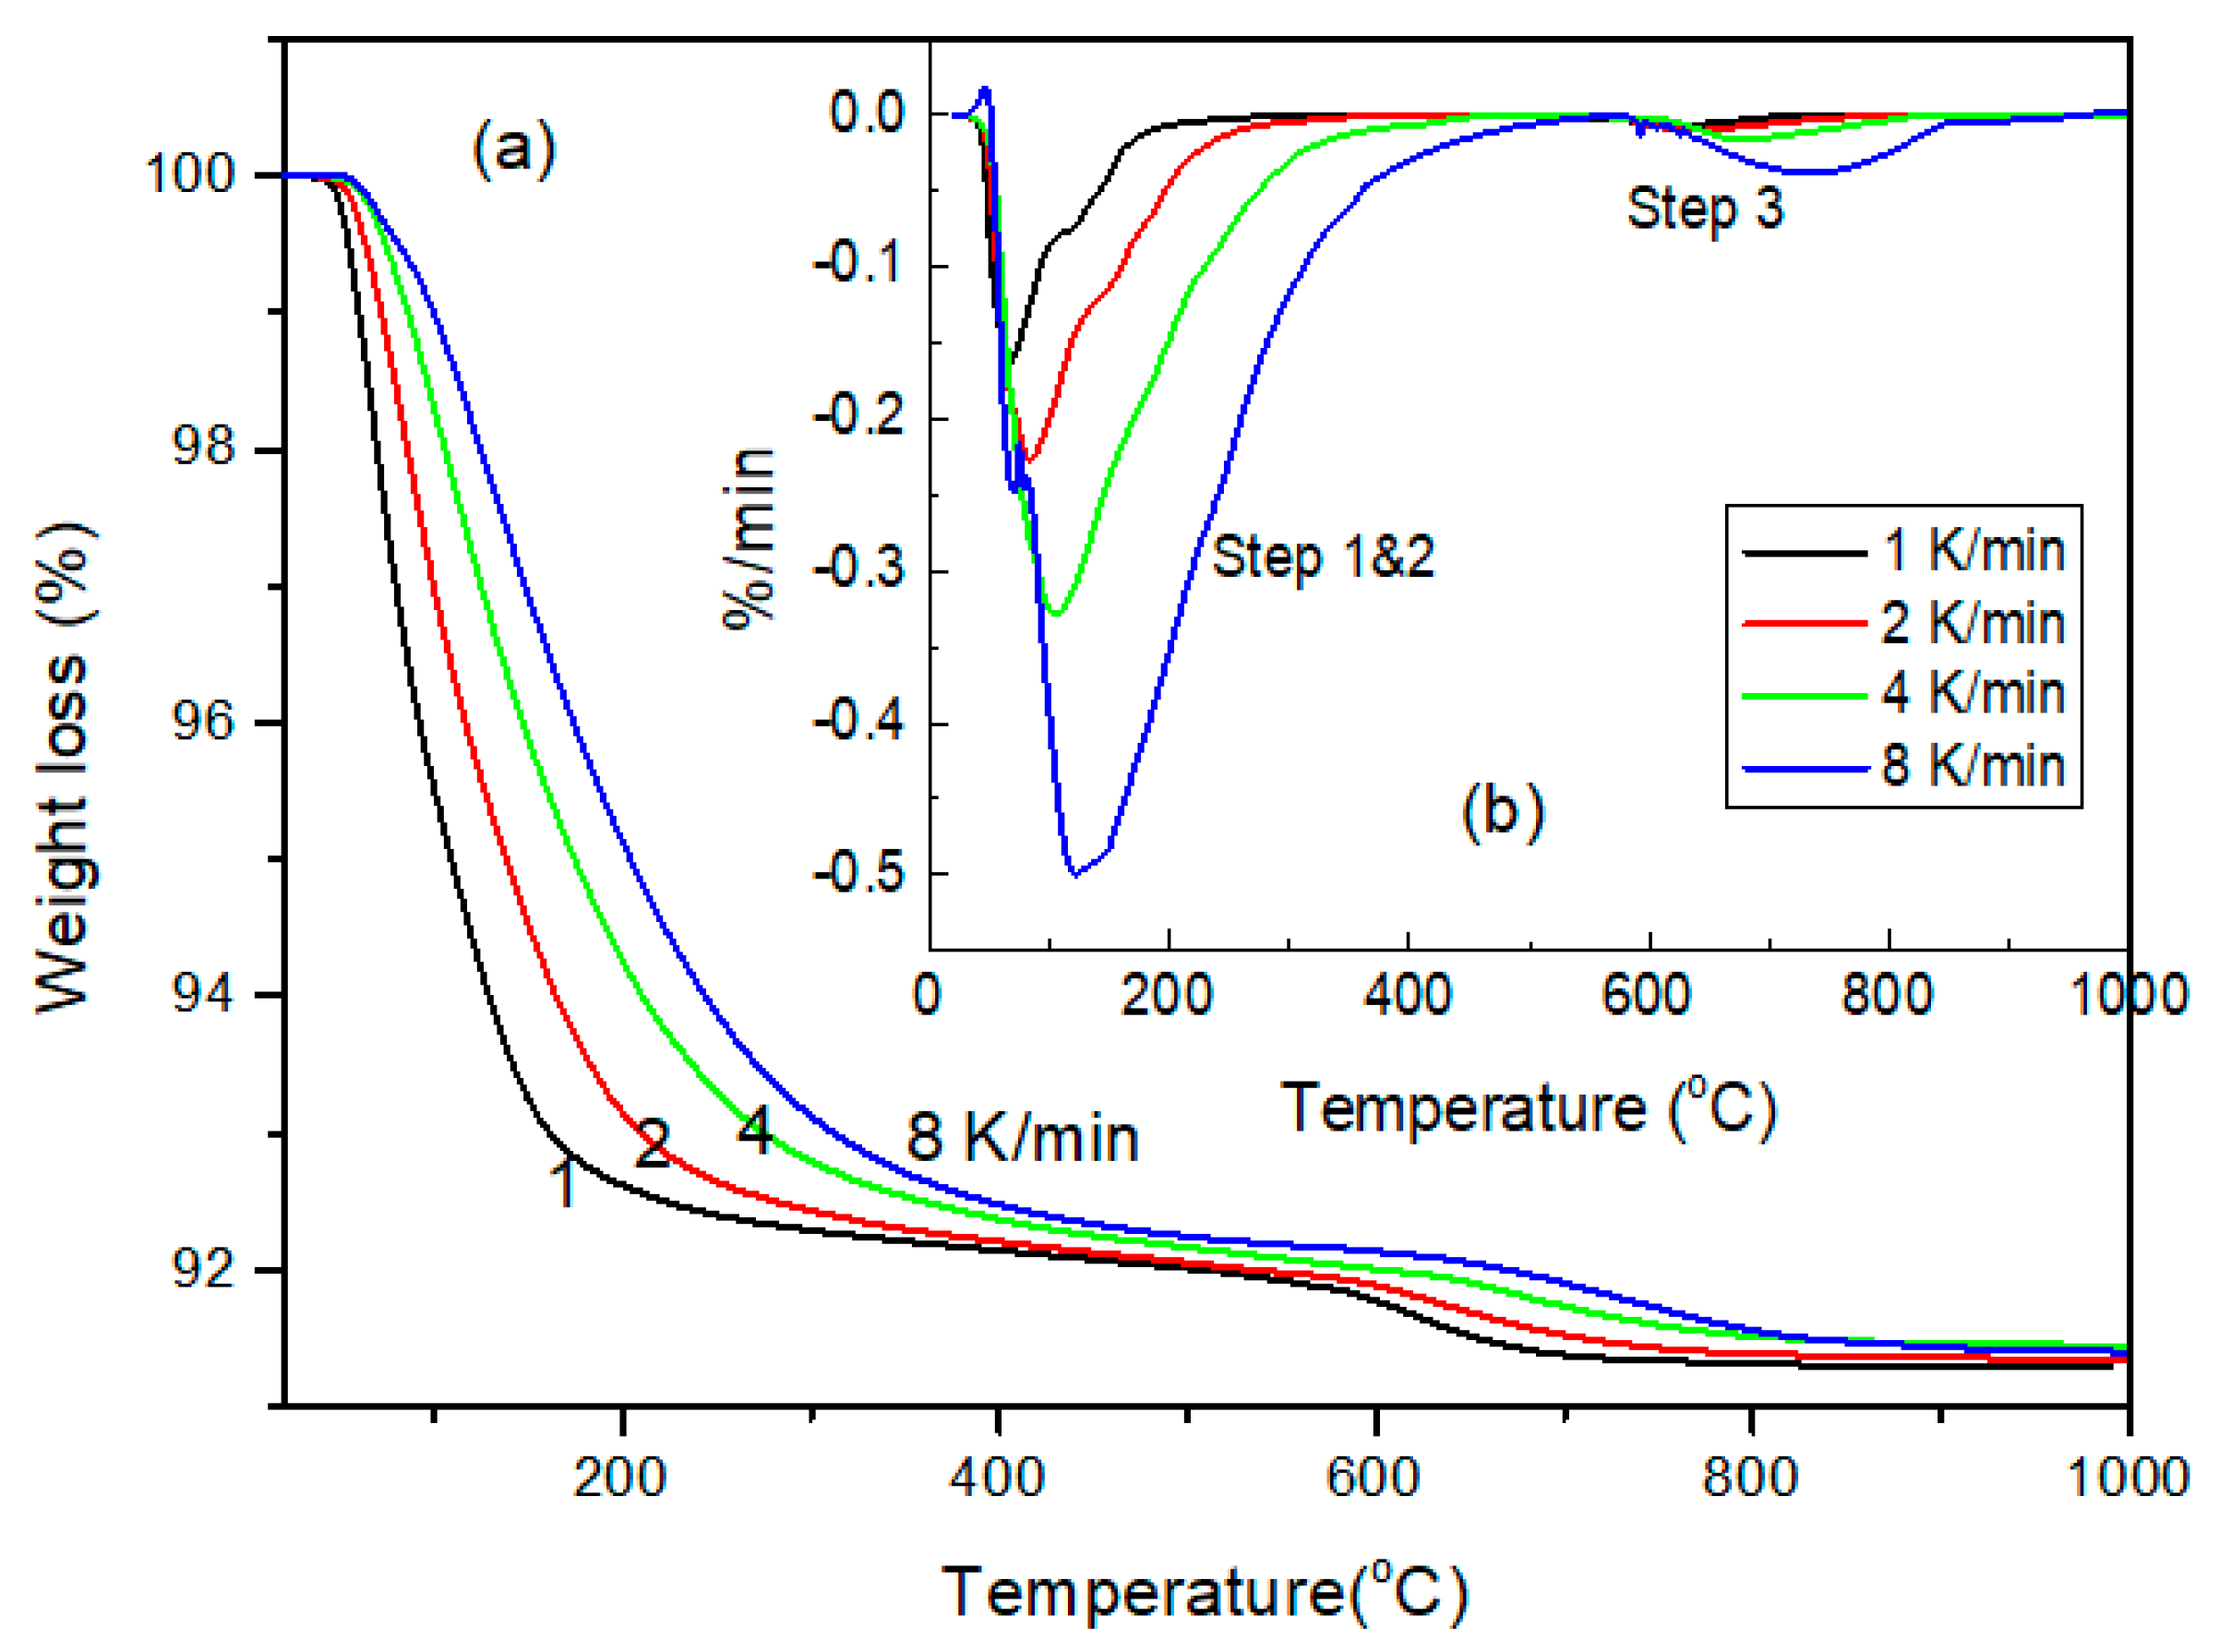
3.2. Thermal Desorption Characteristics

3.2.1. Thermal Desorption Steps

The mass change and the derivative of the mass change obtained from TGA of the spent GAC samples up to 1000 °C with a heating rate of 5 K/min under an inert atmosphere (>99.999% Ar) are shown in Figure S3. The total amount of desorption was 8.2% of the initial GAC mass. The DTG (derivative thermogravimetry) plot shows five points of inflection, suggesting that five individual reactions occurred in a stepwise manner. The results of the deconvolution of the DTG plot into five peaks are shown as the dotted plots in Figure S3. Based on the rate of weight loss at the peak temperature of each reaction, three desorption steps could be established and these are denoted as S1, S2 and S3 at the bottom of Figure S3. The rates of weight loss at the peak temperature are significantly different for each established reaction step. R1, the only reaction in the first step (S1), showed a peak rate of −0.064%/min. Regarding the R2, R3 and R4 reactions in second step (S2), all of these are overlapped, showing peak rates in the range of −0.013 to approximately −0.008%/min. R5 in step 3 (S3) showed peak rates of less than −0.001%/min. These significant differences in the reaction rate as well as the temperature range suggested that the thermal desorption reactions in the different reaction steps shown in Figure S3 have different desorption mechanisms.

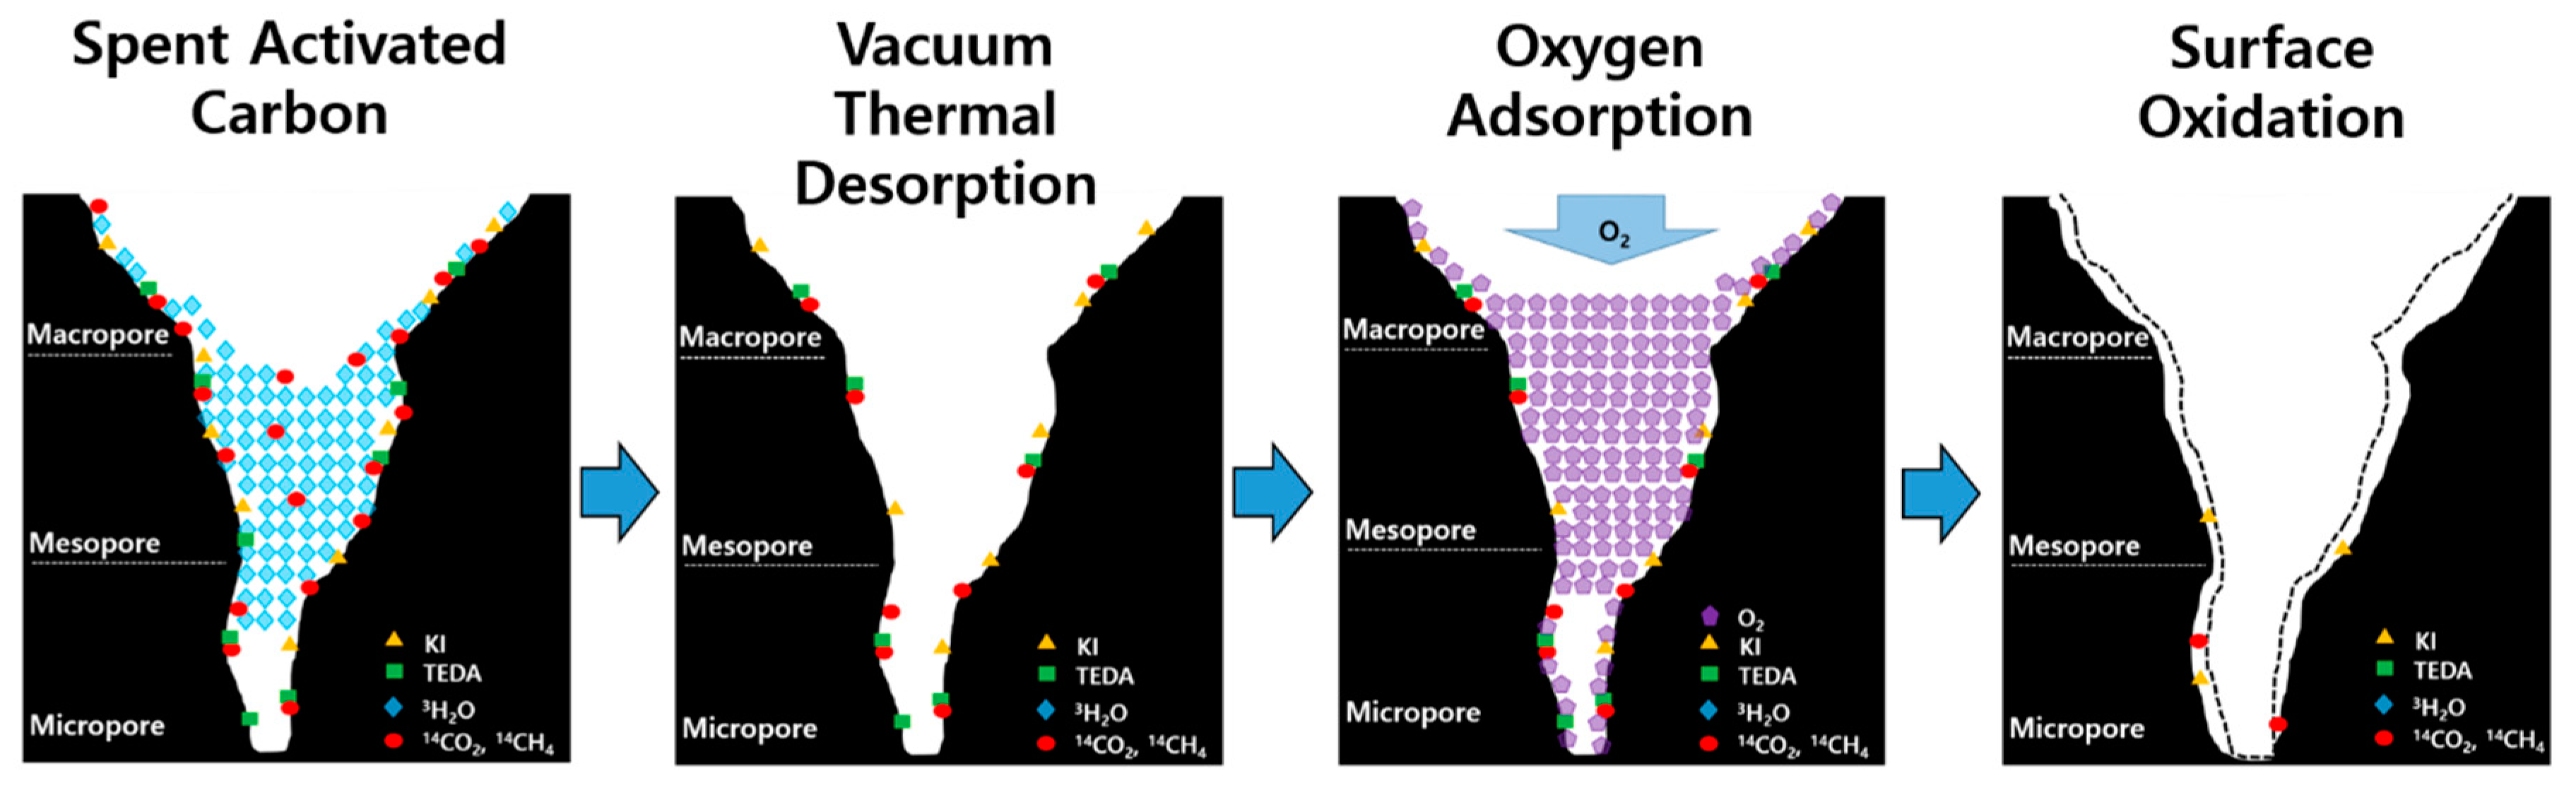
3.2.2. Thermal Desorption Mechanism

The adsorption of gases in activated carbon occurs by two mechanisms: physical adsorption and chemical adsorption. In physisorption, gases are adsorbed into the pores of AC via an attraction to the solid surface via Van der Waals force and have a low heat of adsorption. There is no chemical bond between the carbon surface and the adsorbates in physisorption. In chemisorption, the gas undergoes a covalent chemical reaction to bind to certain sites on the sorbent with a much greater heat of adsorption, roughly the heat of reaction. Generally, these two modes of adsorption, physisorption and chemisorption, are used to describe the gas adsorption of AC [14]. In this study, three steps of adsorption are suggested to describe the three apparent different desorption steps shown in Figure S3. The three steps of the thermal desorption of adsorbates from the pores of SAC are schematically depicted in Figure S4.
Physisorbed adsorbates may undergo two steps of desorption according to the distance of the adsorbed molecules from the carbon surface. As depicted in Figure S4, as a first step (S1), a large fraction of physisorbed molecules, which does not exist in the vicinity of the carbon surface, is desorbed. These molecules do not bind with the carbon surface but instead are molecules homogeneously condensed to pre-adsorbed identical molecules. These homogeneously condensed molecules have relatively low binding energy levels and are readily released from the start of the heating of AC at room temperature. As shown in Figure S3, the rate of the desorption reaction (R1) in the first step (S1) exponentially increases with the temperature due to the exponential increase of the vapor pressures of homogeneously condensed molecules with the temperature. This can result in an extremely sudden escalation and de-escalation of the reaction rate of R1 in the first step. The desorbed fraction in the first step (S1) was 51% of the total desorbed mass. As a second step (S2), physisorbed molecules that exist in the vicinity of the carbon surface are desorbed at even higher temperatures. Because these molecules are strongly attracted to the carbon surface via Van der Waals force, the desorption process requires a higher energy level and the desorption of these molecules therefore occurs at even higher temperatures. The desorbed faction in the second step (S2) was 47% of the total desorbed mass.
After the completion of the thermal desorption reactions of all physisorbed molecules, the chemisorbed molecules are desorbed by the destruction of the chemical bonds at the even higher temperatures, depicted as S3 in Figure S4. The AC investigated in this study is a granular type of AC (GAC) impregnated with triethylenediamine (TEDA) [15]. A fraction of adsorbed carbon dioxide molecules is thus chemically bonded with amine existing on the surface of the AC [16]. In addition, some oxygen and carbon also form chemically bonds with the functional groups existing on the surface of the AC, such as carboxyl, carbonyl, phenol, quinone, and lactone groups [17,18]. Chemically bonded adsorbates have stronger binding energy levels than physically binding molecules. Ryczkowski et al. found that the thermal decomposition of the functional groups in AC starts at about 400 °C, and their peak temperatures are in the range of 600–800 °C and continue to nearly 1000 °C [19]. As shown in Figure S3, the rate of reaction of R5 in step 3 (S3) was very slow, but it occurs at higher temperatures in the range of 550–1000 °C. The weight loss reaction R5 in step 3 (S3) is thus regarded as the thermal decomposition of chemically bonded molecules and functional groups existing on the carbon surface. The desorbed faction in the third step (S3) was 2% of the total desorbed mass.

3.2.3. Thermal Desorption Characteristics of 3H and 14C species

The major adsorbates in spent AC are major gaseous species in the atmosphere, such as N2, O2, H2O and CO2. The radioactive contaminants, 3H(T) and 14C, which mainly exist in the form of HTO, 14CO and 14CH4, are thermally desorbed together with nonradioactive gases such as O2, N2, H2O, CO2 and CH4. The adsorption and desorption characteristics of HTO, 14CO2 and 14CH4 are similar to those of H2O, CO2 and CH4, respectively. In this study, the thermal desorption characteristics of 3H and 14C in spent AC were investigated by observing the evolution characteristics of H2O, CO2 and CH4. The results of FTIR analyses of gases generated during nonisothermal TGA of spent SAC are shown in Figure S5. Reference IR peaks for pure CO2, H2O and CH4 are also shown in Figure S5 [20,21,22]. The clearly identified gaseous species were CO2 and H2O. Large concentrations of carrier gas (Ar) and desorption gas (N2 and O2) also flowed into the gas cell, but FTIR spectroscopy cannot detect these diatomic and noble gases. A much smaller amount of CH4 must also be desorbed from SAC, but there were no clear peaks indicating CH4 in the IR spectrum. This may be due to its much lower concentration when compared to those of the carrier gas (Ar) and the major desorbed gases, in this case N2, O2, H2O and CO2.
The radioactive contaminants, 3H(T) and 14C, which mainly exist in the form of HTO and 14CO, respectively, as noted above, are thermally dissociated from the pores together with the nonradioactive gases of O2, N2, H2O and CO2. The sudden escalation of the reaction rate of R1 indicated in Figure S3 must have resulted from the sudden vaporization of homogeneously condensed H2O molecules and CO2, as shown in Figure S5. Emission of H2O species was concentrated in the first (S1) and the second (S2) steps shown in Figure S3. This indicated that adsorbed tritium (3H, T) species, in the form HTO, are mostly homogenously condensed molecules and thus are readily removed by the heating of AC until the end of reaction step 2 (S2). However, the thermal desorption pattern of CO2 is quite different from that of H2O. The emission concentration of CO2 gradually increased with the temperature to the peak temperature at about 500 °C. Unlike H2O, the emission concentration of CO2 did not suddenly decrease at the further elevated temperatures. It slowly decreased with the temperature from approximately 550 °C, and a significant amount of CO2 emission continued to 1000 °C. This indicated that a significant faction of the adsorbed CO2 was not removed, even by the heating of SAC until the end of the second desorption step (S2). If a significant fraction of 14CO2 is adsorbed to form chemisorbed adsorbates in SAC, a thermal decomposition process should be conducted until reaction step 3 finishes, denoted as S3 in Figures S3 and S4.

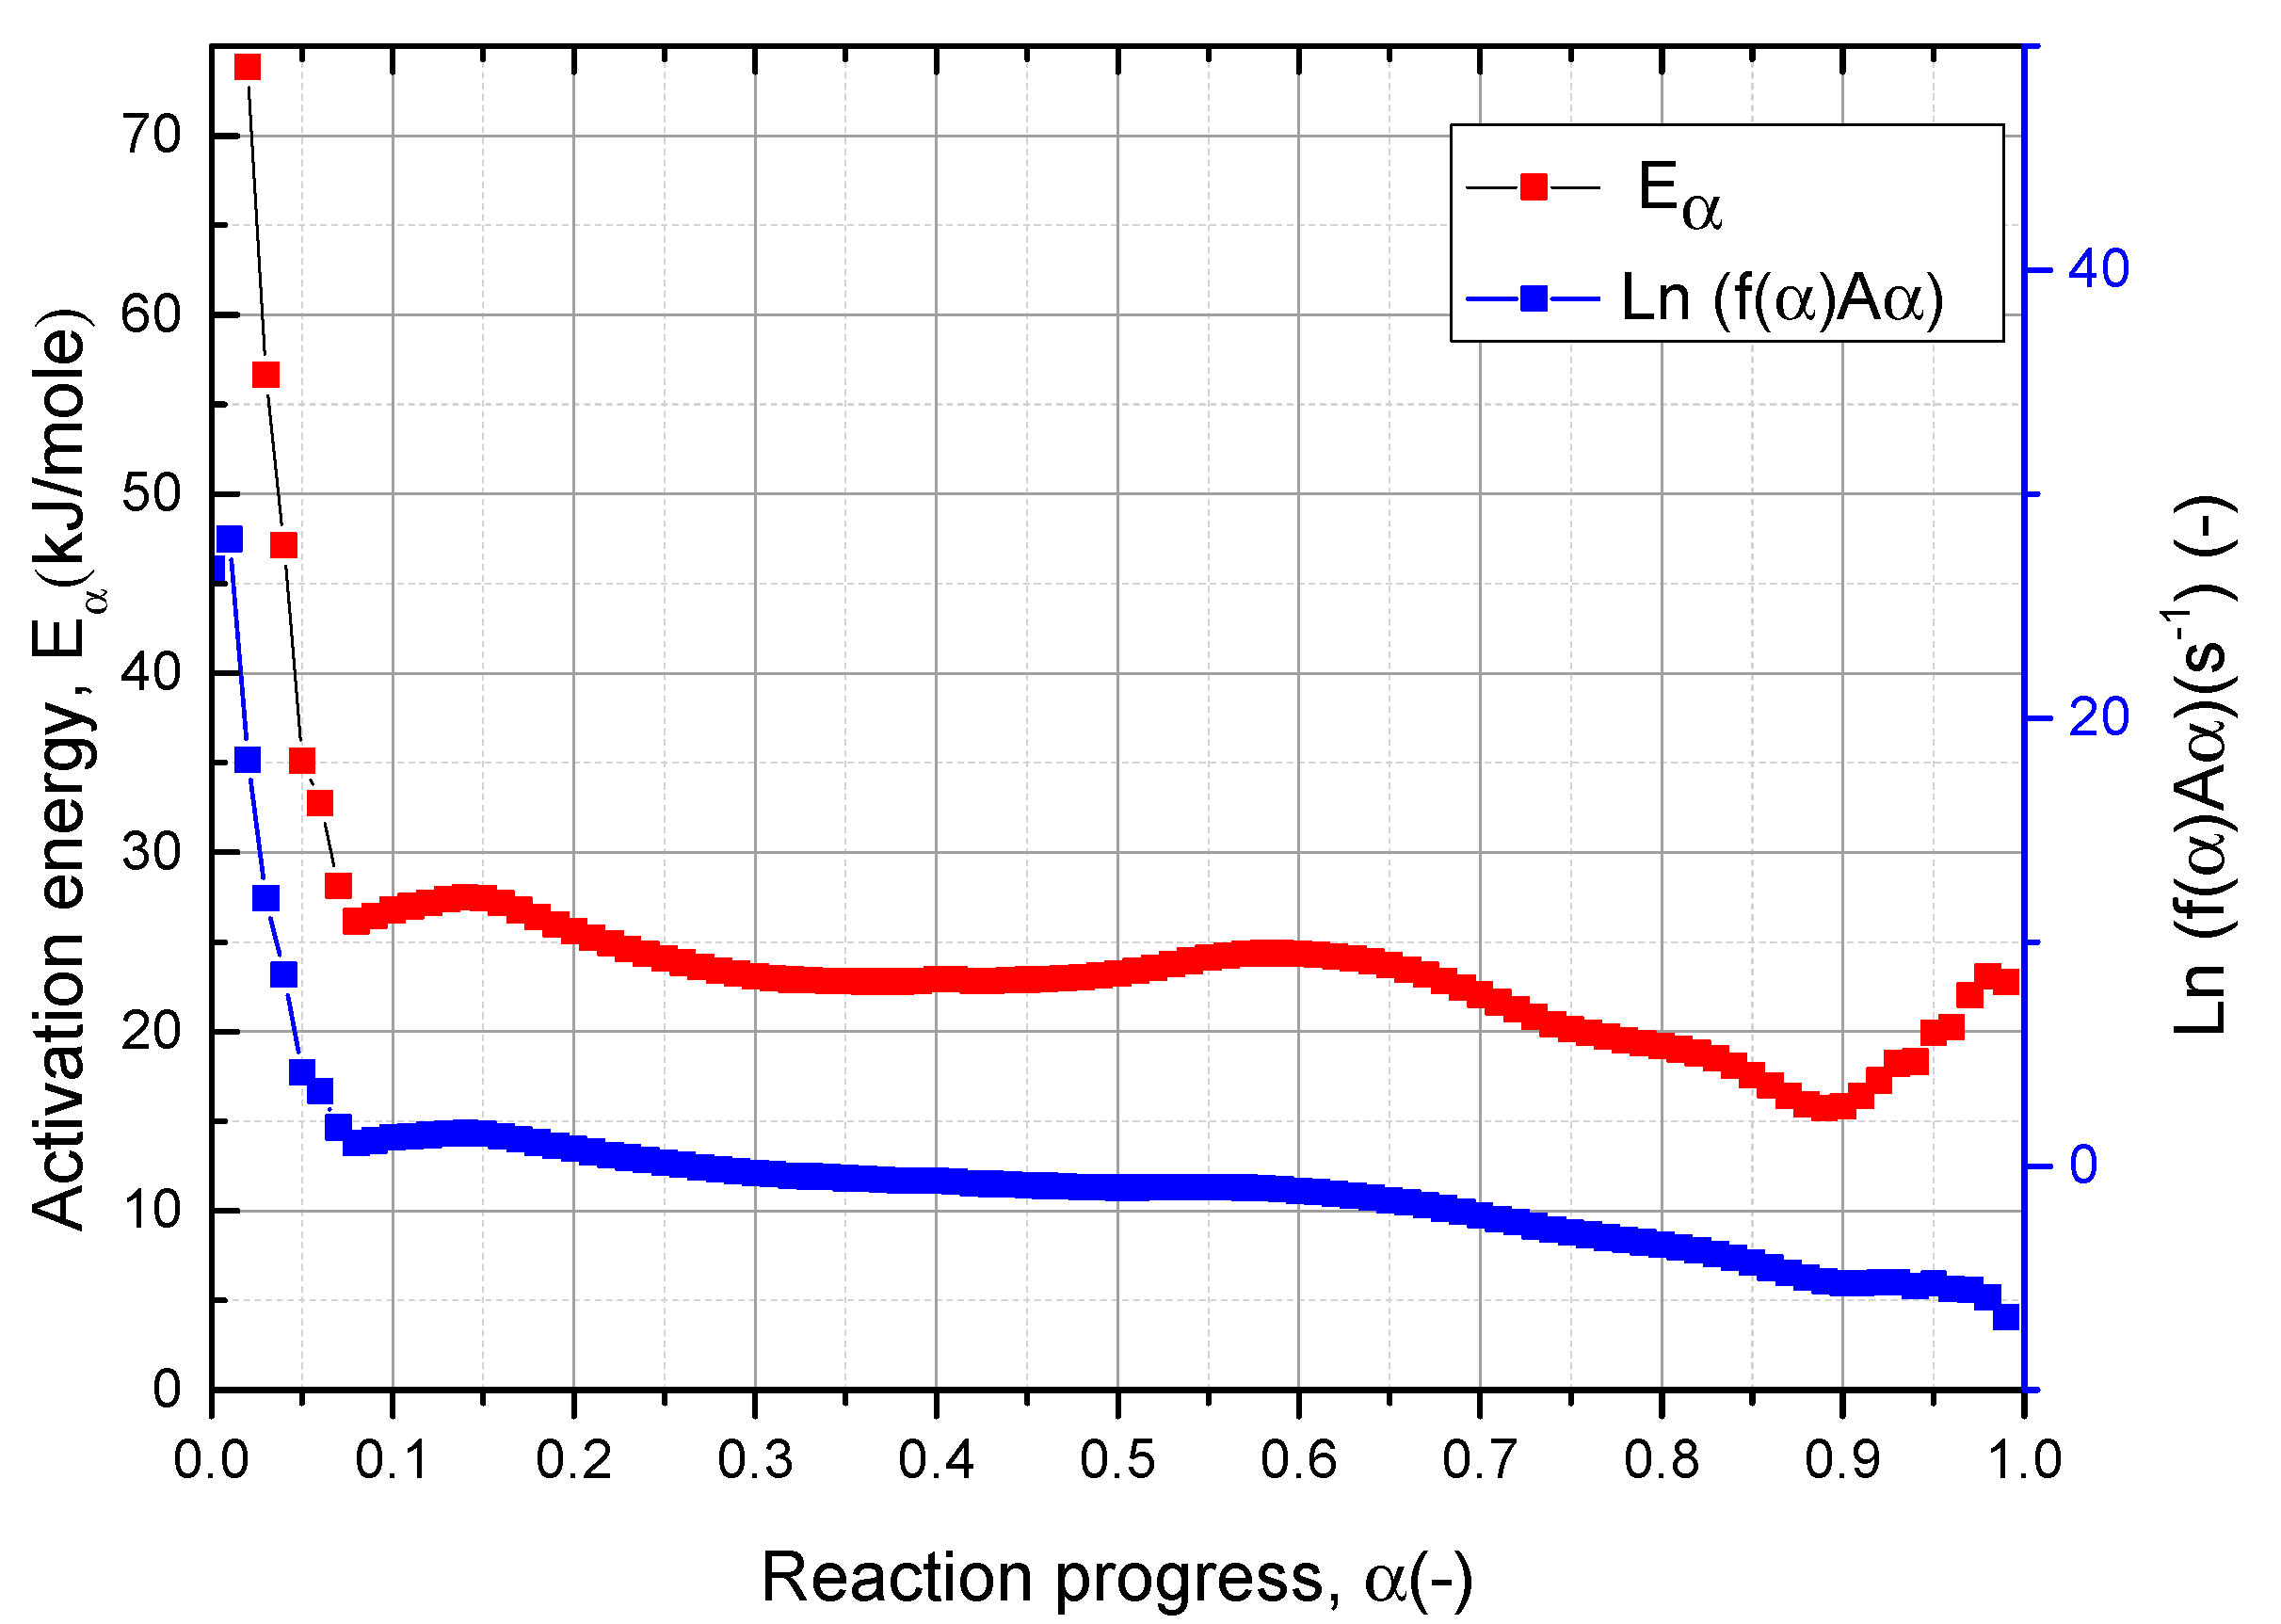
3.3. Kinetic Analysis and Prediction

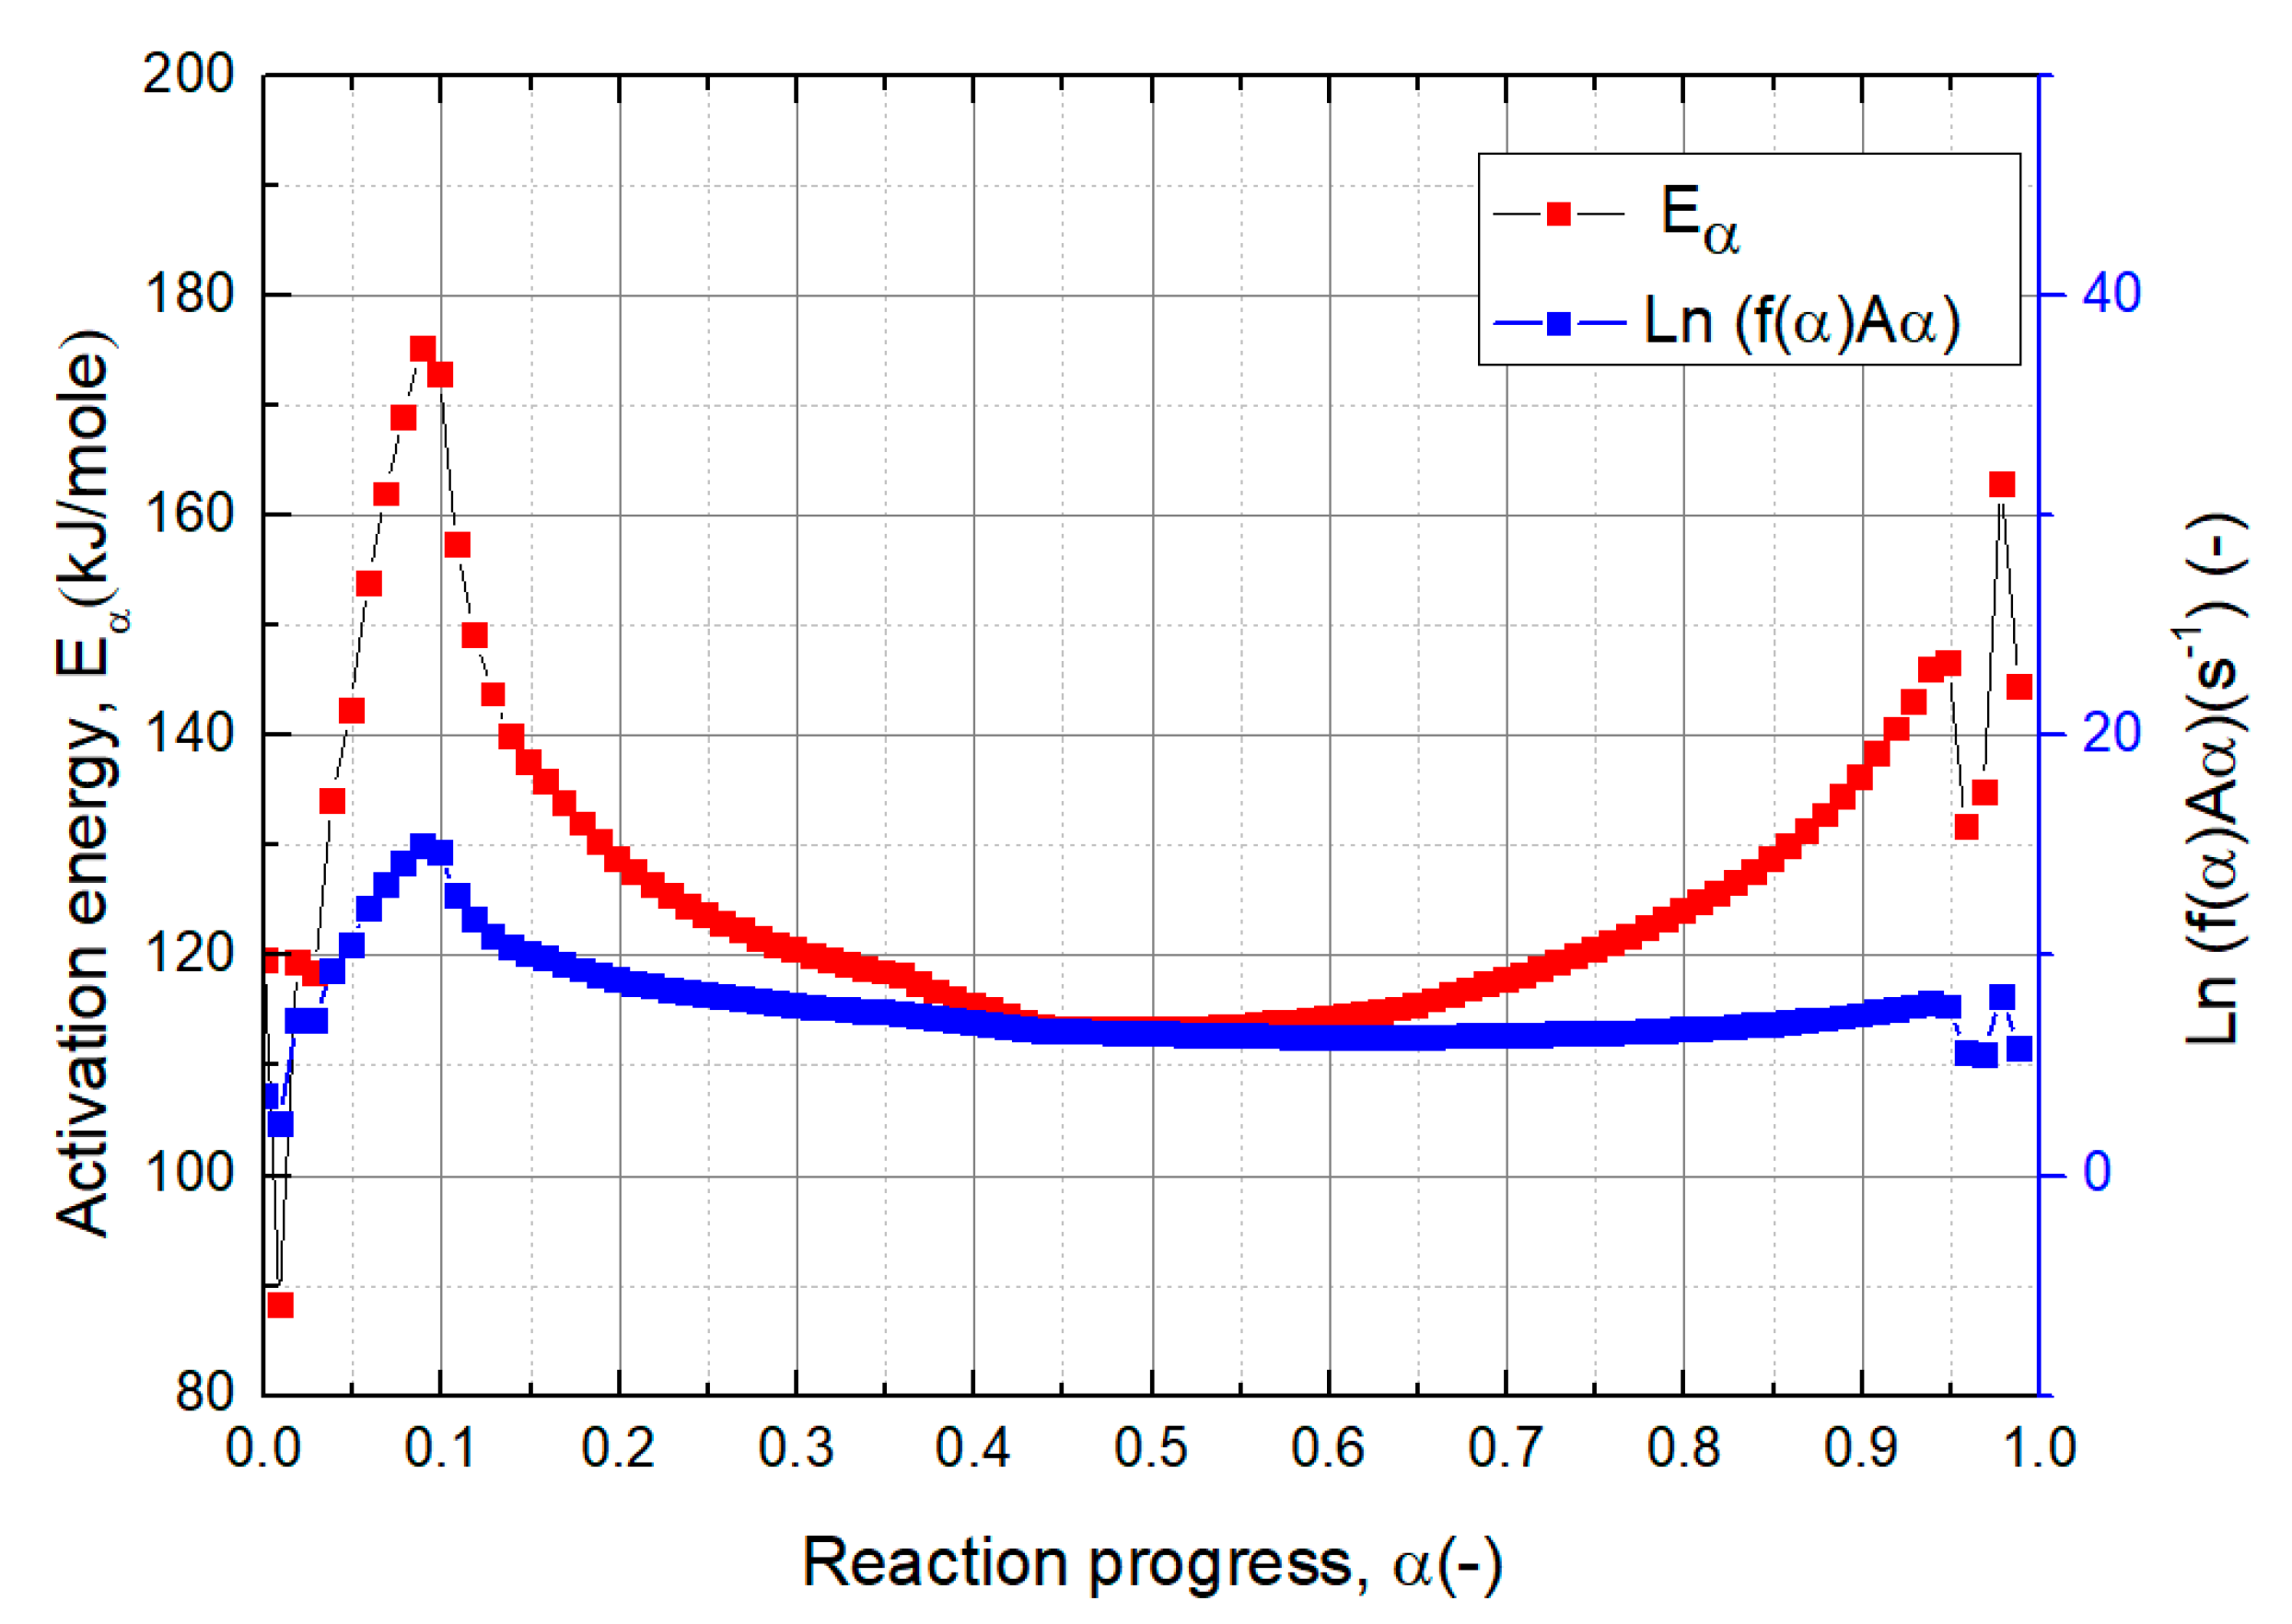
3.3.1. Kinetic Analysis of Vacuum Thermal Desorption Reaction

The progress of all thermal desorption reactions denoted in Figures S3 and S4 should be finished if the goal is completely to remove all adsorbed 14C species in the SAC. The energy and time required for the completion of the desorption reactions can be reduced if a vacuum thermal desorption (VTD) process is used. In addition, VTD can reduce the operating time at an elevated temperature and can thus effectively reduce the fraction of the conversion of 14C species into the pyrocarbon molecules.
A kinetic analysis of VTD for the spent AC was conducted to establish an optimum VTD process condition. The results of nonisothermal TGAs of the spent GAC with four different heating rates under an ultra-vacuum condition are shown in Figure 5. Reaction steps 1 and 2, which were established through the analysis of TGA data under atmospheric pressure conditions and are presented in Figures S3 and S4, were not clearly distinguished in the TG (thermogravimetry) and DTG plots obtained from the vacuum TGA tests. The first and second steps (S1 and S2) significantly overlapped and finished at approximately 250 °C at a heating rate of 1 K/min. This indicated that reaction step 2, the thermal desorption of physically binding molecules attracted to the carbon surface, started before the end of the thermal desorption process of the physisorbed adsorbates, not those binding with the carbon surface but those homogeneously condensed to identical pre-adsorbed molecules. Thermal desorption of chemisorbed adsorbates started after the end of all reactions of physisorbed adsorbates. Thermal desorption of chemisorbed adsorbates under a vacuum condition started at approximately 550 °C in all heating rate conditions. This is approximately the same temperature in the atmospheric pressure condition. This indicates that the vacuum did not significantly enhance the thermal desorption rates of the chemisorbed molecules.
The progress of all thermal desorption reactions denoted in Figures S3 and S4 should be finished if the goal is completely to remove all adsorbed 14C species in the SAC. The energy and time required for the completion of the desorption reactions can be reduced if a vacuum thermal desorption (VTD) process is used. In addition, VTD can reduce the operating time at an elevated temperature and can thus effectively reduce the fraction of the conversion of 14C species into the pyrocarbon molecules. The kinetic analysis in this study was conducted to parameterize the reaction steps in terms of the reaction process, the time and the temperature. Parametrization is accomplished by evaluating the parameters of the Equations that describe the effect of variables on the reaction rates [23,24]. Using Equation (4), the values of the kinetic triplets Eα and f(α)Aα for the desorption of physisorbed adsorbates (Steps 1 and 2) and the decomposition of functional groups bearing chemisorbed adsorbates were determined, as plotted in Figure 6 and Figure 7, respectively [25,26,27]. Regarding the thermal desorption of the physisorbed adsorbates, the value of the activation energy Eα does not significantly vary with the reaction progress α, except for the range of α < 0.05. The values of the activation energy were in the range of 15–30 kJ/mole. The thermal desorption of the chemisorbed adsorbates with high thermal stability, denoted as step 3 (S3) in Figure S4, has much higher values of the activation energy Eα in the range of 113–175 kJ/mole. The activation energy values of the thermal desorption of the chemisorbed molecules varied significantly with the reaction progress α, indicating that various types of thermal decomposition reactions are involved in reaction step 3. This may have resulted from the thermal decomposition of adsorbates bearing various types of functional group on the carbon surface.

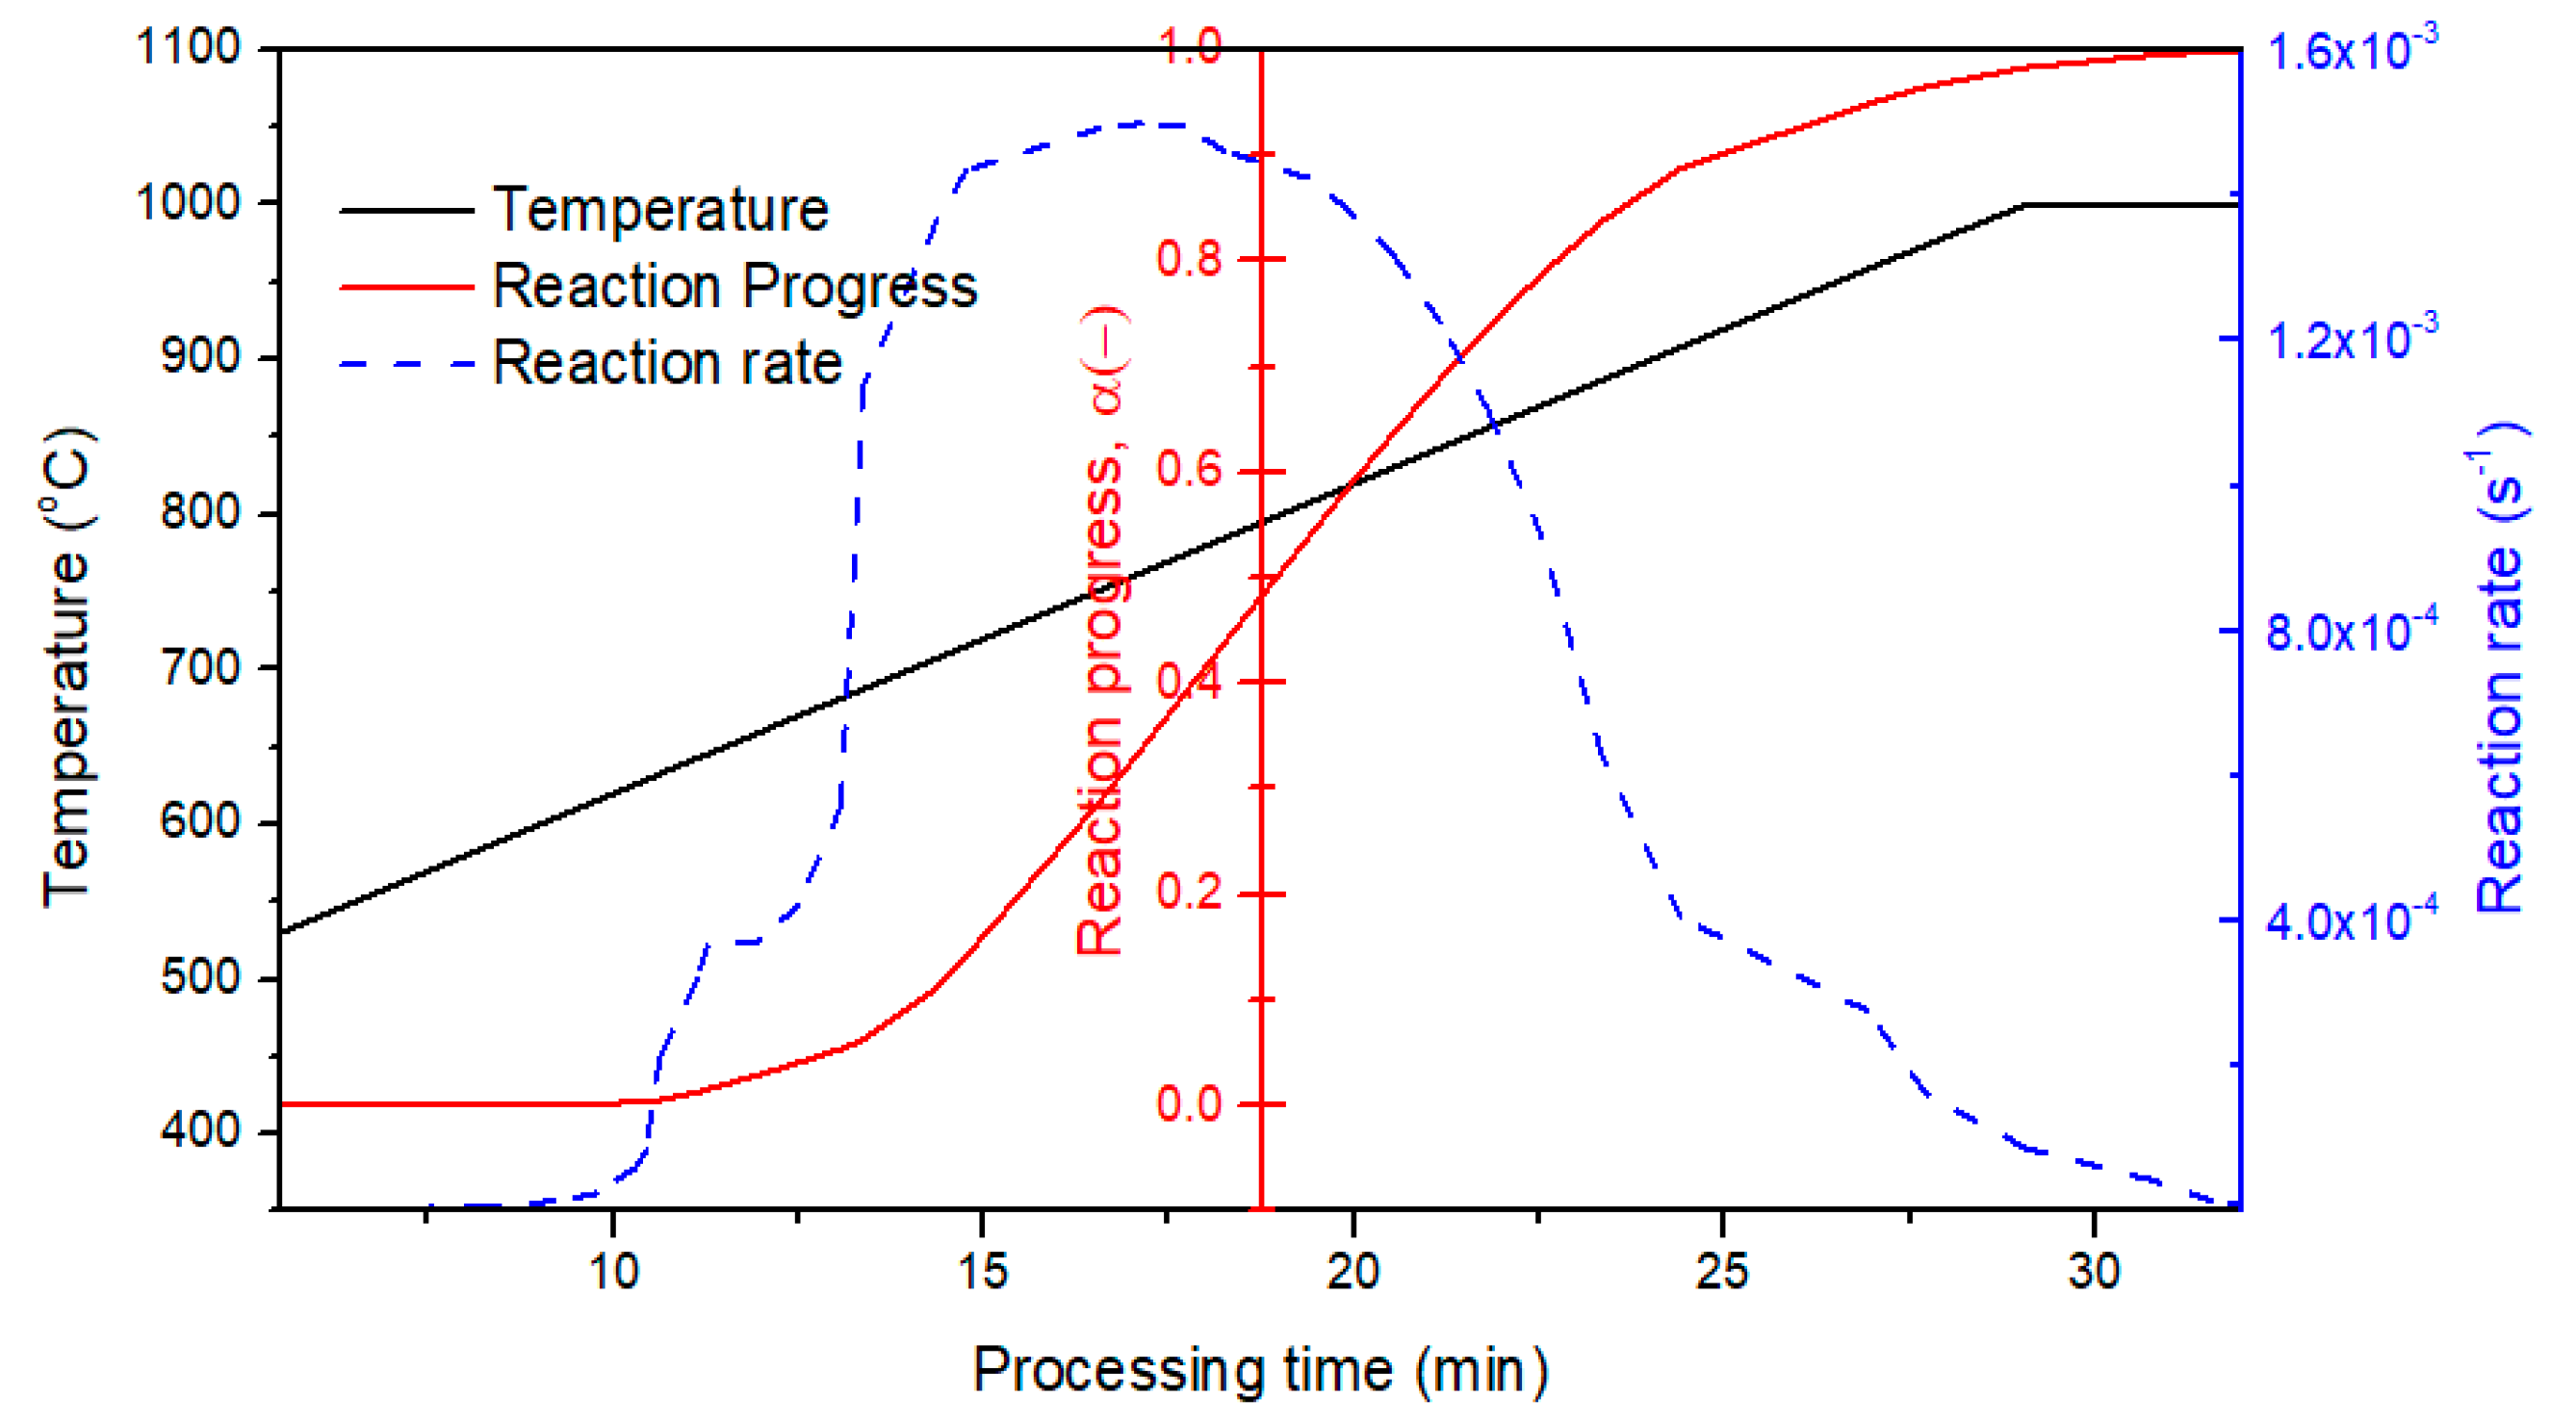
3.3.2. Kinetic Prediction for Vacuum Thermal Desorption Process

As discussed above, some of the adsorbed 14C species exists in the form of chemisorbed adsorbates. The thermal desorption reaction of the chemisorbed adsorbates (step 3) should therefore be completely finished to remove 14C species substantially from SAC. In order to ascertain the VTD condition in relation to this, a kinetic prediction of reaction step 3 was conducted by applying the values of Eα and Aαf(α) to Equation (5) using the software AKTS Thermokinetics [24]. The results of the kinetic prediction determined for the completion of reaction step 3 are shown in Figure 8. If SAC is heated under a vacuum to 1000 °C with a heating rate of 20 K/min and then sustained at 1000 °C for 5 min or longer, desorption step 3 will be completely finished. Because the desorption reactions involved in step 3 start at a temperature exceeding approximately 550 °C, SAC can be heated to 550 °C with the maximum possible heating rate of the vacuum furnace. In this manner, an optimum VTD condition without the consumption of unnecessary energy and time was established in this study.

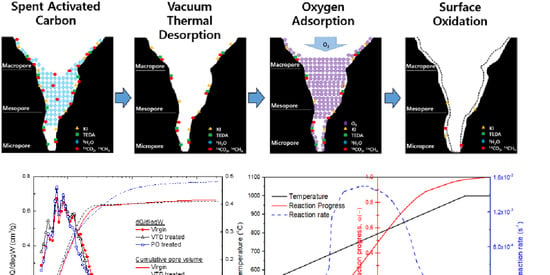
3.4. Trial Treatment of Spent Activated Carbon

3.4.1. Vacuum Thermal Desorption

VTD tests of radioactive spent SAC generated from the air cleaning systems of the nuclear power plants were conducted using a vacuum furnace system. The C-14 radioactivity levels of the two tested spent SAC samples were 162 and 128 Bq/g. SAC samples have a similar range of radioactivity of 3H (approximately 102 Bg/g). The purpose of this study is to reduce the radioactivity levels of 3H and 14C to the free-releasable levels in each case. The free-releasable levels of 3H and 14C are 100 Bq/g and 1Bq/g, respectively. Desorption efficiency of only 90% is enough for 3H, but 99.5% desorption efficiency is required for 14C to convert spent SAC to recyclable SAC. For this reason, this study focused on determining the thermal desorption process conditions for the removal 14C species.
The results of VTD and the partial oxidation of the VTD-treated GAC samples are shown in Figure S4. The VTD conditions established by the kinetic model prediction were tested first. VTD tests at 1000 °C under different conditions were conducted under two vacuum pumping modes: (1) operation of a mechanical pump only (5–10 Pa) and (2) simultaneously operation of a mechanical pump and a diffusion pump (0.3–0.5 Pa). Five GAC samples with two different 14C activity levels were loaded onto alumina crucibles and heated to 1000 °C at a heating rate of 20 K/min, with this level sustained for 30 min. The levels of 3H were greatly reduced by the VTD treatment. The radioactivity of 3H decreased from 373 Bq to 0.65 Bq due to the first VTD treatment, showing a removal efficiency of 99.8%. Tritium species were nearly completely decontaminated by the first VTD test, indicating that all tritium species existed in the form of physisorbed HTO. However, the VTD process of the removal 14C from SAC was not very effective. The levels of 14C decreased to 9.8–17.1 Bq/g after VTD at a pressure level of 5–10 Pa, showing an average removal efficiency of 90.3%. The level of 14C decreased to 2.8–16.8 Bq/g after an additional VTD step at a further reduced pressure of 0.3–0.5 Pa, showing an average removal efficiency of 95.3%. The level of 14C in the spent GAC after the two-step VTD treatments still exceeded the free release criterion of 14C (1 Bq/g) when treating spent GAC samples with 14C activity levels of 162 and 128 Bq/g. This suggested that a small fraction of 14C existed in the form of thermally stable carbon elements in the pyrocarbon structure. A fraction of 14C-capturing functional groups on the carbon surface may be carbonized into molecules forming thermally stable carbon black during the heating of GAC to 1000 °C, even under the condition of rapid heating at 20 K/min and an ultra-vacuum of 0.3–0.5 Pa.

3.4.2. Vacuum Thermal Desorption Followed by Surface Oxidation

Carbon species existing in the form of thermally stable carbon black can be decomposed and gasified in the presence of oxygen. Partial oxidation tests of vacuum-treated GACs were conducted to assess the potential to remove thermally stable 14C species from the vacuum-treated GACs. These results are also shown in Figure S4. After the second VTD treatment, the furnace was cooled under a vacuum condition to 400 °C. Pure oxygen supplied from a canister at 0.5 MPa was continuously fed into the vacuum furnace at 400 °C in order to fill the evacuated pores with oxygen after the VTD treatment. After the pressure of oxygen in the vacuum furnace reached 0.5 MPa (approximately 5 bar), the vacuum furnace was completely closed and heated to 700 °C to oxidize the carbon surface with the O2-filled pores. These partial oxidation results demonstrated the substantial removal of 14C species in the pyrocarbon structural form, irremovable even by a VTD treatment at 1000 °C at 0.3–0.5 Pa. The partial oxidation of the VAC-treated spent GAC was found to be effective for reducing the level of 14C to a level below the established free-release criterion when treating GAC samples with 14C activity of 162 and 128 Bq/g. The 14C removal efficiencies by the partial oxidation after vacuum thermal desorption were in the range of approximately 99.4–99.7%. The results showed an enhanced increase in the 14C removal efficiency when compared to that by microwave-based thermal desorption technology, which showed removal efficiency of 92.56% for 14C [28]. Thermal decontamination progress of spent activated carbon contaminated for a substantial removal of chemisorbed 14C species is schematically depicted in Figure 9.

3.5. Recyclability of Treated Spent Activated Carbon

During the PO treatment, the oxygen which filled the evacuated pores peeled the inner surface of the micropores due to oxidation. This resulted in a slight increase in the total pore volume of AC without a change in the surface area when compared to the virgin AC. The recyclability of spent GACs by VTD followed by surface oxidation was confirmed by the slightly enhanced quality of the porous adsorbents when compared to virgin AC.
VTD followed by a surface oxidation treatment led to the substantial removal of 14C and 3H from spent AC. This technology is now being developed as a thermal desorption process for practical use. However, there are several limitations when applying this technology related to the precision of the analysis of the radioactivity of 14C and 3H in the bulk of spent activated carbon. To increase the potential to use the developed thermal desorption process technology more practically, a proven technology for representative sampling and radioactivity measurements of pure beta emitters such as 3H and 14C in the bulk of spent AC should be developed in advance.

4. Conclusions

Three steps of a desorption reaction of spent activated carbon contaminated with 14C and 3H could be established by observing the desorption rates at elevated temperatures. These were the vaporization of homogeneously condensed molecules, the desorption of molecules physically binding with the carbon surface, and the decomposition of chemisorbed molecules.
Nonisothermal vacuum TGAs and a model-free kinetic analysis of the vacuum thermal desorption reactions were conducted and the results were used to establish the optimum condition for the vacuum thermal desorption of 3H- and 14C-bearing adsorbates from spent activated carbon. The vacuum thermal desorption results at a high temperature of 1000 °C under an ultra-vacuum of 0.3–0.5 Pa demonstrated the complete removal of 3H and 95% removal efficiency for 14C-bearing species. It was found that a fraction of the adsorbed 14C species, which may have been converted to a thermally stable pyrocarbon during the elevation of the temperature, could not be desorbed by vacuum thermal desorption.
Oxidative peeling of the pore surfaces by filling the evacuated pores with pure oxygen via vacuum thermal desorption and heating to 700 °C was found to be effective for reducing the level of 14C to a level below the established free-release criterion (1 Bq/g) when treating spent activated carbon with 14C radioactivity levels of 162 and 128 Bq/g. The thermochemical decontamination treatment process proposed in this study, i.e., vacuum thermal desorption followed by the oxidative peeling of evacuated micropores, does not lower the quality of porous adsorbents; rather, it enhances it slightly. The recyclability of spent GACs by VTD followed by surface oxidation was confirmed by the slightly enhanced quality of the porous adsorbents when compared to virgin activated carbon.

Supplementary Materials

The following are available online at https://www.mdpi.com/2227-9717/8/11/1359/s1, Figure S1. N2 sorption isotherm (a) and BET surface area plot (b) for reference nonporous carbon [7]: Figure S2. BET surface area plots for virgin, VD treated and PO treated GAC samples: Figure S3. Mass change (TG) and derivative of the mass change (DTG) obtained from the TGA of SAC under an inert atmosphere (> 99.999% Ar) with a heating rate of 1 K/min, results of the deconvolution of the DTG plot into five peaks (dotted lines), and a comparison of the DTG (circle) and peak total (solid line): Figure S4. Mass Schematic depiction of the two thermal desorption steps of SAC: S1 (desorption of homogeneously condensed molecules), S2 (desorption of physically binding molecules and decomposition of chemisorbed molecules with low thermal stability) and S3 (decomposition of chemisorbed molecules with high thermal stability): Figure S5. IR spectra of evolved gases from the TG furnace during the thermal desorption of GAC, as shown in Figure 1, and the reference peaks of pure CO2, CH4 and H2O [20,21,22]: Figure S6. Change in the 14C radioactivity of the spent GAC sample after two vacuum thermal desorption tests and that after the partial oxidation of the VTD-treated GAC samples.

Author Contributions

Conceptualization, H.-C.Y.; methodology, H.-C.Y.; software, H.-C.Y.; sample analysis, M.-W.L.; Discussion: H.-C.Y., M.-W.L., H.-C.E. and H.-J.K.; writing and editing, H.-C.Y.; project administration, K.L.; funding acquisition, B.-K.S. All authors have read and agreed to the published version of the manuscript.

Funding

This research was funded by the Ministry of Science, ICT and Future Planning (MSIP) of the Republic of Korea (NRF-2017-M2A8A501514D).

Conflicts of Interest

The authors declare no conflict of interest.

References

  1. Lüth, H. Solid Surfaces, Interfaces, and Thin Films, 5th ed.; Springer: Berlin/Heidelberg, Germany, 2010; pp. 518–520. [Google Scholar]
  2. Zhou, Z.; Hao, S.; Gao, L.; Zhang, Y. Study on adsorption performance of coal based activated carbon to radioactive iodine and stable iodine. Ann. Nucl. Energy 2014, 72, 237–241. [Google Scholar] [CrossRef]
  3. Gourani1, M.; Sadighzadeh, A.; Mizani, F. Effect of impregnating materials in activated carbon on Iodine -131 (131I) removal efficiency. Radiat. Prot. Environ. 2012, 37, 179–183. [Google Scholar]
  4. Kim, S.-H.; Chuang, J.C.; Kelly, P.B.; Clifford, A.J. Carbon isotopes profiles of human whole blood, plasma, red blood cells, urine and feces for biological/biomedical 14C-accelerator mass spectrometry applications. Anal. Chem. 2011, 83, 3312–3318. [Google Scholar] [PubMed] [Green Version]
  5. IAEA. Management of Waste Containing Tritium and Carbon-14; Technical Report Series, No. 421; International Atomic Energy Agency: Vienna, Austria, 2004; pp. 3–4. [Google Scholar]
  6. Kurk, M.; Jaronic, M.; Choma, J. Comparative analysis of simple and advance sorption methods for assessment of microporosity of activated carbons. Carbon 1998, 36, 1447–1458. [Google Scholar]
  7. Silvestre-Albero, A.; Silvestre-Albero, J.; Martı’nez-Escandell, M.; Futamura, R.; Itoh, T.; Kaneko, K.; Rodrı’guez-Reinoso, F. Non-porous reference carbon for N2 (77.4 K) and Ar (87.3 K) adsorption. Carbon 2014, 66, 699–704. [Google Scholar] [CrossRef] [Green Version]
  8. Nakai, K.; Nakada, Y.; Hakuman, M.; Yoshida, M.; Senda, Y.; Tateishi, Y.; Sonoda, J.; Naono, H. High resolution N2 adsorption isotherms at 77.4 K and 87.3 K by carbon blacks and activated carbon fibers—Analysis of porous texture of activated carbon fibers by αs-method. J. Colloid. Interface Sci. 2012, 367, 383–393. [Google Scholar]
  9. Tarazona, P. Free-energy density functional for hard spheres. Phys. Rev. A 1985, 31, 2672–2679. [Google Scholar]
  10. Tarazona, P.; Marconi, P.M.B.; Evans, R. Phase equilibria of fluid interfaces and confined fluids—Non-local versus local density functionals. Mol. Phys. 1987, 60, 573–595. [Google Scholar]
  11. El-Sayed, S.A.; Mostafa, M.E. Pyrolysis characteristics and kinetic parameters determination of biomass fuel powders by differential thermal gravimetric analysis (TGA/DTG). Energ. Convers. Manag. 2014, 85, 165–172. [Google Scholar] [CrossRef]
  12. Cvetanovic, R.J.; Amenomiya, Y. A temperature programmed desorption technique for investigation of practical catalysts. Catal. Rev. Sci. Eng. 1972, 6, 21. [Google Scholar] [CrossRef]
  13. Friedman, H.L. Kinetics of thermal degradation of char-forming plastics from thermogravimetry application to a phenolic plastic. J. Polym. Sci. 1964, 6, 183–195. [Google Scholar] [CrossRef]
  14. Berger, A.H.; Bhown, A.S. Comparing physisorption and chemisorption solid sorbents for use separating CO2 from flue gas using temperature swing adsorption. Energy Procedia 2011, 4, 562–567. [Google Scholar] [CrossRef] [Green Version]
  15. González-García, C.M.; González, J.F.; Román, S. Removal efficiency of radioactive methyl iodide on TEDA-impregnated activated carbons. Fuel Process. Technol. 2011, 92, 247–252. [Google Scholar] [CrossRef]
  16. Mahle, J.J.; Peterson, G.W.; Schindler, B.J.; Smith, P.B.; Rossin, J.A.; Wagner, G.W. Role of TEDA as an Activated Carbon Impregnant for the Removal of Cyanogen Chloride from Air Streams: Synergistic Effect with Cu(II). J. Phys. Chem. C 2010, 114, 20083–20090. [Google Scholar] [CrossRef]
  17. Barkauskas, J.; Dervinyte, M. An investigation of the functional groups on the surface of activated carbons. J. Serb. Chem. Soc. 2004, 69, 363–375. [Google Scholar] [CrossRef]
  18. Liang, X.; Chi, J.; Yang, Z. The influence of the functional group on activated carbon for acetone adsorption property by molecular simulation study. Microporous Mesoporous Mater. 2018, 262, 77–88. [Google Scholar] [CrossRef]
  19. Ryczkowski, J.; Pasieczna, S.; Figueiredo, J.L.; Pereira, M.F.R.; Borowiecki, T. Characterization of activated carbon by FT-IR/PAS and TPD. J. Phys. IV Fr. 2004, 117, 57–63. [Google Scholar] [CrossRef]
  20. NIST Chemistry WebBook. Available online: https://webbook.nist.gov/cgi/cbook.cgi?ID=C124389&Units=SI&Type=IR-SPEC (accessed on 20 February 2020).
  21. NIST Chemistry WebBook. Available online: https://webbook.nist.gov/cgi/cbook.cgi?Formula=CH4&NoIon=on&Units=SI&cIR=on (accessed on 20 February 2020).
  22. NIST Chemistry WebBook. Available online: https://webbook.nist.gov/cgi/cbook.cgi?Formula=H2O&NoIon=on&Units=SI&cIR=on (accessed on 20 February 2020).
  23. Roduit, B.; Borgeat, C.; Berger, B.; Folly, P.; Alonso, B.; Aebischer, J.N.; Stoessel, F. Advanced kinetic tools for the evaluation of decomposition reactions. J. Thermal. Anal. Calorim. 2005, 80, 229–636. [Google Scholar] [CrossRef]
  24. Vyazovkin, S.; Burnham, A.K.; Criado, J.M.; Pérez-Maqueda, L.A.; Popescu, C.; Sbirrazzuoli, N. ICTAC Kinetics Committee recommendations for performing kinetic computations on thermal analysis data. Thermochim. Acta 2011, 520, 1–19. [Google Scholar] [CrossRef]
  25. Saha, B.; Maiti, A.; Ghoshal, A.K. Model-free method for isothermal and non-isothermal decomposition kinetics analysis of PET sample. Thermochim. Acta 2006, 444, 46–52. [Google Scholar] [CrossRef]
  26. Zhang, X.Y.; Chen, M. A comparison of isothermal with nonisothermal drying kinetics of municipal sewage sludge. J. Thermal. Anal. Calorim. 2015, 123, 665–673. [Google Scholar] [CrossRef]
  27. Cruz, G.; Crnkovic, P.M. Investigation into the kinetic behavior of biomass combustion under N2/O2 and CO2/O2 atmospheres. J. Thermal. Anal. Calorim. 2016, 123, 1003–1011. [Google Scholar] [CrossRef]
  28. Park, H.S.; Park, G.L.; Eun, H.C.; Choi, J.H.; Li, G.L.; Ahn, H.J.; Song, K.S. Treatment Method of Spent Air Cleaning Charcoal. Korean Patent 10-1545440, 11 August 2015. [Google Scholar]
Figure 1. High-resolution N2 sorption and desorption isotherms for virgin, vacuum thermal desorption (VTD) treated and partial oxidation (PO) treated granular activated carbon (GAC) samples: (a) linear scale and (b) log scale.
Processes 08 01359 g001
Figure 2. High-resolution αs–plots of N2 at 77.4K for virgin, VTD-treated and PO-treated GAC samples.
Processes 08 01359 g002
Figure 3. Pore volume distribution of virgin, VTD (vacuum thermal desorption) treated and PO (partial oxidation) treated spent GAC samples as a function of the pore diameter estimated by the nonlocal density functional theory (NLDFT) method.
Processes 08 01359 g003
Figure 4. Pore volume distribution of virgin, VTD (vacuum thermal desorption) treated and PO (partial oxidation) treated spent GAC samples as a function of the pore diameter estimated by the NLDFT method.
Processes 08 01359 g004
Figure 5. TG (a) and DTG (b) plots obtained from nonisothermal TGAs of GAC under an ultra-vacuum condition (2 × 10⁻² Pa) with four different heating rates.
Processes 08 01359 g005
Figure 6. Activation energy and modified reaction constant (Aαf(α)) of reaction steps 1 and 2 denoted in Figure 5b as a function of reaction progress α.
Processes 08 01359 g006
Figure 7. Activation energy and modified reaction constant (Aαf(α)) of reaction step 3 denoted in Figure 5b as a function of reaction progress α.
Processes 08 01359 g007
Figure 8. Kinetic prediction activation energy and modified reaction constant (Aαf(α)) of reaction step 3 as a function of reaction progress α.
Processes 08 01359 g008
Figure 9. Mass schematic depiction of the thermal decontamination progress of spent activated carbon for a substantial removal of chemisorbed 14C species.
Processes 08 01359 g009
Table 1. Porous texture of virgin, VTD-treated and PO-treated GAC samples as determined by high-resolution αs-plots (Vmicro, Vmeso, Aext and Amicro) and BET (Brunauer-Emmett-Teller) plot (ABET from Figure S2).
GAC SamplePore Volume (cm3/g, STP)Surface Area (m2/g)
VmicroVmesoAextAmicroABET
Virgin0.4830.0156.11045.11108.4
VTD-treated0.4910.0143.11077.21159.1
PO-treated0.4860.0588.61040.01108.5
Publisher’s Note: MDPI stays neutral with regard to jurisdictional claims in published maps and institutional affiliations.

