Article

Classification, Force Deformation Characteristics and Cooking Kinetics of Common Beans

1
Department of Bioresource Engineering, McGill University, 21111 Lakeshore Road, Sainte-Anne-de-Bellevue, QC H9X 3V9, Canada
2
Department of Biological and Agricultural Engineering, University of Arkansas, 4183 Bell Engineering Center, Fayetteville, AR 72701, USA
*
Author to whom correspondence should be addressed.
Processes 2020, 8(10), 1227; https://doi.org/10.3390/pr8101227
Submission received: 4 September 2020 / Revised: 24 September 2020 / Accepted: 29 September 2020 / Published: 1 October 2020
(This article belongs to the Special Issue Advances in Postharvest Process Systems)

Abstract

:
Post-harvest characteristics of common beans influences its classification, which significantly affects processing time and energy requirements. In this work, ten bean cultivars were classified as either easy-to-cook (ETC) or hard-to-cook (HTC) based on a traditional subjective finger pressing test and a scientific objective hardness test. The hardness study used seed coat rigidity to explain the structural deformation observed during cooking. The result shows that the average hardness of raw dry ETC and HTC beans was 102.4 and 170.8 N, respectively. The maximum seed coat resistance is observed within the first 30 min of cooking regardless of the classification. The results show that a modified three-parameter non-linear regression model could accurately predict the rate of bean softening (R2 = 0.994–0.999 and RMSE = 3.3–14.7%). The influence of bean softeners such as potassium carbonate (K2CO3) and sodium chloride (NaCl) to reduce cooking time was also investigated. The results showed that the addition of K2CO3 to the cooking water significantly reduced the cooking time by up to 50% for ETC and 57% for HTC.

Graphical Abstract

1. Introduction

Common beans are an essential food and export commodity in many regions of the world. They are unique sources of plant protein and energy in the diets of more than 300 million people in parts of East Africa and Latin America. Beans are low in fats and rich in proteins, complex carbohydrates, and micronutrients [1]. Despite the nutritional benefits, the presence of flatulence oligosaccharides, antinutrients, and the hard-to-cook (HTC) behavior reduces its potential global consumption [2]. This HTC phenomenon necessitates cooking beans for long hours and requires very high energy demand. There is evidence that the long cooking time is partly influenced by the properties of the beans, such as seed size, variety, and storage conditions, as well as pre-cooking treatments and cooking methods [3,4,5].
Cooking time is, therefore, an important criterion for evaluating bean cooking quality [6]. Several authors have proposed different theories, including the middle lamella-cation-phytate-phytase theory [7] and the lignification theory [8,9], to explain the hard-to-cook behavior of beans. Several techniques have been deployed to soften beans, reduce the cooking time, and increase consumption. These include soaking [10], ultrasound-assisted hydration [11], salts addition [12], blanching [13], autoclaving, radiation, and extrusion [14,15,16]. Of all these techniques, the most common approach for household bean processing has been soaking. The typical rural community approach has been to soak common beans overnight or to add table salt or potash to the water during the cooking of the beans. There is evidence that depending on the salt added, the cooking time may reduce significantly or take a much longer time. For instance, Njoroge, Kinyanjui [17] found that cooking stored dried beans in deionized and Na2CO3 took 257 and 193 min, respectively. However, they reported that thermally treated beans with CaCl2 did not cook at all within an experimental time of 300 min.
Although beans generally begin to lose their hardness with the onset of cooking and continue until the desired softness is achieved, the force deformation during cooking and impact of the physical parameters with respect to cooking time seems to be missing in the bean cooking narrative. Understanding and optimizing the softening phenomenon through the kinetics of cell wall rigidity and overall structural deformation at different stages during cooking is important. The objectives of this work were, therefore, to (1) classify ten common bean cultivars as either ETC or HTC based on the typical household subjective mechanism and a scientific objective penetration tests and by examining the impact of physical parameters in the classification; (2) examine the bean structure deformation of ETC and HTC during cooking; (3) study the influence of bean softening techniques during cooking of selected ETC and HTC bean cultivars; (4) model the softening behavior of ETC and HTC common beans samples during cooking.

2. Materials and Methods

2.1. Materials

Ten cultivars of common beans cultivated in the Chitipa district of Malawi were used for this work. The bean cultivars included Boma, Mandondo, Sugar, White, Satana, Msiska, Masusu, Kabulangeti, and Magungulu. Before the experiments, the beans were thoroughly cleaned and sorted. All cultivars were from the same farming season and within the same geographical area. The bean samples were part of the lot from the March–April 2018 harvest season. Cooking grade sodium chloride (NaCl) and ACS grade potassium carbonate (K2CO3) were supplied by Fisher Scientific (Fair Lawn, NJ, USA).

2.2. Common Beans Classification

2.2.1. Cooking of Beans

One hundred grams of dry unsoaked beans from each of the ten cultivars were selected for the cooking test. The beans were cooked in 800 mL distilled water in a water bath at 96 °C until fully cooked. At 30 min intervals, randomly selected ten-gram seeds were cooled in an ice bath for 1 min prior to the cookability test. Bean cultivars that were fully cooked within 120 min were classified as ETC. Above 120 min, the beans were considered HTC. The 120 min benchmark mimicked the length of cooking practiced by the bean-growing communities in Malawi.

2.2.2. Subjective Cookability Evaluation

The local subjective cookability test to assess softness is to press the cooked beans between the thumb and the index finger. Like other researchers, this “pinching test” was adopted to determine the beans’ cookability (softening) after 120 min cooking [18,19]. The beans were considered cooked if the cotyledons disintegrated upon pressing.

2.2.3. Objective Cookability Evaluation

An objective cookability test was determined using a TA-HD Plus texture analyzer (Stable Micro Systems Ltd., Surrey, UK). The hardness of the samples was measured by a penetration test and recording the peak of maximum force (hardness) as further described in Section 2.4. For each variety, a predetermined average compression force (3.75 ± 0.88 N) for fully cooked beans was used to differentiate the uncooked and cooked beans. The cookability data generated were used to generate cooking curves for each bean variety.

2.3. Bean Texture Measurement

Following the method described by Gowen, Abu-Ghannam [13], changes in bean hardness (in Newtons) and seed coat rigidity of raw, soaked, and cooked beans were determined as a function of time and temperature using the TA-HD Plus texture analyzer (Stable Micro Systems Ltd., Surrey, UK). At return-to-start (RTS) mode, a 2 mm cylindrical stainless-steel probe (P2) and 50 kg load cell were used to measure the compression force. The selected probe can impact the beans’ tegument, which helps differentiate similar samples [20]. Bean samples were compressed axially to 75% of their original height, applying a crosshead speed of 1.0 mm/s and a pre-test and post-test speed of 1 mm/s [21]. Due to the significant variation of individual bean hardness, ten-gram bean seeds were chosen to represent each treatment. For consistency, the orientation of the seeds on the texture analyzer platform was kept uniform. The seed coat rigidity was determined as the distance the probe traveled before penetrating the cotyledon.

2.4. Bean Softening Experiments

2.4.1. Soaking

The procedure described by Shafaei, Masoumi [22] was adopted for the soaking of representative bean cultivars. Ten grams of randomly selected seeds of three cultivars representing ETC (Masusu), intermediate (Magungulu), and HTC (Msiska) were used. The seeds were soaked in 50 mL of distilled water at room temperature for 10 h. Preliminary experiments showed that the time for equilibrium water absorption in all cultivars was 8–10 h. The soaking experiments were conducted in triplicates. The water absorption capacity was evaluated using Equation (1) [22,23].
W a = W f W i W i × 100
where W a is the water absorption (d.b.%), W f is the final weight of seeds after soaking (g), and W i is the initial weight of seeds prior to soaking (g).

2.4.2. Cooking in Salt

For each cooking test, one hundred gram dry unsoaked seeds of Masusu, Magungulu, and Msiska) were separately cooked in 800 mL of 5% table salt (NaCl) or potash based (K2CO3) salt solution. NaCl and K2CO3 are commonly used for cooking and softening, respectively, in the local communities. The control bean samples were cooked in distilled water only. All the cooking was done in a water bath at 96 °C until the beans were fully cooked. At 30 min intervals, ten-gram seeds were randomly selected and cooled in an ice bath for 1 min prior to the texture evaluation. The beans were considered cooked when the predetermined cooked bean softness for a cultivar was reached.

2.5. Statistical Analysis

The parameters of the proximate composition analysis were stated as means ± SD (standard deviation, n = 3). The results were statistically analyzed by analysis of variance (ANOVA), and the means were compared using Tukey-Kramer HSD (α = 0.05) on JMP software.

2.6. Kinetics of Bean Softening

The rate of bean softening was determined using a 3-parameter non-linear exponential regression model shown in Equation (2). The 3-parameter model is a modified version of those used by [2,13,24].
F = F e + F d exp K F t
where F and F e represent the force (N) at a given cooking time (min) and the equilibrium force during cooking, respectively. F d is the differential softening, representing the total degree of softening over the cooking period (i.e., the difference between the initial and final force), and F d represents the rate constant of bean softening.
For simplicity, the experimental data were refitted to a simplified 2-parameter non-linear exponential regression model as shown in Equation (3). The force at any given time is defined in terms of only the initial force prior to cooking, K F , and the cooking time, t .
F = F o exp K F t

3. Results and Discussion

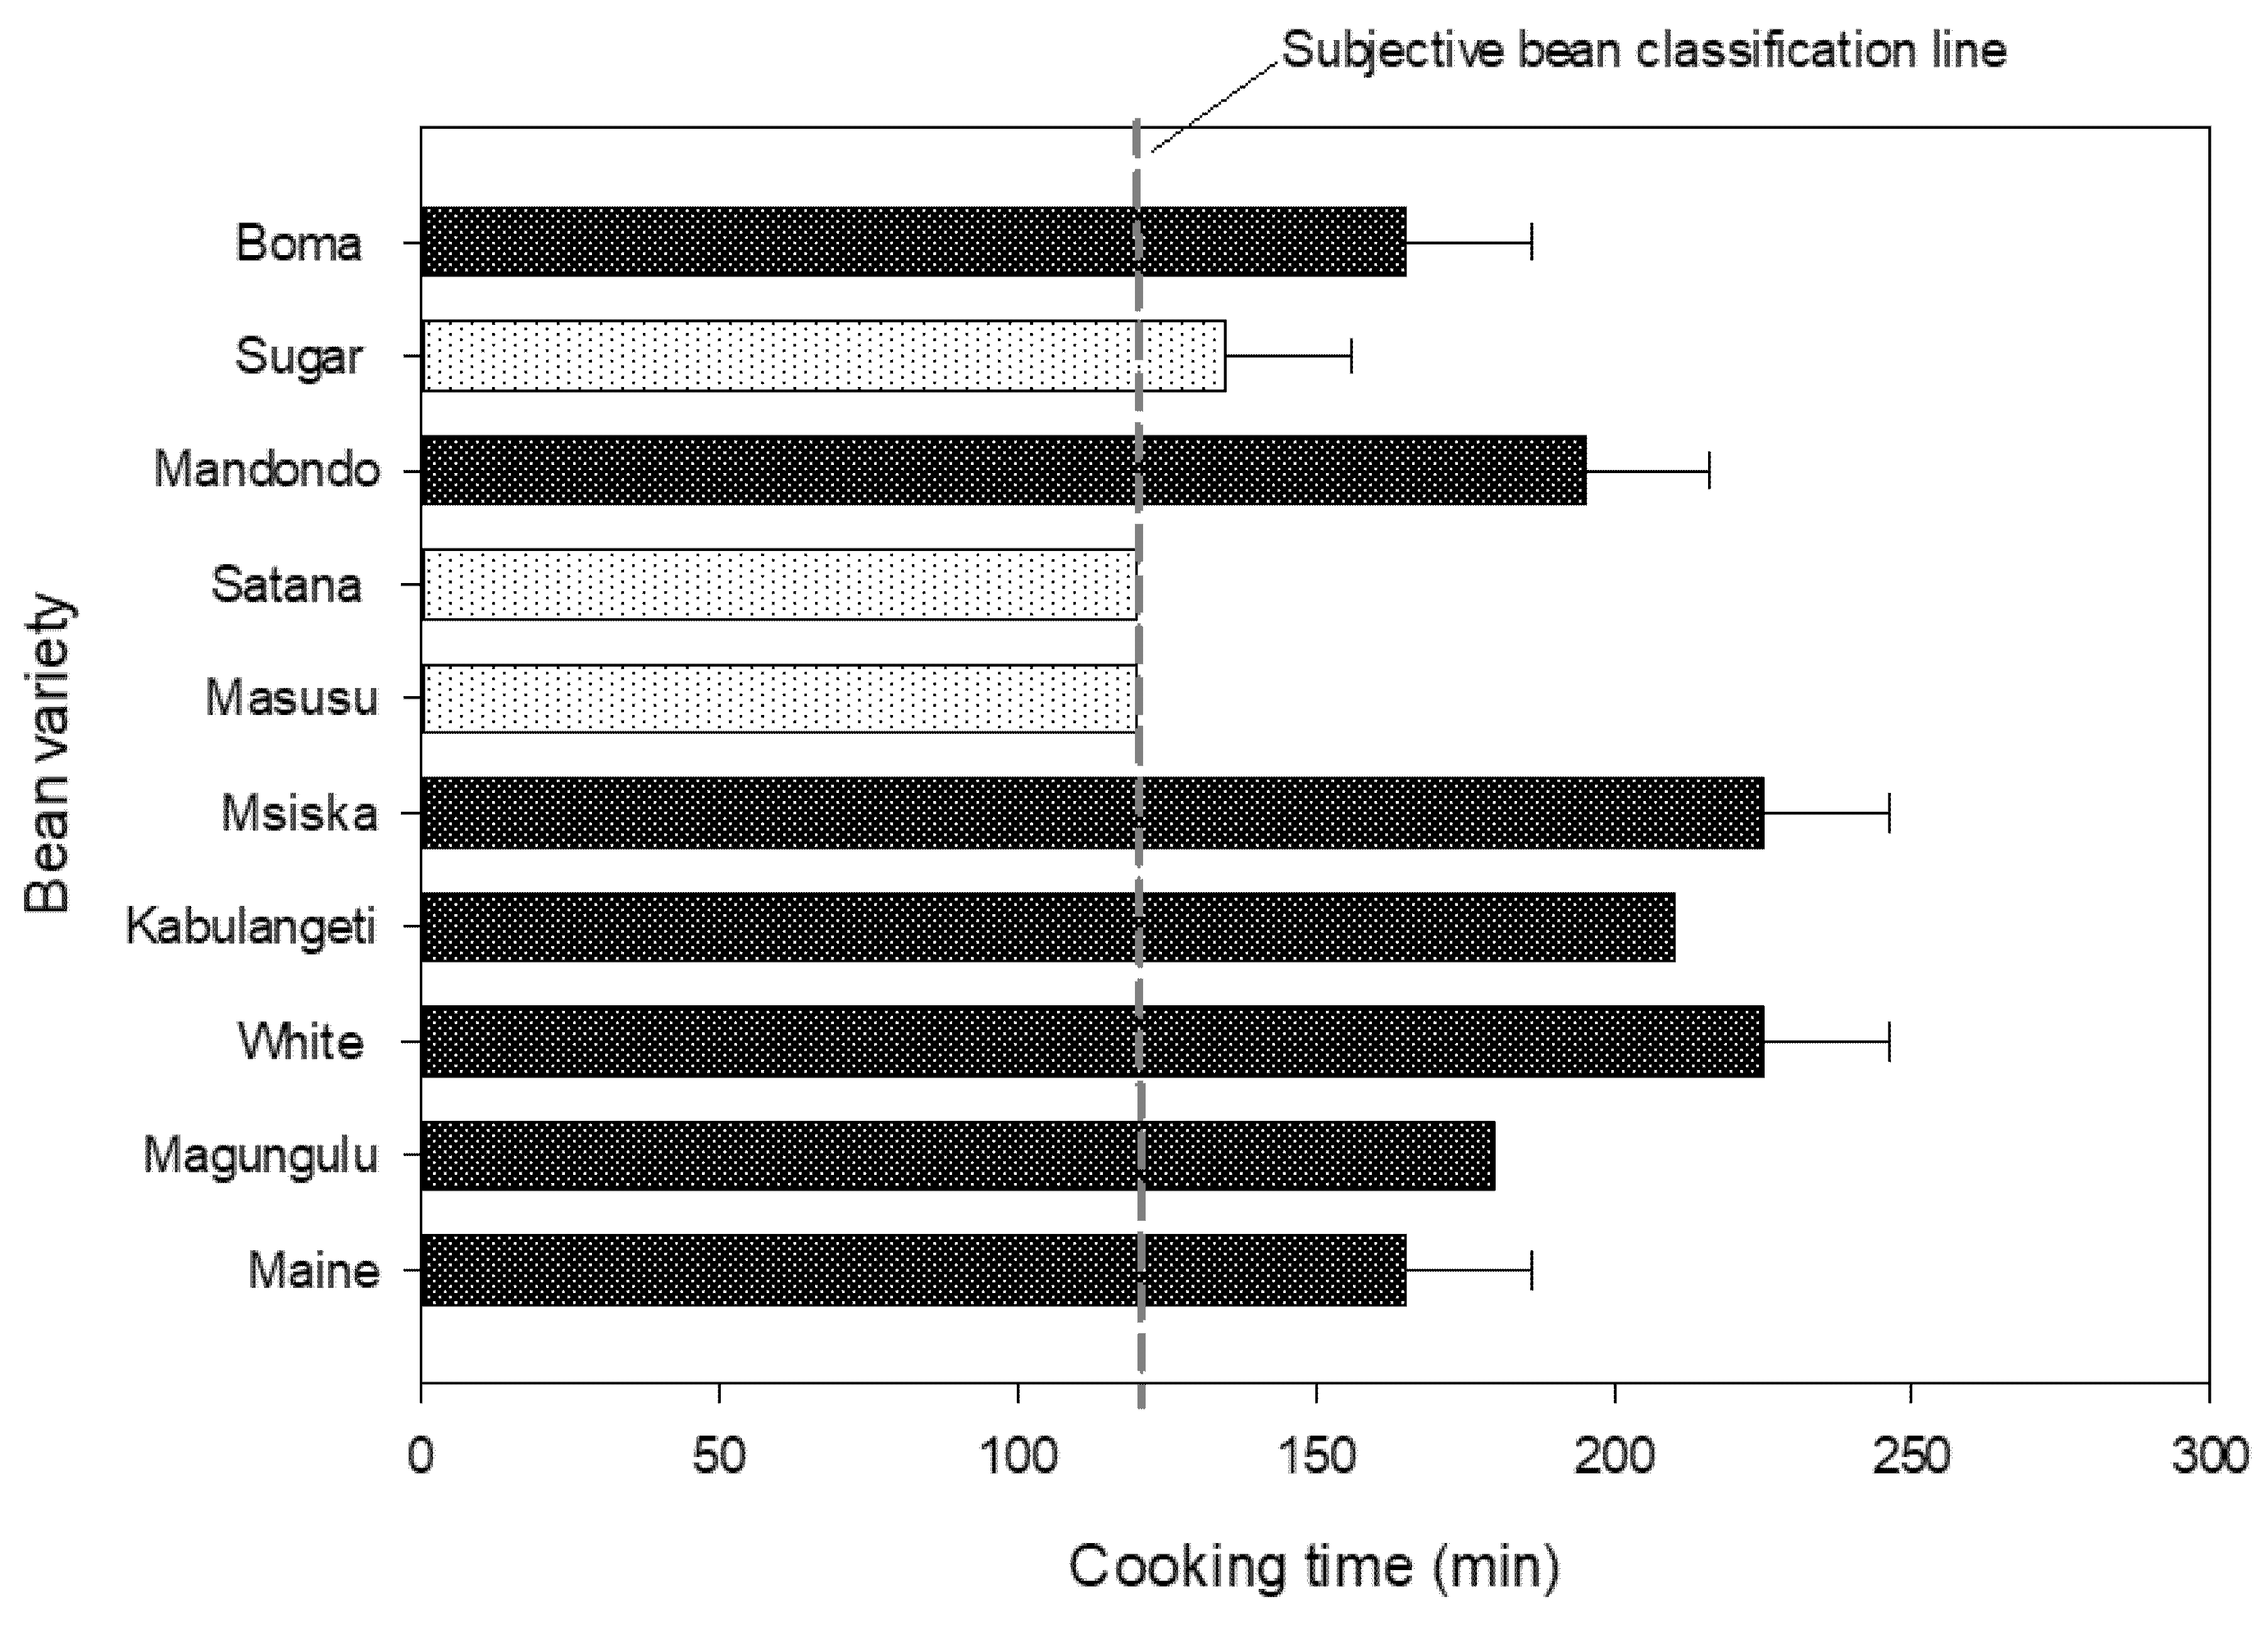
3.1. Bean Classification

The result of the subjective finger-pressing test is shown in Figure 1. The results showed that without any softening technique employed, cooking of common beans will take 2–4 h, depending on the cultivar. Using the locally accepted cooking time classifier of two hours (designated as “subjective bean classification line” in Figure 1), the bean varieties were classified as either easy-to-cook beans (ETC) or as hard-to-cook (HTC). The plot shows that Masusu, Satana, and Sugar beans could be classified as ETC. These results confirmed what the communities had known for years. These varieties sell quickly in the communities because they are cooked in a relatively shorter time and required less fuel. Other cultivars, including Maine, Magungulu, White, Kabulangeti, Mandondo, Boma, and Msiska beans, classified as hard-to-cook (HTC), take up to 4 h to be fully cooked.
The cooking profile of the common beans by the objective compression test showed that the maximum force showed similar categorization as the pinching test classifying Masusu, Satana, and Sugar beans as ETC (Figure 2a) and the other cultivars as HTC (Figure 2b). The average hardness of raw dry ETC and HTC beans was 102.4 and 170.8 N, respectively. Reduction in hardness was observed in the first 30 min of cooking for all the cultivars. In the ETC cultivars, the average hardness reduction was 77%, while 87% was recorded for the HTC cultivars. Nevertheless, the ETC reached their cooking texture much faster. Among the HTC cultivars, White and Msiska cultivars took the longest time to cook. This may not be unexpected as their average hardness in the dry unsoaked state was 36–47% higher than all the ETC beans. When compared to the other HTC cultivars, the average hardness was 16–36%. This can be attributed to the inherent seed characteristics such as cell wall structure, seed composition, and compactness of cells in the seeds [25,26].
Based on the physical parameters, it is expected that Boma and Magungulu cultivars with the higher equivalent diameter and seed volume would have a higher rate of water absorption and cook faster compared to the other beans. However, these physical properties had no significant impact on their softening characteristics. This may be due to the high temperature of cooking water. High temperature tends to diminish the influence of chemical composition, pore structure, and physical properties on water absorption and by extension textural deformation [27]. This result implies that in communities where the cost of energy (especially firewood) for domestic thermal applications is high, preference would be given to ETC rather than the HTC cultivars.

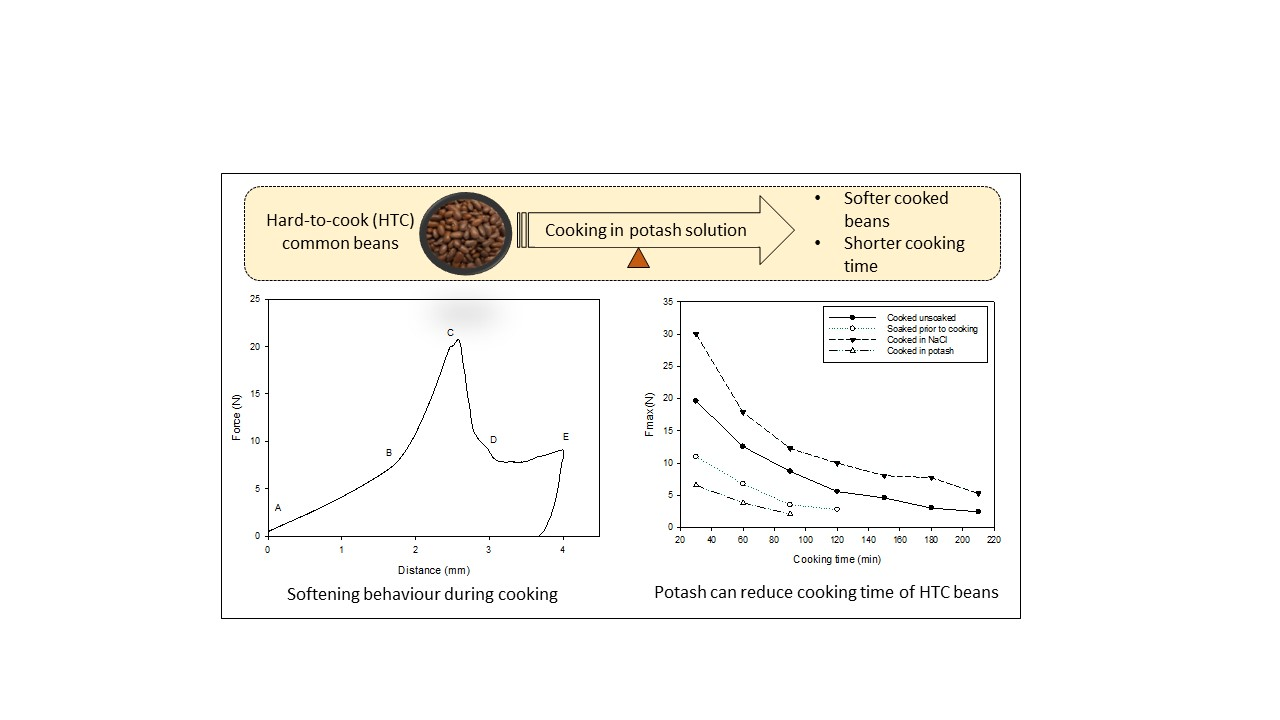
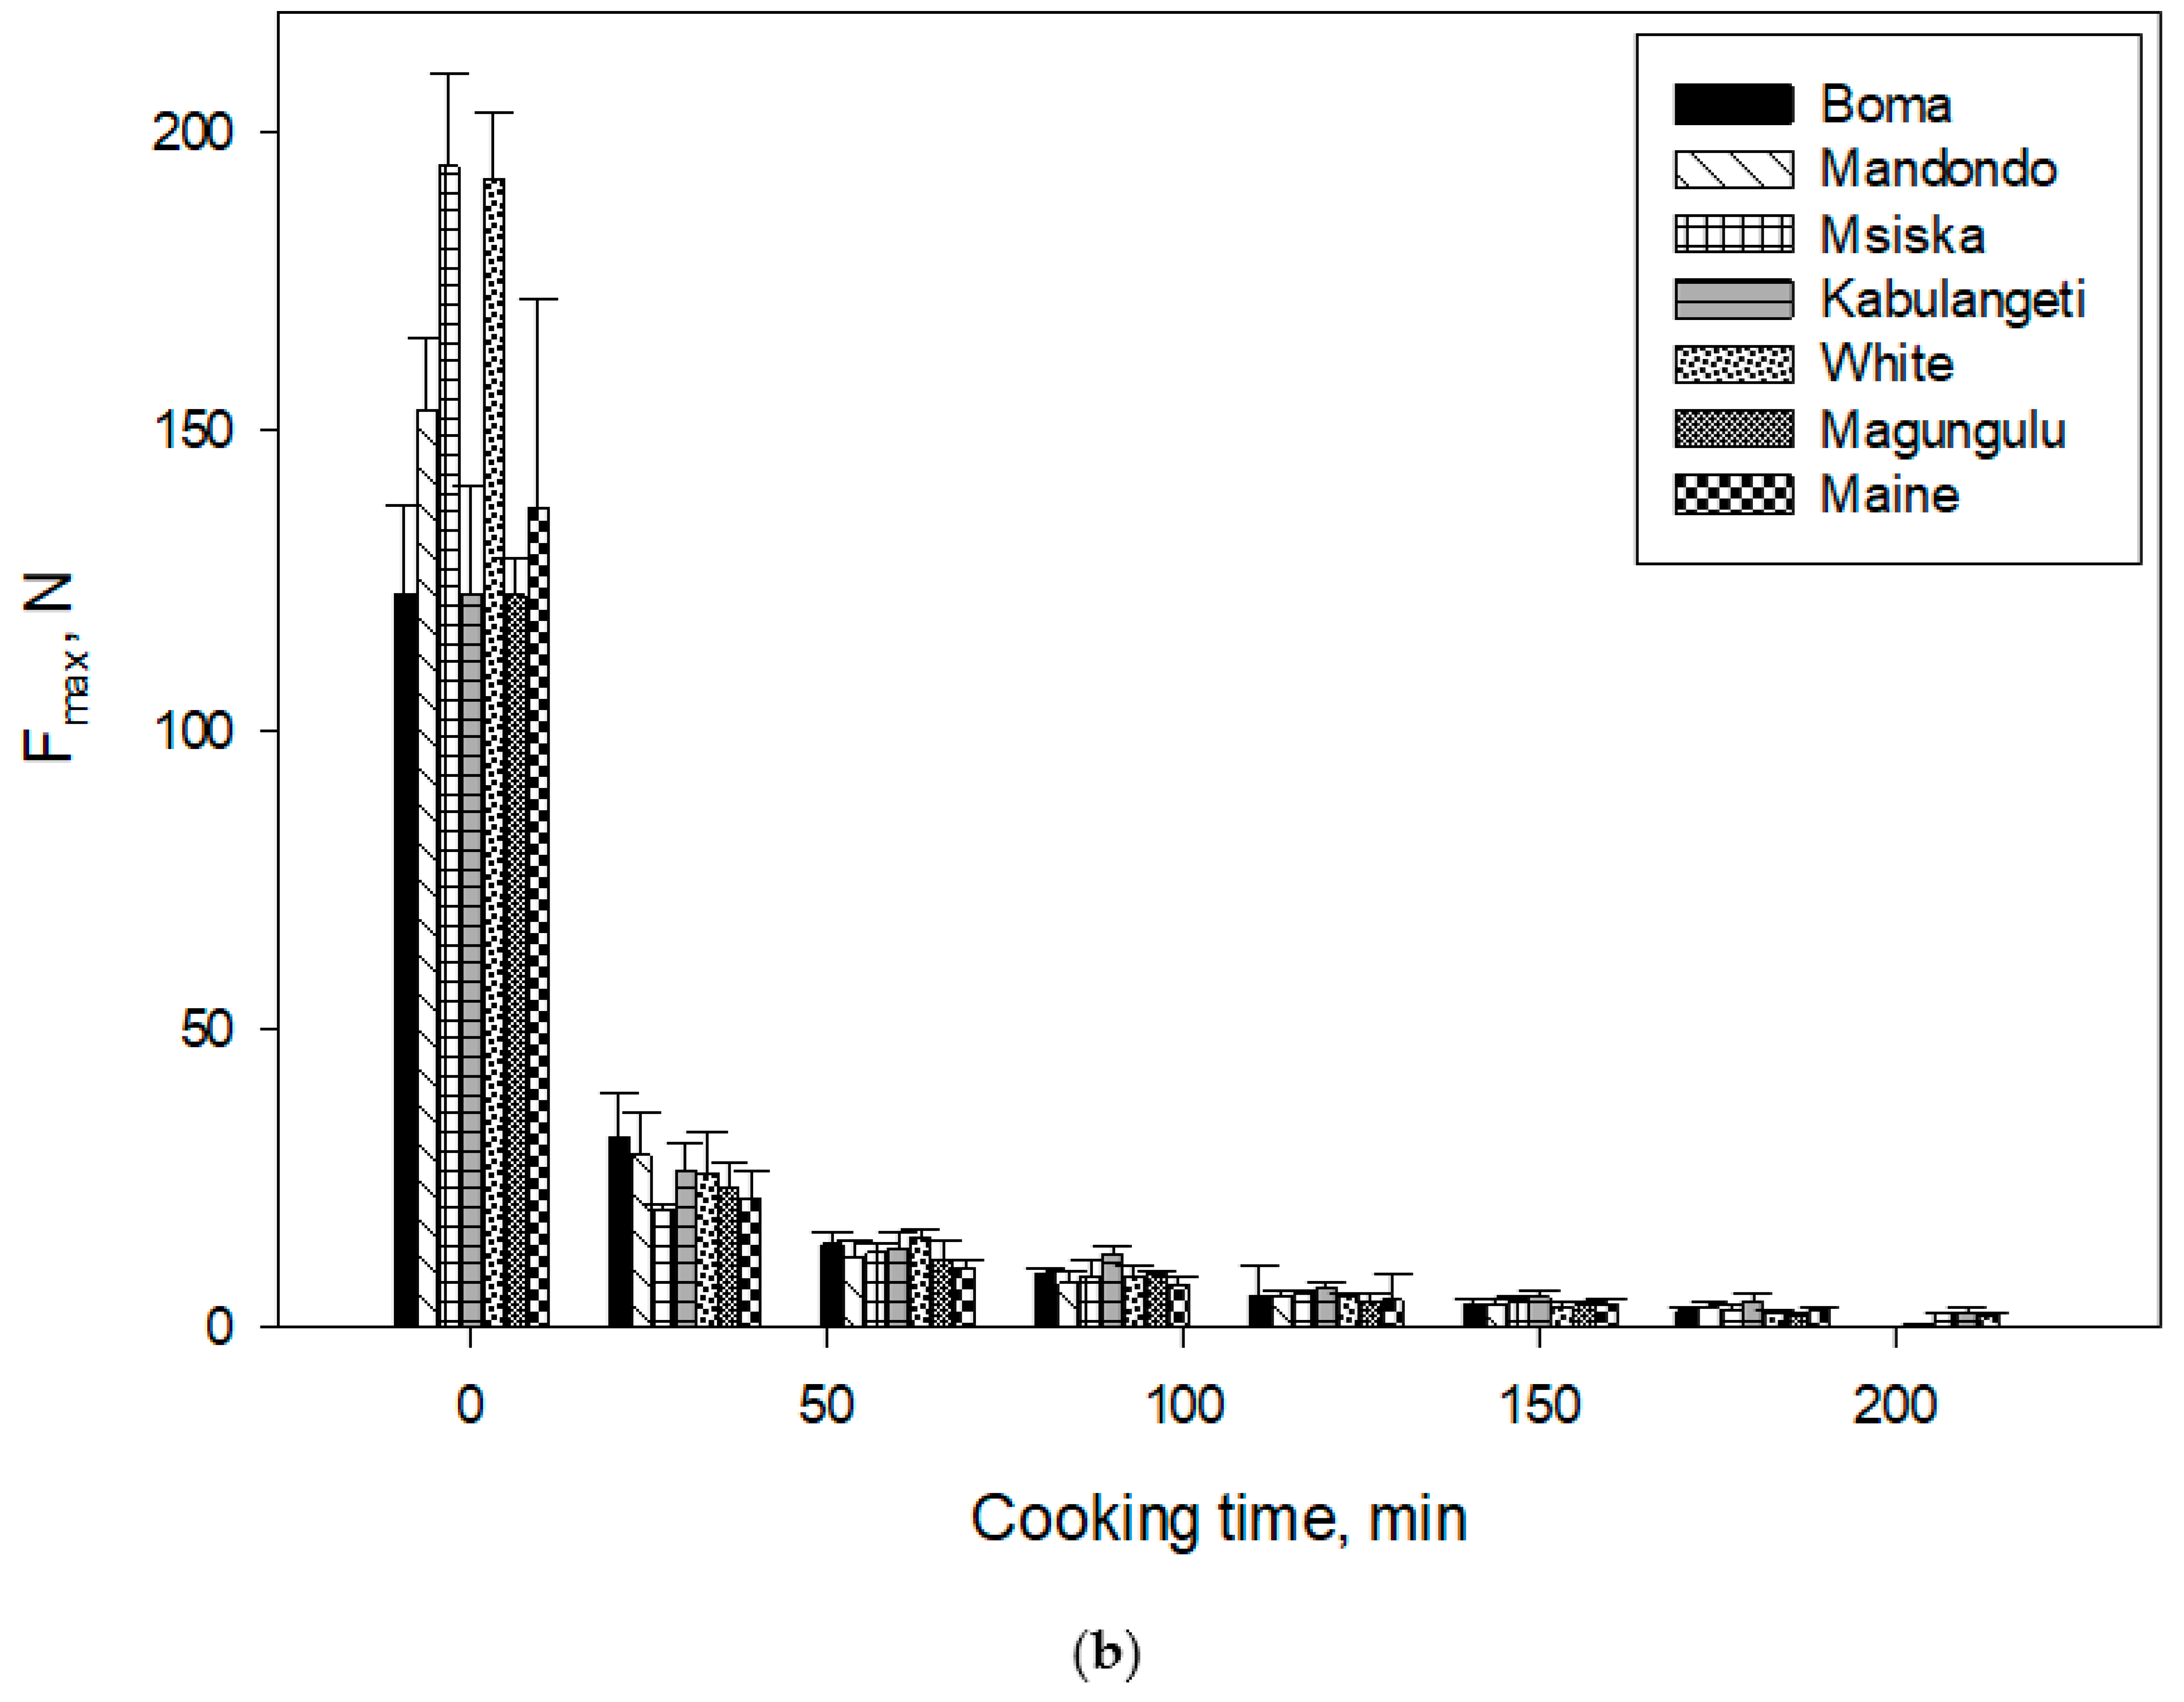
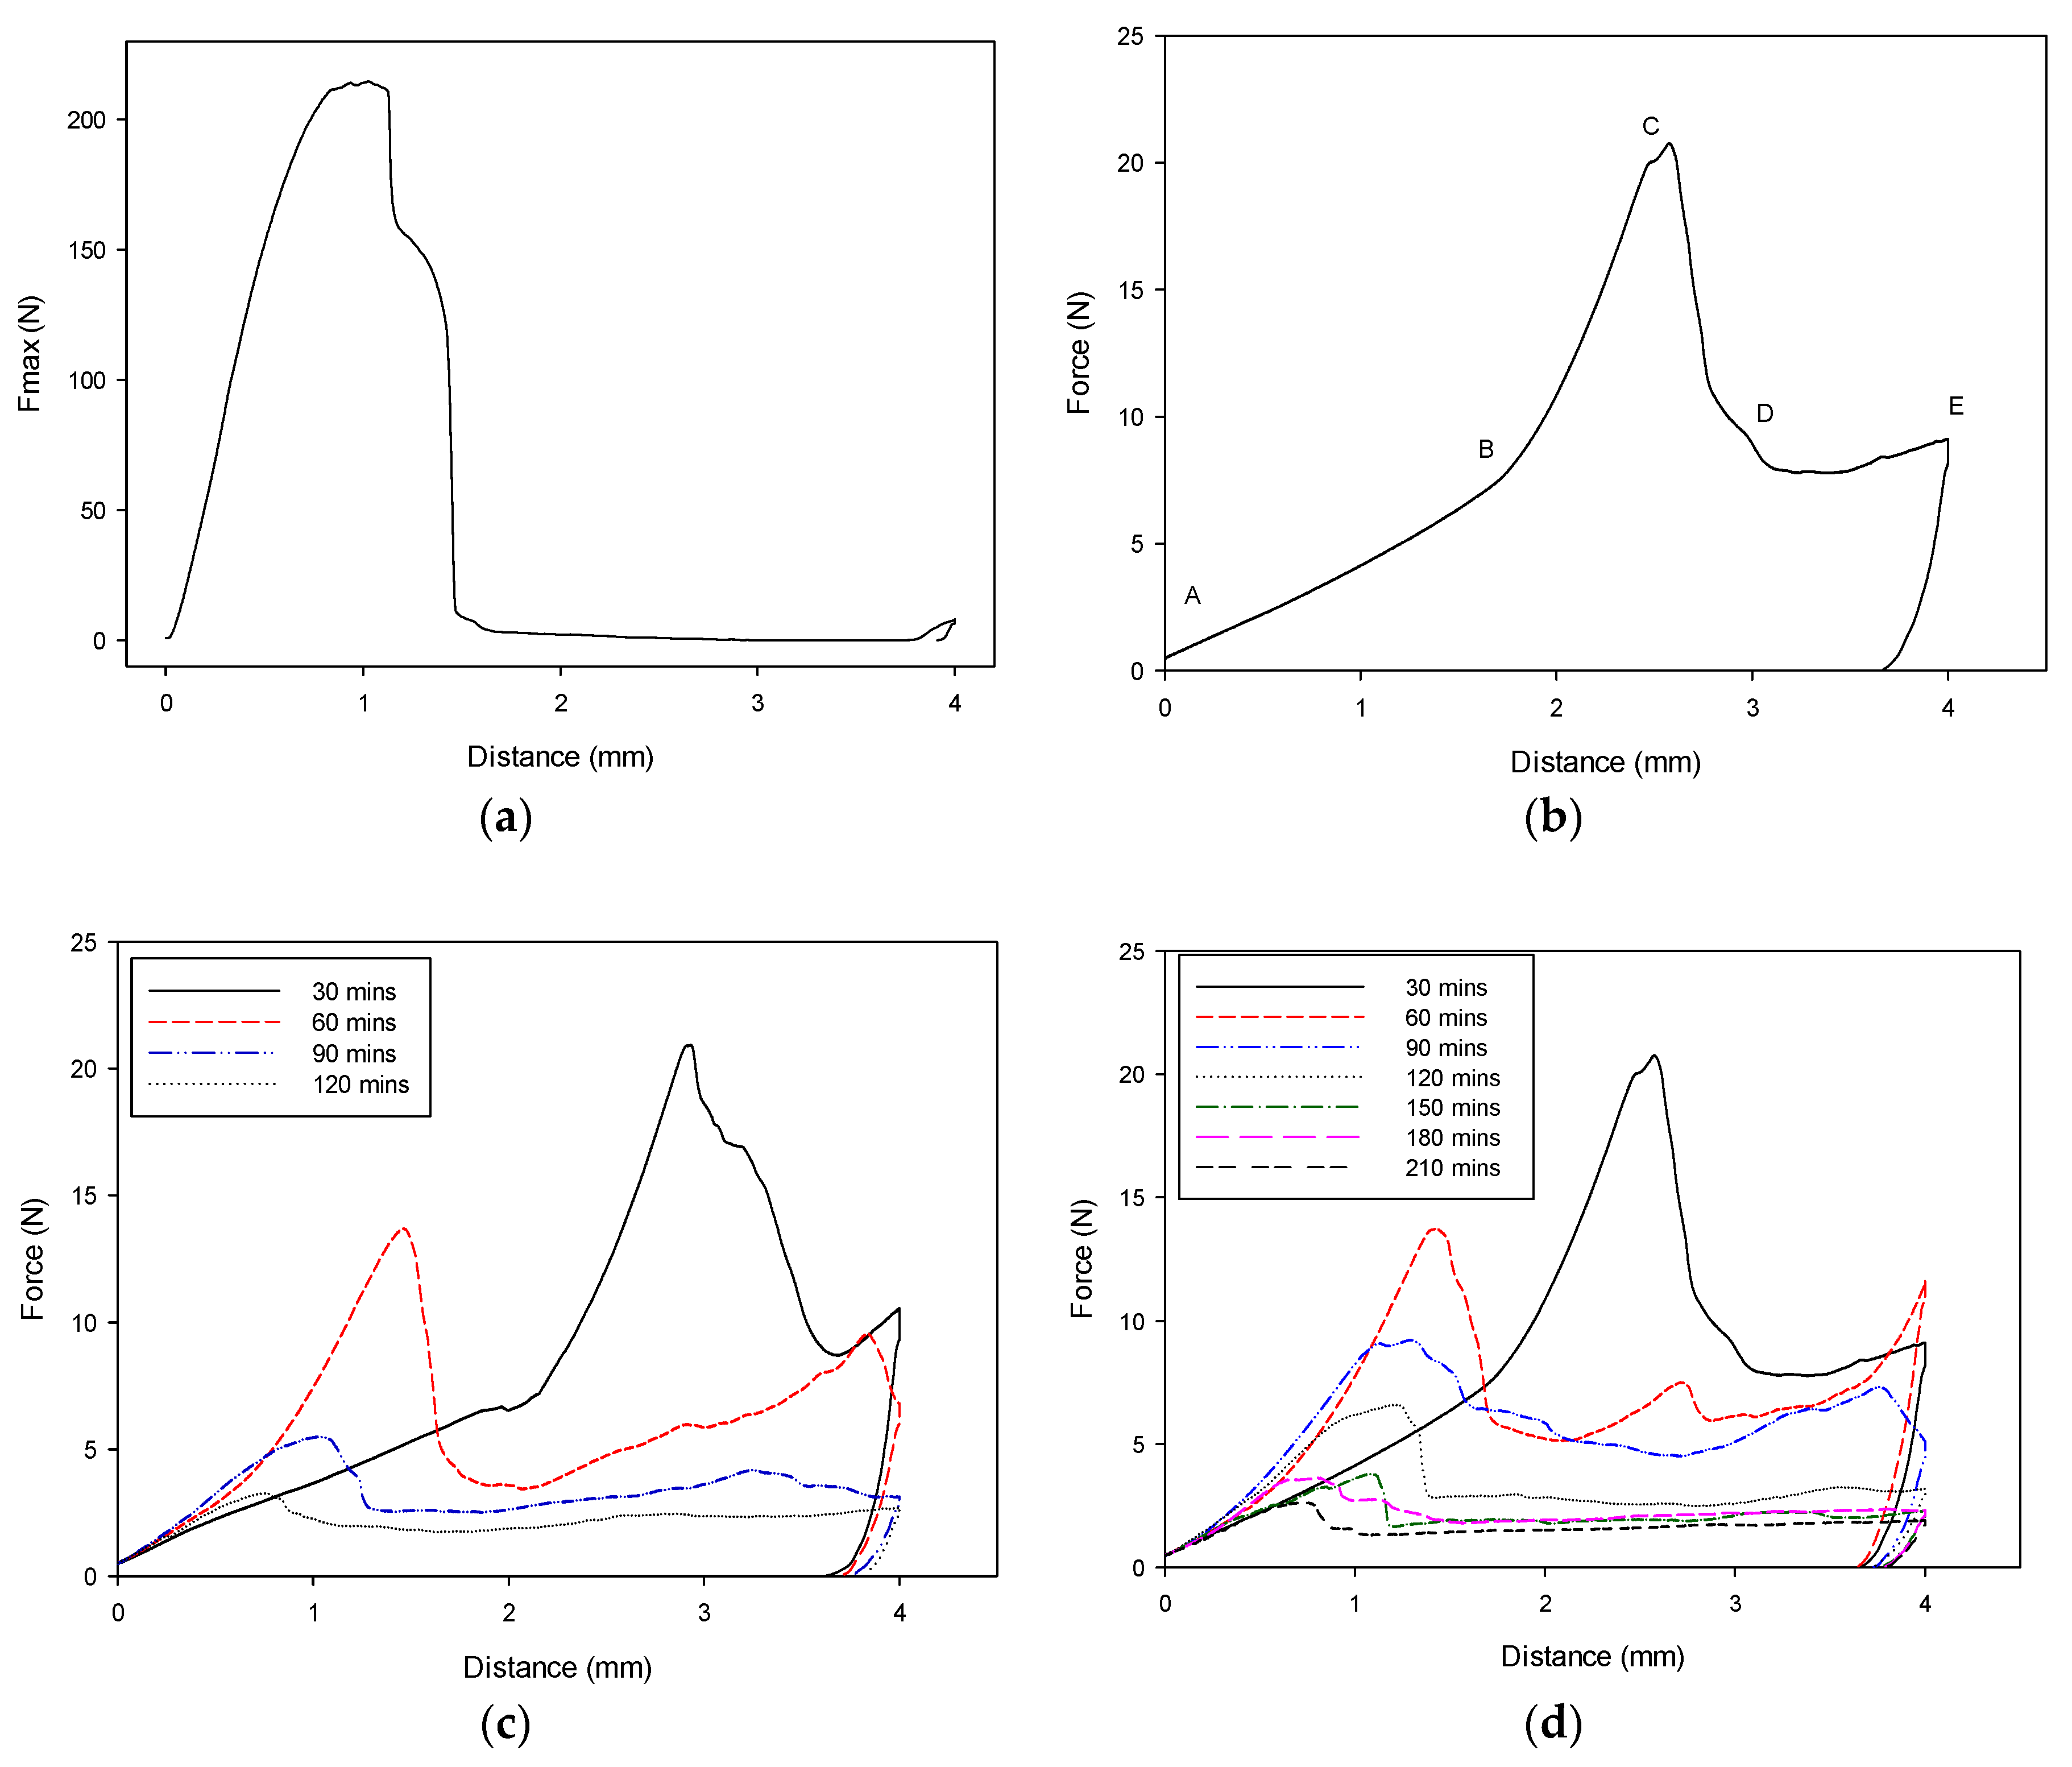
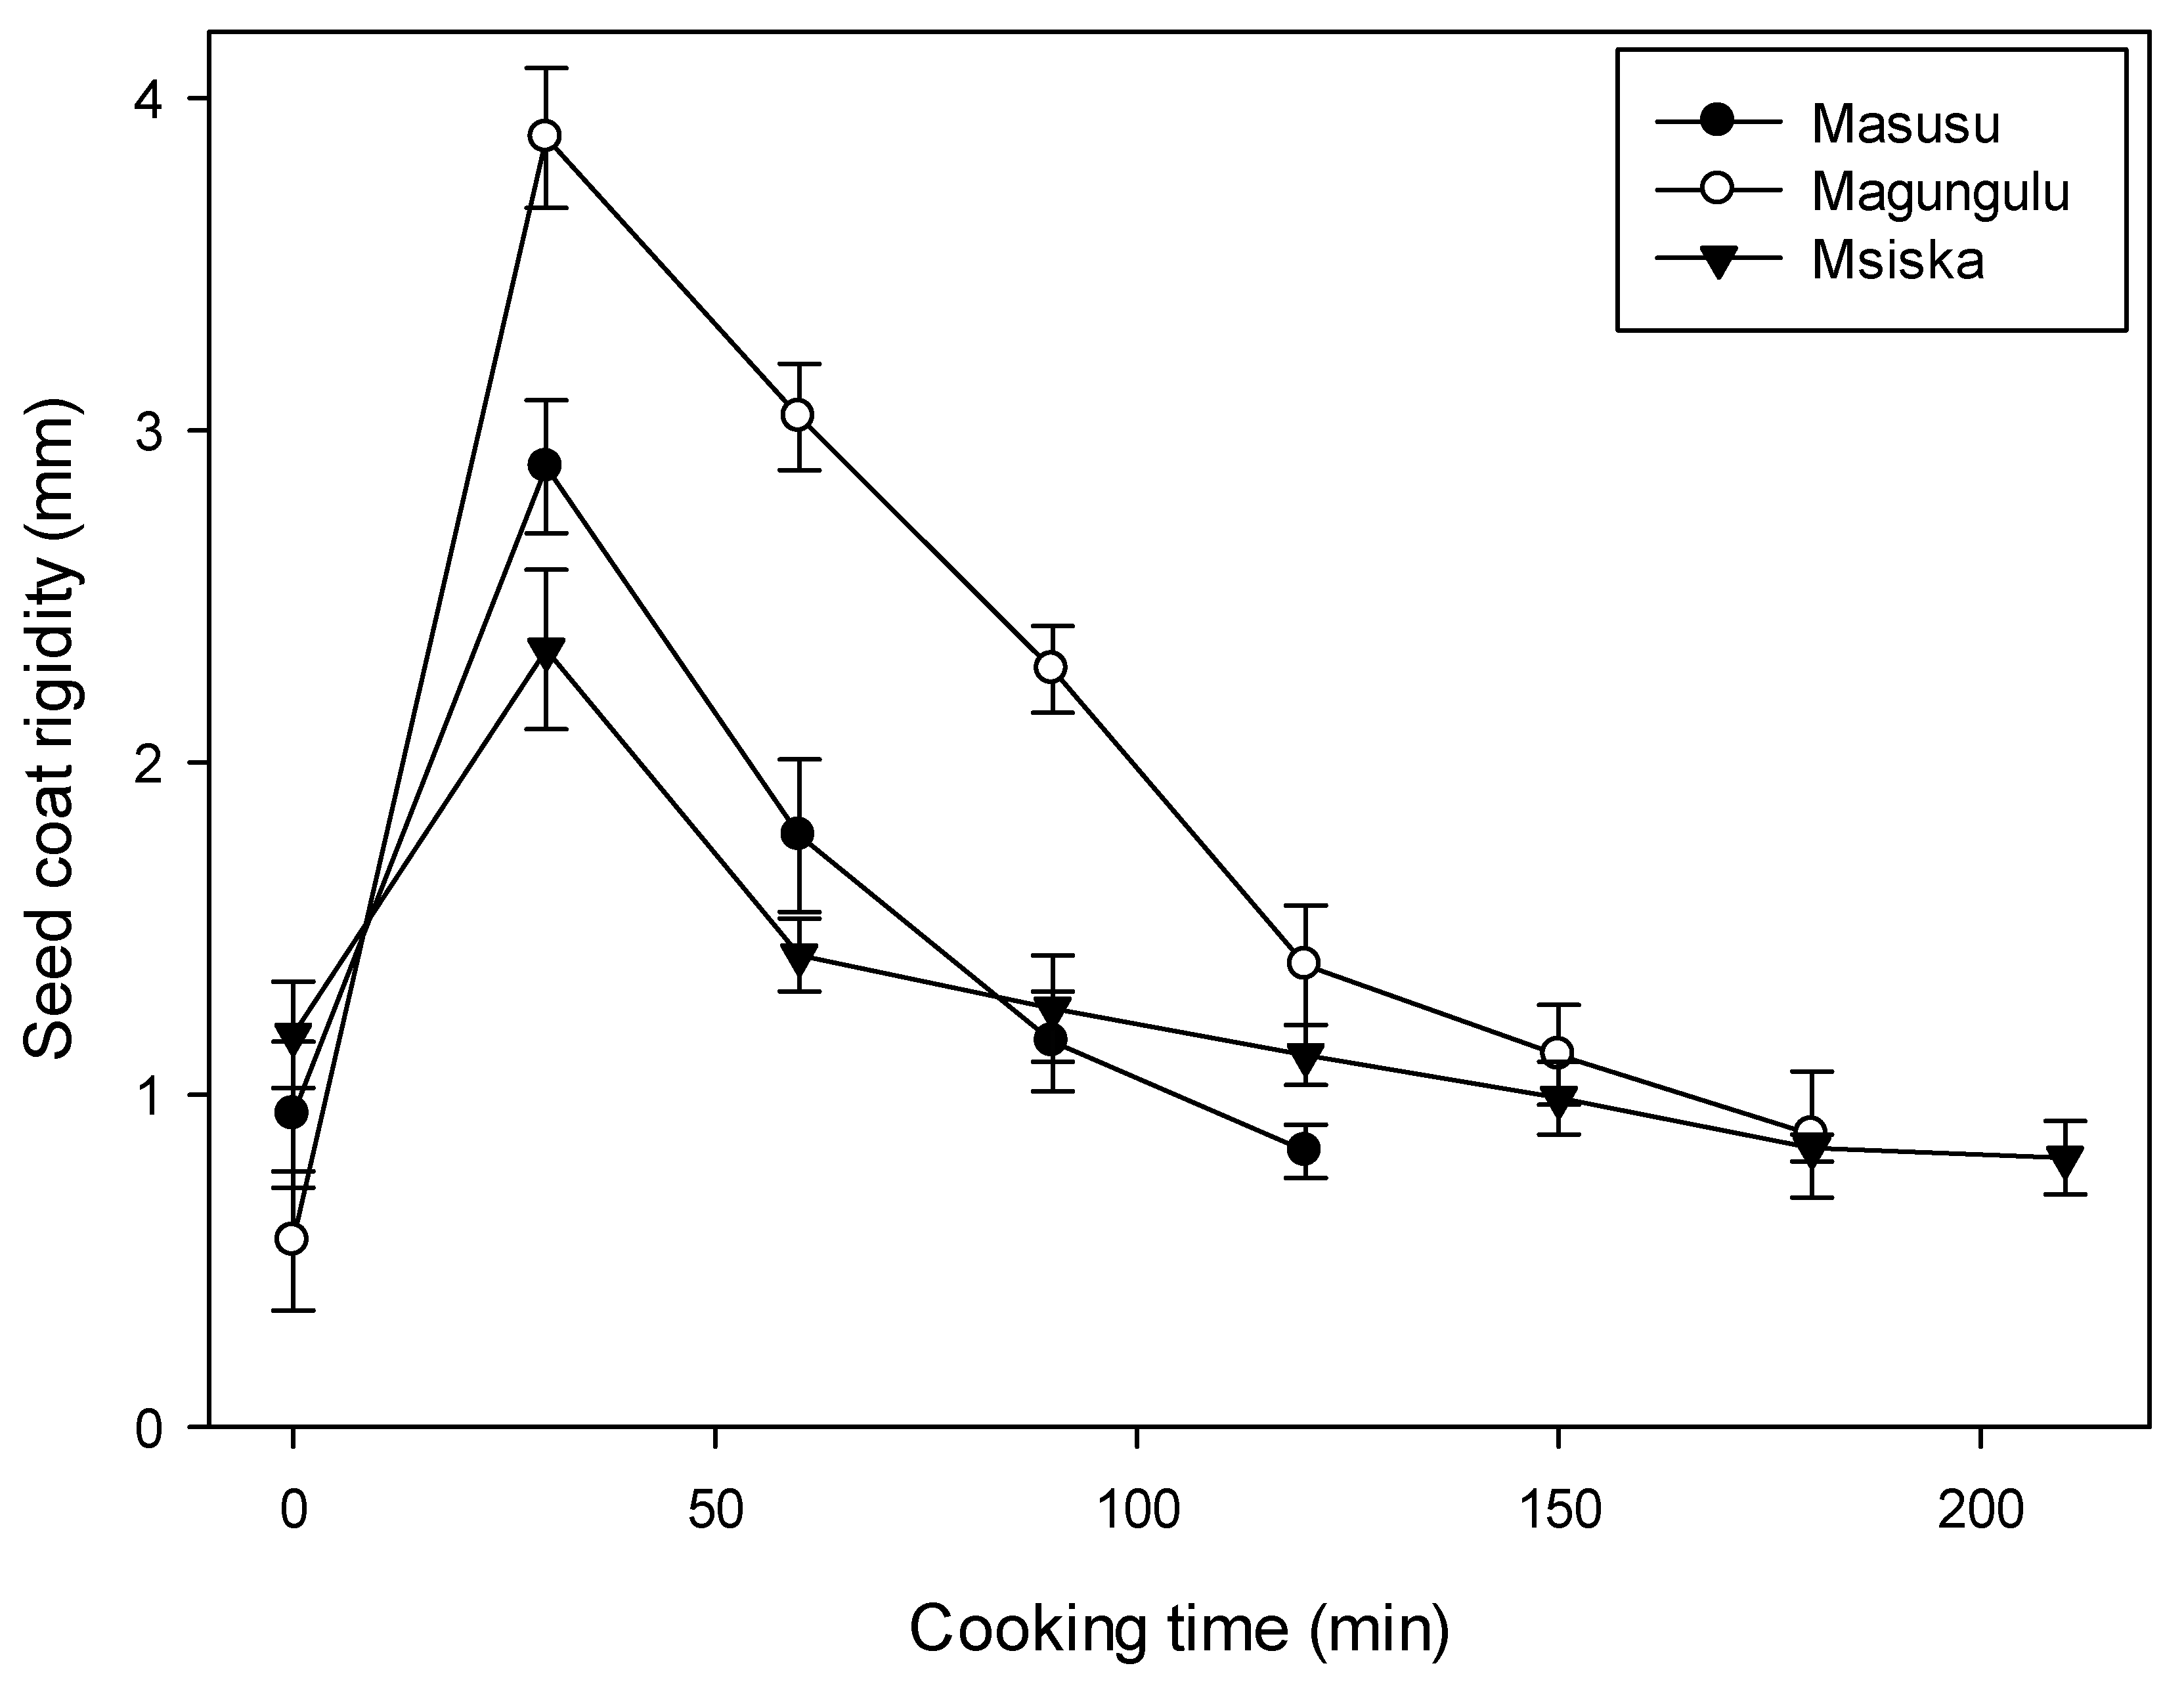
3.2. Bean Structure Deformation during Cooking

Uncooked beans are generally hard and strong. The bean-cooking process leads to some structural deformation that significantly reduces the hardness and produces a softened edible product. The typical force deformation curves for dry and cooked beans are shown in Figure 3. The sequence of deformation occurs in stages. Stage A represents when the probe just touches the bean. Stage B represents the force required for compressing the seed coat and outside layers of the cotyledon. The graphs show that in the uncooked beans (Figure 3a), AB and BC have the same slope. However, in the cooked sample (Figure 3b), BC had a steeper gradient than AB. This can be attributed to some level of plasticity attained by the seed coat during high-temperature cooking with water. A similar effect was observed for red kidney beans immersed in boiling distilled water at 100 °C for 1.5 min [28]. At stage C, the probe penetrates the seed coat and further compresses the bean. A rapid reduction in force was observed in the dry bean (Figure 3a) compared to the cooked beans. Between D and E, a constant force was observed as the probe moved through the bean. The higher force required to penetrate the dry bean resulted in breakage and fragmentation. As the probe traveled through the empty space, a near-zero force was recorded (stage DE). Similarly, DE was relatively constant in the cooked beans as the probe traveled after penetrating the seed coat (Figure 3b).
The force deformation curve changes significantly during cooking regardless of the cultivar. The variation in deformation curves of ETC and HTC bean cultivars is shown in Figure 3c and Figure 3d, respectively. The plots show that the maximum force to penetrate the bean decreased with increasing cooking time. The maximum distance the probe traveled prior to penetration decreased with increasing cooking time. This observation suggested that the seed coat rigidity or fracturability may considerably determine the softening behavior of beans. The figures also show that the force after penetration of the seed coat leveled with cooking time. This may be attributed to the fact that starch gelatinization, protein denaturation, and other phase changes due to cooking become uniform with time.
The evaluation of the seed coat rigidity/fracturability (Figure 4) shows that the dry seed coat is less rigid. The rigidity of the seed coat increased as it absorbed moisture and presented increased resistance to the probe during compression. This rigidity declined as the cooking time increased. The bean seed coat is composed of a thin cuticle above a layer of palisade cells. These palisade cells are prismatic and thick-walled contiguous cells [29]. The thickness of the palisade cells and the lignin and cellulose content of the seed coat are essential determiners of the cooking quality [29]. Seed coat thickness, seed volume, and protein content are known structural features responsible for water absorption [30]. It has been reported that beans with thinner seed coats absorb water more rapidly during the initial soaking of beans [31]. At higher temperatures such as those used in cooking, absorption could be higher, leading to higher initial resistance of the probe through the seed coat.

3.3. Modeling Bean Texture as a Function of Time

The experimental data were fitted to the three-parameter model (Equation (2)). Using non-linear regression analysis, the model constants were determined and presented in Table 1. The results showed that the model accurately predicted softening characteristics of the cultivars considered in this study with R2 of 0.994–0.999 and RMSE of 3.3–14.7%. Apart from Msiska and White beans, whose equilibrium maximum forces were 0.5 and 3.5%, respectively, above the experimentally determined cooking threshold, the final force determining fully cooked beans were accurately predicted. However, these variations were not statistically significant (p < 0.05). The rate constants revealed that Masusu and Sugar bean cultivars, already classified as ETC, had a relatively higher softening rate. The softening rates of Msiska, Boma, and Mandondo cultivars were relatively slower. It can be deduced that the model is useful as a classification tool to differentiate ETC and HTC cultivars and provide meaningful insight on bean softness.
The model parameters of the simplified two-parameter model (Table 1) showed that the model could accurately predict the softening characteristics of common beans with R2 of 0.975–0.994 and RMSE of less than 30%. When compared with the three-parameter model, the rate of softening is 14.2–15.1% lower. Considering the standard deviation of texture measurement for each cultivar, these variations in the rate of softening were significantly different (p < 0.05).
Cooking kinetics of cereal and legumes have largely relied on Peleg’s hydrodynamic model [32]. The hydrodynamic models used in cooking kinetics assume a diffusion process; however, there is evidence that liquid transport during cooking cannot solely be described by the diffusion mechanism [33]. The proposed two-parameter model could provide the benefit of predicting the softening characteristics using the initial bean hardness, which can easily be measured using hardness testing equipment including simple handheld texture analyzers.

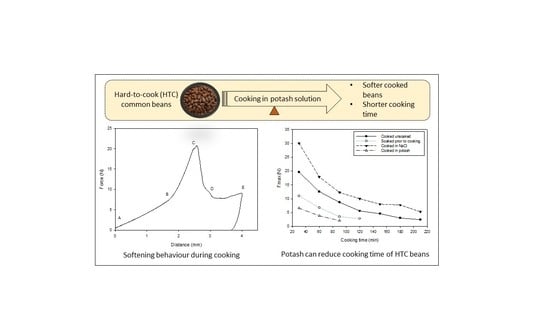
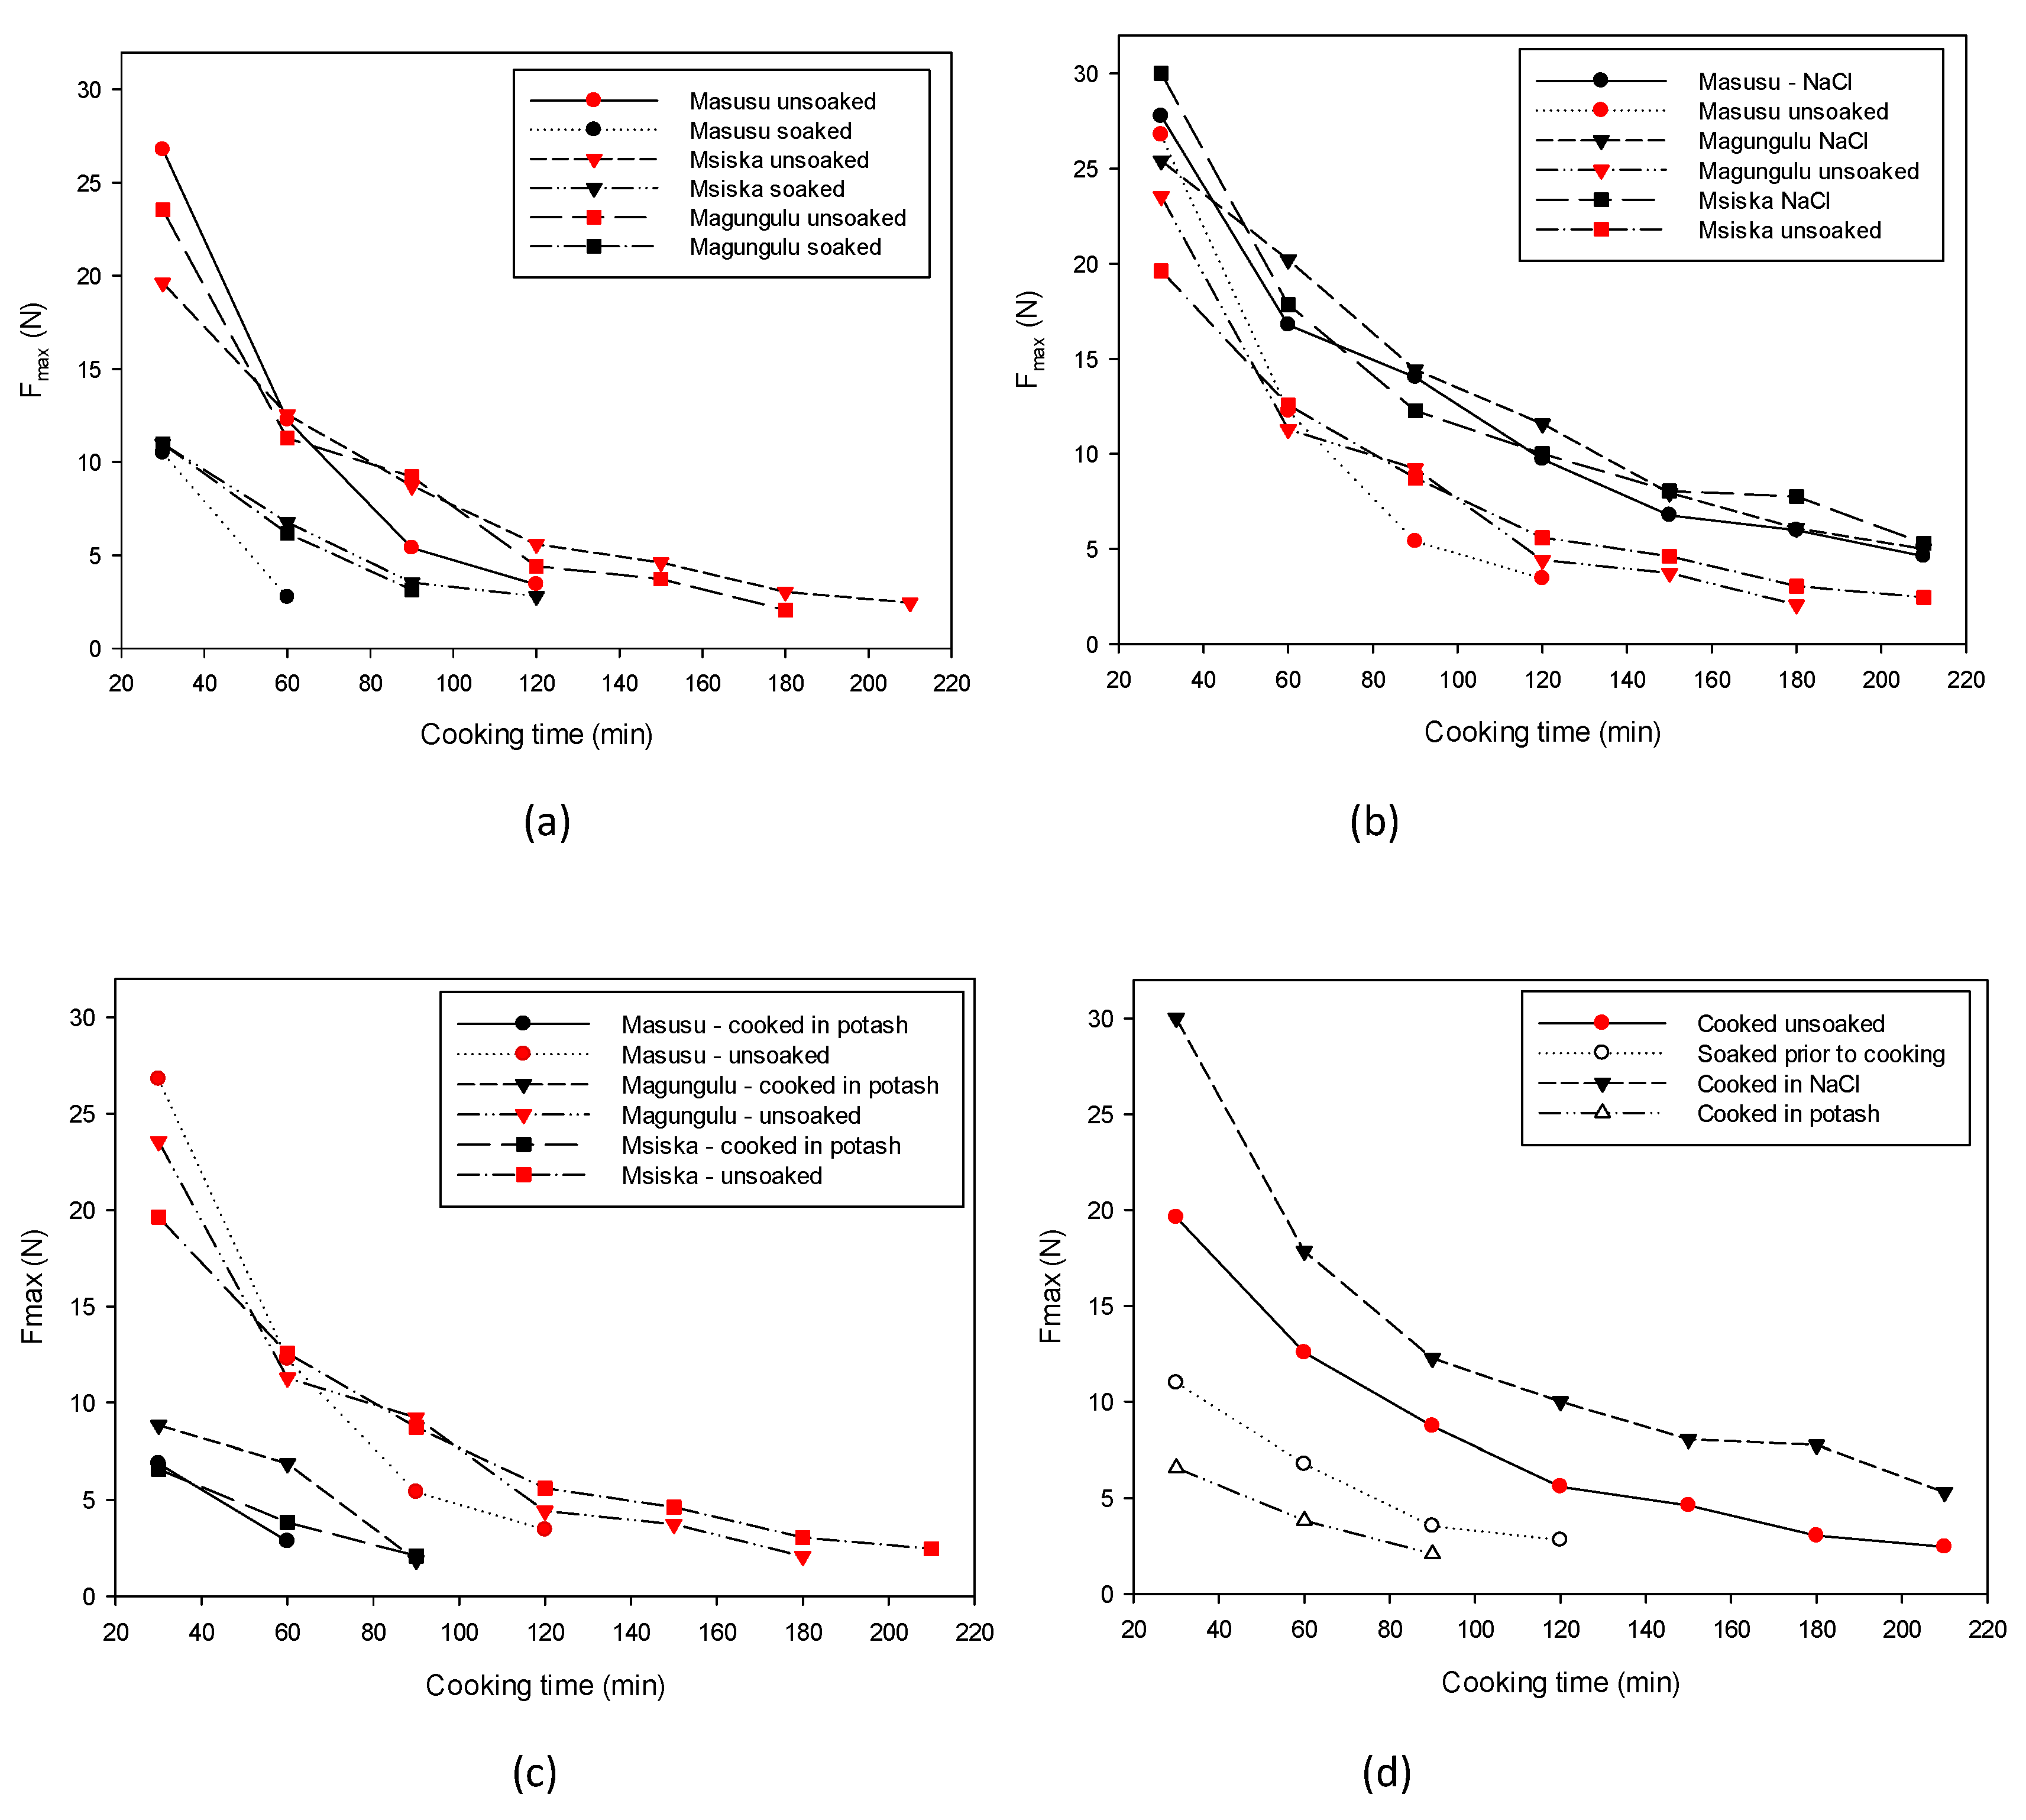
3.4. Softening Techniques and Their Impact during Cooking

The effects of the different softening techniques on the cookability of the bean samples are presented in Figure 5.

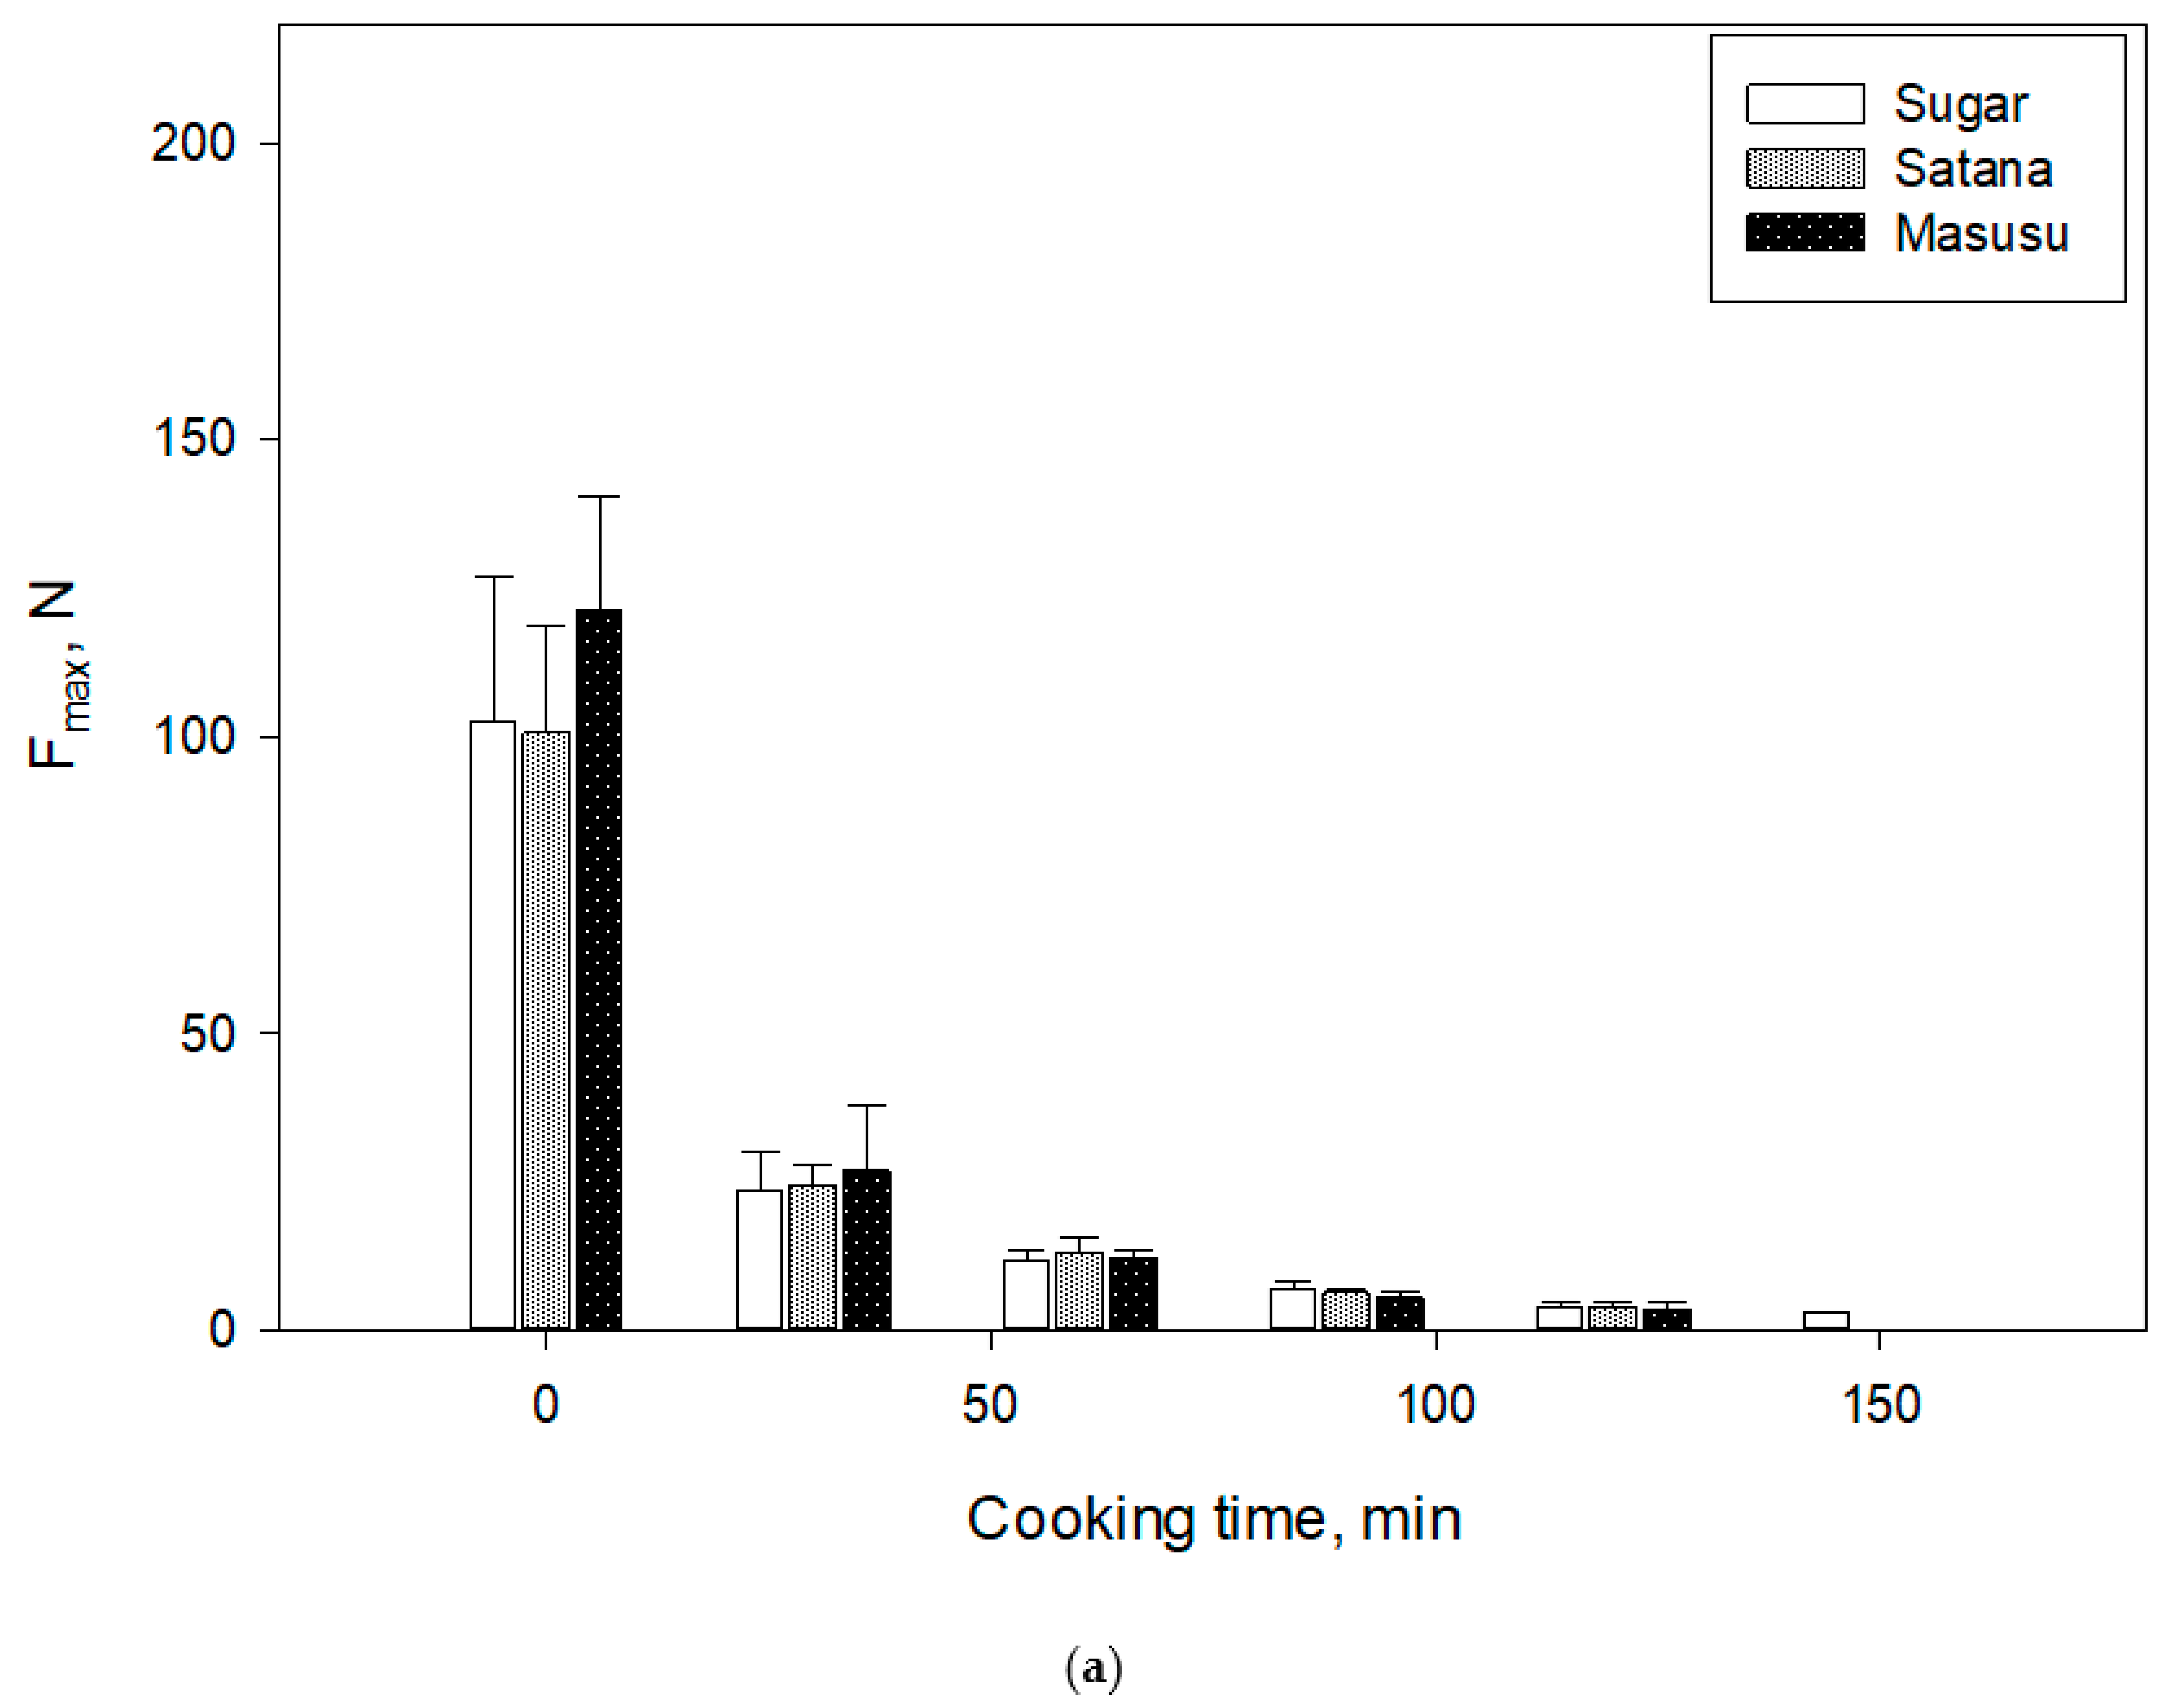
3.4.1. Effect of Soaking on the Texture of Common Beans

The comparative cookability profile of soaked and unsoaked beans is shown in Figure 5a. The maximum penetration force representing the hardness was significantly lower for soaked beans compared to unsoaked beans. Cooking time was reduced both for ETC varieties like Masusu and HTC varieties like Msiska. The reduction was 42, 50, and 50% for Msiska, Magungulu, and Masusu, respectively. This result seems to suggest that the rate of cooking time reduction due to soaking does not depend on the classification. This reduction may be attributed to increased cell wall hydration as enough water is absorbed, causing the softening of the cell wall and enhancing the breakdown of the middle lamella of the cotyledon [34].

3.4.2. Effect of Salt Addition on Texture Profile during Cooking

Salt addition has been a common technique for softening. The results show that the addition of NaCl had no softening impact (Figure 5b). It had no influence on the HTC cultivars and even increased the hardness of the ETC after 60 min. During the cooking of whole (unhulled) beans, early addition of common salt NaCl before the seed coat has absorbed enough cooking water appears to make the seed coat impervious, toughen the beans middle lamella, and impede further water absorption. These lead to the failure of underlying cells to achieve the needed hydration to separate upon cooking and interfere with the solubility of the pectic substances during cooking. This phenomenon has been mostly associated with the ability of Ca2+ and Mg2+ to form water-resistant pectin complexes with the pectin-rich intercellular middle lamella [4,35]. Na+ is recognized to share similar chemical and biochemical reaction properties with Ca2+ and Mg2+. This finding is consistent with the report of Kinyanjui, Njoroge [18], especially with respect to the HTC cultivars. On the other hand, the K2CO3 salt had a pronounced effect on the hardness of both the ETC and HTC cultivars (Figure 5c). The addition of K2CO3 salt reduced the cooking time of ETC and HTC beans by up to 50 and 57%, respectively. As shown in Figure 5d, the addition of potassium salt resulted in the highest level of bean softening. The impact of increased potassium load on the functional and nutrient quality of the product must be balanced with the desired degree of bean softening.

4. Conclusions

This study correlated the classification of ten beans cultivar as easy-to-cook (ETC) or hard-to-cook (HTC) based on a subjective pinching test with an objective penetration test. The penetration test showed that three cultivars, namely Sugar, Satana, and Masusu, stood out as ETC cultivars, while the other seven cultivars could be described as HTC cultivars. Force deformation curves and seed coat rigidity/fracturability tests were used to monitor the textural changes during cooking. The average hardness of raw dry beans was found to be 102.4 and 170.8 N for ETC and HTC, respectively. Seed coat rigidity plays important role in bean softening during cooking. It was found that the seed coat resistance increased sharply during the initial 30 min and gradually declined until the bean was fully cooked. The results also showed that the three-parameter non-linear regression model and its simplified version can be used to adequately and satisfactorily model the softening characteristics of common bean during cooking. Potassium-based aqueous solutions and pre-soaking can considerably reduce cooking time up to 57%.

Author Contributions

E.M.K. performed the experiments with O.I.M. This research was led by M.N., who was also instrumental in the initiation, conceptualization, and planning of this work. All authors have read and agreed to the published version of the manuscript.

Funding

This research was funded by the International Fund for Agricultural Development (IFAD) for providing financial assistance through IFAD project grant 2000000974.

Conflicts of Interest

The authors declare no conflict of interest.

References

  1. Anton, A.A.; Ross, K.A.; Beta, T.; Fulcher, R.G.; Arntfield, S.D. Effect of pre-dehulling treatments on some nutritional and physical properties of navy and pinto beans (Phaseolus vulgaris L.). LWT Food Sci. Technol. 2008, 41, 771–778. [Google Scholar] [CrossRef]
  2. Yildirim, A.; Öner, M.D.; Bayram, M. Effect of soaking and ultrasound treatments on texture of chickpea. J. Food Sci. Technol. 2013, 50, 455–465. [Google Scholar] [CrossRef]
  3. Uebersax, M.A.; Ruengsakulrach, S.; Occea, L.G. Strategies and procedures for processing dry beans. J. Food Tech. 1991, 44, 7. [Google Scholar]
  4. Nyakuni, G.A.; Kikafunda, J.K.; Muyonga, J.H.; Kyamuhangire, W.M.; Nakimbugwe, D.; Ugen, M. Chemical and nutritional changes associated with the development of the hard-to-cook defect in common beans. Int. J. Food Sci. Nutr. 2008, 59, 652–659. [Google Scholar] [CrossRef] [PubMed]
  5. Shiga, T.M.; Lajolo, F.M.; Filisetti, T.M.C.C. Changes in the cell wall polysaccharides during storage and hardening of beans. Food Chem. 2004, 84, 53–64. [Google Scholar] [CrossRef]
  6. Moscoso, W.; Bourne, M.C.; Hood, L.F. Relationships Between the Hard-to-Cook Phenomenon in Red Kidney Beans and Water Absorption, Puncture Force, Pectin, Phytic Acid, and Minerals. Int. J. Food Sci. 1984, 49, 1577–1583. [Google Scholar] [CrossRef]
  7. Galiotou-Panayotou, M.; Kyriakidis, N.B.; Margaris, I. Phytase–phytate–pectin hypothesis and quality of legumes cooked in calcium solutions. J. Sci. Food Agric. 2008, 88, 355–361. [Google Scholar] [CrossRef]
  8. Hincks, M.J.; Stanley, D.W. Lignification: Evidence for a role in hard-to-cook beans. J. Food Biochem. 1987, 11, 18. [Google Scholar] [CrossRef]
  9. Srisuma, N.; Hammerschmidt, R.; Uebersax, M.A.; Ruengsakulrach, S.; Bennink, M.R.; Hosfield, G.L. Storage Induced Changes of Phenolic Acids and the Development of Hard-To-Cook in Dry Beans (Phaseolus vulgaris var. Seafarer). J. Food Sci. 1989, 54, 311–314. [Google Scholar] [CrossRef]
  10. Pujolà, M.; Farreras, A.; Casañas, F. Protein and starch content of raw, soaked and cooked beans (Phaseolus vulgaris L.). Food Chem. 2007, 102, 1034–1041. [Google Scholar] [CrossRef] [Green Version]
  11. Ghafoor, M.; Misra, N.N.; Mahadevan, K.; Tiwari, B.K. Ultrasound assisted hydration of navy beans (Phaseolus vulgaris). Ultrason. Sonochem. 2014, 21, 409–414. [Google Scholar] [CrossRef] [PubMed]
  12. de León, L.F.; Elías, L.G.; Bressani, R. Effect of salt solutions on the cooking time, nutritional and sensory characteristics of common beans (Phaseolus vulgaris). Food Res. Int. 1992, 25, 131–136. [Google Scholar] [CrossRef]
  13. Gowen, A.; Abu-Ghannam, N.; Frias, J.; Oliveira, J. Influence of pre-blanching on the water absorption kinetics of soybeans. J. Food Eng. 2007, 78, 965–971. [Google Scholar] [CrossRef]
  14. Ai, Y.; Cichy, K.A.; Harte, J.B.; Kelly, J.D.; Ng, P.K. Effects of extrusion cooking on the chemical composition and functional properties of dry common bean powders. Food Chem. 2016, 211, 538–545. [Google Scholar] [CrossRef] [PubMed] [Green Version]
  15. Alonso, R.; Aguirre, A.; Marzo, F. Effects of extrusion and traditional processing methods on antinutrients and in vitro digestibility of protein and starch in faba and kidney beans. Food Chem. 2000, 68, 159–165. [Google Scholar] [CrossRef]
  16. Alonso, R.; Orúe, E.; Marzo, F. Effects of extrusion and conventional processing methods on protein and antinutritional factor contents in pea seeds. Food Chem. 1998, 63, 505–512. [Google Scholar] [CrossRef]
  17. Njoroge, D.M.; Kinyanjui, P.K.; Chigwedere, C.M.; Christiaens, S.; Makokha, A.O.; Sila, D.N.; Hendrickx, M.E. Mechanistic insight into common bean pectic polysaccharide changes during storage, soaking and thermal treatment in relation to the hard-to-cook defect. Food Res. Int. 2016, 81, 39–49. [Google Scholar] [CrossRef]
  18. Kinyanjui, P.K.; Njoroge, D.M.; Makokha, A.O.; Christiaens, S.; Ndaka, D.S.; Hendrickx, M. Hydration properties and texture fingerprints of easy- and hard-to-cook bean varieties. Food Sci. Nutr. 2015, 3, 9–47. [Google Scholar] [CrossRef]
  19. Vindiola, O.L.; Seib, O.A.; Hoseney, R.C. Accelerated development of hard-to-cook state in beans. Cereal Foods World 1986, 31, 14. [Google Scholar]
  20. dos Santos Siqueira, B.; Vianello, R.P.; Fernandes, K.F.; Bassinello, P.Z. Hardness of carioca beans (Phaseolus vulgaris L.) as affected by cooking methods. LWT Food Sci. Technol. 2013, 54, 13–17. [Google Scholar] [CrossRef] [Green Version]
  21. Revilla, I.; Vivar-Quintana, A.M. Effect of canning process on texture of Faba beans (Vicia Faba). Food Chem. 2008, 106, 310–314. [Google Scholar] [CrossRef]
  22. Shafaei, S.M.; Masoumi, A.A.; Roshan, H. Analysis of water absorption of bean and chickpea during soaking using Peleg model. J. Saudi Soc. Agric. Sci. 2016, 15, 135–144. [Google Scholar] [CrossRef] [Green Version]
  23. McWatters, K.H.; Chinnan, M.S.; Phillips, R.D.; Beuchat, L.R.; Reid, L.B.; Mensa-Wilmot, Y.M. Functional, Nutritional, Mycological, and Akara-making Properties of Stored Cowpea Meal. J. Food Sci. 2002, 67, 2229–2234. [Google Scholar] [CrossRef]
  24. Cunningham, S.E.; Mcminn, W.A.; Magee, T.R.; Richardson, P.S. Effect of processing conditions on the water absorption and texture kinetics of potato. J. Food Eng. 2008, 84, 214–223. [Google Scholar] [CrossRef]
  25. Khazaei, J.; Mohammadi, N. Effect of temperature on hydration kinetics of sesame seeds (Sesamum indicum L.). J. Food Eng. 2009, 91, 542–552. [Google Scholar] [CrossRef]
  26. Miano, A.C.; Augusto, P.E.D. From the sigmoidal to the downward concave shape behavior during the hydration of grains: Effect of the initial moisture content on Adzuki beans (Vigna angularis). Food Bioprod. Process. 2015, 96, 43–51. [Google Scholar] [CrossRef]
  27. Joshi, M.; Adhikari, B.; Panozzo, J.; Aldred, P. Water uptake and its impact on the texture of lentils (Lens culinaris). J. Food Eng. 2010, 100, 61–69. [Google Scholar] [CrossRef]
  28. Abu-Ghannam, N. Interpretation of the force deformation curves of soaked red kidney beans (Phaseolus vulgaris L.). Int. J. Food Sci. Technol. 1998, 33, 509–515. [Google Scholar] [CrossRef]
  29. Stanley, D.W.; Aguilera, J.M. A review of textural defects in cooked reconstituted legumes—The influence od structure and composition. J. Food Biochem. 1985, 9, 277–323. [Google Scholar] [CrossRef]
  30. Sefa-Dedeh, S.; Stanley, D.W. The relationship of microstructure of cowpeaa to water absorption and dehulling properties. Cereal Chem. 1979, 56, 7. [Google Scholar]
  31. Sefa-Dedeh, S.; Stanley, D.W. Textural implications of the microstructure of legumes. Food Technol. 1979, 33, 7. [Google Scholar]
  32. Peleg, M. An Empirical Model for the Description of Moisture Sorption Curves. J. Food Sci. 1988, 53, 1216–1217. [Google Scholar] [CrossRef]
  33. Sharanagat, V.S.; Kansal, V.; Kumar, K. Modeling the effect of temperature on the hydration kinetic whole moong grain. J. Saudi Soc. Agric. Sci. 2016. [Google Scholar] [CrossRef]
  34. Sefa-Dedeh, S.; Stanley, D.W.; Voisey, P.W. Effects of soaking time and cooking conditions on texture and microstructure of cowpeas (Vigna unguiculata). J. Food Sci. 1978, 43, 7. [Google Scholar] [CrossRef]
  35. Bressani, R. Grain quality of common beans. Food Rev. Int. 1993, 9, 80. [Google Scholar] [CrossRef]
Figure 1. Subjective hardness test of the bean cultivars. (The red line represents the subjective bean classification line. Bean cultivars below the line are easy-to-cook (ETC), while those above the line are hard-to-cook (HTC).
Processes 08 01227 g001
Figure 2. Objective hardness test of the bean cultivars (a) ETC cultivars (b) HTC cultivars.
Processes 08 01227 g002aProcesses 08 01227 g002b
Figure 3. Variation of force deformation in common beans: (a) typical uncooked beans (b) typical cooked beans (c) cooked ETC cultivar (Masusu), and (d) cooked HTC cultivar (Msiska).
Processes 08 01227 g003
Figure 4. Variation of seed coat rigidity of common beans during cooking (ETC – Masusu, HTC -Msiska, Intermediate – Magungulu)
Processes 08 01227 g004
Figure 5. Effect of softening techniques on common beans cookability profile: (a) soaking before cooking, (b) cooking in NaCl solution, (c) cooking in potash solution, and (d) comparison of softening techniques for HTC cultivar (Msiska).
Processes 08 01227 g005
Table 1. Model parameters of the 3-parameter and simplified 2-parameter models.
3-Parameter Model2-Parameter Model
Bean CultivarFeFdKFR2RMSE (%)F0KFR2RMSE (%)
Boma4.39103.80.04280.99912.5107.80.03670.99114.5
Sugar4.33104.00.05740.9983.3108.00.04630.9908.9
Mandondo3.66104.70.04590.99810.4107.90.04040.99118.4
Satana4.22104.10.05380.9974.5107.10.04450.9908.5
Masusu3.61104.70.05840.9983.9108.70.04270.9944.8
Msiska4.56102.90.04240.99414.7107.90.04980.97829.7
Kabulangeti4.12102.10.05140.9949.2107.50.04050.97522.4
White4.39103.60.04860.99410.4107.60.04090.98414.7
Magungulu4.43103.40.05490.99612.8107.90.04550.98616.1
Maine4.05103.60.05370.99911.8108.10.04900.98810.2
Fe = equilibrium force during cooking; Fd = differential softening representing the total degree of softening over the cooking period; KF = rate constant of bean softening; Fo = initial force prior to cooking. (Tukey–Kramer HSD (α = 0.05)).

