1. Introduction
Additive manufacturing (AM), also called 3D printing technology, provides 3D geometry by depositing various materials, such as metals, plastics, composites, polymer materials, ceramics etc., by inputting 3D-designed digital geometry information into a manipulator [
1,
2,
3,
4,
5]. AM technology is largely divided into direct deposition and indirect deposition and can be subdivided into seven different technologies depending on the material [
6]. Among these, metal-based AM technology is divided into four types depending on the heat source or processing method, among other factors, and is typically divided into powder bed fusion (PBF) and direct energy deposition (DED) technology, which use a laser heat source and metal powder [
7]. Metal AM technology using a metal powder and a laser heat source has been optimized to achieve precise and complex geometry. Many studies in this area have been conducted because the properties of metal can be improved through a combination of metal powders and technology. However, there are limitations to the use of AM technology using high-density energy heat sources and metal powders. Although various geometries can be achieved and the properties of metal materials can be improved by the combination of powders, there are issues such as the deposition speed, product size limitations, high equipment cost and deposition materials (powders). Powder metal 3D printing technology has been applied to parts with a small special ability so far, and its application to large parts is limited [
8,
9].
Wire arc additive manufacturing (WAAM) technology is similar to the direct energy deposition (DED) method classified by ASTM (American society for testing materials), and this technology performs deposition by melting and depositing metal wires using an arc heat source. Generally, WAAM uses gas metal arc welding (GMAW) or gas tungsten arc welding (GTAW) methods, among several welding techniques, to perform continuous metal deposition [
10]. WAAM is similar to DED-type 3D printing. The precision of parts is lower because it attaches thin metal wires such as in arc welding.
However, WAAM can use wires that are a half or a third cheaper than metal powder for DED, and there is no need to use expensive laser power sources. In addition, WAAM can deposit large parts faster than powder-type 3D metal printers. Therefore, WAAM is popular in the field of aerospace or shipbuilding where large structures are made [
11,
12].
WAAM technology is advantageous for the production of complex large parts that cannot be made with the traditional metal powder deposition technology. WAAM technology is being considered as an alternative to the existing casting or machining approaches for metals, which come with a high material loss. Recently, interest in WAAM technology in industries has been increasing, and research on metal deposition using existing commercial welding technology has continued [
13,
14,
15,
16].
The deposition uniformity of the WAAM process can reduce the material loss that happens during post-processing. While deposition using a general powder provides a stable surface roughness, WAAM has a very rough surface because a single bead geometry is made by melting and depositing a typical size of a minimum Ø0.8 mm to a maximum Ø4.3 mm wire. Martina et al. [
17] explained the use of the deposition volume to assess bead roughness and investigated the efficiency of various welding techniques and conditions.
Köhler et al. [
18] continuously stacked aluminum wires using WAAM and observed the changes in bead shapes and structures according to the interlayer temperature. As the wire feed and welding speed increased, the layer height decreased and the wall width increased. Furthermore, the higher the temperature was between passes, the greater the width and height of the aluminum walls were.
Fang et al. [
19] compared the mechanical properties of aluminum-laminated parts according to the arc mode of a cold metal transfer (CMT) welder. It was reported that the mechanical properties differed due to the change of the arc mode under the same current and voltage conditions.
Zhang et al. and Xiong et al. [
20,
21] performed a study to modify the geometry of a single bead to increase efficiency during continuous deposition. Their study compared models of a parabola, cosine and arc to select the most optimized bead profile to represent a single bead shape and investigated how to smooth the surface condition of the deposited material. In addition, they investigated how to measure the bead height in real time during continuous deposition and improve the deposition efficiency by changing the welding conditions in real time based on the measured height.
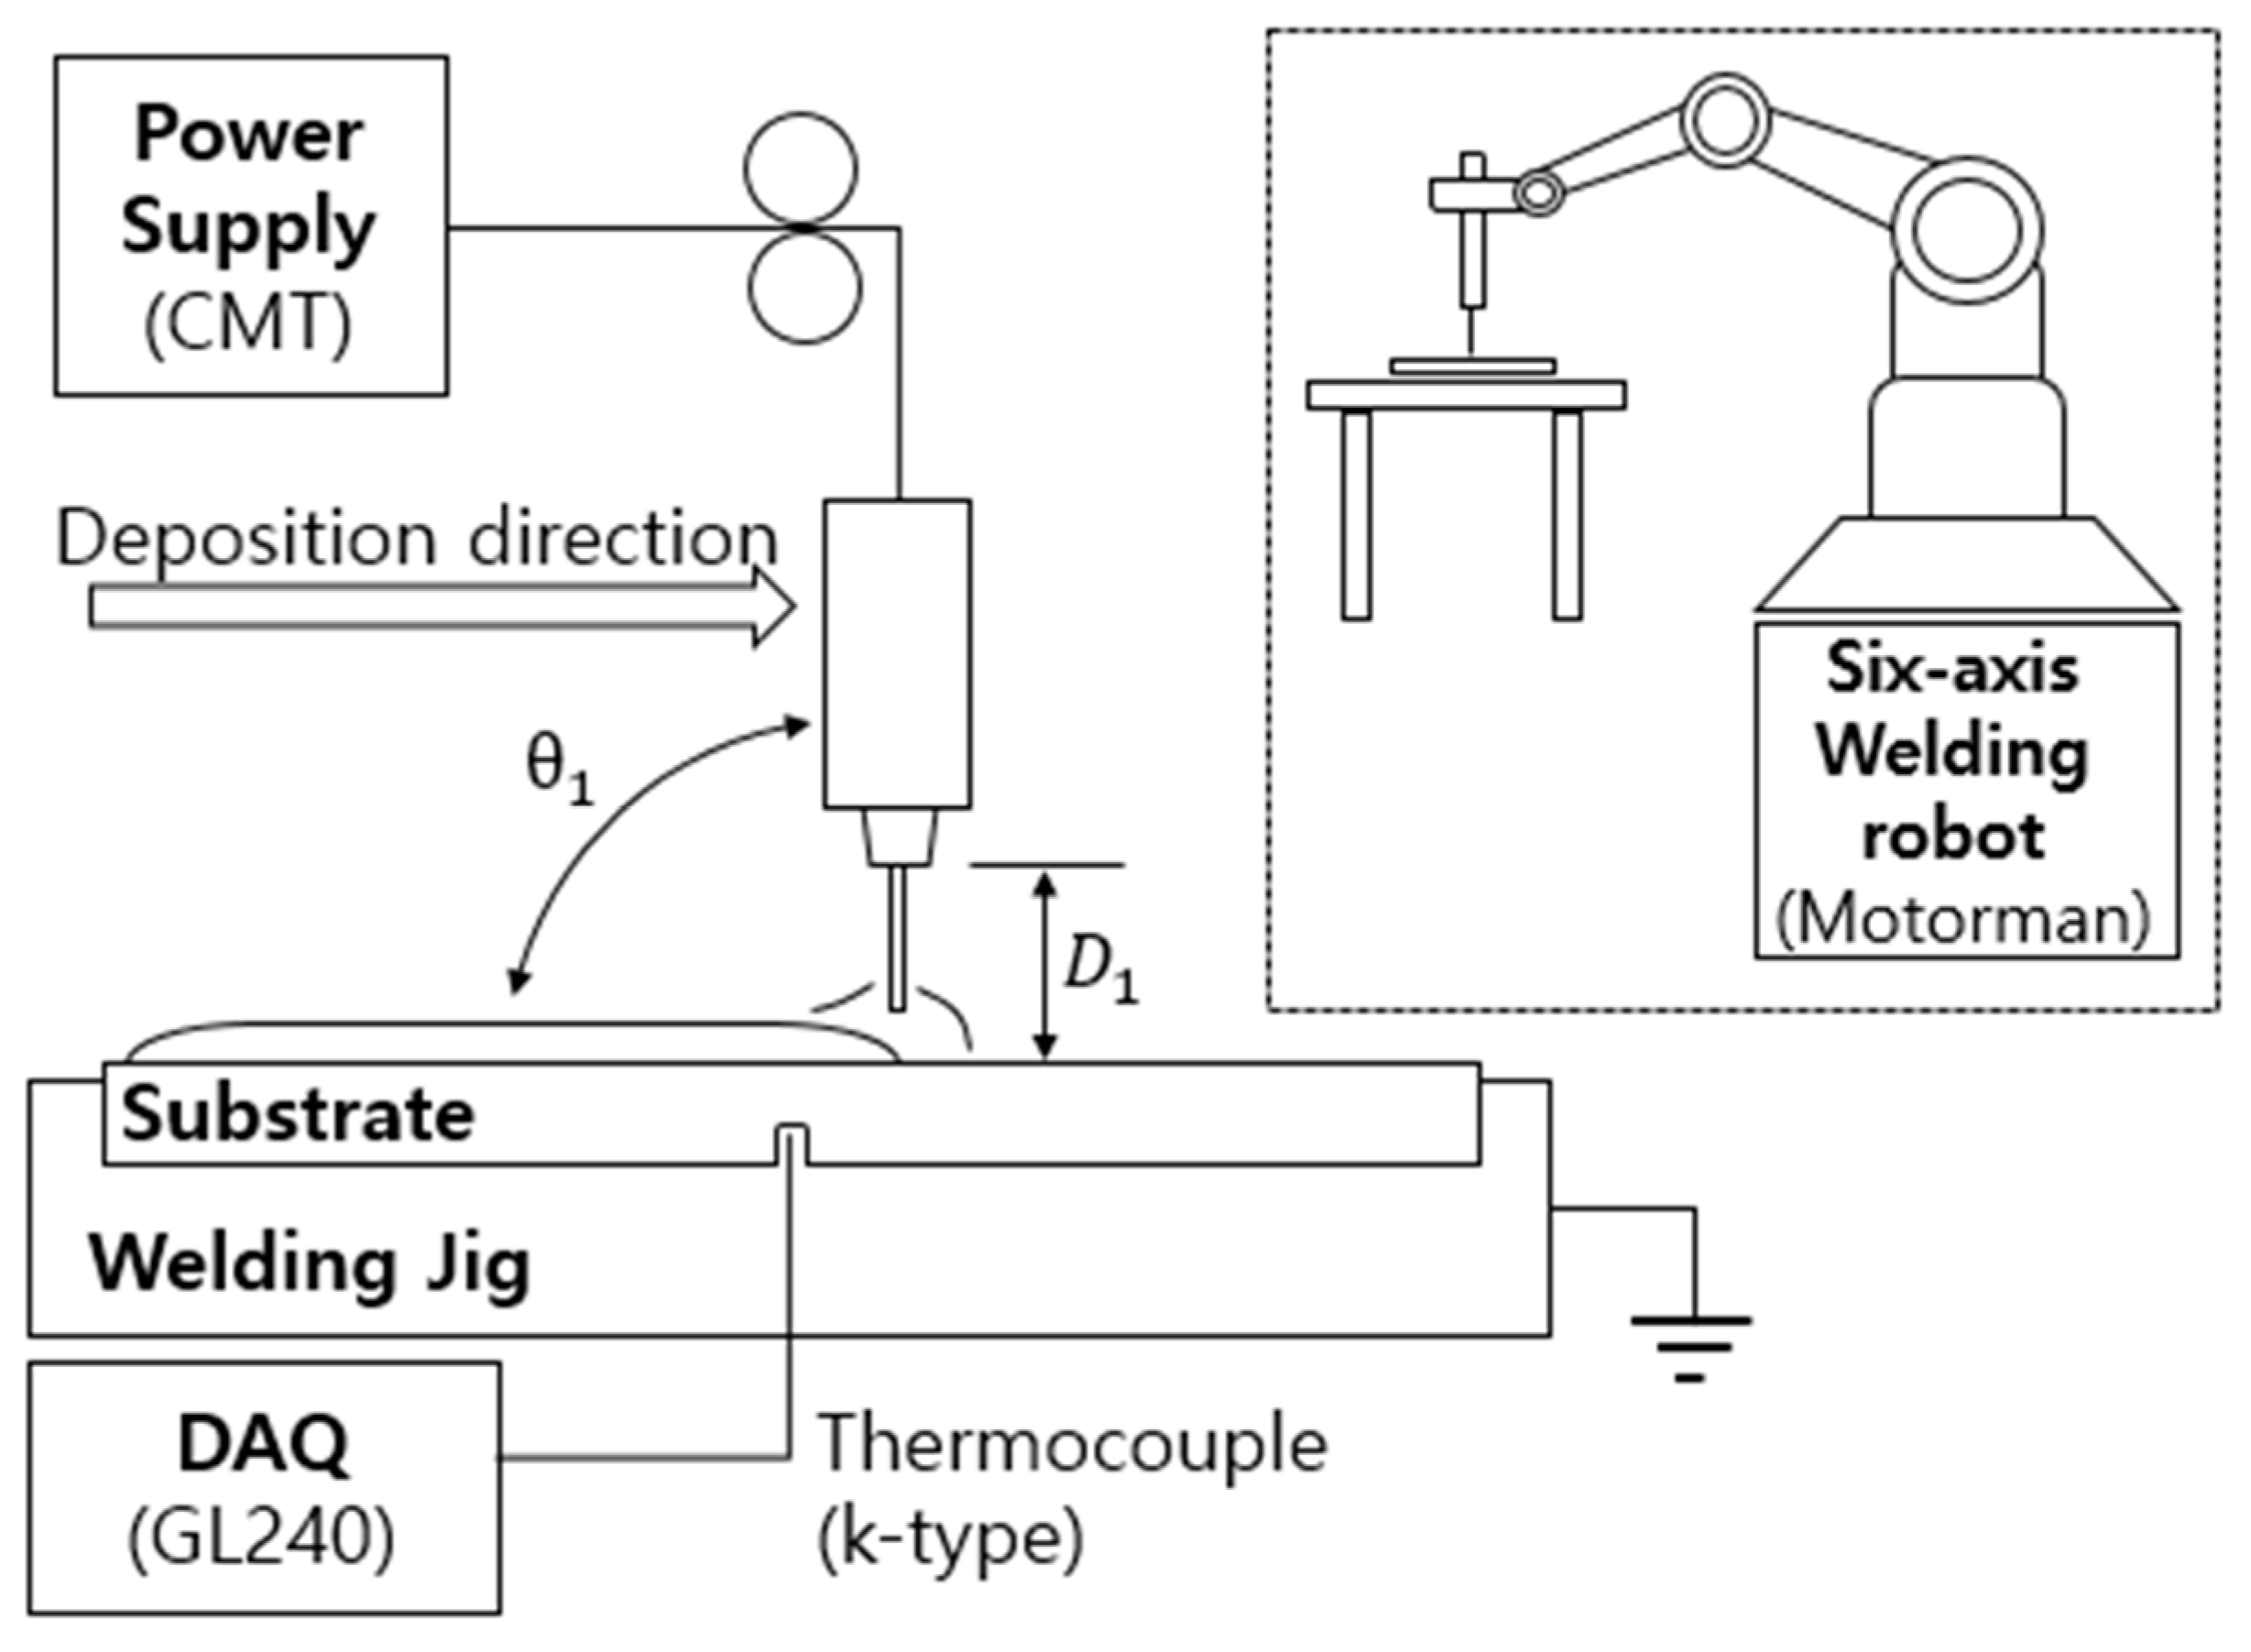
In this study, basic experiments were performed to produce aluminum parts using WAAM, and the geometry of the deposition layers depending on welding conditions was observed. The effects of the heat input and current and voltage ratio on the bead geometry for nine different welding conditions (depositing conditions) were analyzed, and the depositing efficiency was also analyzed by analyzing the cross-sectional geometry of thin-wall parts made of aluminum.
3. Results and Discussion
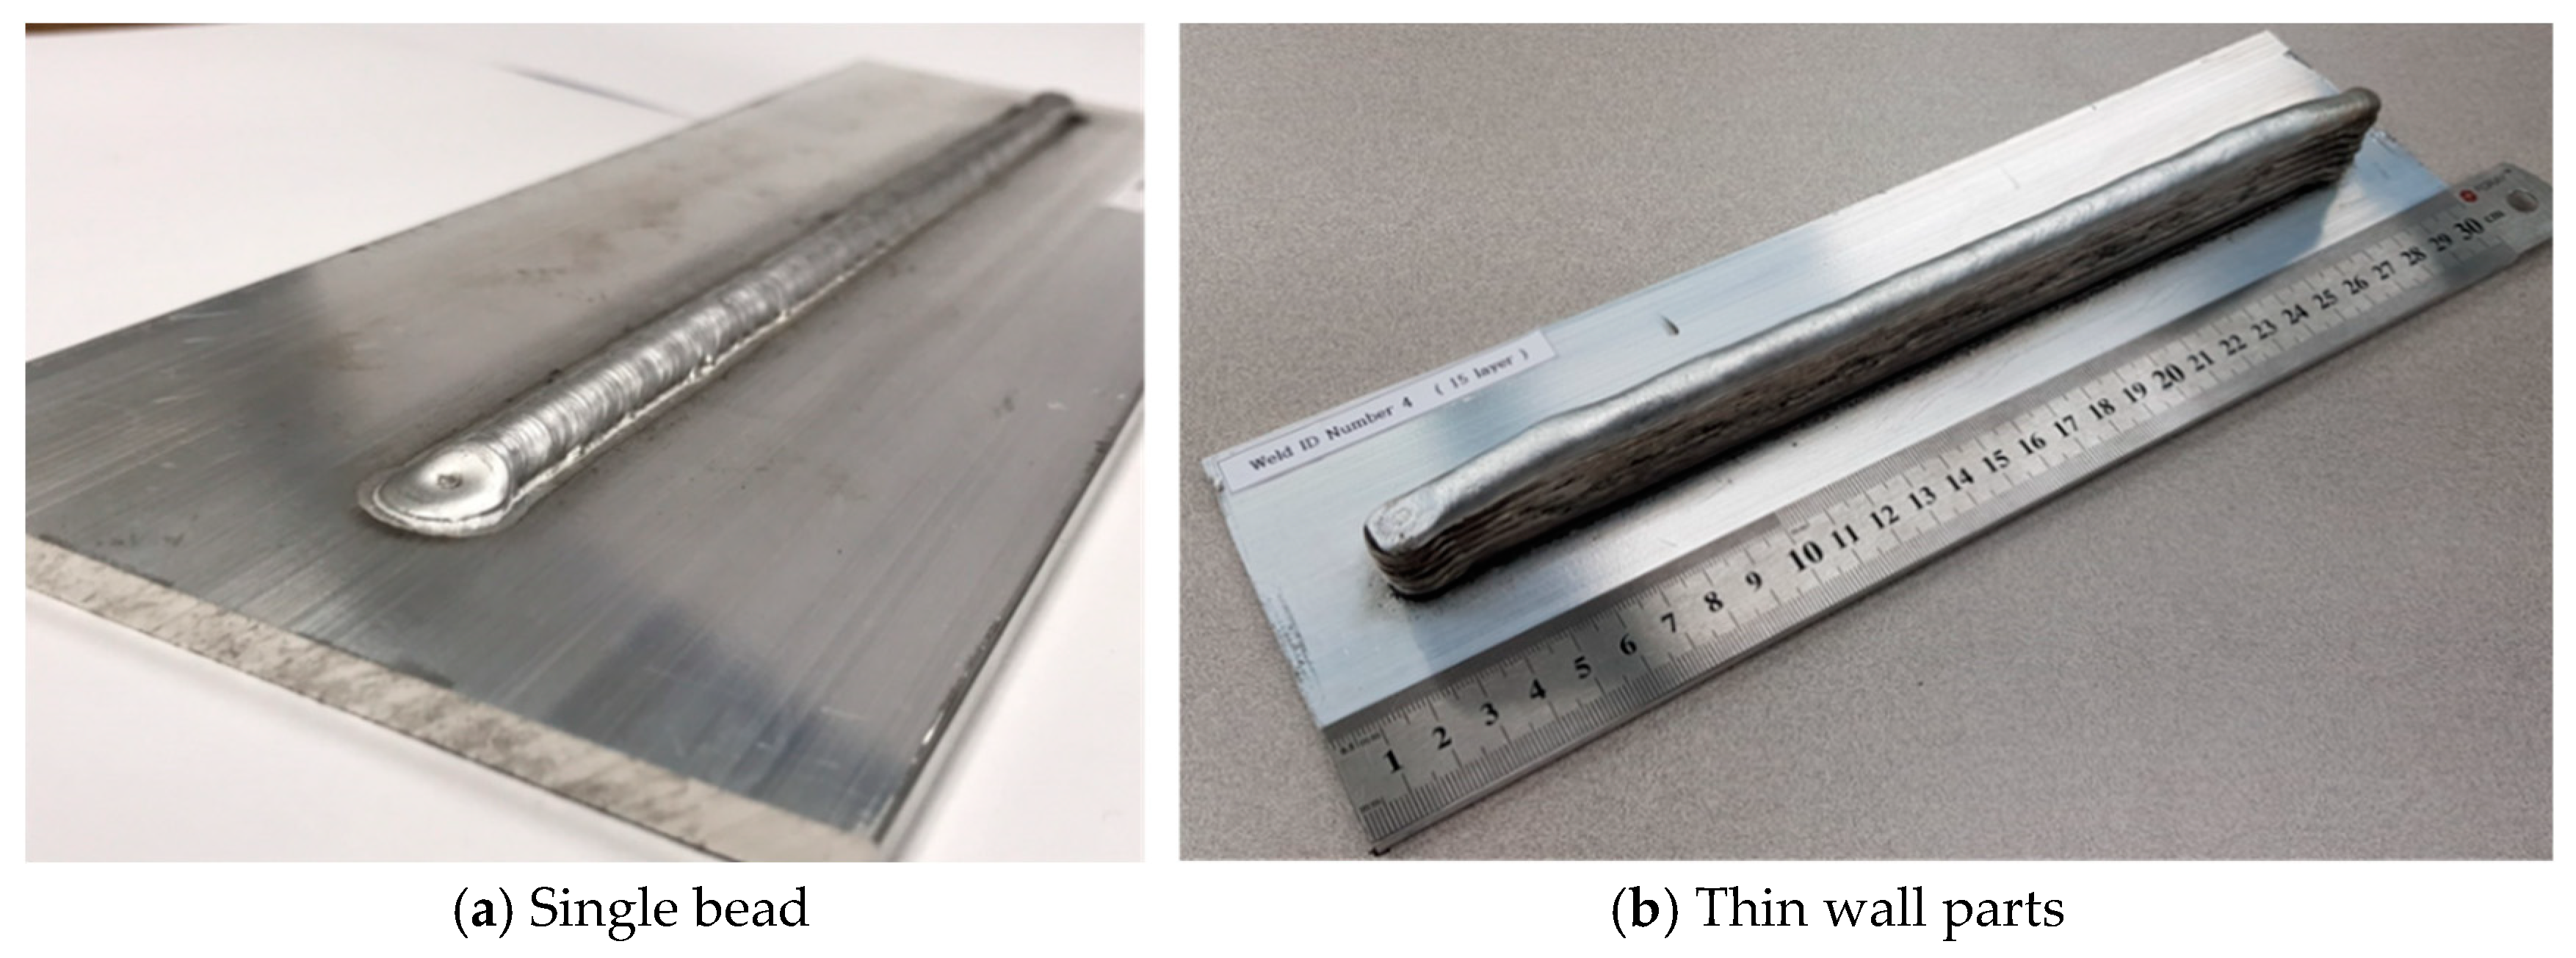
A total of nine conditions were used for the single-bead experiment and to produce the thin-wall parts. To analyze the geometry of the cross-section, the part was cut into the cross section from the center of the test piece. Polishing and etching were performed to closely observe the geometry of the cut section.
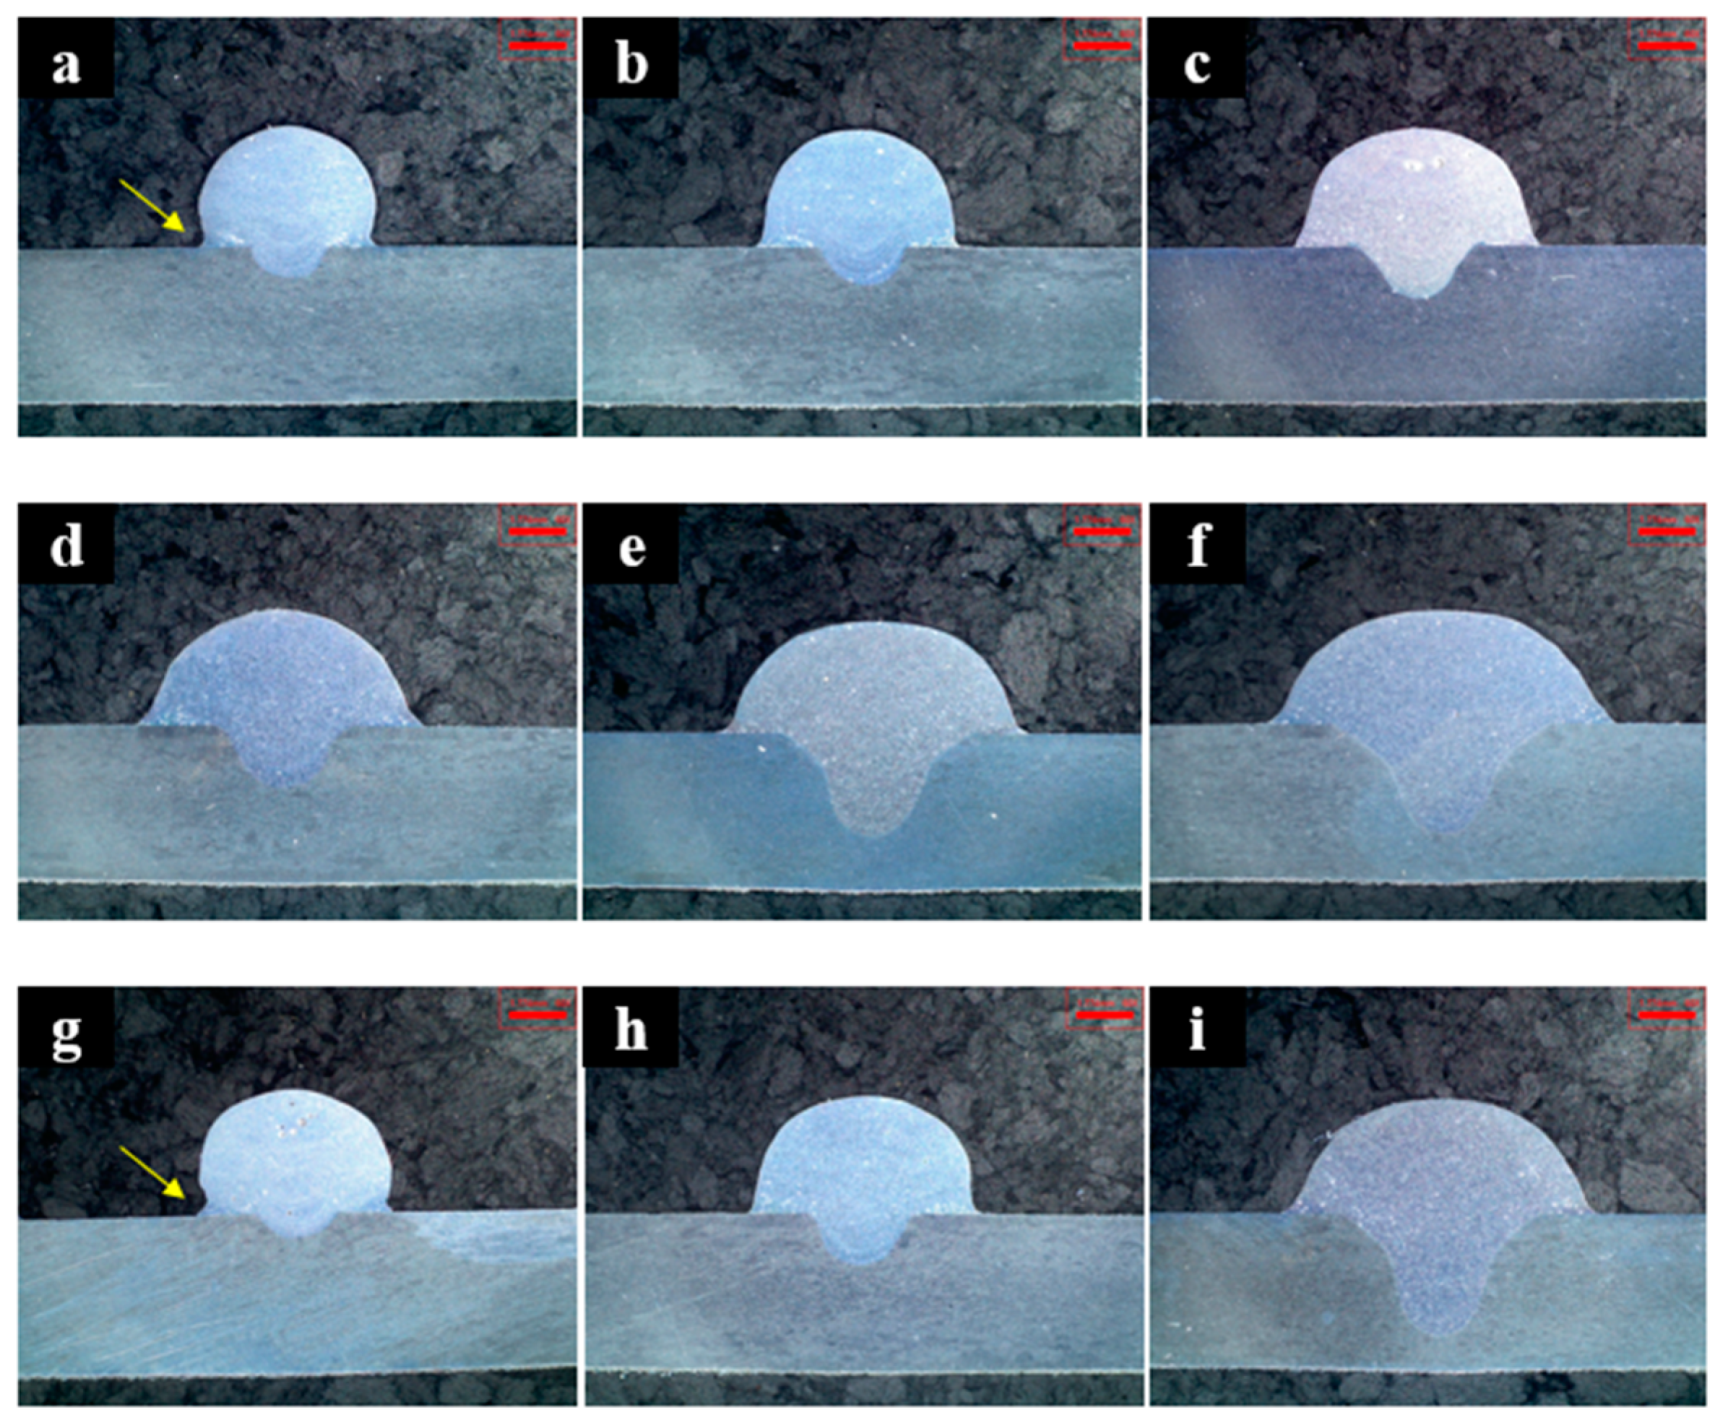
Figure 3 shows the geometry of a single bead and the cross-sectional geometry of the thin-wall parts made from the continuous deposition of single beads. In
Figure 3a–f, the overall heat input can be seen to have increased as the wire feed amount increased sequentially. The wire feed amount and the heat input (Q) had a proportional relationship [
22]. In this study, the synergy line of the CMT welding process was used, and the amount of heat input was controlled by controlling the wire supply speed under the conditions provided. In addition, the current and voltage ratio was controlled by finely modifying the arc length. While the heat input per wire feed amount was kept constant at 0.5 to 0.59 kJ, the geometry of the beads was different. The geometry of a single bead affects the geometry of the beads that are deposited continuously; thus, the geometry of a single bead was closely observed to analyze this relationship.
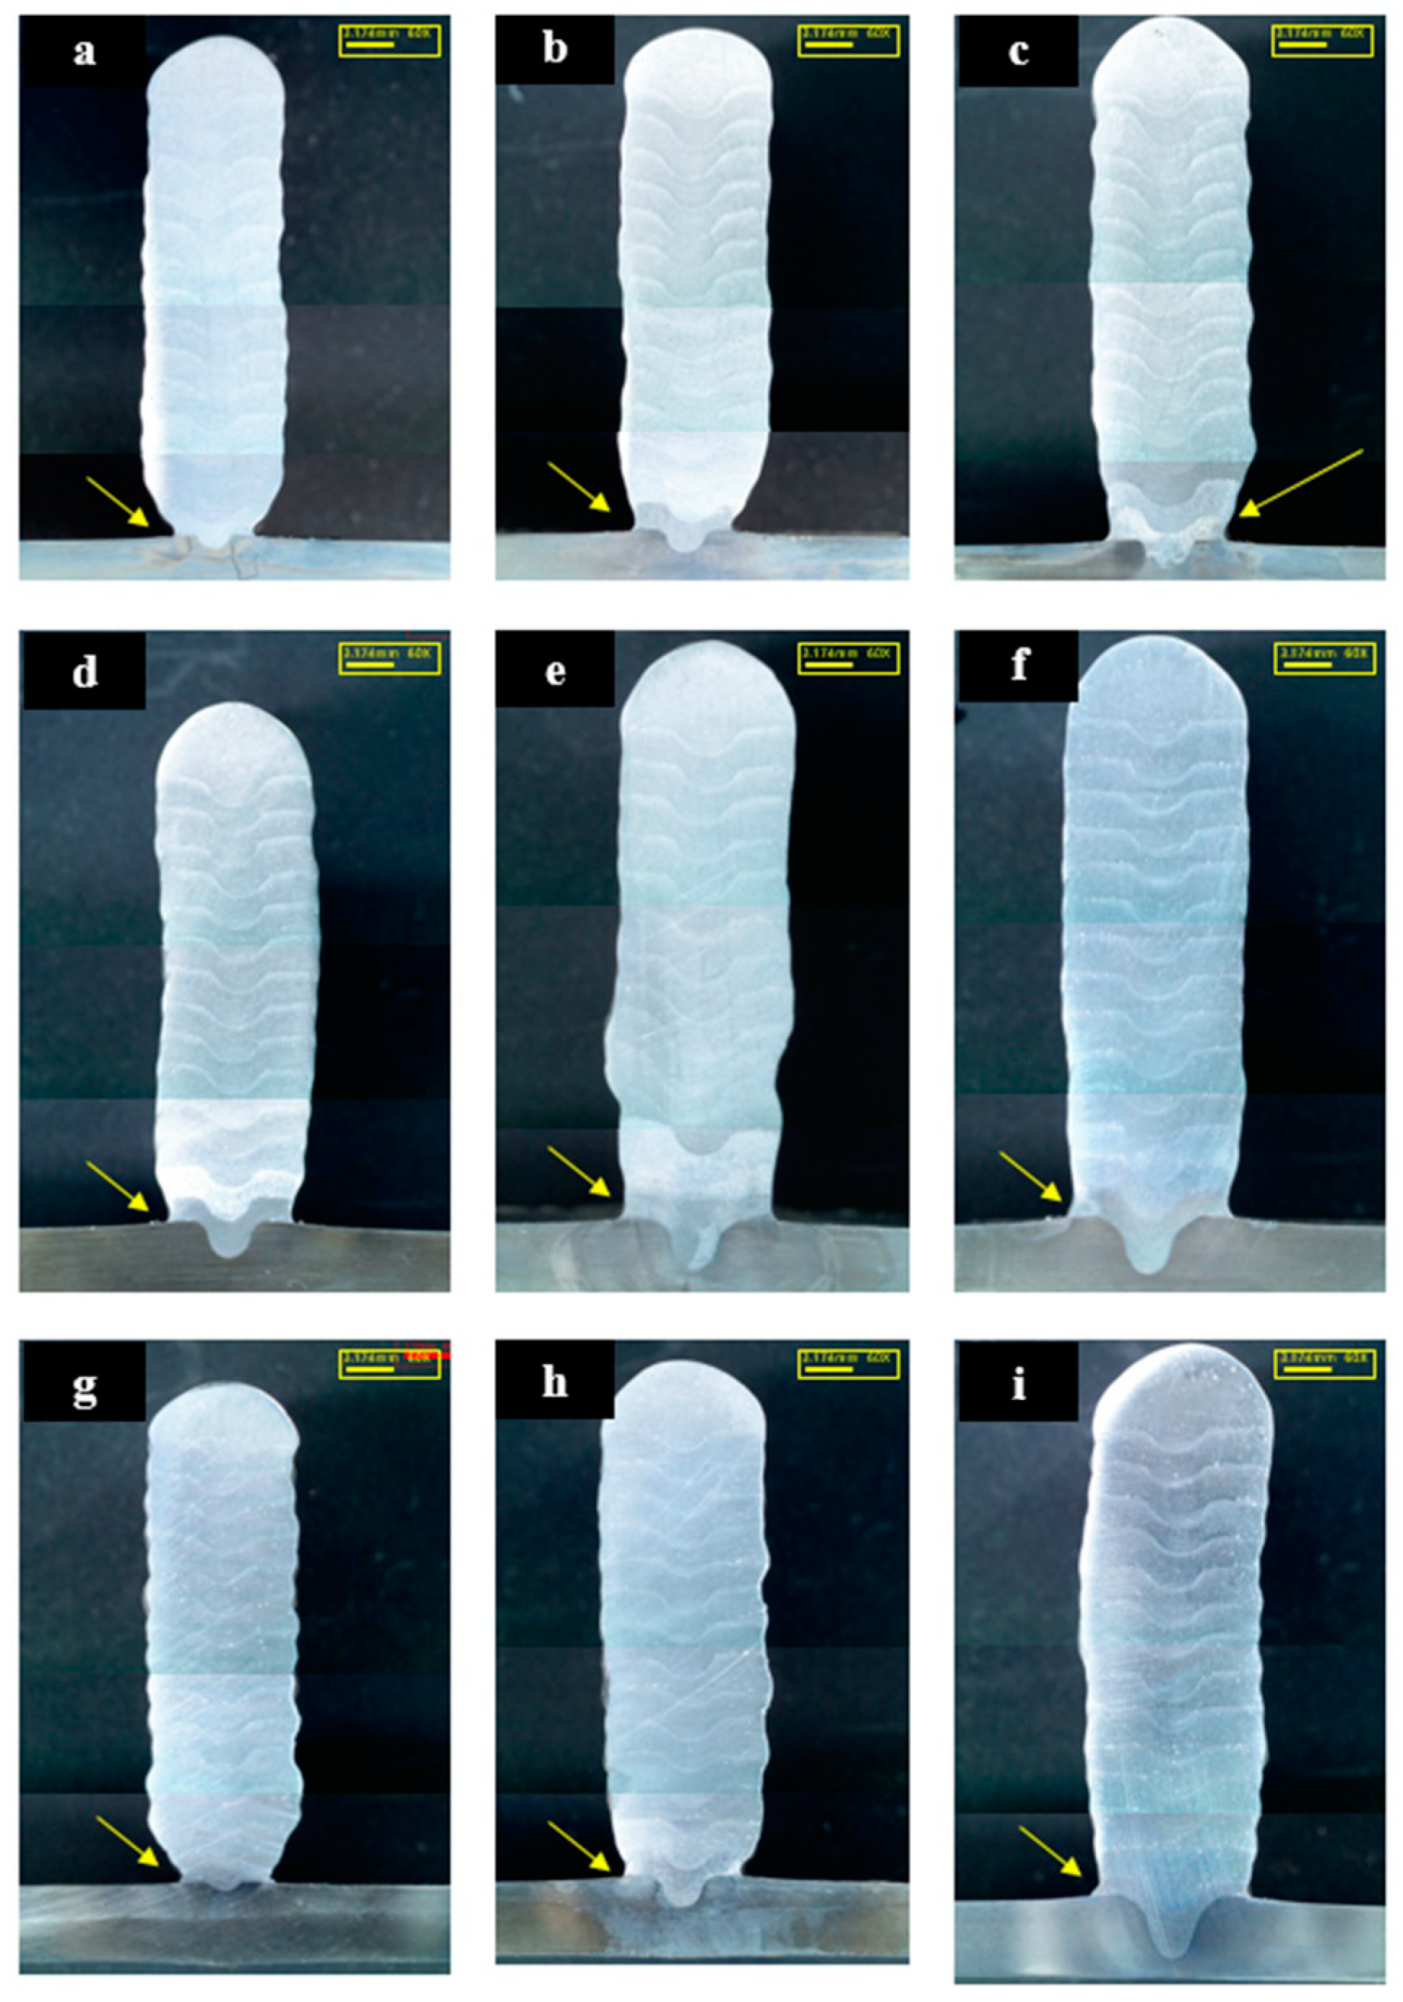
Figure 4 shows the results of continuous deposition experiments under the conditions shown in
Table 1. It was found that the continuously deposited thin-wall parts had a narrow bead width at the root position, and a wall with a constant thickness was produced as the number of depositions gradually increased.
3.1. Effect of Heat Input Rate for Single Bead
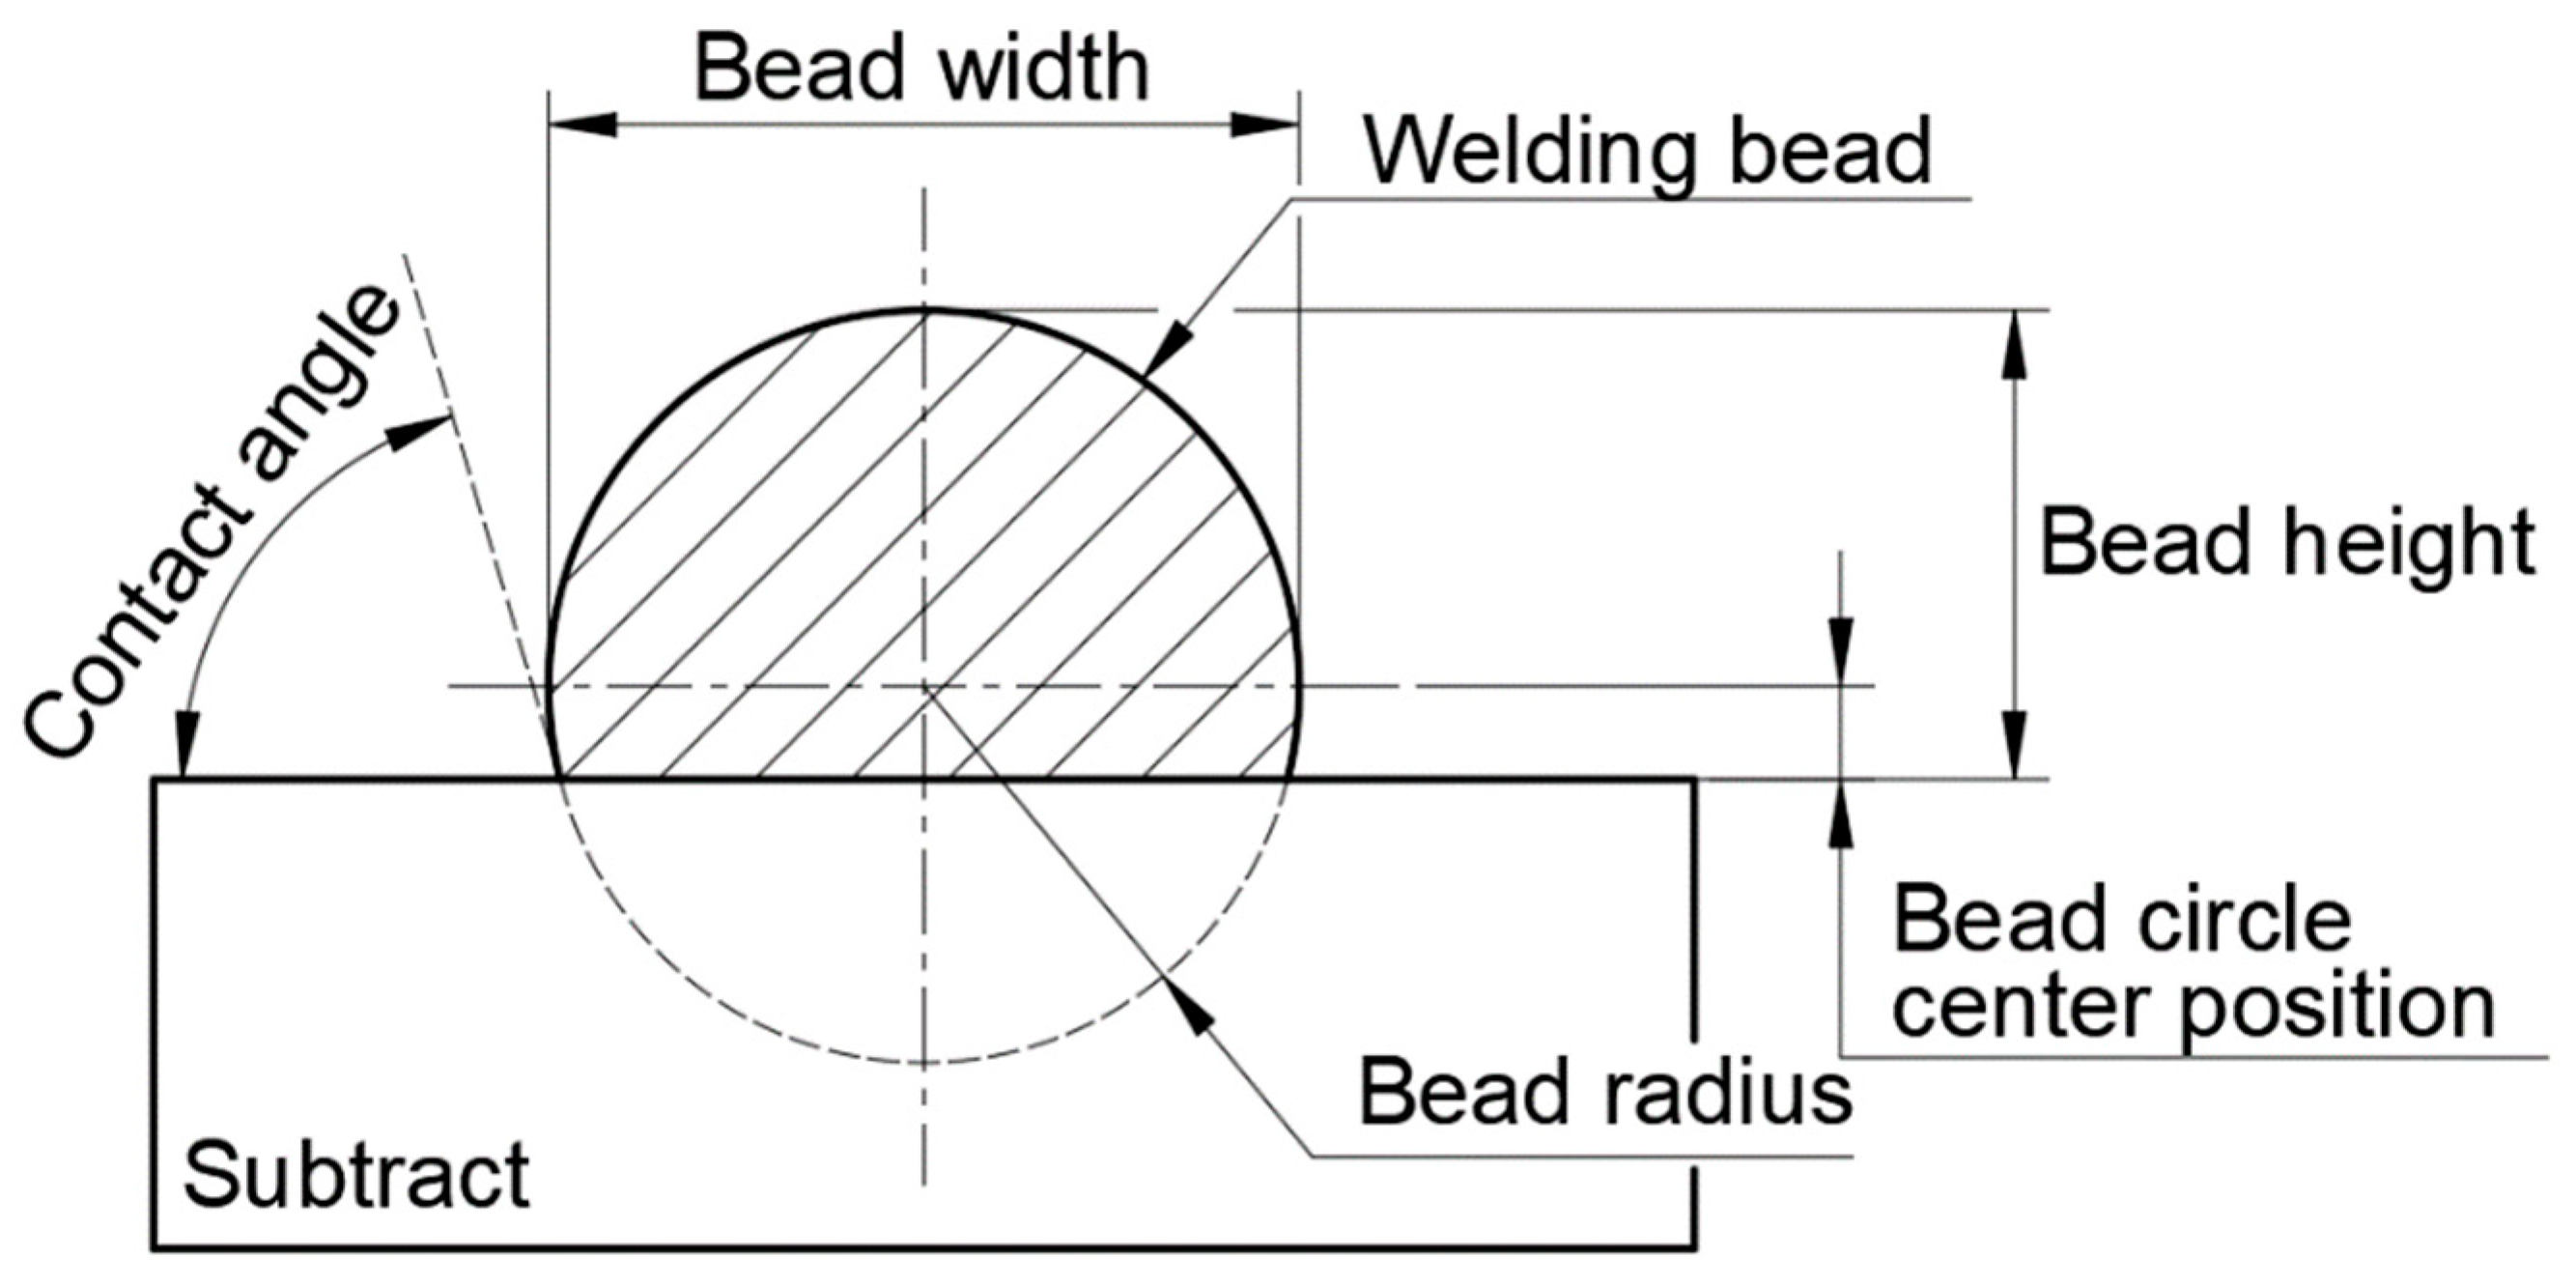
To analyze the effect of welding conditions on the geometry of a single bead, the bead width (mm), bead height (mm), contact angle (°), bead radius (mm) and bead circle center position (mm) were measured as shown in
Figure 5.
For a typical arc heat source, the heat input rate (Q) is calculated by the current (A), the voltage (V) and the welding speed (s) and process efficiency (
), and the relationship is shown in Equation (1).
Measurements of the changes in bead geometry parameters due to changes in the heat input (calculated by Equation (1)) were recorded.
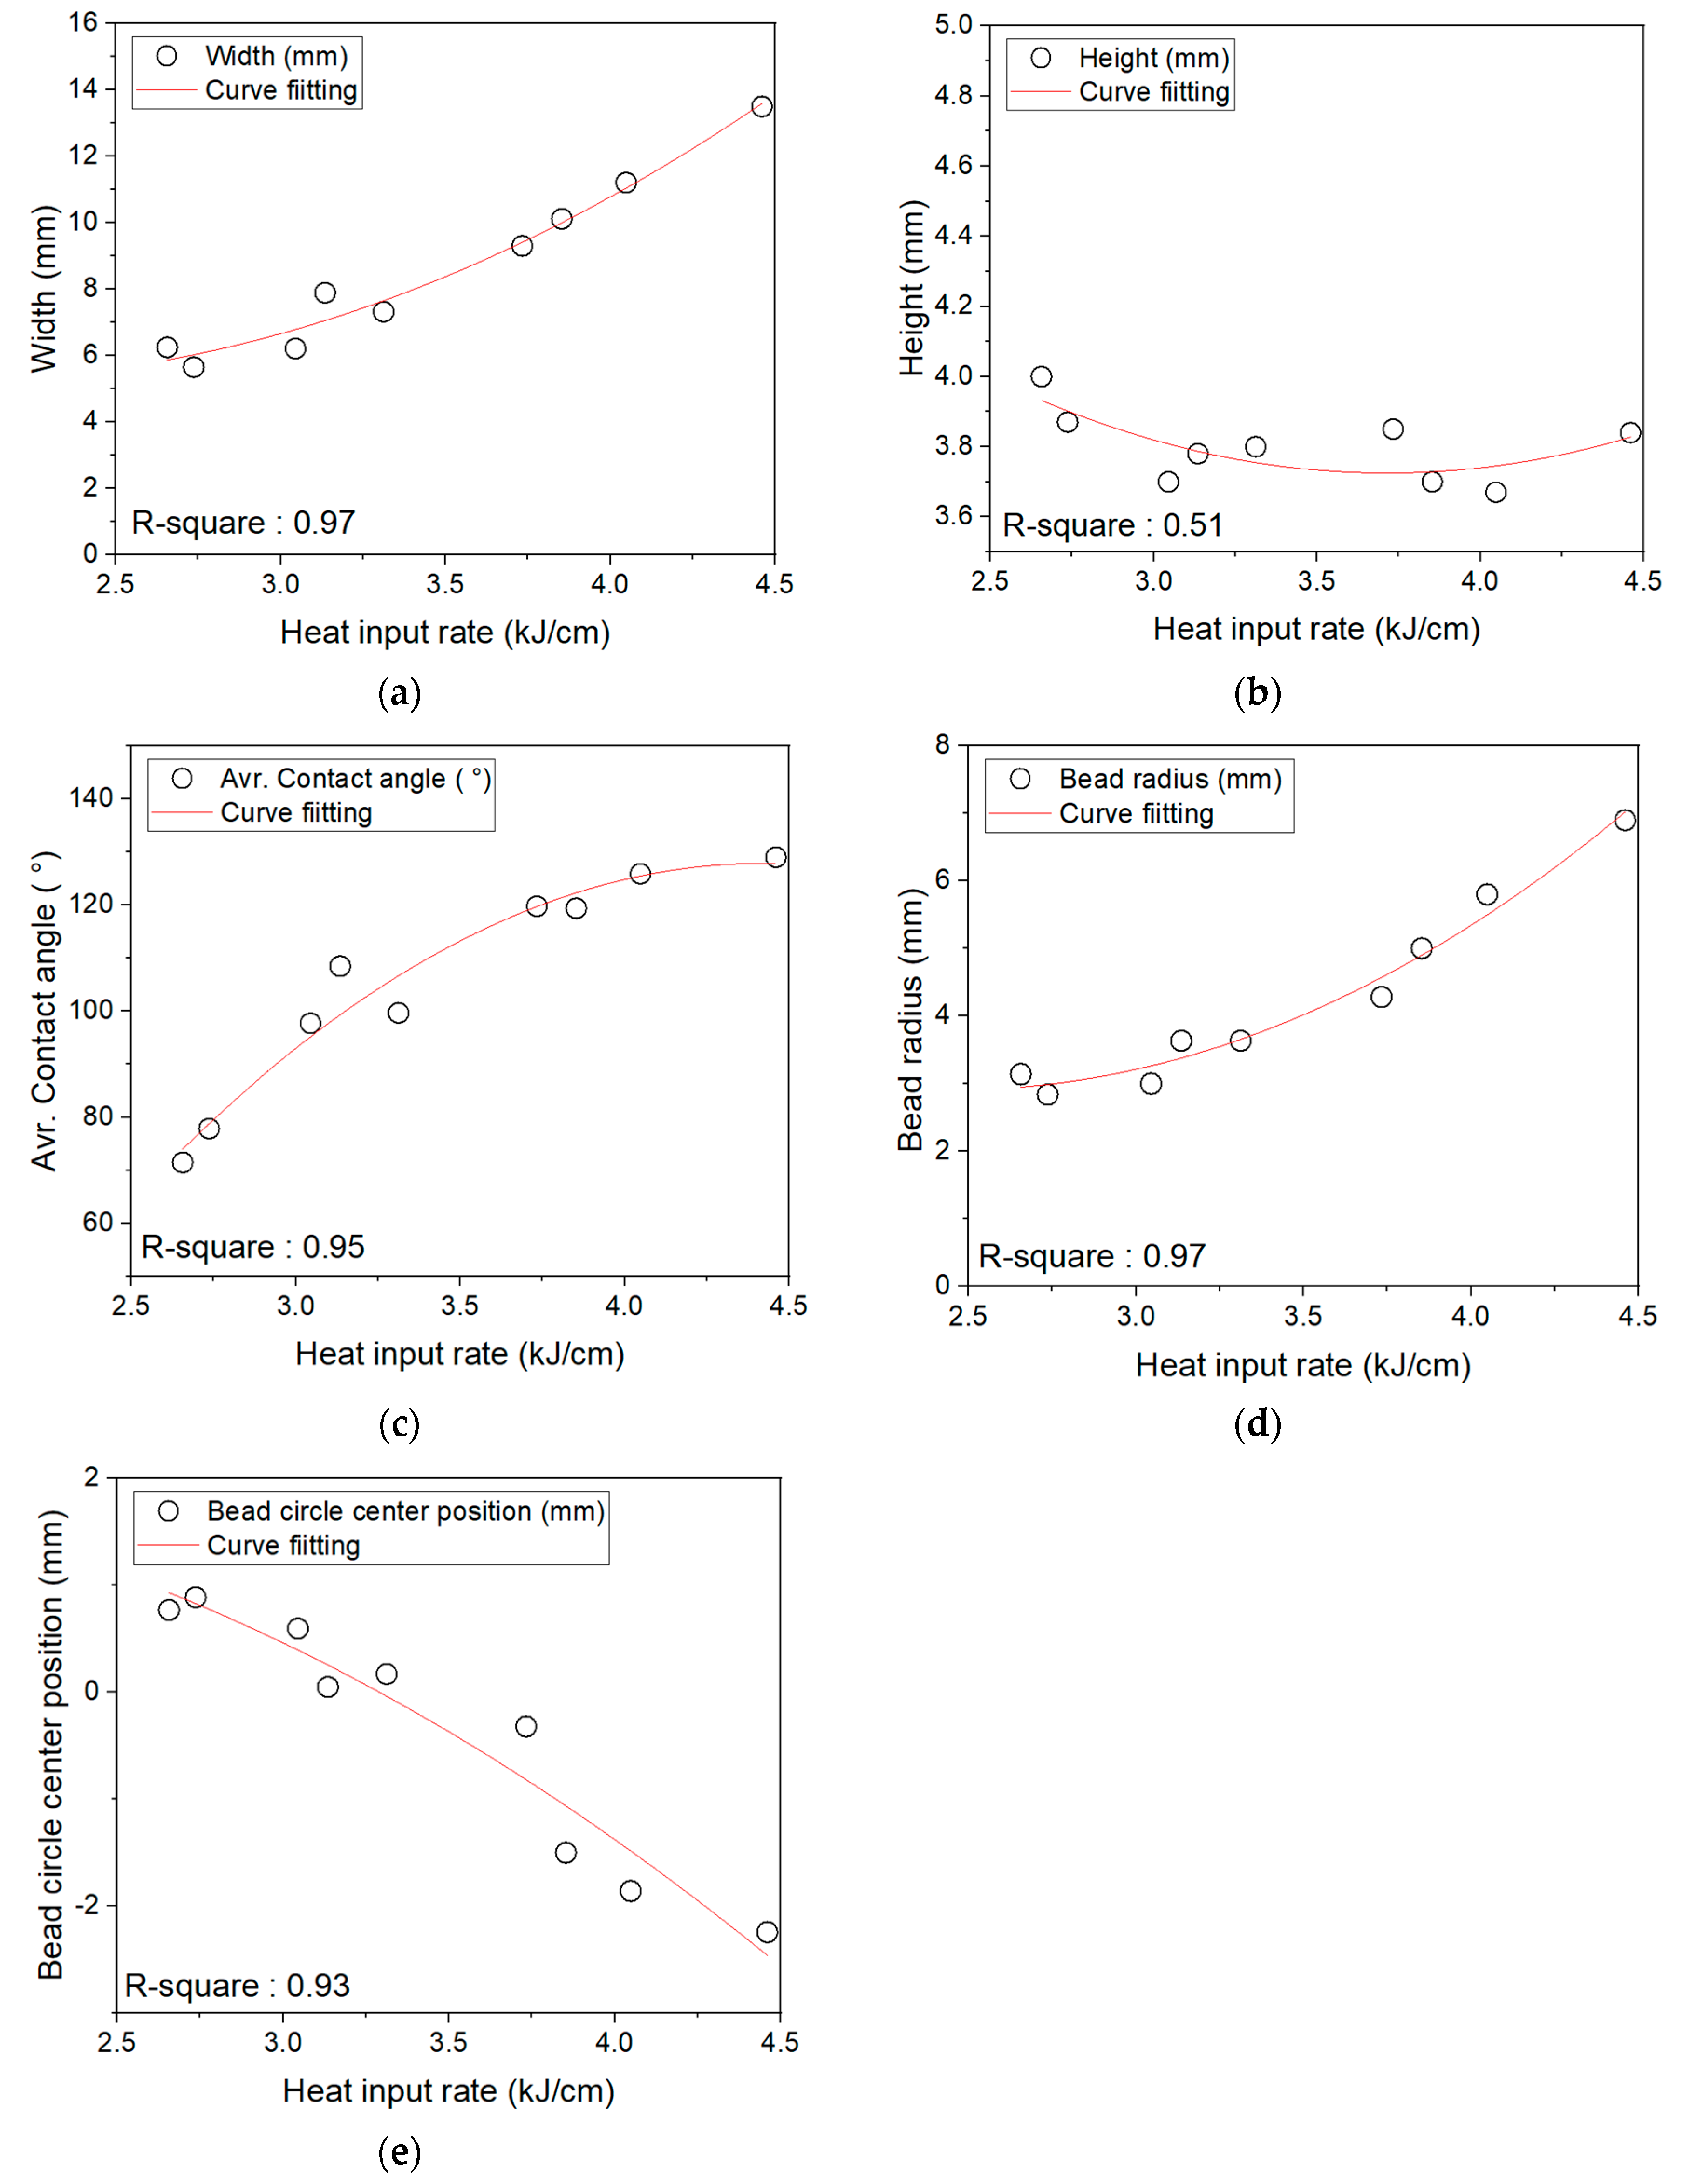
Figure 6 is a graphical representation of the bead geometry according to the heat input rate. Curve fitting was performed to clearly analyze the correlation between the heat input and bead shape. The R-square of the bead height for the heat input was 0.51, and the correlation between the heat input and the bead height was very weak. The R-square of all other output variables was 0.9 or higher, indicating a strong correlation.
Figure 6a proves that the heat input and the bead width are proportional; as the heat input increases, the bead width continuously increases. Furthermore, the heat input and the wire feed amount is proportional; increasing the wire feed amount means that the bead size increases, so the bead width also increases. The bead radius increases as the wire feed amount increases. It was observed in our experiment that the amount of welding metal increases as the wire feed amount increases.
However, as shown in
Figure 6b, the bead height cannot be easily explained in terms of heat input. No regular change in bead height was observed despite changes in heat input. However, the reason for the change in bead height when the heat input is 2.5 kJ/cm is higher than that of 4.5 kJ/cm seems to be that the smaller the heat input, the more heat energy is used to melt the wire rather than the base material. One of the pieces of evidence that can explain this is that, as shown in
Figure 6e, the lower the heat input, the higher the center of the circle (that may represent a bead) from the substrate surface. When the center is positive, it means that the bead maintains a circular shape as much as possible due to the surface tension; this also means that the mixing portion in the welding metal formed by the melt substrate and wire is very small.
In addition, as shown in
Figure 6c, it is observed that the smaller the heat input, the smaller the contact angle, and the larger the heat input, the larger the contact angle. It was found that, as the heat input increased, the contact area between the base material and the welding metal increased.
3.2. Effect of Current and Voltage for Single Bead
The definition of the current and voltage ratio is shown in Equation (2). As shown in Equation (1), the heat input rate for a typical arc heat source is calculated by the current, voltage and welding speed. Here, even under conditions of the same heat input, the ratio of the voltage to the total heat input can be controlled through the precise control of the current and voltage.
In this study, we observed the difference in bead geometry caused by the difference of the current and voltage ratio at similar heat inputs through the precise control of voltage and current. The definition of the current and voltage ratio is as shown in Equation (2).
A bead geometry according to the current and voltage ratio calculated by Equation (2) was observed.
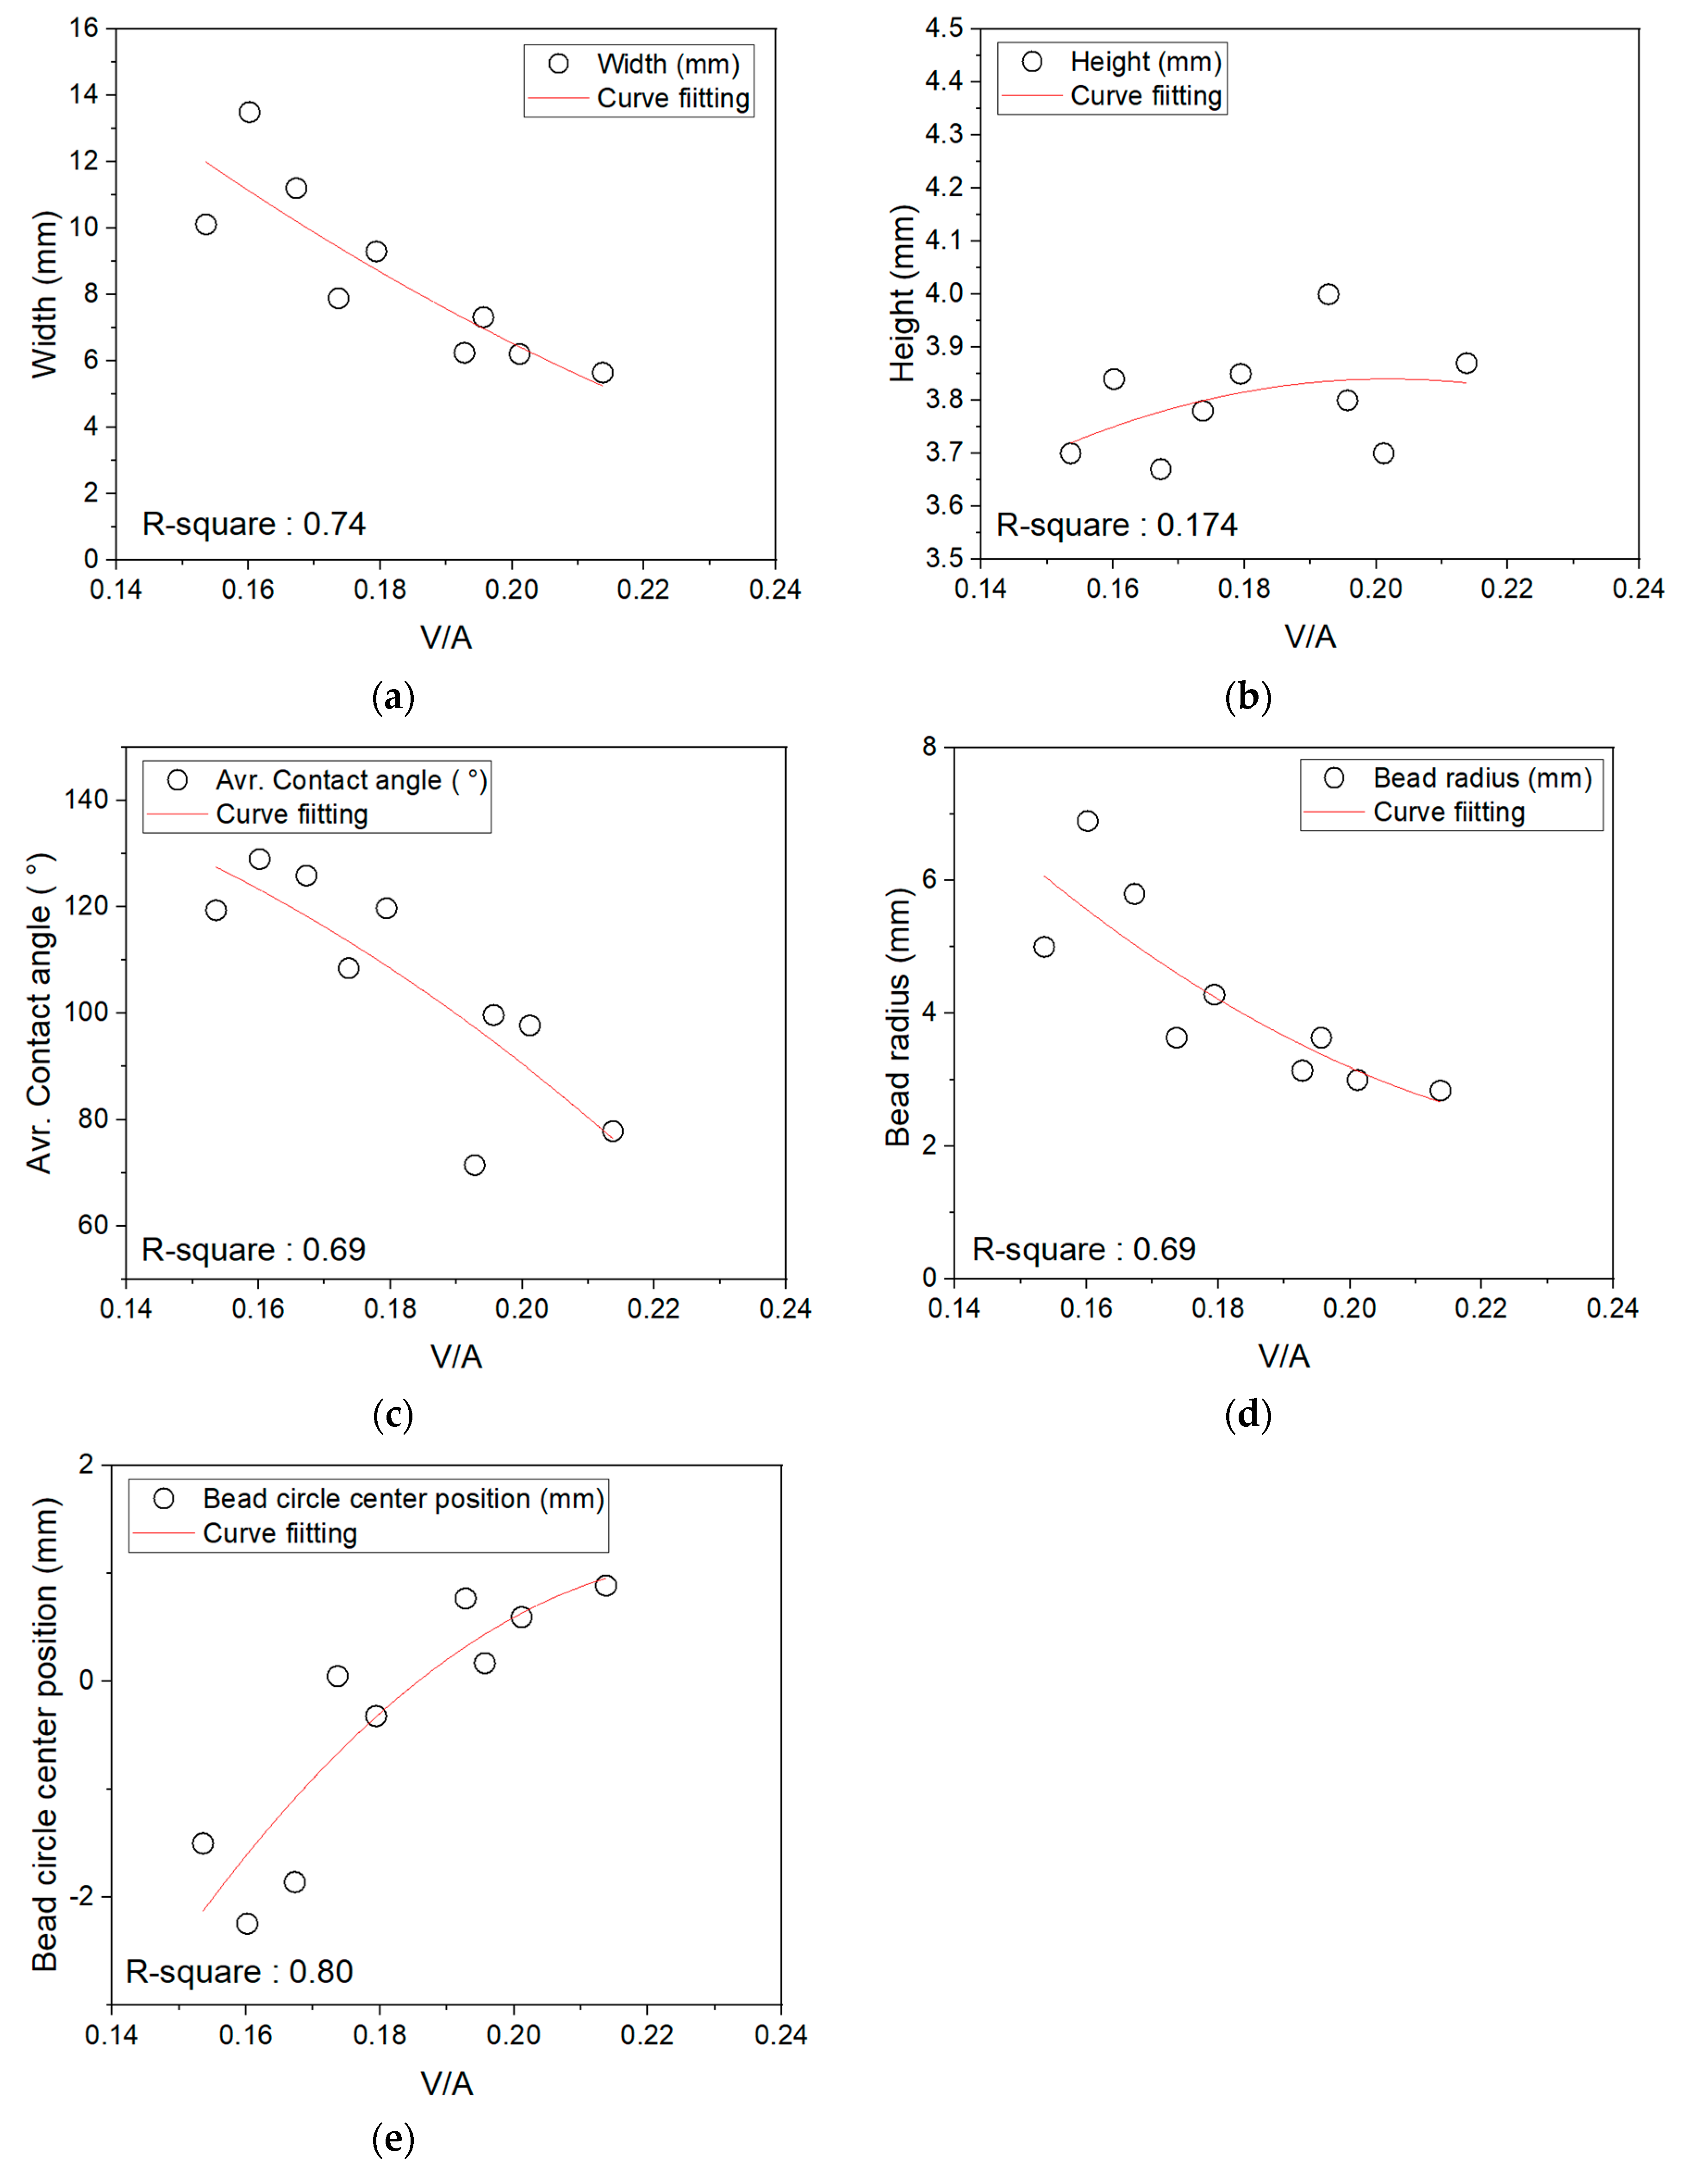
Curve fitting was performed to clearly analyze the correlation between the heat input and bead shape, as well as to clearly analyze the correlation between the current and voltage ratio and bead shape. For the current and voltage ratio, the R-square of the bead height is 0.174, and the correlation between the current and voltage ratio and the bead height is very weak. The R-square of other output variables was about 0.7 or more, which means that there is a correlation.
As shown in
Figure 7a, it is observed that the bead width decreased as the current and voltage ratio increased. The same is observed for the contact angle and radius, as shown in
Figure 7c,d. In other words, the larger the portion of voltage in the total heat input, the smaller the bead width and the smaller the overall bead size, and the area fused to the base material becomes smaller. As shown in
Figure 7a,c,d, the opposite pattern appears when the heat input is increased. For the bead height, the difference caused by the change of the current and voltage ratio is very irregular, and so it is difficult to infer any trend. As shown in
Figure 7e, the position of the bead center is elevated gradually from the substrate surface as the current and voltage ratio increases. The reason why the bead center is elevated can be explained by the contact angle. As the portion of the voltage in the total heat input increases, the contact angle decreases and the bead geometry becomes closer to a circle. The closer the bead geometry is to a circular geometry, the more the area directly melted with the base material decreases, and so the deposition efficiency decreases.
Effect of Temperature
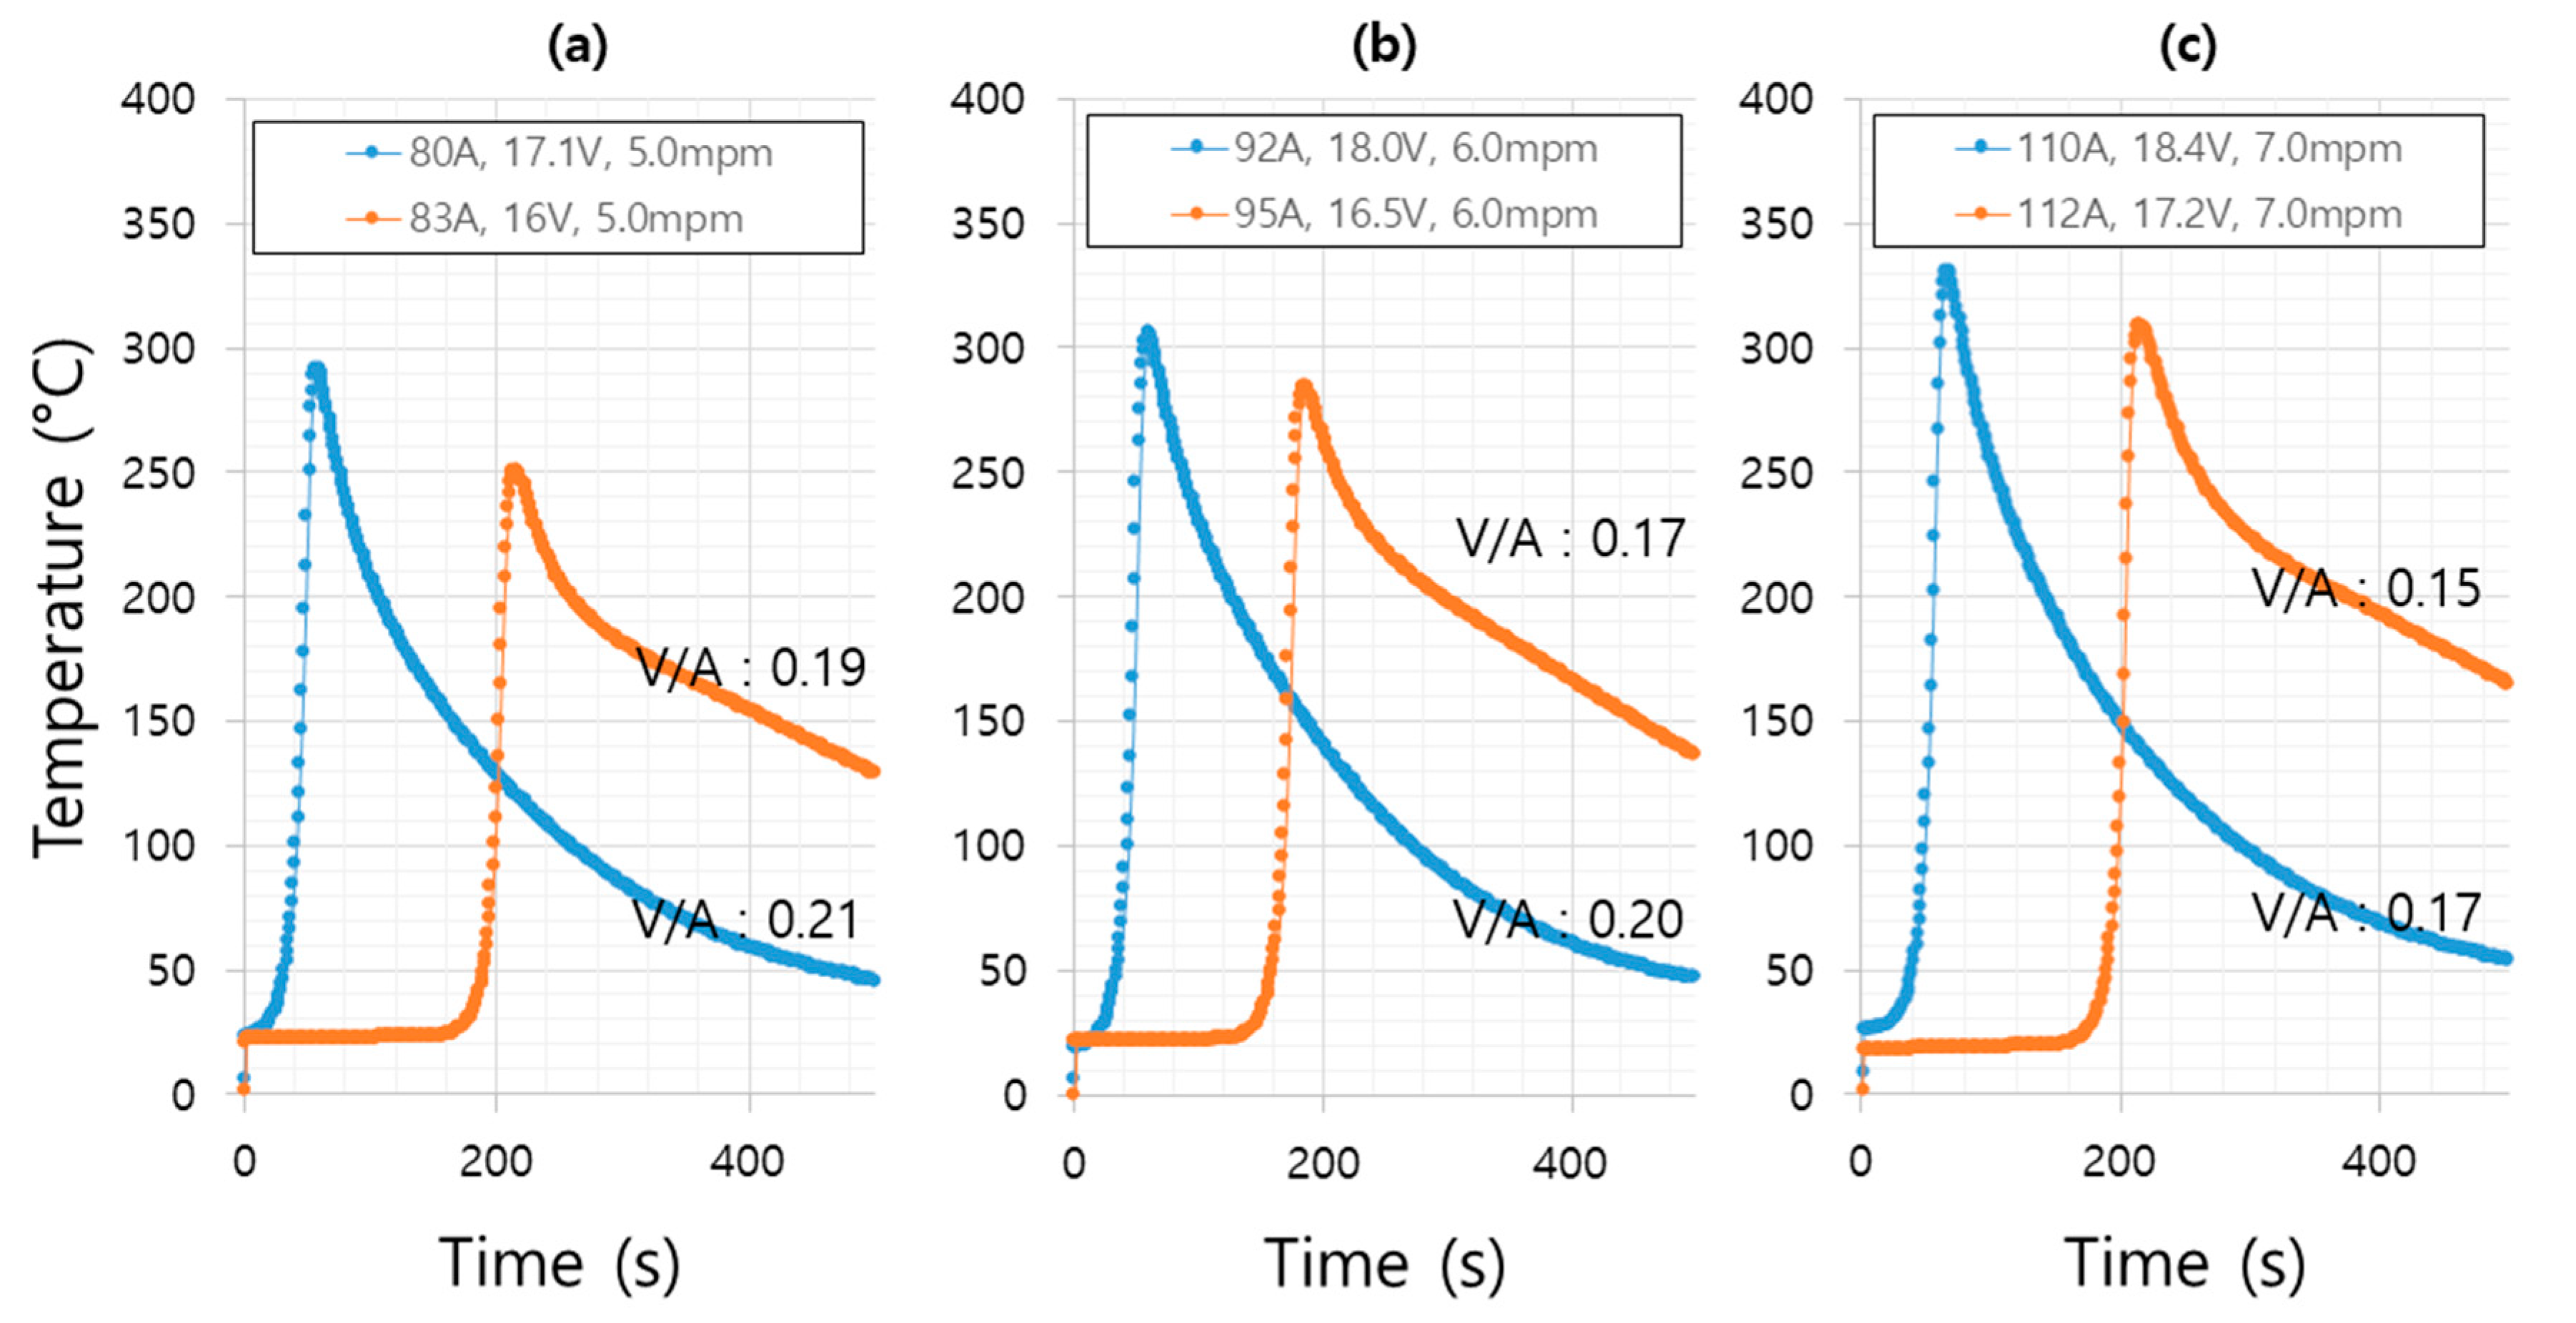
In similar heat input conditions, the change of the current and voltage ratio affects the maximum temperature of the base material (substrate).
Figure 8 shows the change in temperature of the base material when the total heat input is similar and the current and voltage ratio is different. In
Figure 8a, the total heat input is similar at 2.736 kJ/cm and 2.656 kJ/cm, but the temperature of the base material changes due to the difference in the current and voltage ratio.
Figure 8b,c shows the temperature change caused by the decrease of the current and voltage ratio under similar heat input conditions. The decrease of the current and voltage ratio decreases the heat input rate delivered to the base material. In other words, as the portion of the voltage in the total heat input increases, the energy delivered to the base material decreases. The difference in energy delivered to the base material causes a difference in bead geometry during continuous deposition and affects the deposition efficiency.
3.3. Efficiency of Deposition
It was found that the geometry of a single bead, as described above, changes depending on the welding conditions (heat input, current and voltage ratio), and the geometry of a single bead is related to the efficiency of the continuous deposition. In general, WAAM-based fabrication quickly produces a very rough geometry through the continuous deposition of a single bead, and then achieves the final geometry of a product through cutting. In the traditional subtract process approaches, such as cutting and machining, the productivity is low because of the high material loss when using a bulk material; furthermore, the cutting time is long and the lifecycle of machining tools is short. Therefore, in WAAM technology, a uniform bead geometry is critical to minimize the material loss from the cutting and machining process and to maximize economic efficiency [
23,
24,
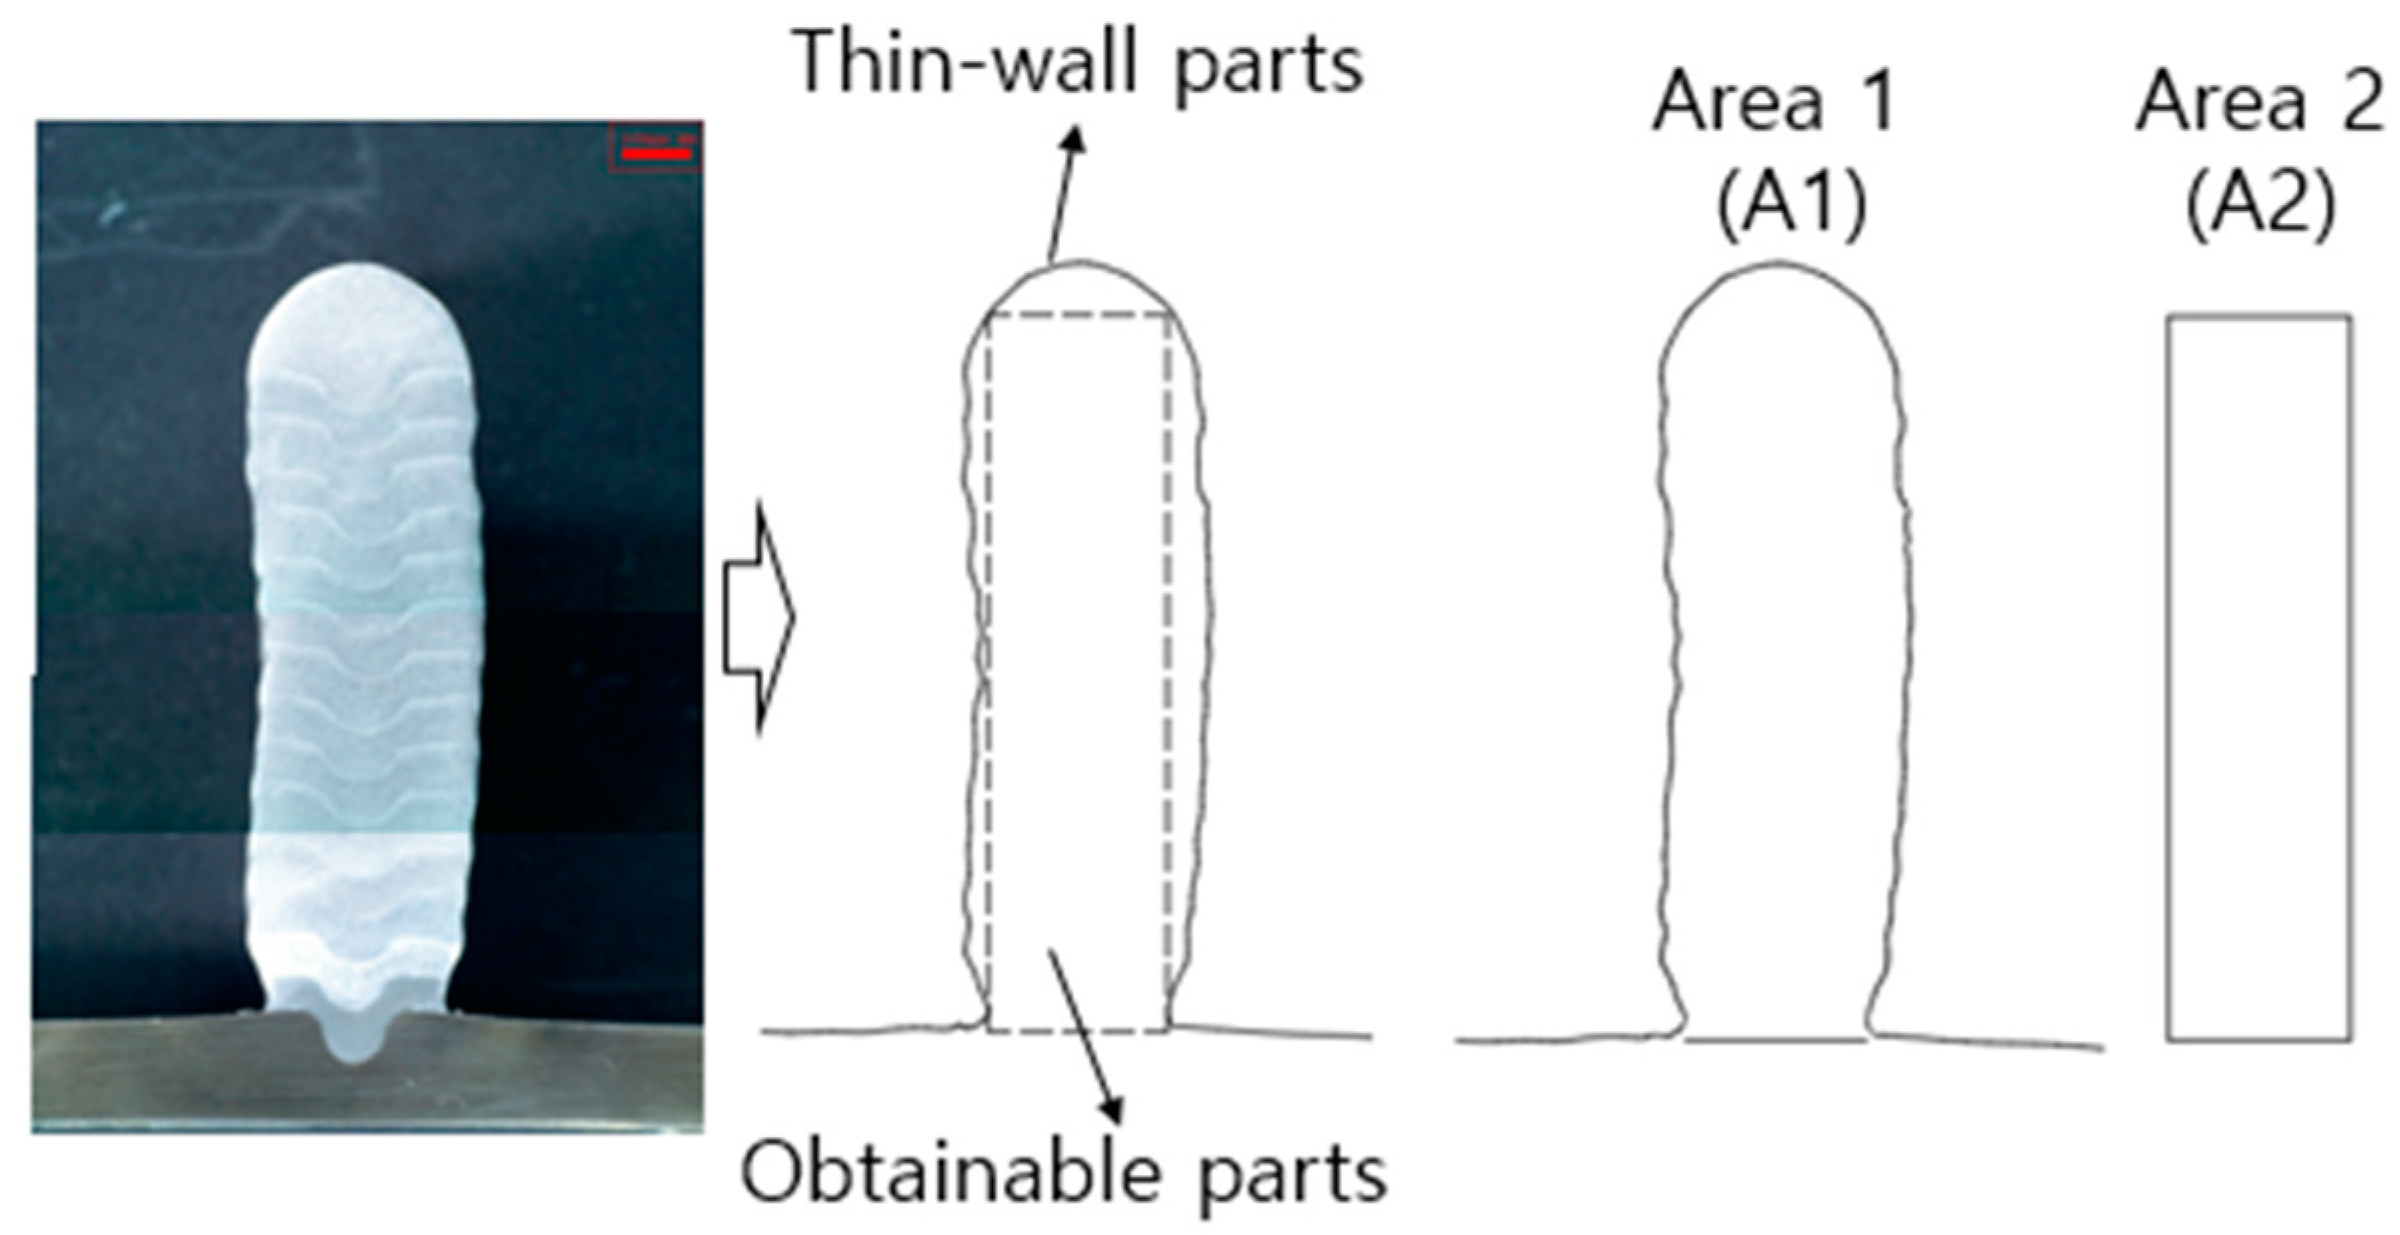
25]. In this study, to evaluate the deposition efficiency of continuously deposited thin-wall parts, the cross section of the deposited material was analyzed as shown in
Figure 9.
The deposition efficiency (
) was determined by Equation (3), where the usable area was divided by the total area; that is, the variable A1 is the cross-section area of the thin-wall parts deposited through WAAM and the variable A2 is the rectangle area obtainable from the deposited thin-wall parts. The cross-sectional profiles of the deposited thin-wall parts were measured using a 3D measuring device. The efficiency of deposition was determined by the ratio of the maximum area of the usable square to the total area of the deposited wall, from top to bottom.
3.4. Comparision of Deposition Efficiency
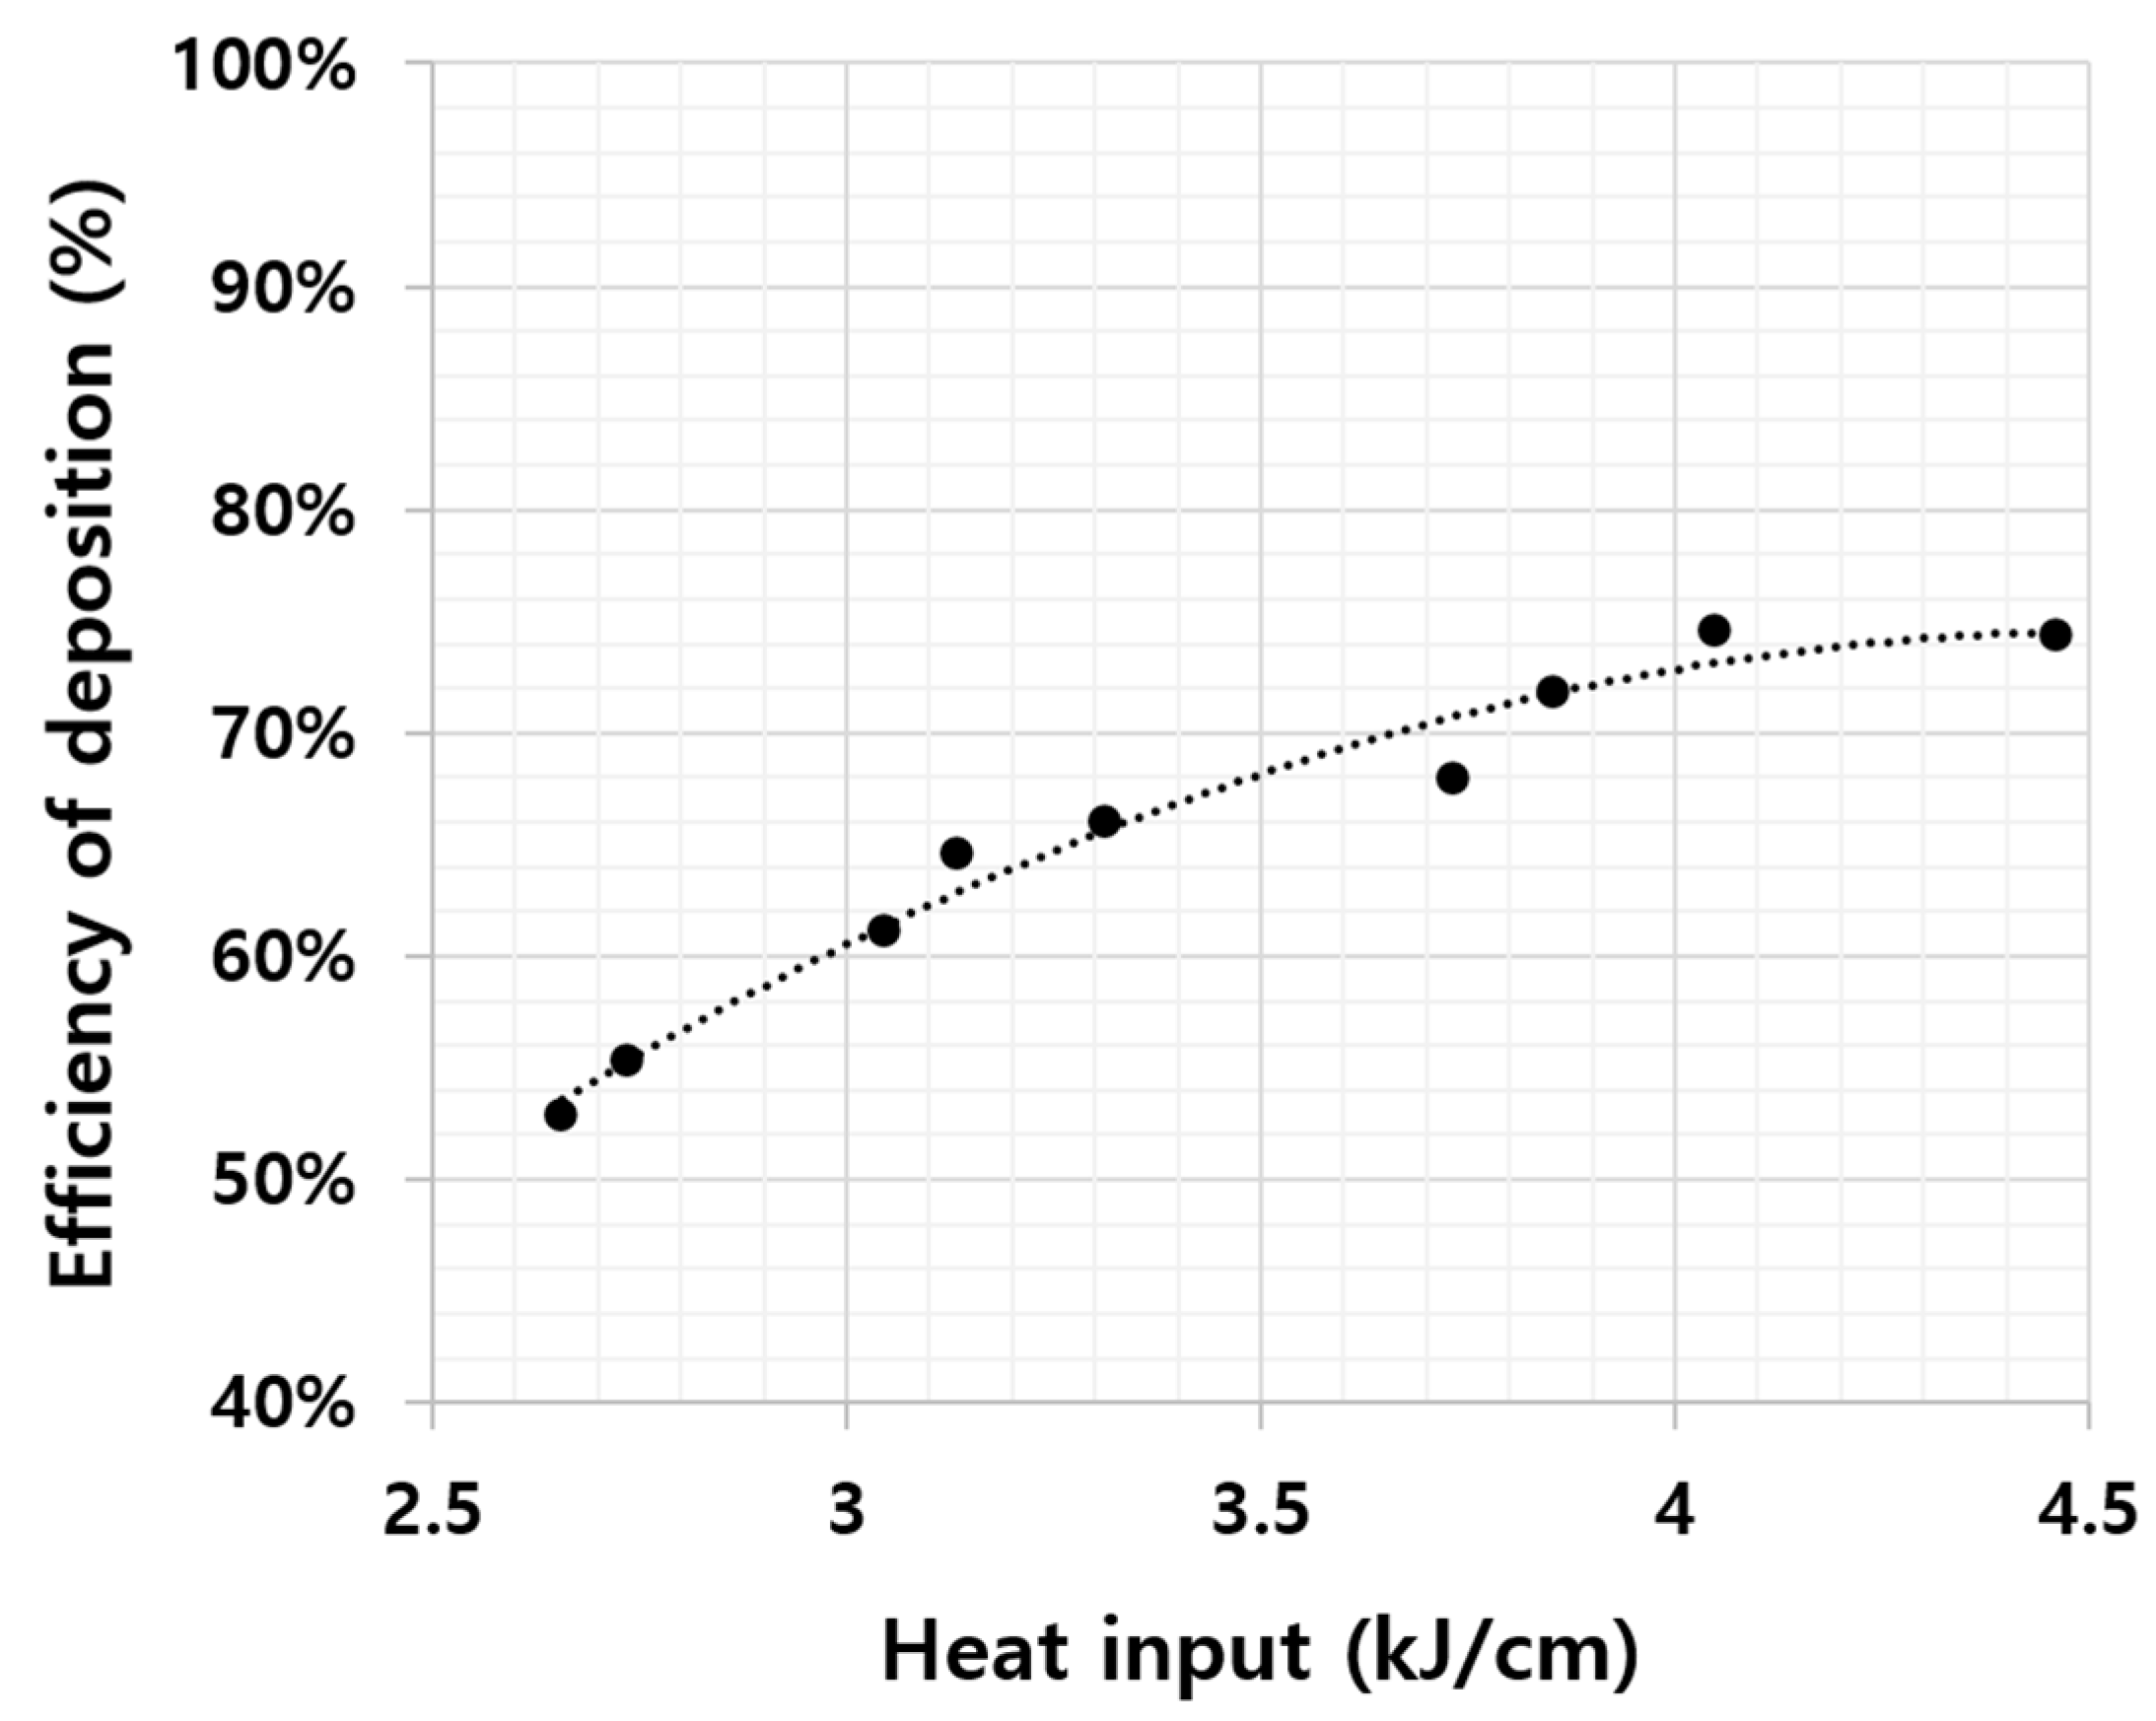
Figure 10 shows the results of analyzing the deposition efficiency according to the heat input. The higher the heat input, the higher the deposition efficiency. When the heat input is around 2.5 kJ/cm, the deposition efficiency is less than 60%. As shown in
Figure 4a, the root of the thin-wall parts is found to be very narrow compared to the body. On the other hand, when the heat input is 4.5 kJ/cm, the deposition efficiency is over 70% and, as shown in
Figure 4f, the root and body parts of the thin-wall parts have almost the same width. When the heat input is high, it is assumed that the heat source of the arc perfectly melts both the base material and the wire, so the bead width and contact angle are both increased, and this leads to increased deposition efficiency.
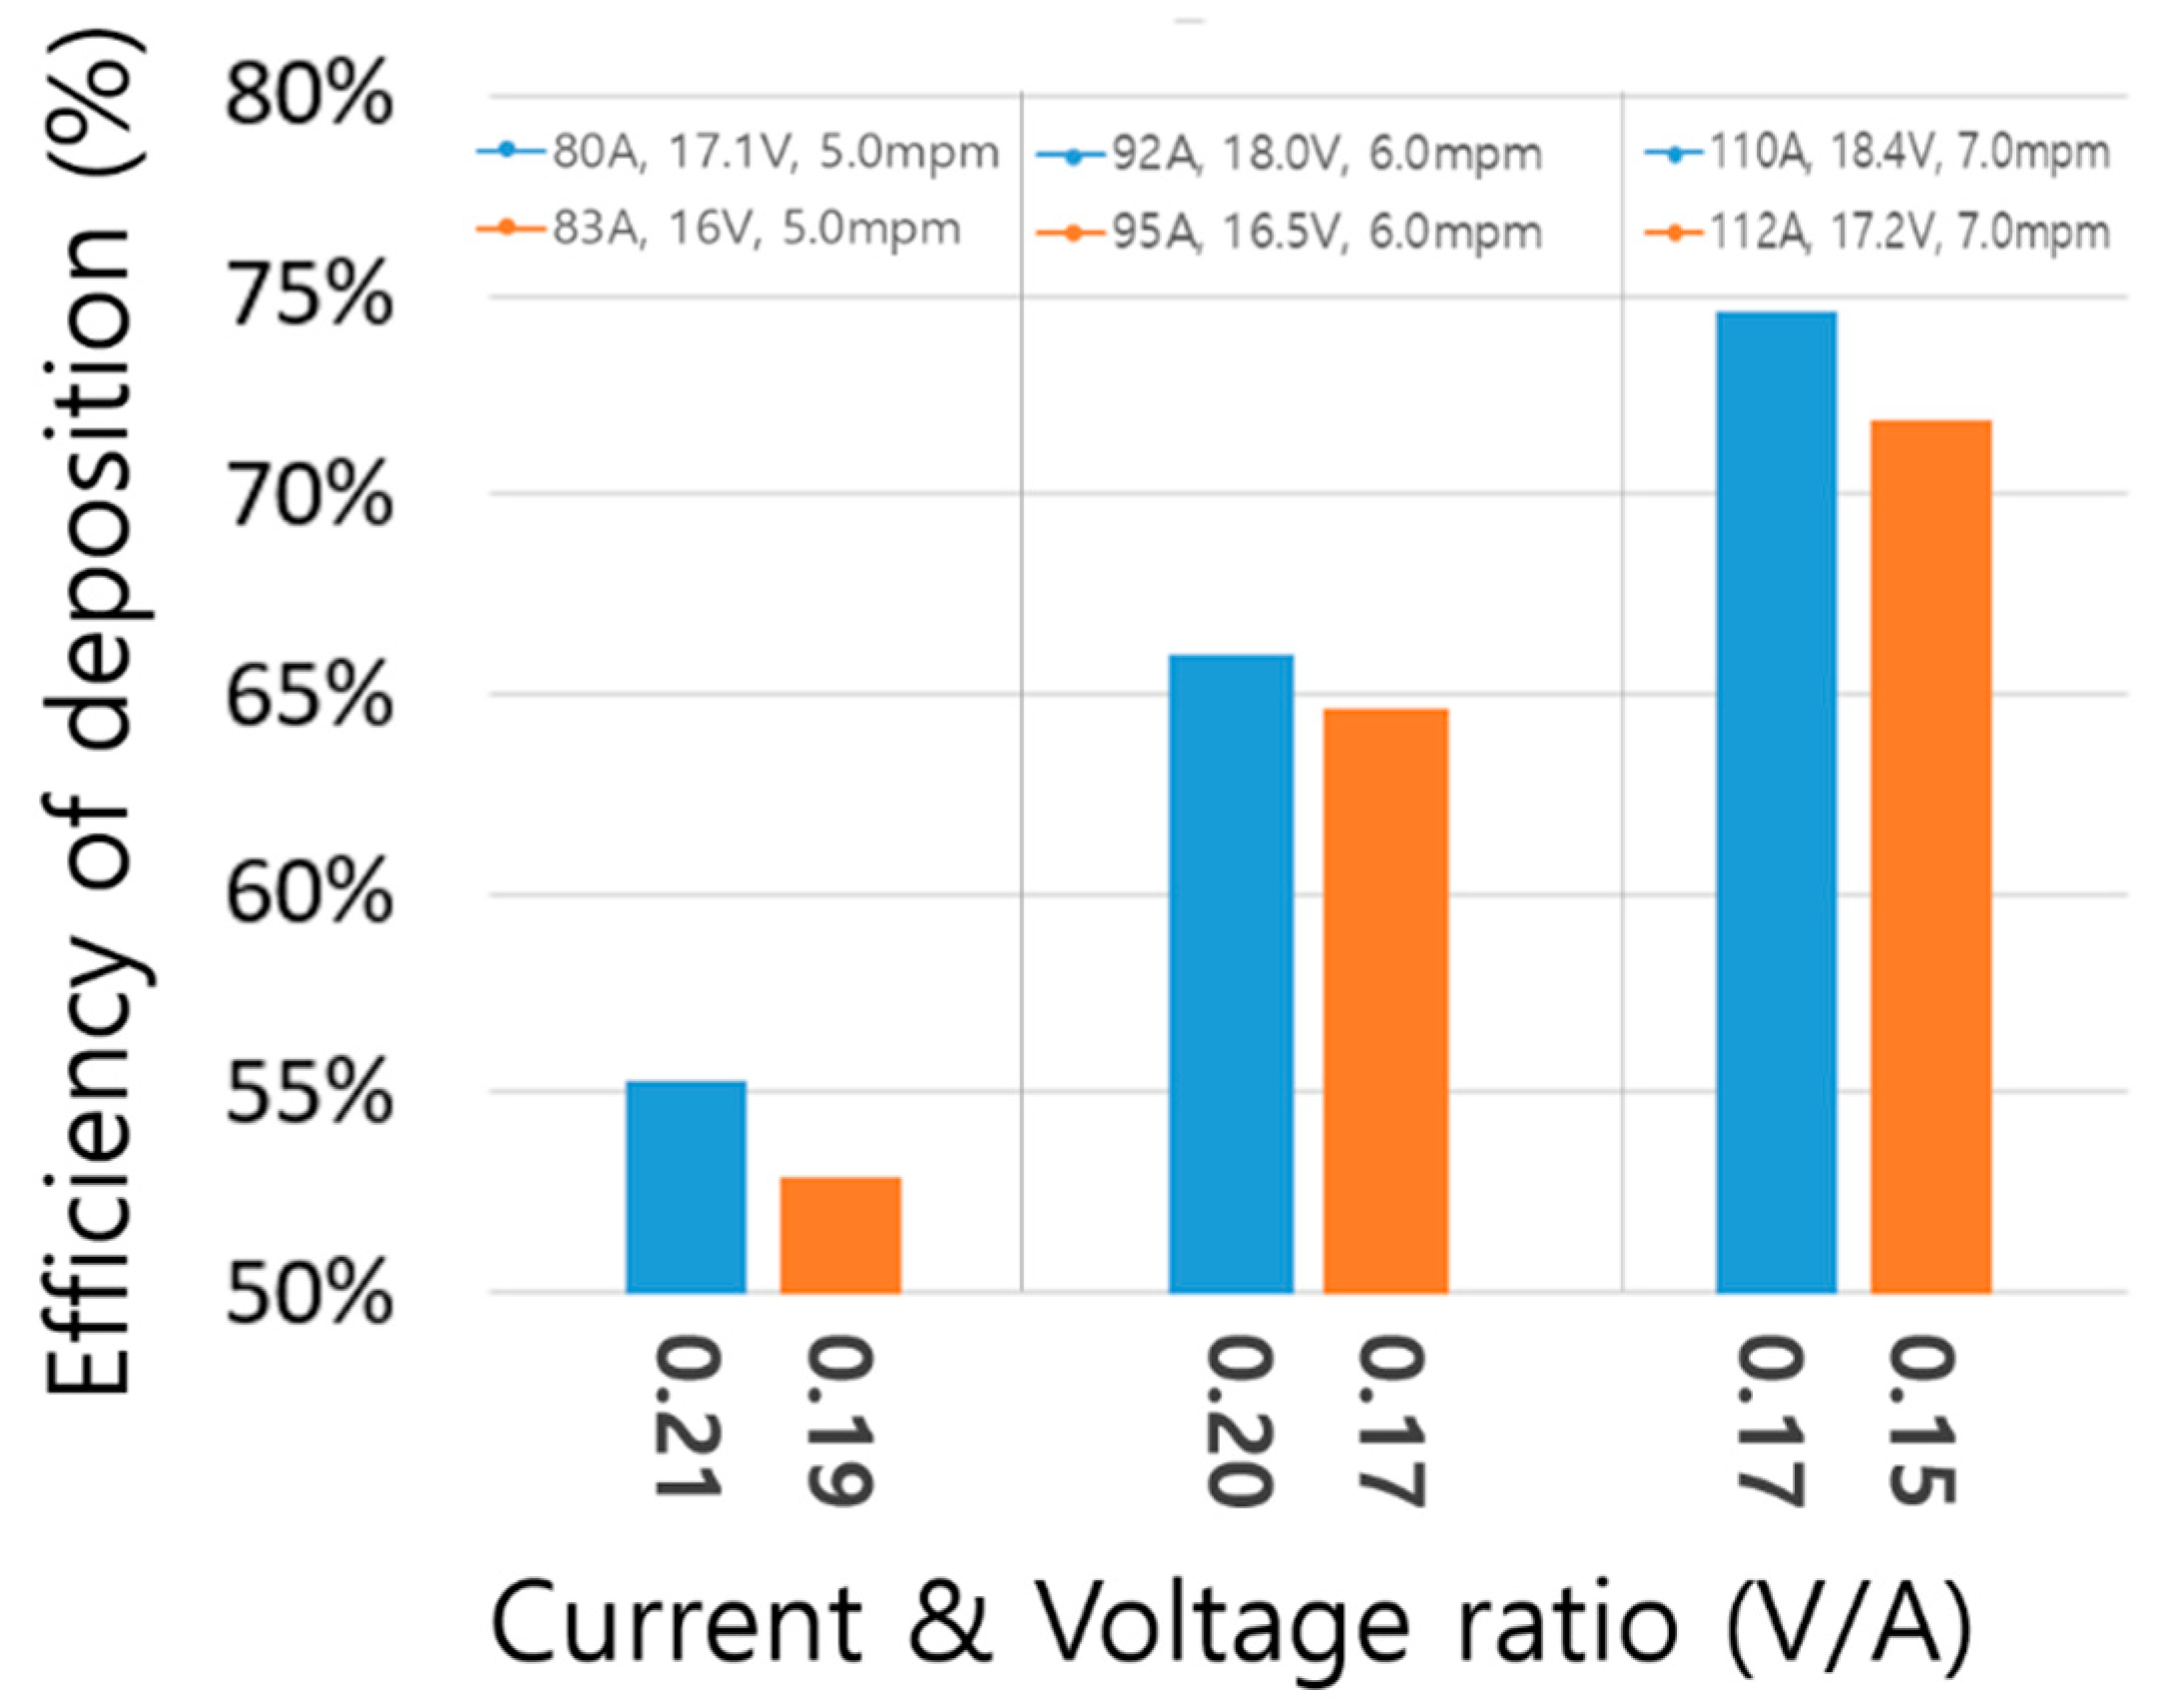
Based on Equation (3), the efficiency produced by the difference of the current and voltage ratio under similar heat inputs is compared.
Figure 3 shows three cases of efficiency degradation caused by the difference of the current and voltage ratio under similar heat inputs. The left side of
Figure 11 shows that the deposition efficiency decreased by about 2% when the current and voltage ratio decreased from 0.21 to 0.19 under the same welding conditions of a wire feeding speed at 5.0 m/min. In addition, the deposition efficiency decreased from 1% to 3% as the current and voltage ratio decreased when the wire feed speed was 6 m/min or 7 m/min each. The reason for the decreased deposition efficiency is assumed to be that the penetration depth and width of the bead decreased as the voltage decreased, and this led to the narrow root of the thin-wall parts. When the root portion of the thin-wall parts becomes narrow, the bottom surface of the square column reaches the maximum length of the root portion, although the bead width increases through continuous deposition and the resulting narrow root portion significantly affects deposition efficiency degradation.
3.5. Hardness Test Results
In order to confirm the change in mechanical properties that may occur due to the difference in the current and voltage ratio and heat input, the most easily accessible hardness measurement experiment was performed. The hardness was continuously measured from the bottom of the aluminum thin wall to the top of the substrate at 1 mm intervals. The hardness tests were performed using an HMV-G (Shimadzu, micro Vickers hardness tester, Kyoto, Japan). The experiment was performed by applying an indentation load of 490.3 mN (HV0.05) and an indentation time of 10 s.
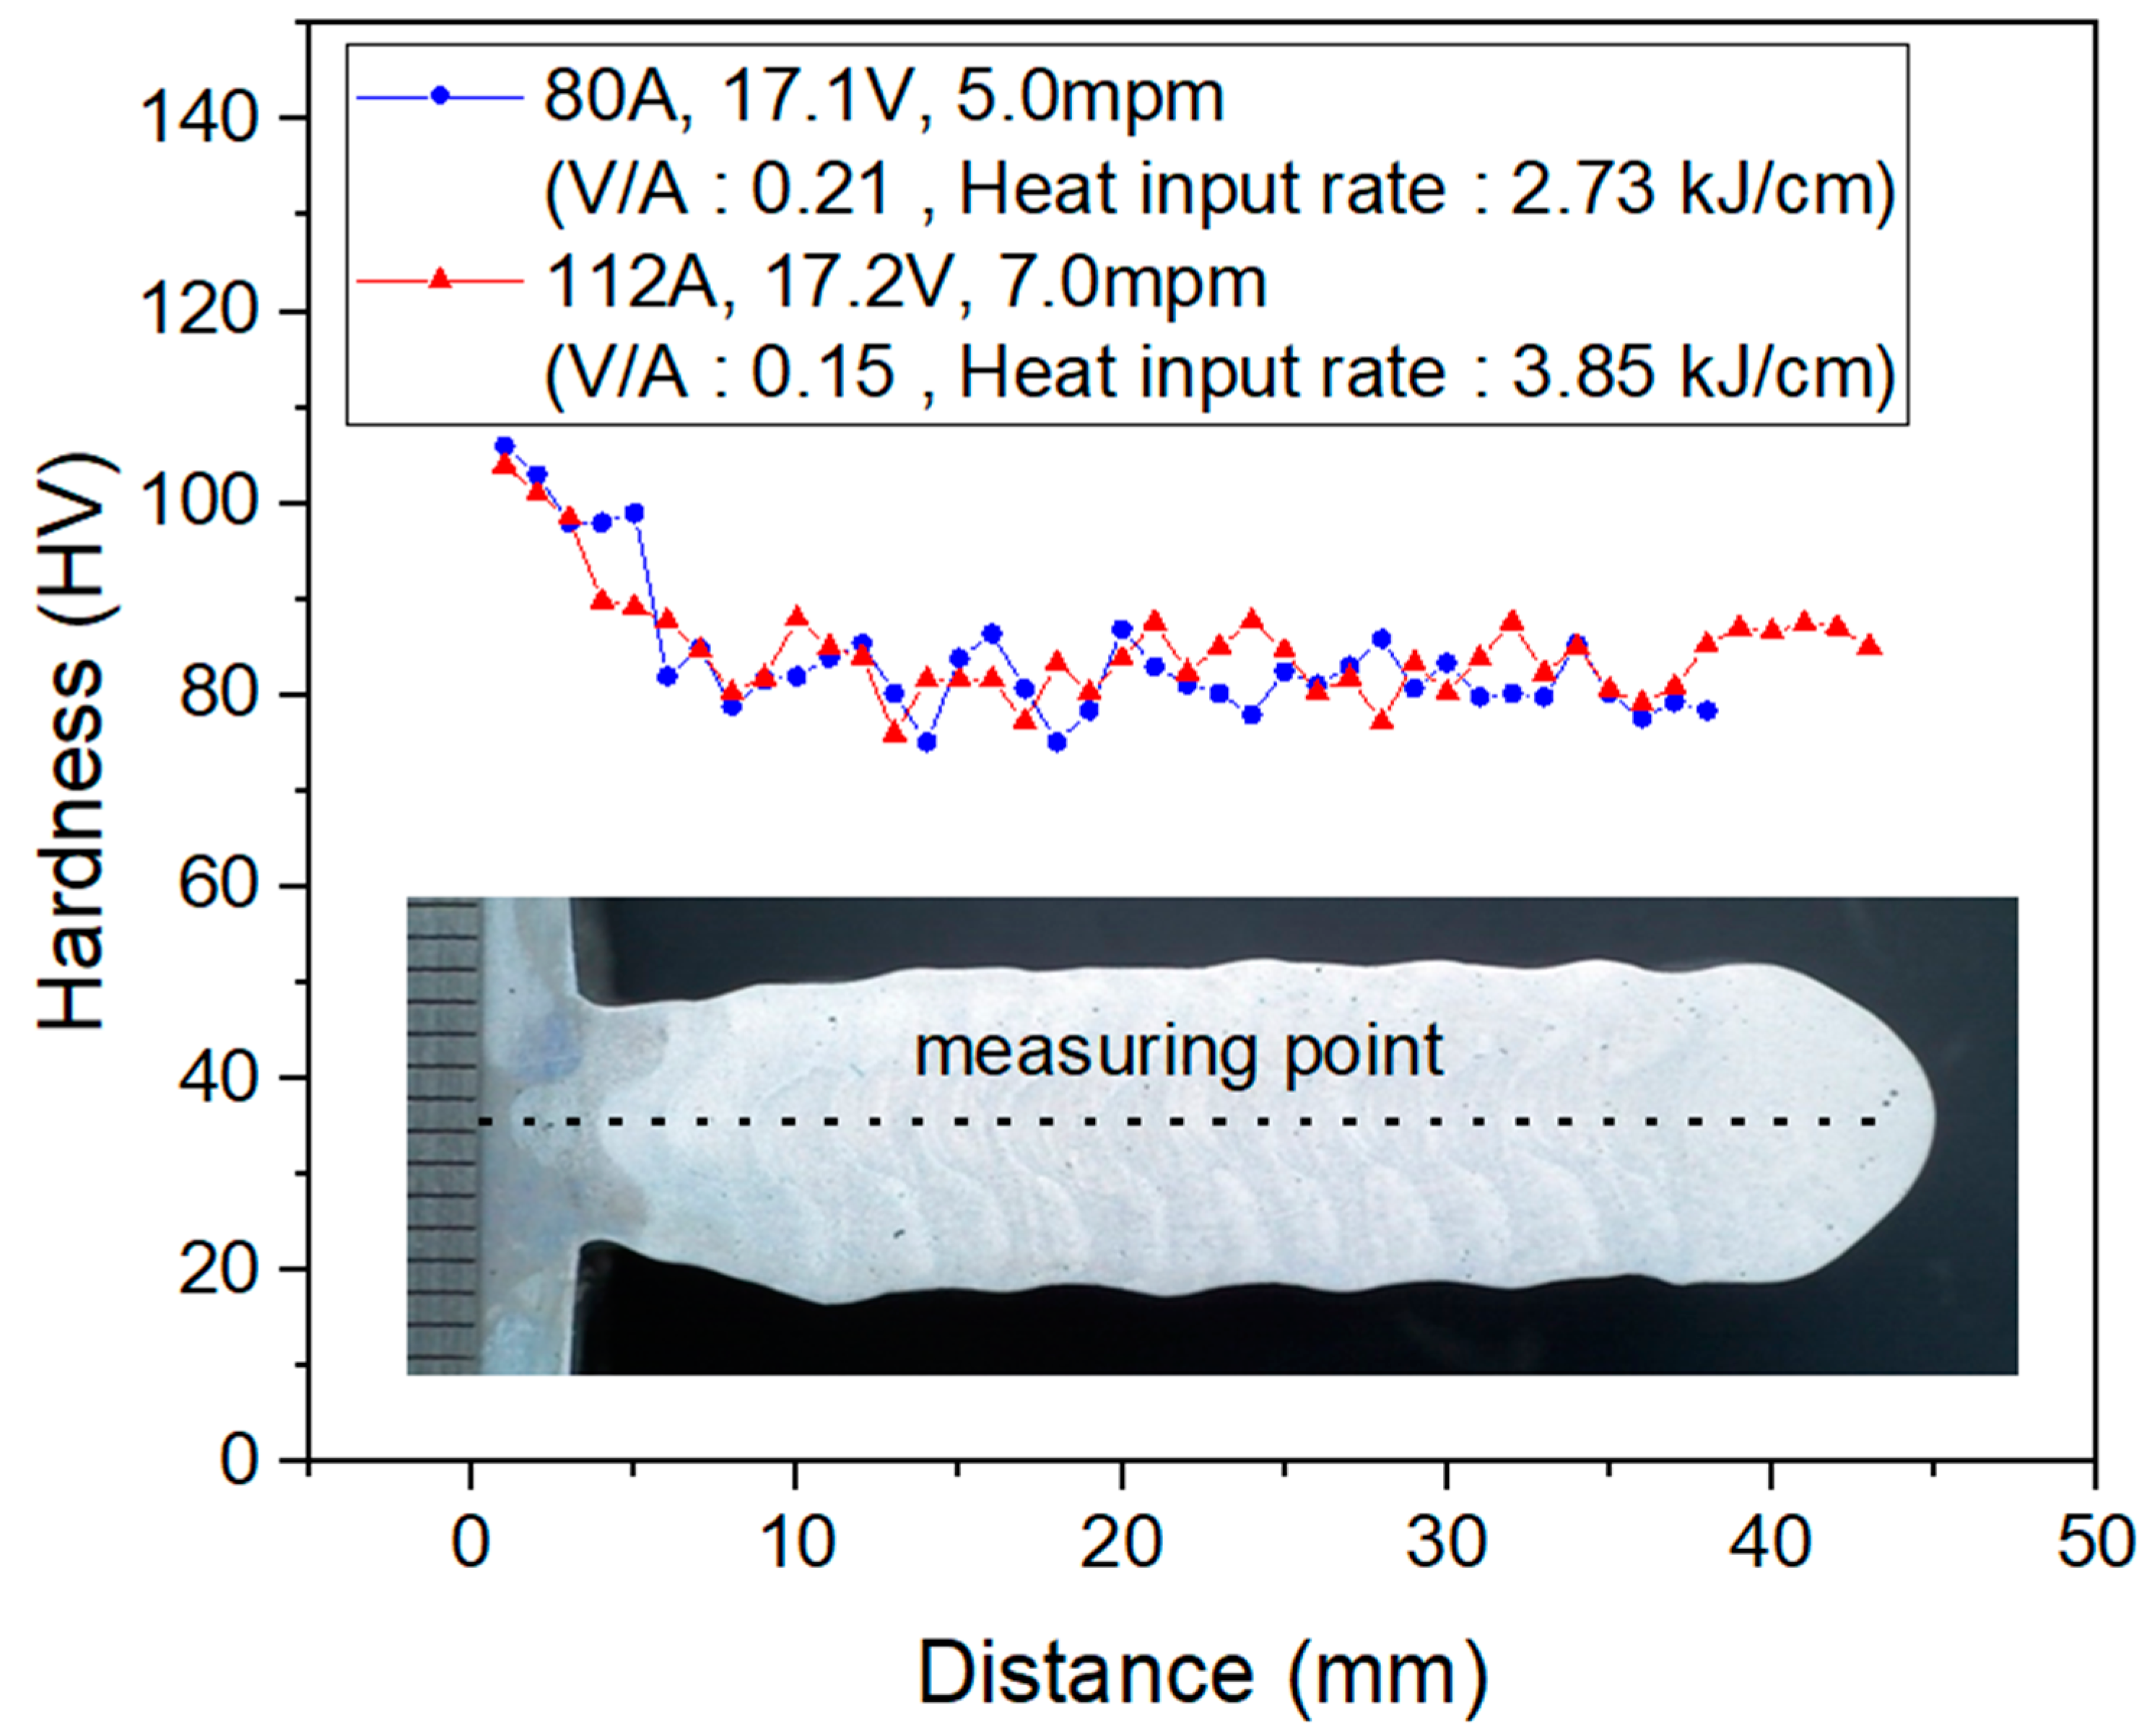
Figure 12 shows the results of hardness measurement according to different conditions (heat input, current and voltage ratio). The conditions of the maximum and minimum of the heat input and current and voltage ratio were compared. The blue line in
Figure 12 shows a current and voltage ratio of 0.21, and the red line shows a current and voltage ratio of 0.15. Despite the difference in the current and voltage ratio, the two lines are located at 80 HV, and no significant difference is observed. Furthermore, there is no difference due to heat input rate. As a result of the hardness test, it was confirmed that the hardness did not change due to the difference in the heat input and current and voltage ratio in the welding conditions used in this study.


