In this section, the measured voltages in stacks consisting of 5 to 20 repeating cell units are presented and discussed for different acid and base concentrations, for different charge and discharge currents and for different charge/discharge periods.
3.2. Self-Discharge at OCV
The experimental results of
Table 2 have been obtained with stacks where the required electrolytes were continuously pumped through the stack, compensating the effect of any side reactions or shortcuts, which may consume acid and base at OCV. In the OCV experiments reported in
Figure 4, the electrolyte flows have been stopped at the beginning of the experiment. Now the resulting drop of the voltage in stacks with different numbers of repeating cell units can be analyzed over time. This should provide indications as to why OCV across stacks with a larger number of repeating cell units increases less than proportional to the number of units, as shown in
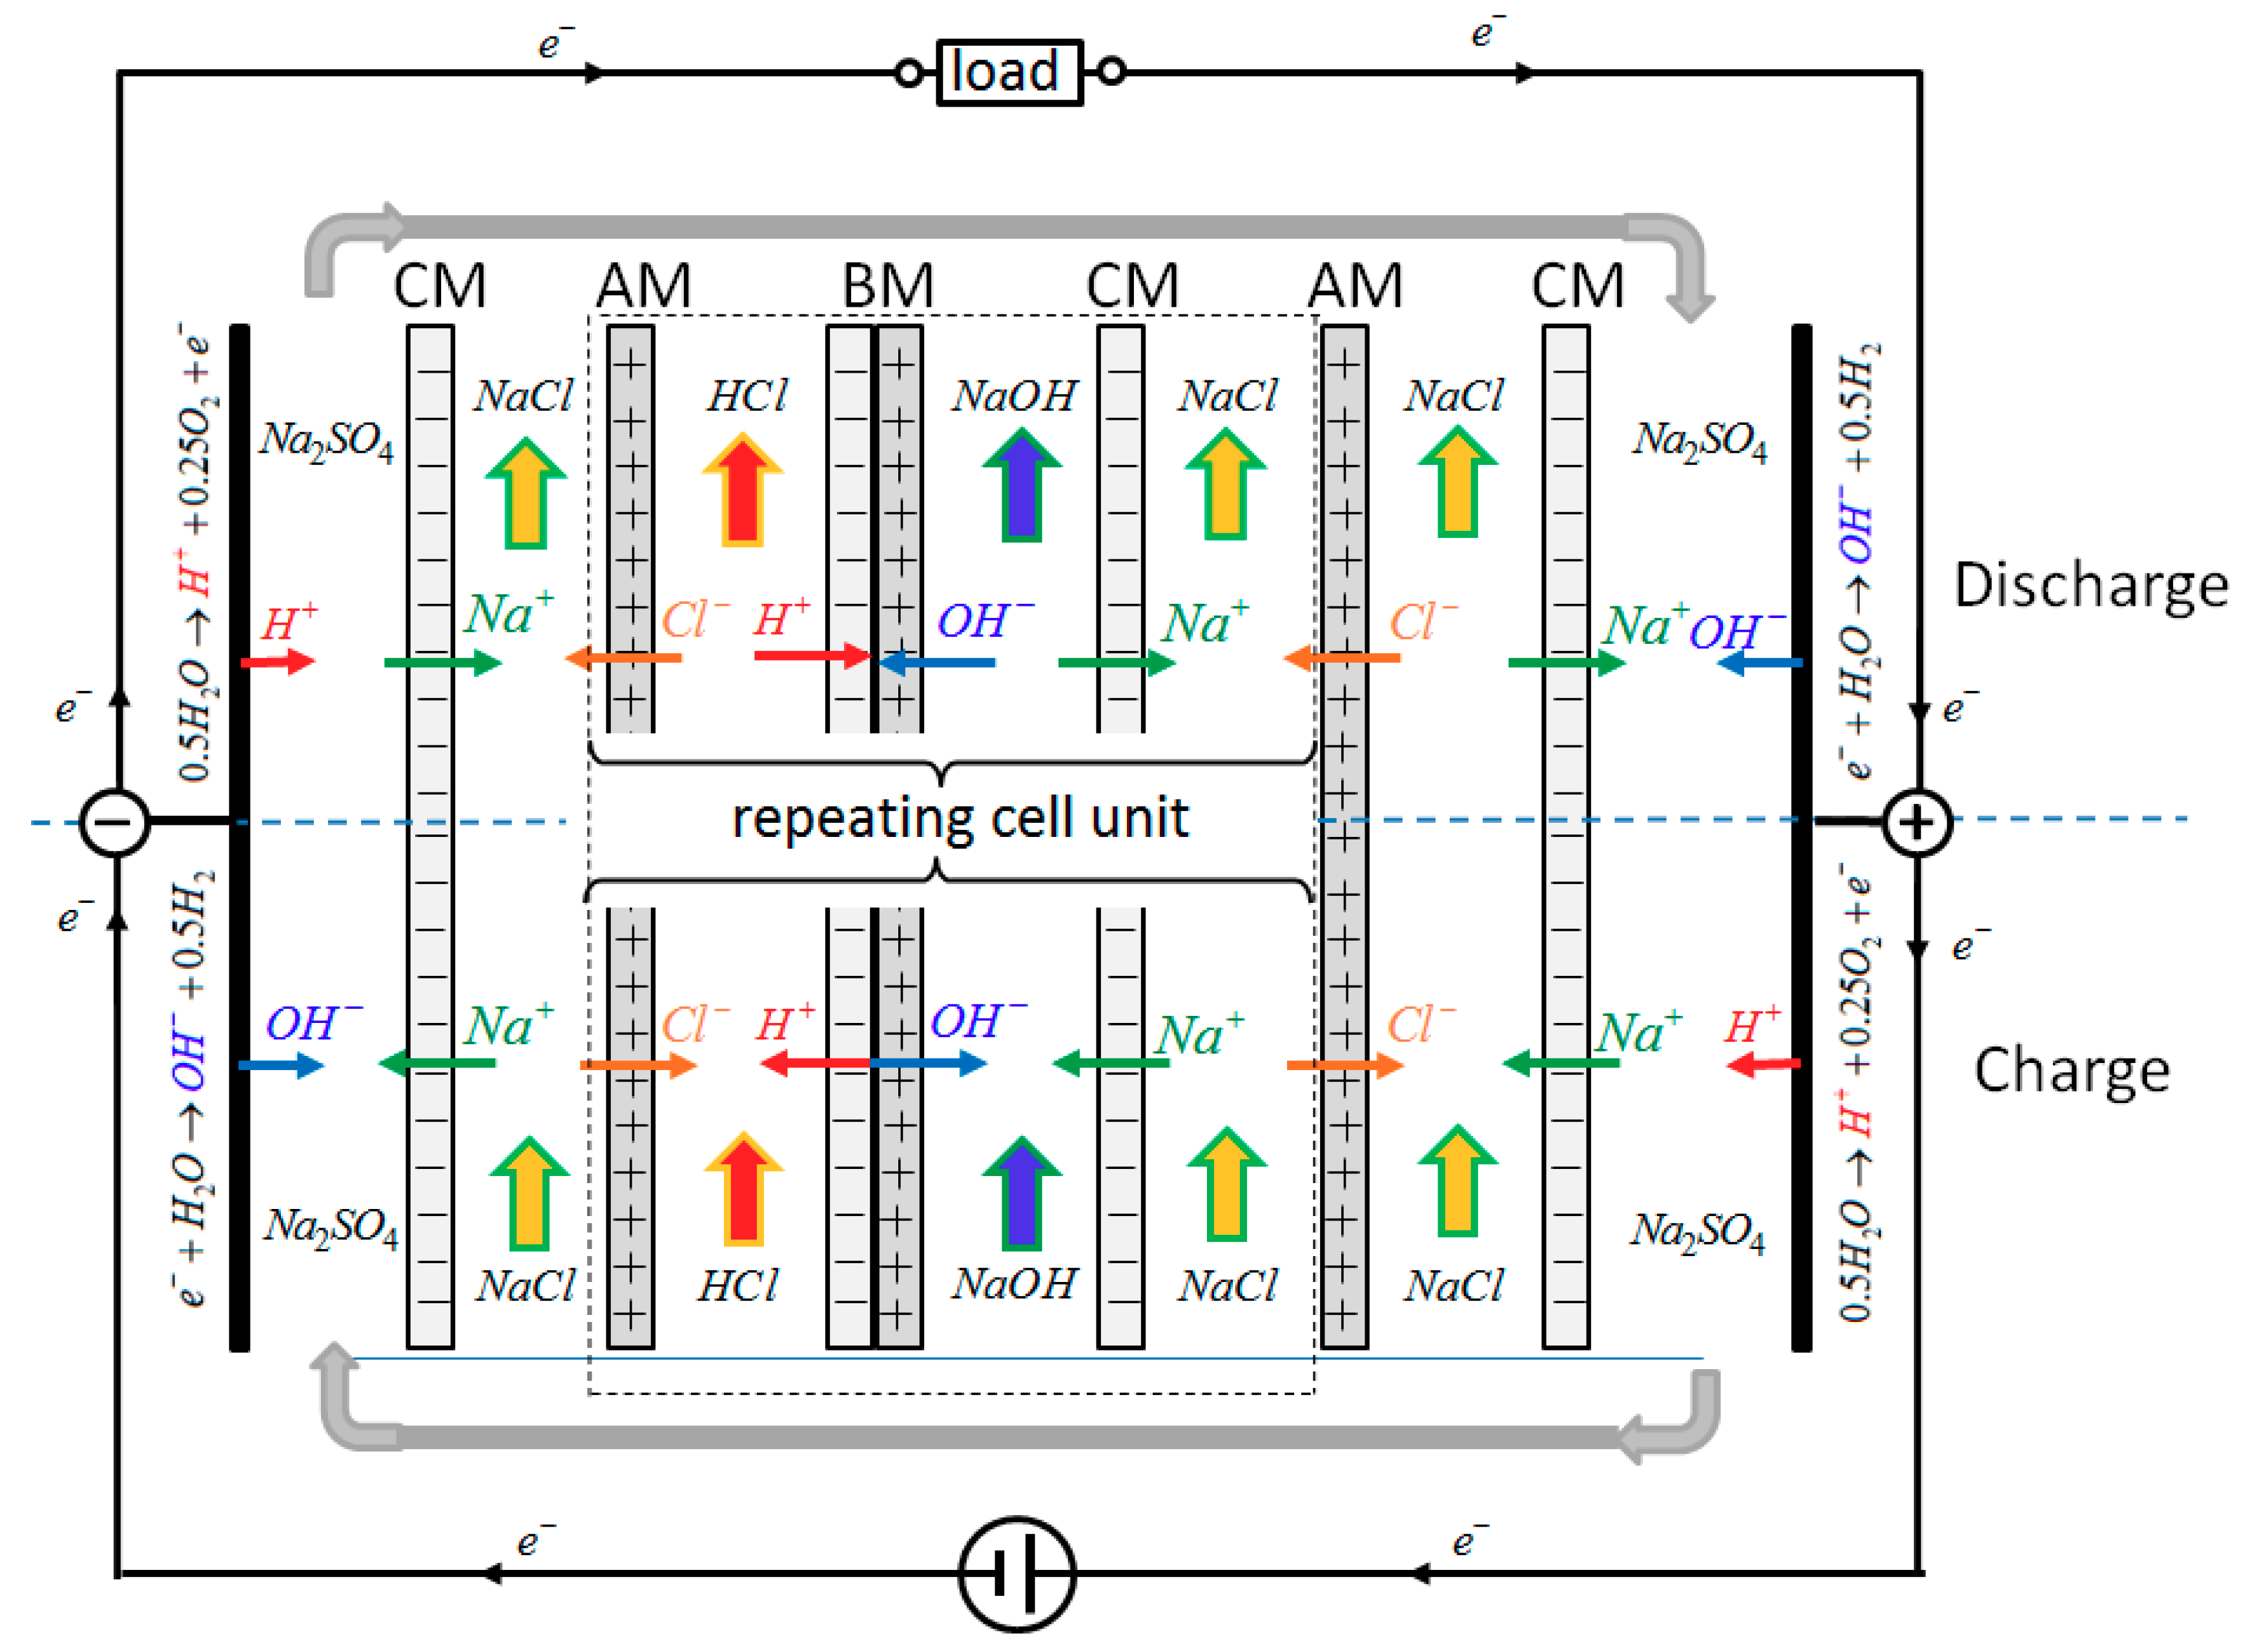
Table 2. A self-discharge due to limited membrane permselectivities, as indicated by the ionic flux arrows at OCV in
Figure 2 and discussed in detail in [
2], could contribute to the effect. However, it should not be responsible for the less than proportional increase of OCV with the number of repeating cell units.
Figure 4a–d show the results of the self-discharging tests of (a) 5-cell, (b) 10-cell, (c) 15-cell and (d) 20-cell stacks with initial 1 M acid and base. In a 5-cell stack (
Figure 4a), the self-discharge is very low, and OCV remains close to 4V during the whole measurement period. In a 10-cell stack (
Figure 4b), the stack voltage is about doubled and a slow self-discharge is followed by an accelerated discharge after about 30 min down to a level of 4 V. If the cell number is further increased (
Figure 4c,d), the accelerated drop from the higher stack voltage down to about 4 V occurs at about 20 min for the 15-cell stack, and at about 12 min for the 20-cell stack. This faster decrease of OCV is consistent with the assumption that ionic shunt current through the feed/exit lines of the electrolytes should be responsible for the OCV decrease. A similar influence of shunt currents through parallel feed/exit lines of the electrolytes is well known from redox flow batteries [
10,
11,
12].
In stacks with 10 and more cells, OCV shows an accelerated decline to about 4 V after a certain period of low decline, which becomes shorter with increasing cell number. An explanation can be drawn from
Figure 4d. Here, the difference between OCV over the first 5 cells of the stack (OCV_5cells_1st, green solid line) and OCV over the second 5-cell package (OCV_5cells_2nd, green dotted line) is shown. The voltage over the 5 middle cells was smaller than that over the first 5 cells from the very beginning. It dropped to (almost) zero at the time of the accelerated decline of the total cell voltage, whereas the voltage over the first 5 cells was less affected. The voltage decline indicates that the acid and base have been completely consumed (neutralized) in the middle of the stack, but are still present in the cells next to the electrodes. This can be explained by the ionic shunt currents through the feed/exit lines of the electrolytes. Since H
+ and OH
− have much higher ionic mobility than the other ions present, only the influence of H
+ and OH
− shunt currents in the acid and base feed/exit lines will be considered in the following, using the simplified picture in
Figure 5.
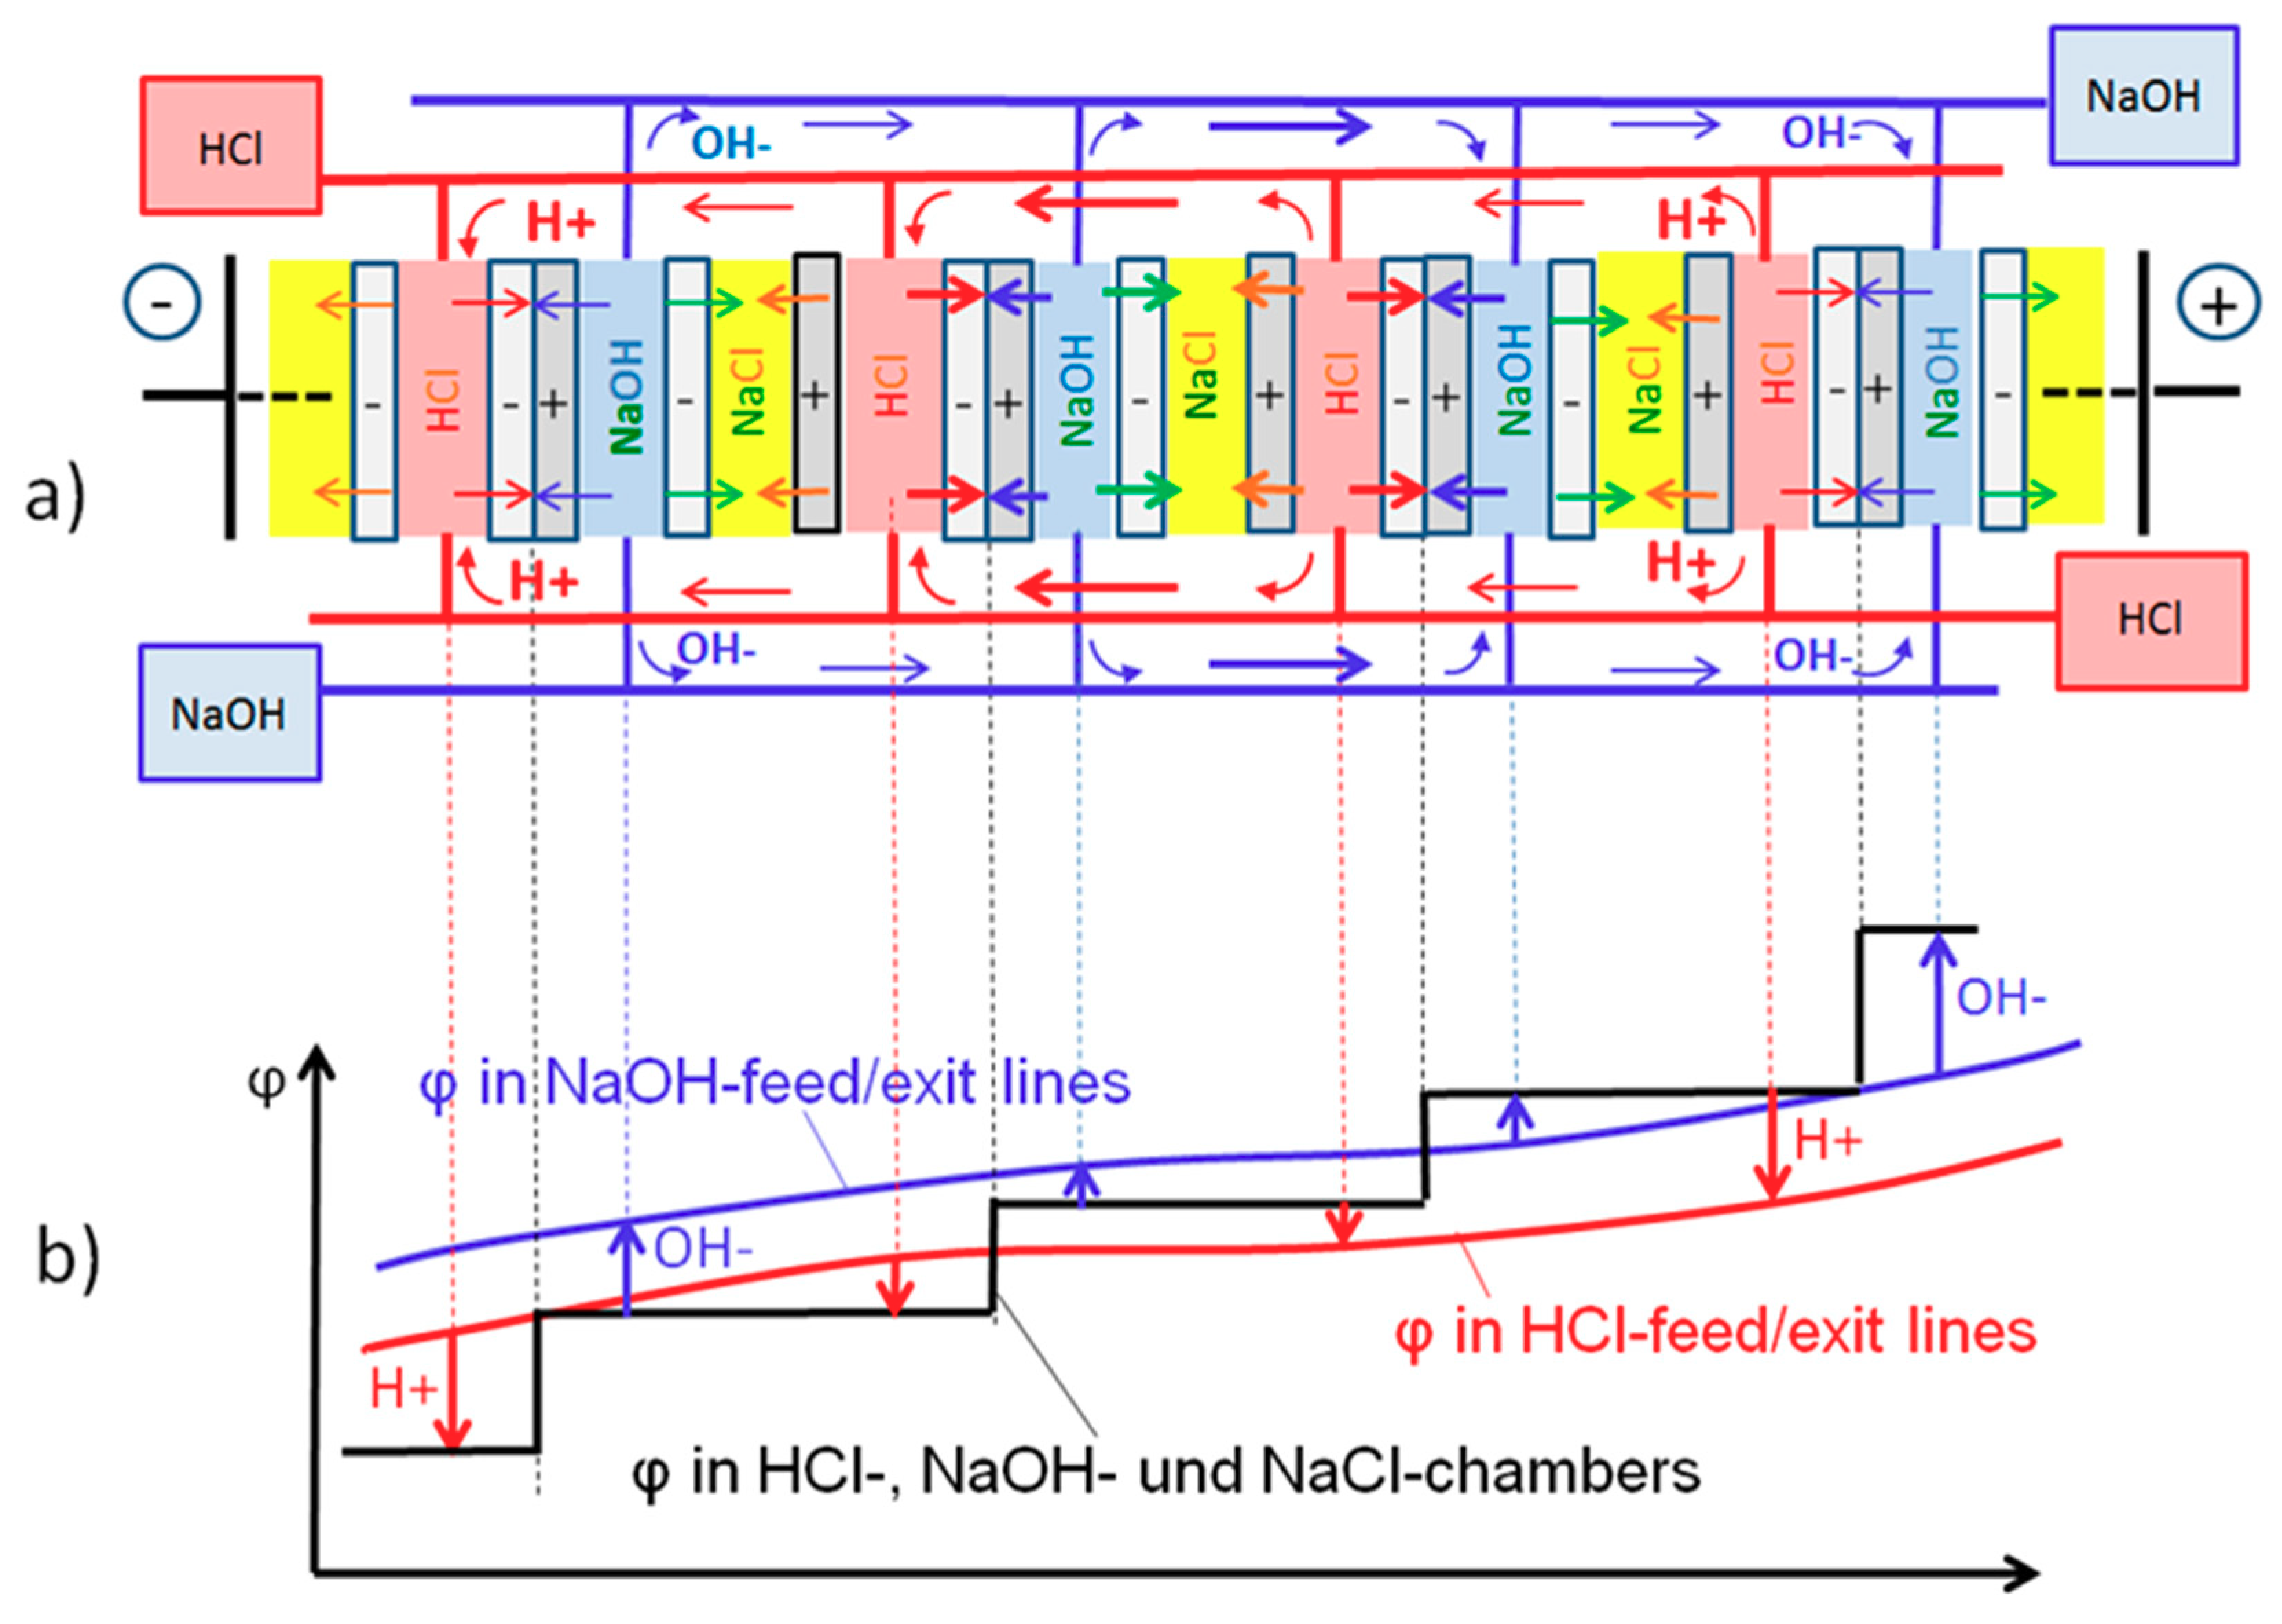
In
Figure 5a only four repeating cell units in the middle of the stack are shown, together with their feed/exit lines for acid (red) and base (blue). At OCV, a voltage profile φ (black) develops across the stack as shown in
Figure 5b. It mainly consists of the voltage steps in each of the bipolar membranes. The voltage gradient across the stack causes a counter-movement of H
+ ions and of OH
− ions along their feed/exit lines as indicated by the red and blue arrows in
Figure 5a. The ions originate from the acid/base compartments at one side of the stack and turn back into the respective compartments at the opposite side. This leads to an ion flux maximum in the stack center. To ensure electroneutrality, the ion fluxes through the feed/exit lines have to be compensated by fluxes of opposite direction through the cell compartments. This leads to the indicated fluxes with neutralization of H
+ and OH
− inside the bipolar membranes, which is maximal in the middle of the stack. Comparable to a simple mixing of acid and base, this neutralization energy is converted into heat, representing a self-discharge with loss of electrical energy. The fluxes of H
+ and OH
− into the bipolar membranes have to be compensated by equivalent fluxes of Cl
− and Na
+ into the adjacent salt compartments.
Arrows in
Figure 5b qualitatively depict the driving potentials between the feed/exit lines and the potentials on both sides of the respective bipolar membranes. This explains why the ion fluxes of H
+ and OH
- between the stack cells and the feed/exit lines change direction in the middle of the stack, as indicated by the arrows in
Figure 5a,b. The fluxes of H
+ and OH
− through the feed/exit lines accumulate in the stack center as indicated by the arrow thickness. The compensating fluxes inside the repeating cell units are therefore also strongest in the middle of the stack. This leads to the pronounced self-discharge and the resulting drop of OCV across the bipolar membranes in the middle of the stack.
In summary, the ionic shunt currents of H
+ and OH
− ions in the acid/base feed exit lines are driven by the potential along the acid/base feed/exit lines and result in a neutralization reaction in the bipolar membranes. Estimation shows that in the stack used, shunt currents due to H
+ migration through the feed/exit lines of HCl amount to more than 60% and due to OH
− migration through the feed/exit lines, NaOH amounts to more than 30% of the total shunt current [
8]. This leads to the consumption of acid and base, primarily in the stack center, which reduces the respective cell voltages. If under OCV the flow of acid and base is stopped, it leads to the gradual neutralization of all acid and base in the stack center as can be concluded from the voltage drop to zero of “OCV_5cells_2nd” after about 12 min in
Figure 4d.
In
Figure 4e, results are presented where the initial acid/base concentration has been reduced from 1 to 0.5 M. This reduction of 50% should result in an accelerated discharge in about half the time. However, since the reduced concentrations also lead to reduced ionic conductivities and hence to a reduced shunt current, only a small difference between
Figure 4d,e can be observed. Again, OCV across the second 5-cell unit in the stack center drops to zero, now after around 10 min.
The above details of the observed OCV decline after stopping the acid/base feed help to elucidate the influence of shunt currents. However, it should be mentioned that shunt currents are only of importance for the REDBP battery during operation. The consumption of acid and base by self-discharge at OCV is limited to the amount present in the stack and does not affect the concentration of acid and base in the storage tanks. This is a general advantage of flow batteries.
To determine all the details of ionic flux interactions, a numerical simulation of the whole stack would be required, where ionic species balances for all ionic species as well as electroneutrality have to be enforced in the whole stack. But this is out of scope for the present contribution.
3.3. Charge and Discharge Behavior
Figure 6 shows the charge and discharge behavior of a 20-cell stack with 1 M acid/base concentration at 25 °C. Starting with OCV conditions, after 1 min a charge current density of 9 mA/cm
2 is imposed for 5 min, followed by zero current for 1 min and a discharge current density of 9 mA/cm
2 for another 5 min. The voltage measured across the stack (black line) is higher under charging and lower under discharging than the voltage measured with the Pt wire probes between all repeating cell units, because the electrode losses need to be added to the blue curve under charge and subtracted under discharge. The mean voltages measured along the 5 min charge and discharge periods are constant. Under constant acid and base concentrations, the measured voltages even remain constant during extended charge and discharge periods, indicating a stable operation. Again, the voltage measured across the second 5-cell package (V5cells_2nd, green dotted line) is lower than V5cells_1st (green solid line) at OCV as well as under charge/discharge, indicating the increased influence of the shunt currents in the stack center.
The absolute difference between the blue and the black curves should, however, be about equal for charge and discharge and vanish at OCV. This would be the case if the blue lines were shifted upwards by 0.7 V, leading to an absolute difference between both curves at charge and discharge of about 3.4 V. This seems to be a reasonable estimate of the losses at the electrodes and across the electrode compartments during charge/discharge with 9 mA/cm
2, since under ideal conditions electrode losses of 2.07 V have been predicted by
Table 1. The required voltage shift of 0.7 V points to a measurement error of the Pt wire probes (blue curves). It is well known that measurements with Pt wire probes are less accurate than with Haber-Luggin electrodes as applied in [
2]. In the summary of the measured results, presented in
Figure 7, this voltage shift has been considered and compensated.
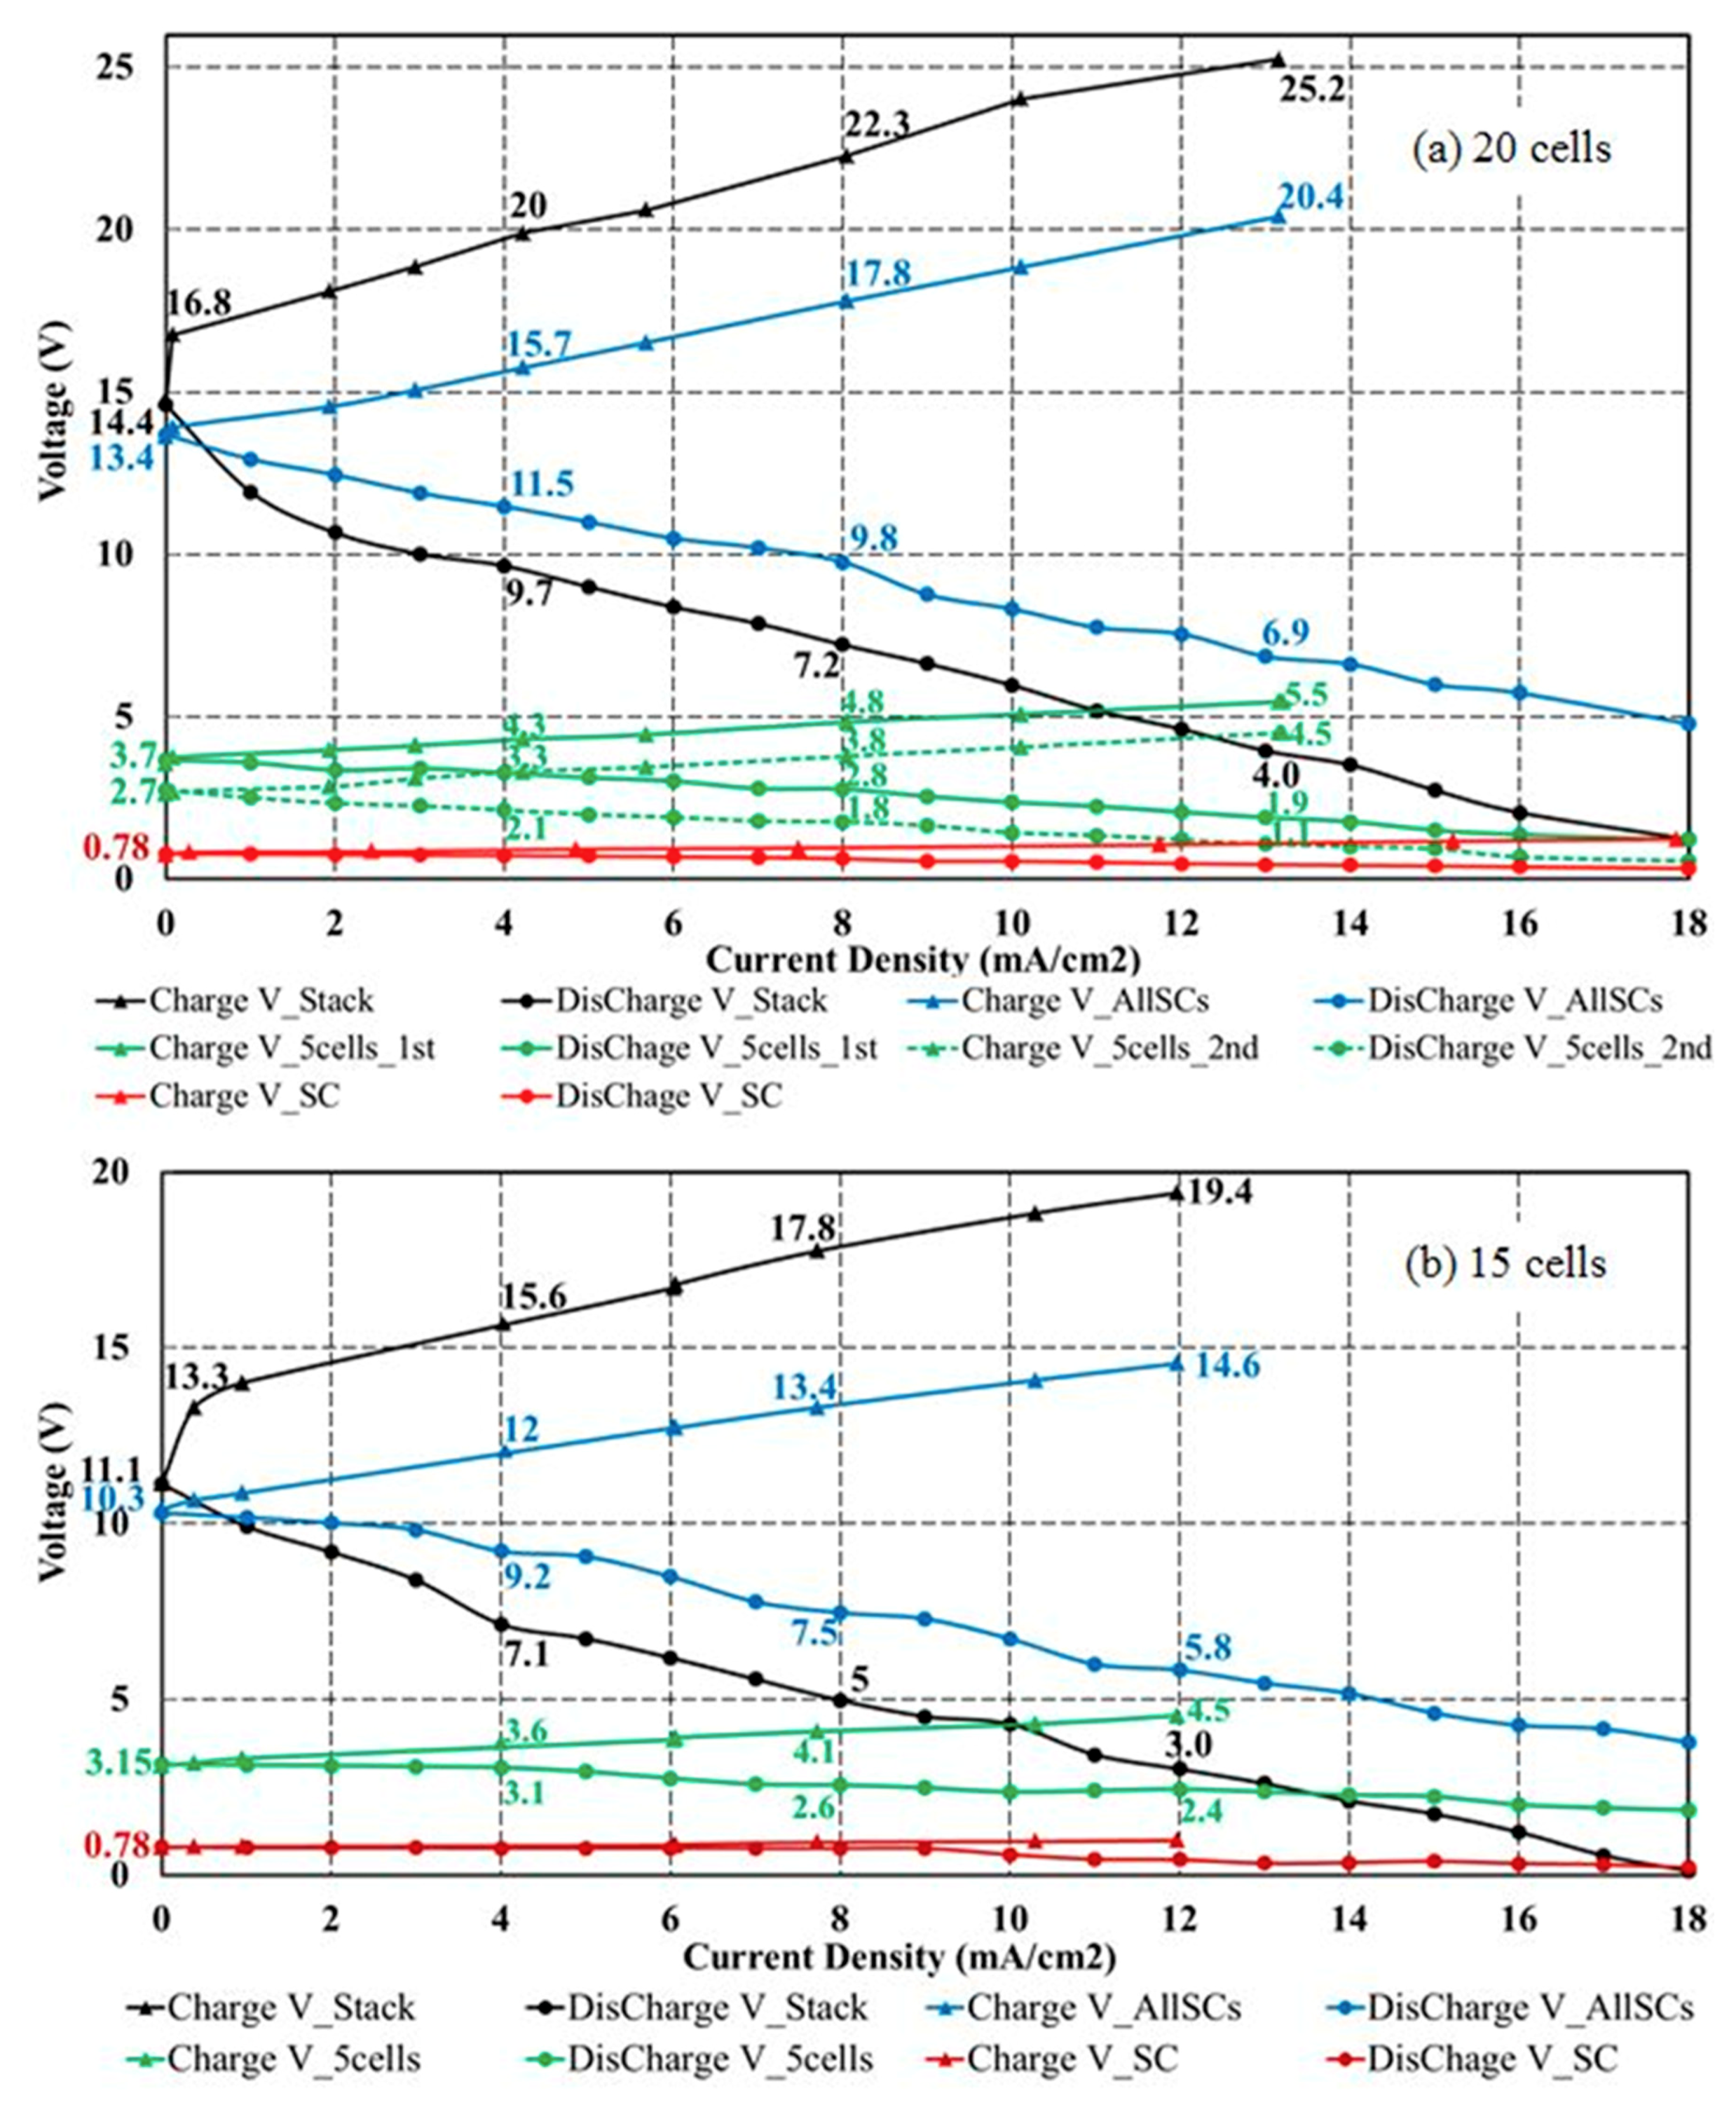
In
Figure 8, measured voltages are presented for increasing current densities under charge (increasing voltages) and under discharge (decreasing voltages). At each current density, the measurement continued until a stable voltage was established.
Figure 8a shows the results of a 20-cell stack and
Figure 8b of a 15-cell stack, for 1M acid and base. Both results show the same general trends. The voltages measured across the electrodes of the whole stack are given by black dots and the measurements across all repeating cell units (excluding the electrodes) by blue dots. In addition, measurements across the first 5-cell unit (next to one electrode) are given by green solid lines and the measurements across the second 5-cell unit (in the middle of the stack) by green broken lines. Measurements for one repeating cell unit next to one electrode are displayed in red. If a shift of +0.7 V is imposed on the blue curves, as discussed before, the electrode losses between charge and discharge are about equal. They increase moderately with increasing current density.
A comparison of
Figure 8a,b shows that the voltage losses increase with the number of unit cells. This is a consequence of the fact that the shunt current accumulates in the stack center, as discussed qualitatively with
Figure 5. This shunt current has to be compensated by an increased neutralization reaction of H
+ and OH
− in the bipolar membrane. The unit cells in the stack center therefore contribute less to the stack voltage if the cell number increases. A decrease of the voltage of the second 5-cell unit, located in the middle of the stack, compared to the first 5-cell voltage is also obvious in
Figure 8a, demonstrating the influence of the increasing shunt current in the middle of the stack, both at charge and discharge.
3.4. Discharge Power Density and Efficiency
The focus of the present contribution is on the discharge behavior of flow batteries. Here, as in [
2], power density PD, defined as net electric power, divided by stack volume, is useful for characterizing the discharge. For the stack volume, only the active area of the membranes and the thickness of each repeating cell unit (1.96 mm) have been considered, while the volume of both electrode chambers has not been included. In
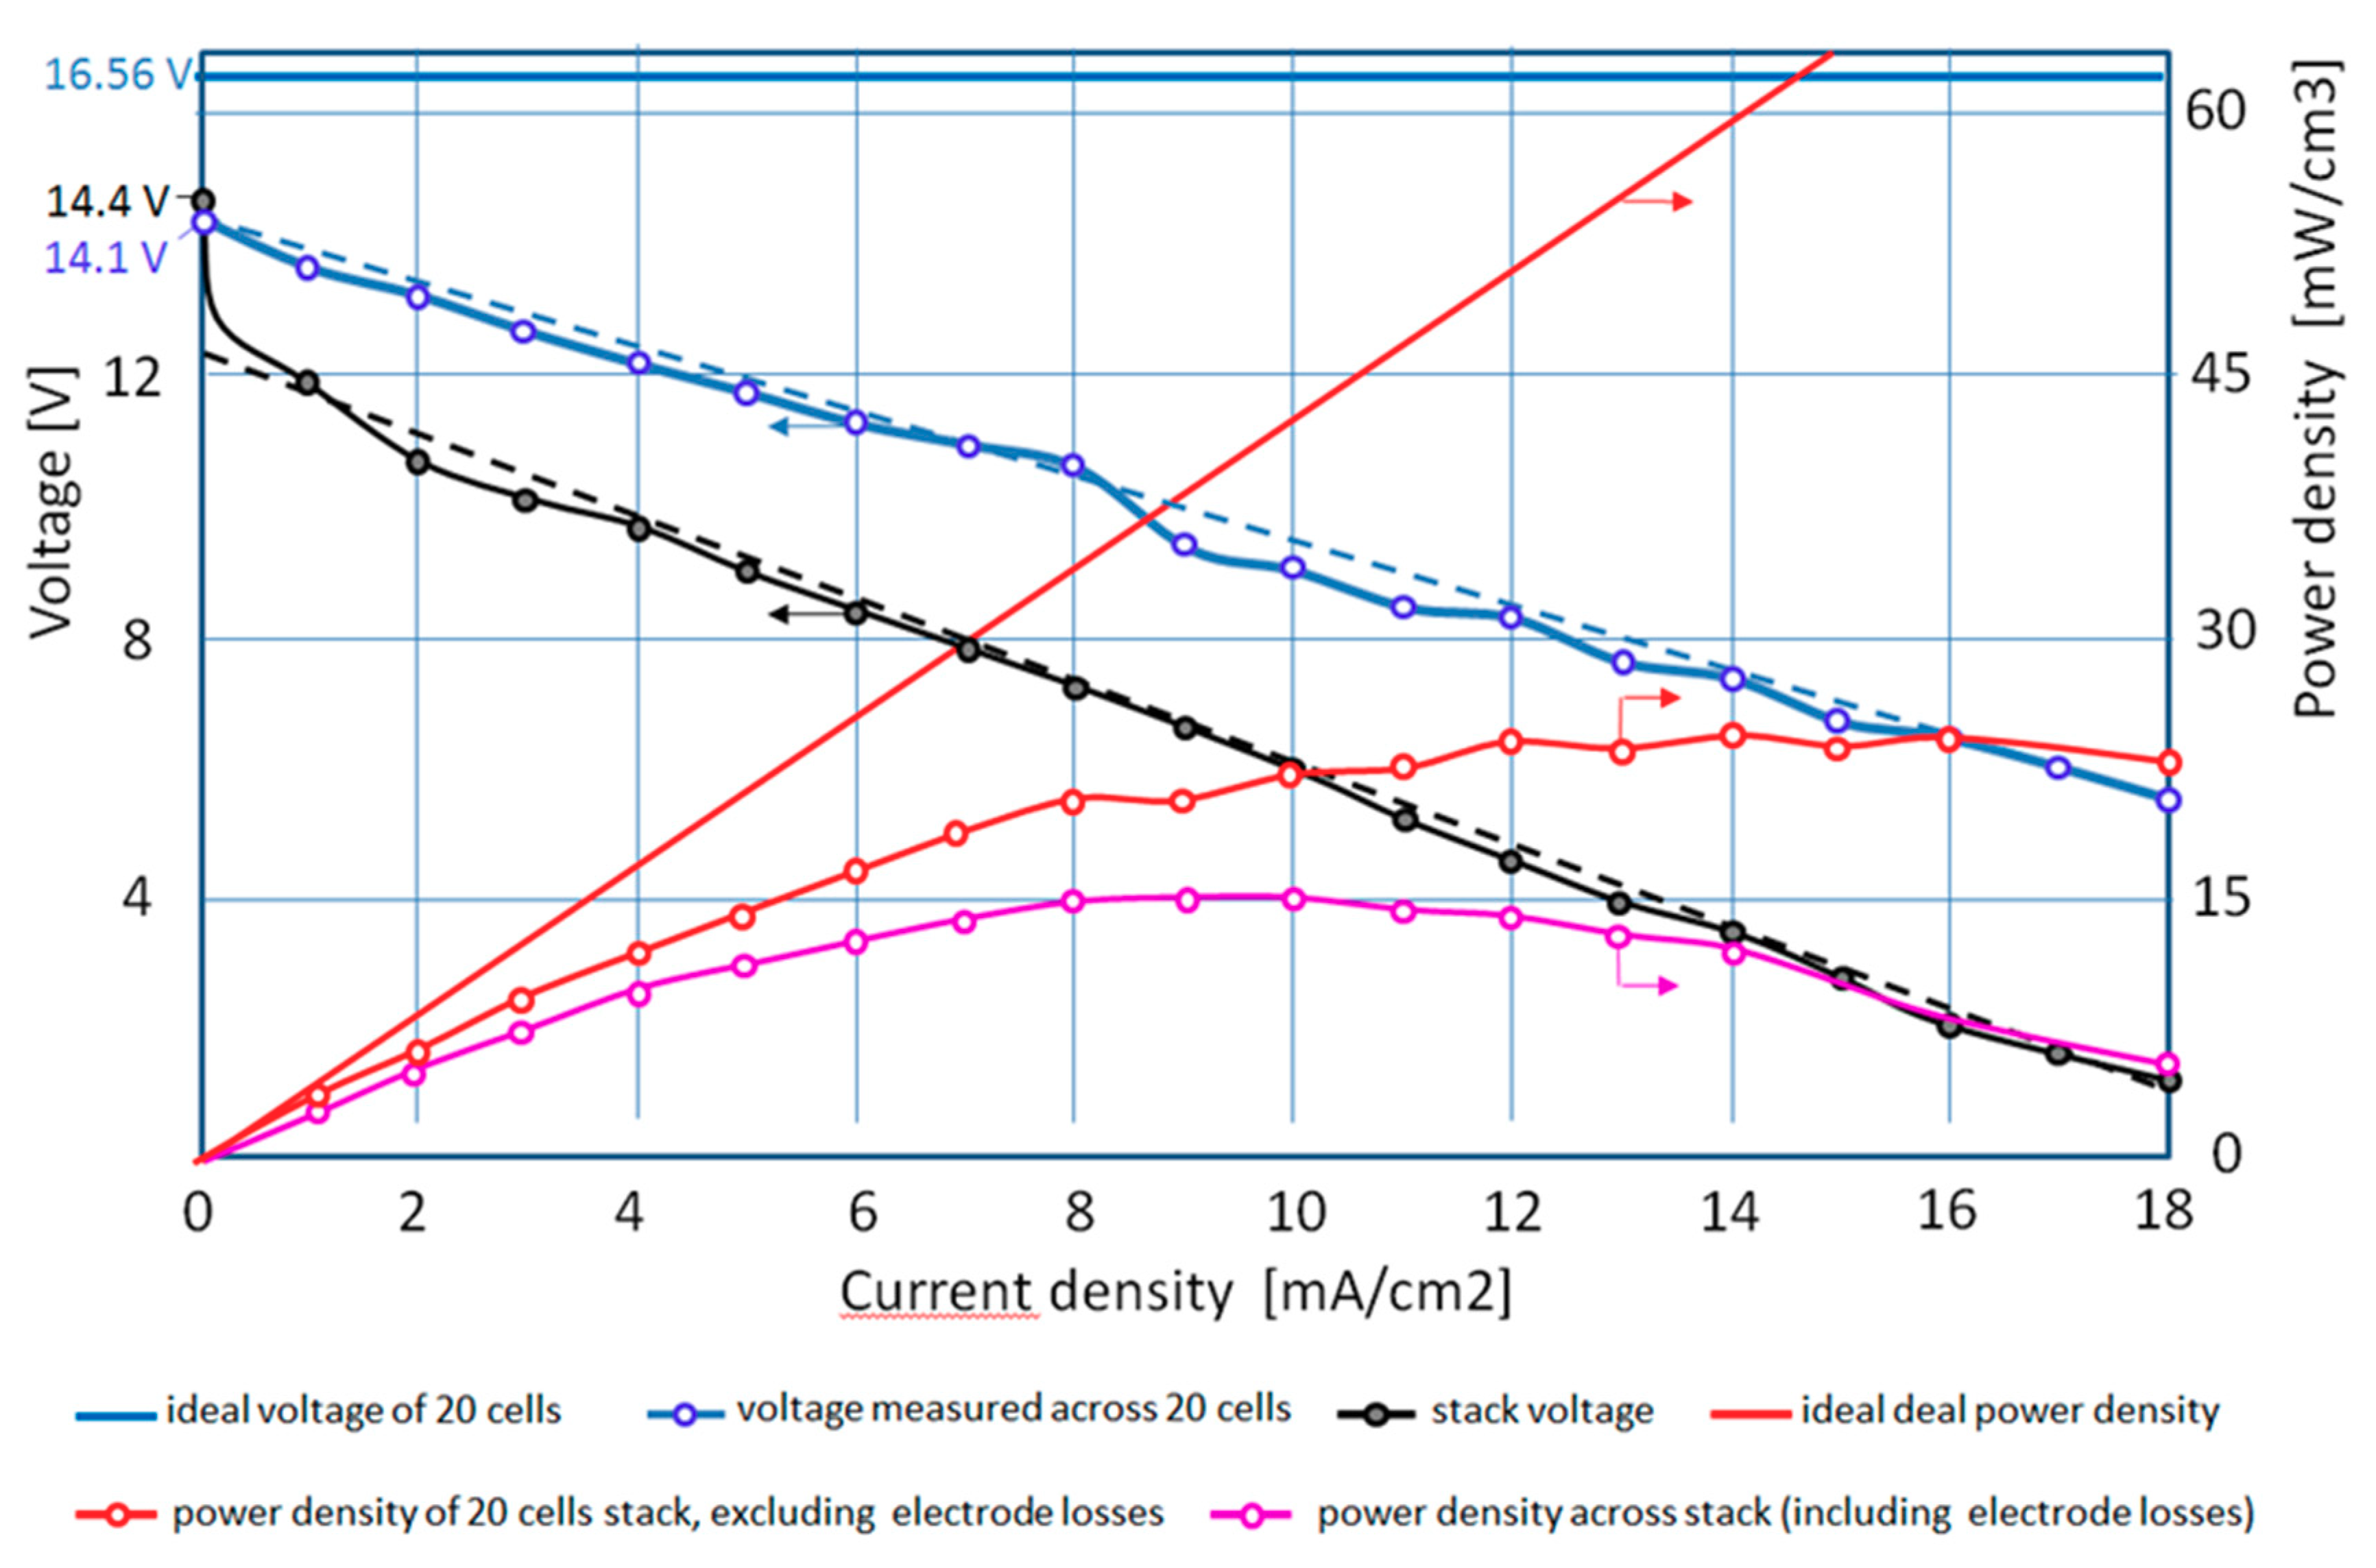
Figure 7, discharge voltage and net discharge power density of the tested 20-cell stack with 1 M acid/base at 25 °C are displayed over discharge current density. As explained in
Section 3.3, the voltages measured across all single cells (the blue dotted line) have been moved up by 0.7 V (compared to
Figure 8), to compensate for measurement errors of the Pt probes.
Considering an ideal behavior without losses across the stack (zero resistances) and with the theoretical single cell voltage of 0.828 V, a constant voltage of 16.56 V would result, leading to a linear increase of power density over current density, marked by the solid red line. The actually measured voltages across all 20 cells of the stack over current density lead to the power densities as displayed by the red line with measurement bullets. The losses partly result from the Ohmic resistances across the membranes and the electrolyte compartments, as already considered in the single-cell experiments in [
2]. Another part results from the shunt currents, discussed in
Section 3.2.
If we include the measured voltage drop over the electrodes, the pink line with bullets results in the measured power density of the stack. The difference between the red and the pink line is attributed to additional losses in the electrode compartments. The fact that the total losses are substantially higher than predicted from the single-cell experiments can be attributed to the shunt currents through the feed/exit lines. In addition, a nonuniform flow distribution of the electrolytes through adjacent cells could have contributed. This can be concluded from differences between measured voltages of adjacent cell units.
The highest power density for the 20-cell stack of 15 mW/cm3 has been reached at 10 mA/cm2, corresponding to a stack power output of 6 W with 36% voltage efficiency. Neglecting the electrode chamber losses, the highest stack power goes up to 9 W or 24 mW/cm−3 with 50% voltage efficiency.
The power density decreases at higher current densities due to increasing resistive losses. As observed in the single-cell experiments [
2], discharge current densities well above 20 mA/cm
2 resulted in unstable behavior, with voltage breakdown due to water accumulation inside BP. However, this is above the discharge power densities reached in the stack experiments.


