Article

An All-Factors Analysis Approach on Energy Consumption for the Blast Furnace Iron Making Process in Iron and Steel industry

1
School of Civil Engineering and Architecture, Anhui University of Technology, Ma’anshan 243032, China
2
The State Key Laboratory of Refractories and Metallurgy, Wuhan University of Science and Technology, Wuhan 430080, China
*
Author to whom correspondence should be addressed.
Processes 2019, 7(9), 607; https://doi.org/10.3390/pr7090607
Submission received: 18 August 2019 / Revised: 5 September 2019 / Accepted: 5 September 2019 / Published: 8 September 2019
(This article belongs to the Special Issue Green Technologies for Production Processes)

Abstract

:
The blast furnace iron making process (BFIMP) is the key of the integrated steel enterprise for energy saving due to its largest energy consumption proportion. In this paper, an all-factors analysis approach on energy consumption was proposed in BFIMP. Firstly, the BFIMP composition and production data should be collected. Secondly, the material flows and energy flows analysis models could be established based on material balance and the thermal equilibrium. Then, the all influence factors (mainly including material flows, energy flows and operation parameters) on energy consumption were obtained. Thirdly, the main influence factors, which influenced the coke ratio (CR) and the pulverized coal injection ratio (PCIR), were obtained by using the partial correlation analysis (PCA) method, because CR and PCIR were the key energy consumption performance in BFIMP. Furthermore, anall-factors analysis result could be achieved by a multivariate linear model (MLR), which was established through these main influence factors. The case study showed that the PCIR was the most effective parameter on CR; when it was increased by 1% (0.84 kg/t), the CR would reduce by 0.507 kg/t. Therefore, the increase in PCIR consumption is the key measure to realize energy saving for BFIMP. The results showed that the improvement of some material flows, energy flows and operation parameters could increase the amount of PCIR, such as sinter size, ore grade, sinter grade, M10, blast volume, blast temperature and especially for sinter alkalinity. Moreover, theall-factors analysis approach on energy consumption can widely be used in various BFIMPs, too.

1. Introduction

Theblast furnace iron making process (BFIMP) represents the most relevant process on the main route for ore-based production of iron in the steelmaking industry [1]. Meanwhile, the iron and steel industry is known for having high energy consumption and high pollution [2]. Around the world approximately 5% of global energy is consumed by the iron and steel industry [3,4,5], its CO2 emission accounts for approximately 7% of the total anthropogenic CO2 emissions [6,7]. Therefore, many novelty methods and technologies of energy saving have emerged in manufacturing fields [8], including the iron and steel industry.
Currently, blast furnace-basic oxygen furnace (BF-BOF) is one of the major production patterns [9]. Moreover, the whole iron making system (including coking, sintering, iron making and other processes) accounts for 70–75% of the total energy consumption in the integrated steel enterprise, whereas BFIMP is more than 50% [10]. Therefore, the BFIMP is one of the most energy-intensive processes in the iron and steel industry [11,12,13,14]. RY Yin [15] pointed out that material flows and energy flows are the most basic component. Consequently, material flows and energy flows analysis can also be applied to BFIMP. Related research mainly includes as follows:
Firstly, some optimization models were established based on material flows and energy flows analysis. The improvement of energy efficiency and energy saving is the focus of these optimization models [16]. An optimization model [17] was established based on material balance and energy balance in BFIMP. In this model, the exergy loss minimization was taken as the optimization target. Then, the measures of energy saving wereput forward. Bo Zhou [18] developed the principal component analysis, which could analyze material flows, energy flows and operation parameters in the process of blast furnace (BF) smelting. Furthermore, this model was applied to detect the early abnormality in the iron-making process. Moreover, on the foundation of material flows and energy flows of the oxygen BF with top gas recycling, and a model, which comprised the oxygen BF, the top gas removal process and the preheating units, was established [19]. Then, energy consumption and carbon emission of the integrated steel mill was analyzed based on this model. While, S.B. Kuang [20] proposed a complex function, which was integrated with HM (hot metal) yield and useful energy of the BF. Then the optimal cost distribution of raw materials (namely “generalized optimal construct”) was obtained, the influence of some parameters, such as oxygen enrichment ratio, blast temperature and pulverized coal dosage, on the optimization results were further analyzed.
Secondly, the mechanism of the smelting process, which was based on the material or energy evolutionary process, was studied. Due to the complexity of the BFIMP, the numerical simulation method has been applied more widely [21,22,23,24]. Y.S. Shen [25] and Yansong Shen [26] simulated the flow and combustion of a ternary coal blend under simplified BF conditions by a three-dimensional computational fluid dynamics (CFD) model. Meanwhile, the effect of the coke reaction index on the reduction and permeability of the ore layer in the BF lumpy zone under the non-isothermal condition was analyzed through a CFD model. Then, the reasonable control of the coke reaction index, which was one of the key factors for BF low-carbon, was pointed out [27]. Moreover, José Adilson de Castro [28] focused on modeling the simultaneous injection of pulverized coal and charcoal into the BF through the tuyeres with oxygen enrichment. The results indicated that the productivity of the BF could be increased up to 25% with simultaneous injection combined with oxygen enrichment. Additionally, the means of simulation, the test procedure was also used to detect reactions in the furnace. Mineral matter of tuyere level cokes was quantified using a personal computer quantitative X-ray diffraction analysis software and examined using a scanning electron microscope in a working BF. At the same time, the apparent CO2 reaction rates were measured using a fixed bed reactor [29].
Generally, the energy saving or energy efficiency of BFIMP had been explored through material flows and energy flows in the above studies. The energy efficiency of BFIMP has been improved in a large extent. Unfortunately, there were still some deficiencies in the following two aspects. (i) The influence of operation parameters on energy consumption was not involved. (ii) The influence intensity of these parameters on energy consumption was not clear in BFIMP. Additionally, data-driven methodologies have been wildly applied to various thermal equipment in the iron and steel industry due to rapid developments of industrial automation and information systems [30]. Therefore, an all-factors analysis approach, which can analyze the influence of all parameters (material flows, energy flows and operation parameters) on the energy consumption of BFIMP, is proposed based on material balance, thermal equilibrium and data-driven methodologies in this paper. Furthermore, the key influence factors can be achieved by the application of the proposed approach. Then, the corresponding energy saving measures can be put forward effectively. Therefore, the proposed model can provide support for the formulation of the reasonable production plan and the operation management in BFIMP. In addition, the proposed model can also widely be used in various BFIMPs, too.

2. Methods

The all-factors analysis approach mainly includes (as shown in Figure 1):
(1) Data collection:
The BFIMP composition and production data can be achieved through data collection.
(2) All-factors analysis based on material flows and energy flows:
In general, energy consumption is affected by many factors in BFIMP, mainly including material flows, energy flows and operation parameters. Consequently, material flows and energy flows analysis model should be established based on material balance and thermal equilibrium. Moreover, operation parameters [31], which represent the coupling quality between material flows and energy flows, should also be listed.
(3) Influence intensity analysis on energy consumption in BFIMP:
All-factors analysis approach, which mainly includes data pre-processing, all-factors partial correlation analysis (PCA) and all-factors multivariate linear model (MLR) model, is an effective influence intensity method on energy consumption in BFIMP.
(4) Suggestion and summary:
Some suggestion and summary, which can achieve improvement of energy efficiency, should be put forward based on the influence intensity analysis.

2.1. Data Collection

Data collection mainly includes the following aspects:
(1) The BFIMP composition:
The BFIMP composition should be clarified firstly. Therefore, production process investigation should be carried out.
Generally, the BFIMP is composed of the BF body and six auxiliary equipment systems, which includes the charging system (CS), blast system (BS), gas purification system (GPS), fuel injection system (FIS), top power generation system (TPGS) and slag treatment system (STS). The TPGS and STS are subsequent processes of the by-product. The material flows and energy flows proportion of BF body, CS, BS, GPS and FIS accounts for more than 90% of the total amount for BFIMP. Consequently, the TPGS and STS will not be considered in this paper due to their seldom proportion.
(2) Production data:
As discussed in the previous section, there are three kinds of parameters (material flows, energy flows and operation parameters), which affect energy consumption in BFIMP. These data can be collected through various computer detection systems or working records in BFIMP. Especially, a computer detection system can acquire and store these kinds of parameters regularly, such as the production management system and energy management system.

2.2. All-Factors Analysis Based on Material Flows and Energy Flows

2.2.1. Material Flows Analysis Model

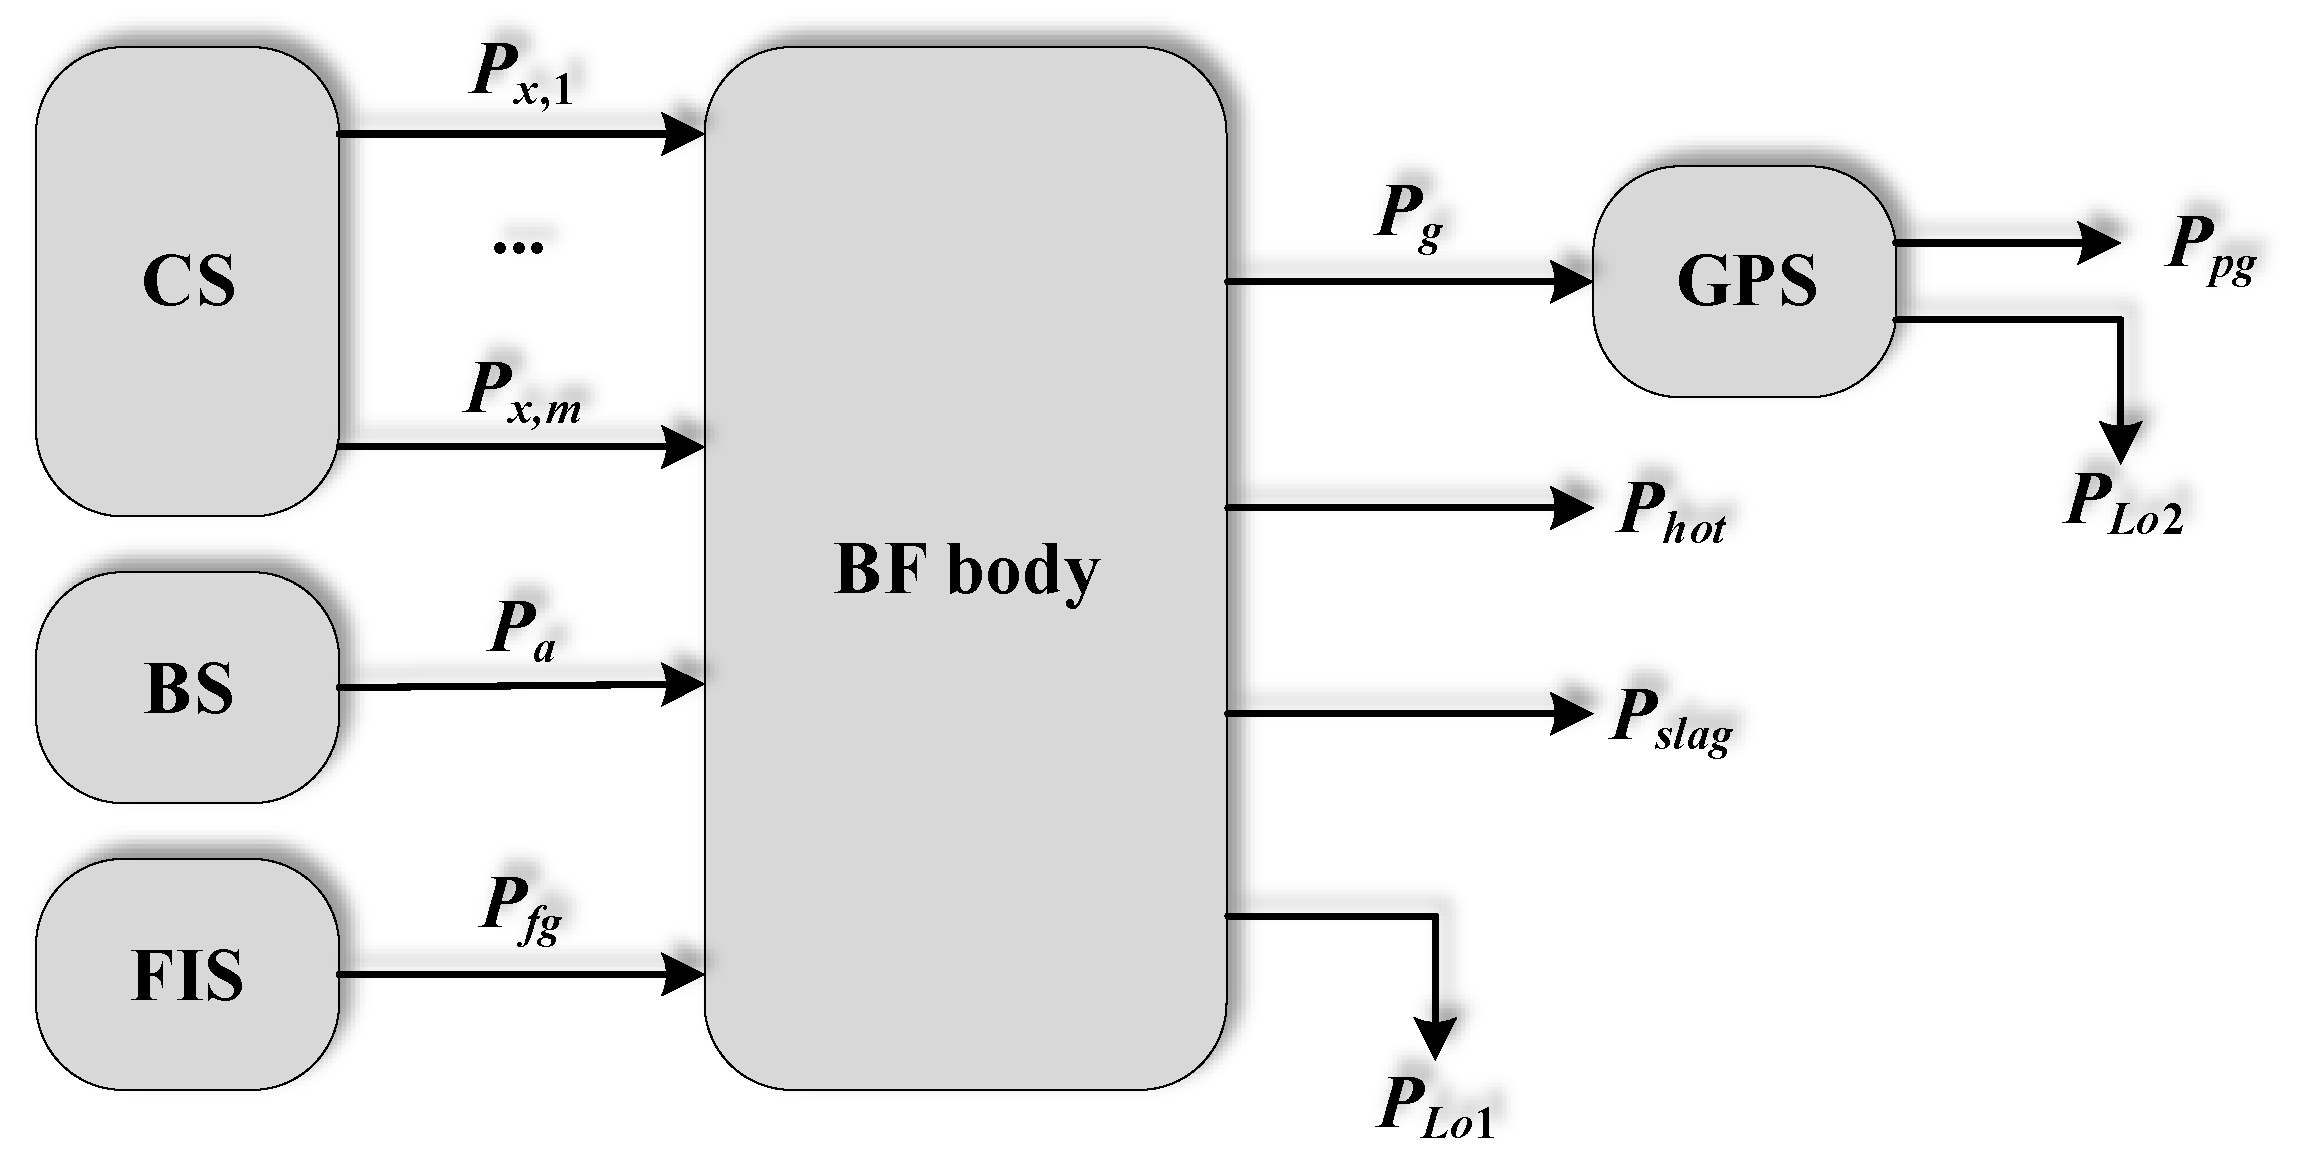
Material flows analysis model is established on the basis of the material balance in BFIMP (as shown in Figure 2).
j = 1 m P x , i + P a + P f g = P g + P h o t + P s l a g + P L o 1 .
In which,
  • P x , i : The amount of various materials, t/t;
  • P a and P f g : The amount of blast and fuel injection into the furnace, respectively, t/t;
  • P g , P h o t and P s l a g : The mount of gas, hot metal and slag, respectively, t/t, and P g = P p g + P L o 2 ;
  • P p g : The mount of gas after purification, t/t;
  • P L o 1 and P L o 2 : The loss amount of various systems, t/t.

2.2.2. Energy Flows Analysis Model

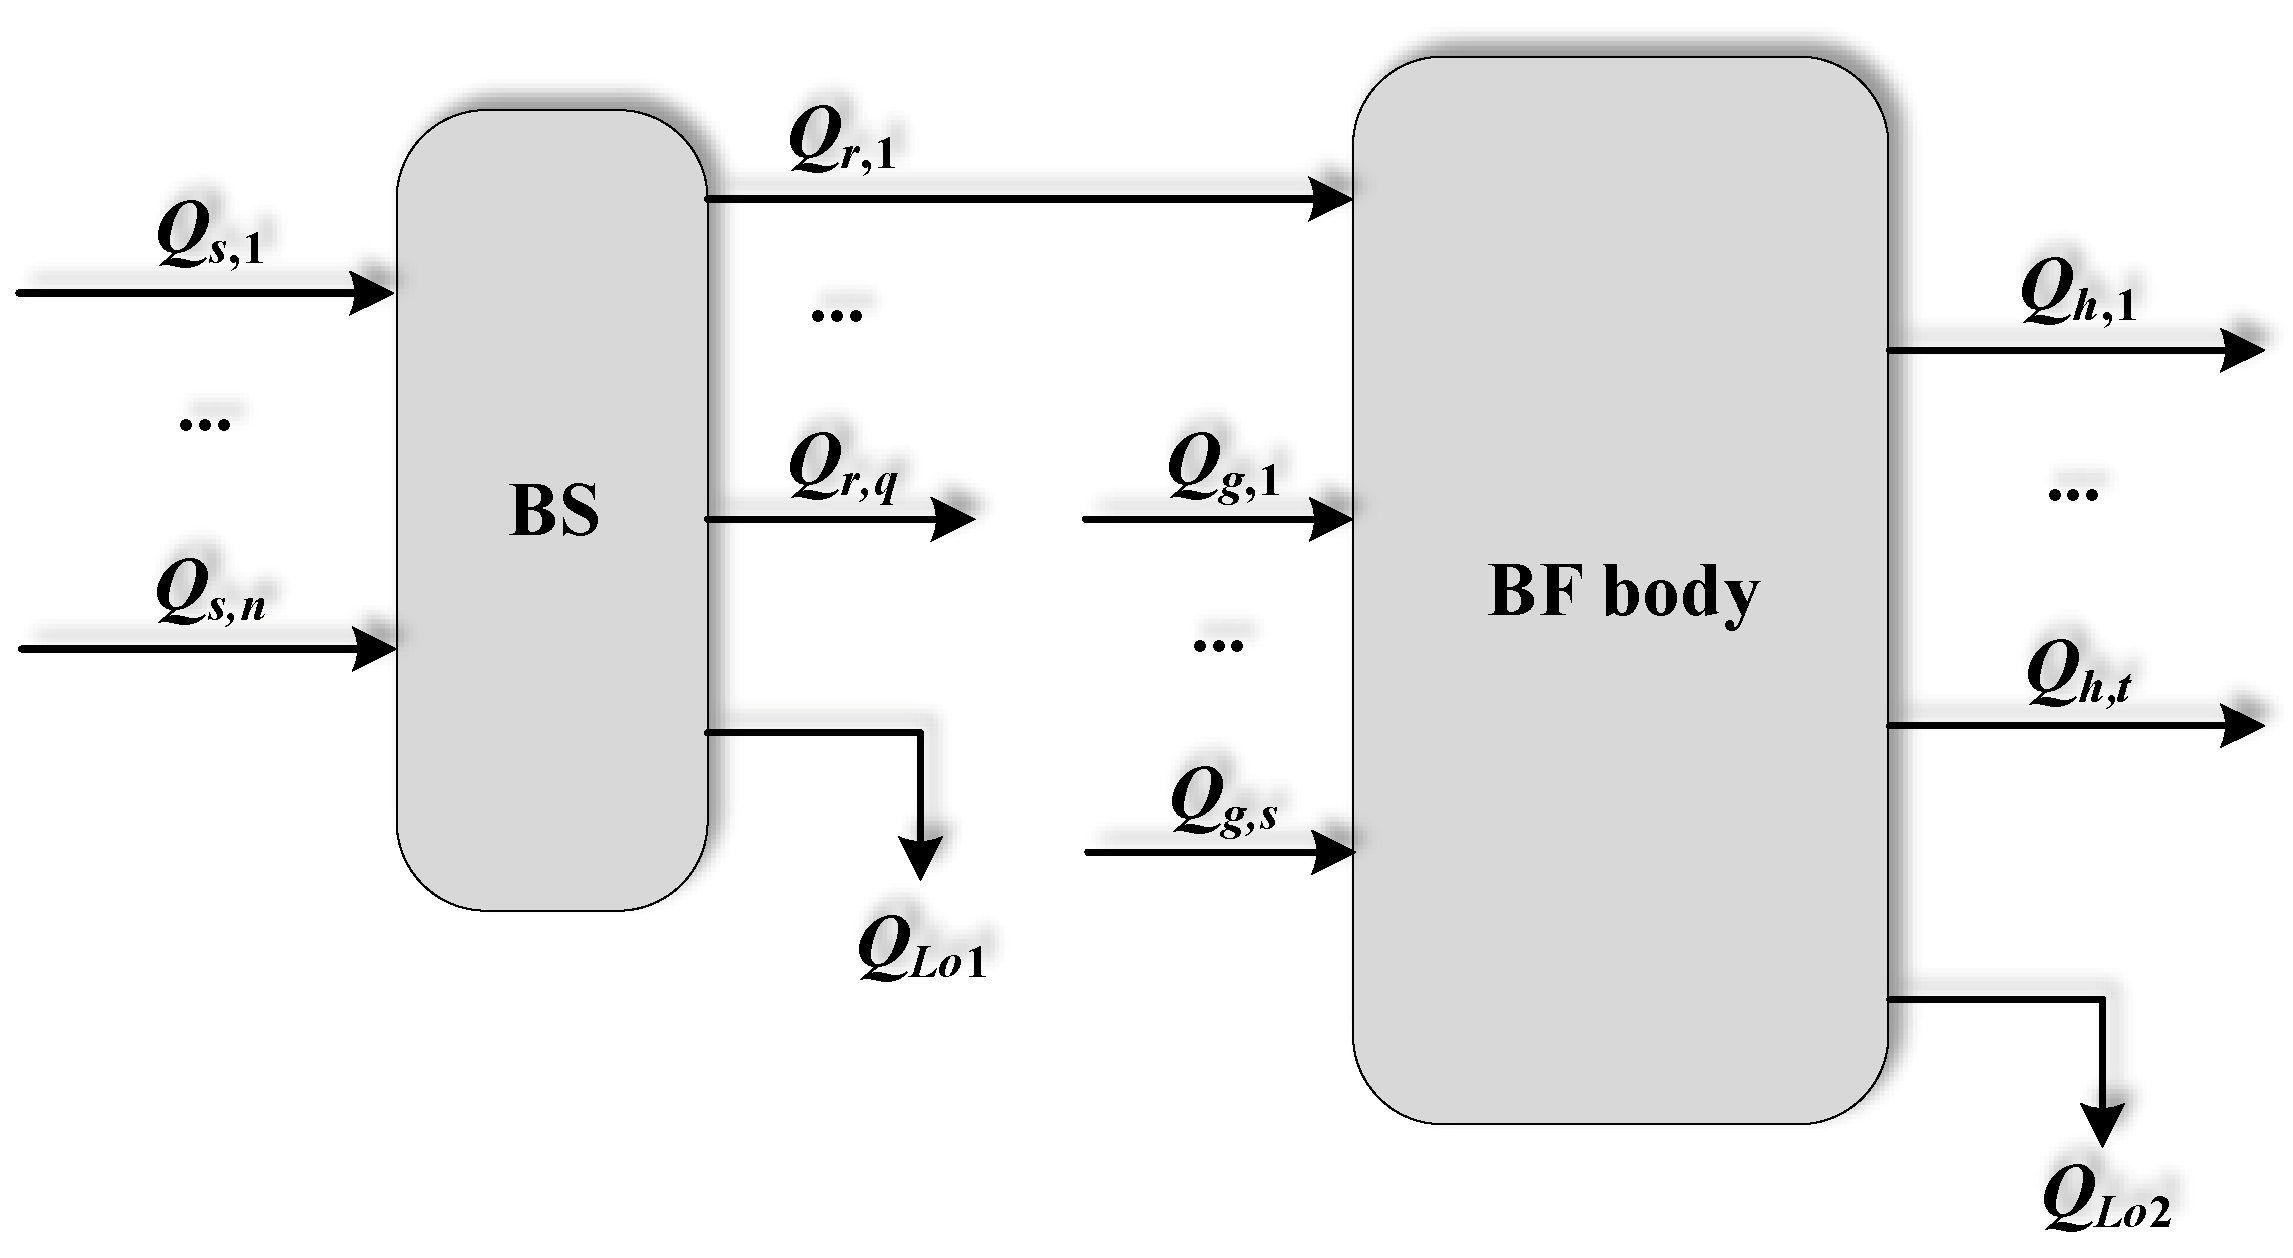
The energy flows analysis model is established based on the thermal equilibrium in BFIMP. In this paper, the BF body and BS, which are the major energy consumption regions, were only in consideration (as shown in Figure 3).
Energy flows analysis model of BS is:
j = 1 n Q s , j = k = 1 q Q r , k + Q L o 1 .
Energy flows analysis model of BF Body is:
l = 1 s Q g , l + Q r , 1 = r = 1 t Q h , r + Q L o 2 .
In which,
  • Q s , j   and   Q r , k : The input heat items and the output heat items of the BS, kgce/t (kgce: Kilogram coal equivalent);
  • Q g , l   and   Q h , r : The input heat items and the output heat items of the BF Body, kgce/t;
  • Q L o 1   and   Q L o 2 : The loss heat items of the BS and the BF Body, kgce/t.

2.2.3. The Key Operation Parameters

Several factors such as sintering grade and the quality of coke could be measured by using the proposed model. Additionally, operation parameters, which directly reflect the coupling quality between material flows and energy flows, have an important impact on the energy consumption in BFIMP, too. Therefore, these operation parameters should also be sought out, such as the blast temperature and blast pressure.
Generally, these influence factors on energy consumption should be divided into three categories: Material flows factors (the name of the material variable starts with ‘P’, as shown in Figure 2); energy flows factors (the name of the energy variable starts with ‘Q’, as shown in Figure 3) and operation parameters (the name of the operation variable starts with ‘C’, such as blast volume and blast temperature).

2.3. All-FactorsAnalysis on Energy Consumption in BFIMP

2.3.1. Data Pre-Processing

The data pre-treatment mainly included as follows:
(1)
Some data were recorded manually. Inevitably, there would be some mistakes in the recording process, such as unrecorded, omitted and incorrectly annotated. Therefore, these data should be eliminated or modified.
(2)
The study was discussed based on the normal production [5] in this paper, so the data of equipment overhauls and failures should be stripped out.
(3)
Other abnormal data, which was caused by the damage of the detection or data transmission equipment, should also be eliminated.

2.3.2. PCA

A simple correlation analysis (SCA) is a common method of statistical analysis between two random variables. However, all variables may affect each other in general when the number of variables is more than two items. Unfortunately, this mutual influence is not taken into account in SCA. Consequently, SCA was not applicable to the all-factors analysis on energy consumption in this paper, whereas there is an effective way to avoid this problem: PCA [32].This method can achieve the actual relevance of any two variables while eliminating the influence of other variables. Therefore, partial correlation coefficient (PCC) between energy consumption and other parameters can be obtained through the definition of partial correlation algorithm.

2.3.3. MLR Model

First of all, relevant variables should be redefined. P x represents the x th variable of material flows, the total number of material flows variables is M after all-factors PCA processing. Q y represents the y th variable of energy flows and the total number of energy flows variables is N after all-factors PCA processing. C z represents the z th variable of operation parameters and the total number of operation parameters variables is R after all-factors PCA processing. In addition, the number of samples is S , and i = 1 , 2 , , S . Therefore, there are the following two regression models. A simple example of the PCC between e and P 1 is given to describe calculation process.
e i = c 0 + c P , 2 · P i , 2 + + c P , M · P i , M + c Q , 1 · Q i , 1 + + c Q , N · Q i , N + c C , 1 · C i , 1 + + c C , R · C i , R + ε i .
P i , 1 = d 0 + d P , 2 · P i , 2 + + d P , M · P i , M + d Q , 1 · Q i , 1 + + d Q , N · Q i , N + d C , 1 · C i , 1 + + d C , R · C i , R + ε i .
In which,
  • e i : Energy consumption of the i th group sample, kgce/t;
  • P i , 1 : The 1st material flows variable of the i th group sample;
  • c 0 and d 0 :Constant term;
  • c P , 2 , , c P , M , c Q , 1 , , c Q , N , c C , 1 , , c C , R , d P , 2 , , d P , M , d Q , 1 , , d Q , N , d C , 1 , and   d C , R : Regression coefficient;
  • ε i and   ε i : Error term.
Then, the two fitting models can be achieved by the least square method. Meanwhile, the residuals are as follows between them:
u i = e i ( c 0 ^ + c P , 2 ^ · P i , 2 + + c P , M ^ · P i , M + c Q , 1 ^ · Q i , 1 + + c Q , N ^ · Q i , N + c C , 1 ^ · C i , 1 + + c C , R ^ · C i , R ) .
v i = P i , 1 ( d 0 ^ + d P , 2 ^ · P i , 2 + + d P , M ^ · P i , M + d Q , 1 ^ · Q i , 1 + + d Q , N ^ · Q i , N + d C , 1 ^ · C i , 1 + + d C , R ^ · C i , R ) .
In which,
  • u i : The residual of the i th group sample between e i and its fitting model;
  • v i : The residual of the i th group sample between P i , 1 and its fitting model;
Then, simple correlation coefficient between u vector ( u = ( u 1 , u 2 , , u S ) ) and v vector ( v = ( v 1 , v 2 , , v S ) ) can be obtained by calculation. This coefficient, which is denoted r e , P 1 (as shown in Equation (8)), is called the PCC between e and P 1 . The calculation process of the other PCC is so as well.
r e , P 1 = C o v ( u , v ) V a r [ u ] · V a r [ v ] .
In which,
  • C o v ( u , v ) : The covariance between the u vector and v vector;
  • V a r [ u ] : The variance of the u vector;
  • V a r [ v ] : The variance of the v vector.
In this paper, the PCC between e and influence factors can be obtained by the SPSS software package due to its powerful statistical calculations function. Meanwhile, the significance level (p value) of them can also be achieved by SPSS software. There is a higher significance level between e and an influence factor if their p value is less than 0.05, and vice versa. Consequently, all influence factors with a high significance level can be achieved through related data processing. MLR model between e and these main influence factors can be established.

3. Results and Discussion

3.1. Data Sources and Related Instructions

In this paper, the data source is the production data of a steel enterprise’s BFIMP from 2013 to 2014.In order to ensure the validity of the discussion, the pretreatments of these data should be carried out before application. After data pretreatment processes, the effective samples 104 groups of invalid samples were eliminated from the data of the 730 groups, and 626 groups were obtained.

3.2. Material Flows Analysis and Energy Flows Analysis Results

Material flows analysis model and energy flows analysis model could be achieved by the modeling method and sample data, which was mentioned in Section 2.2.1 and Section 2.2.2. The analysis results are shown as follow.

3.2.1. Material Flows Analysis Results

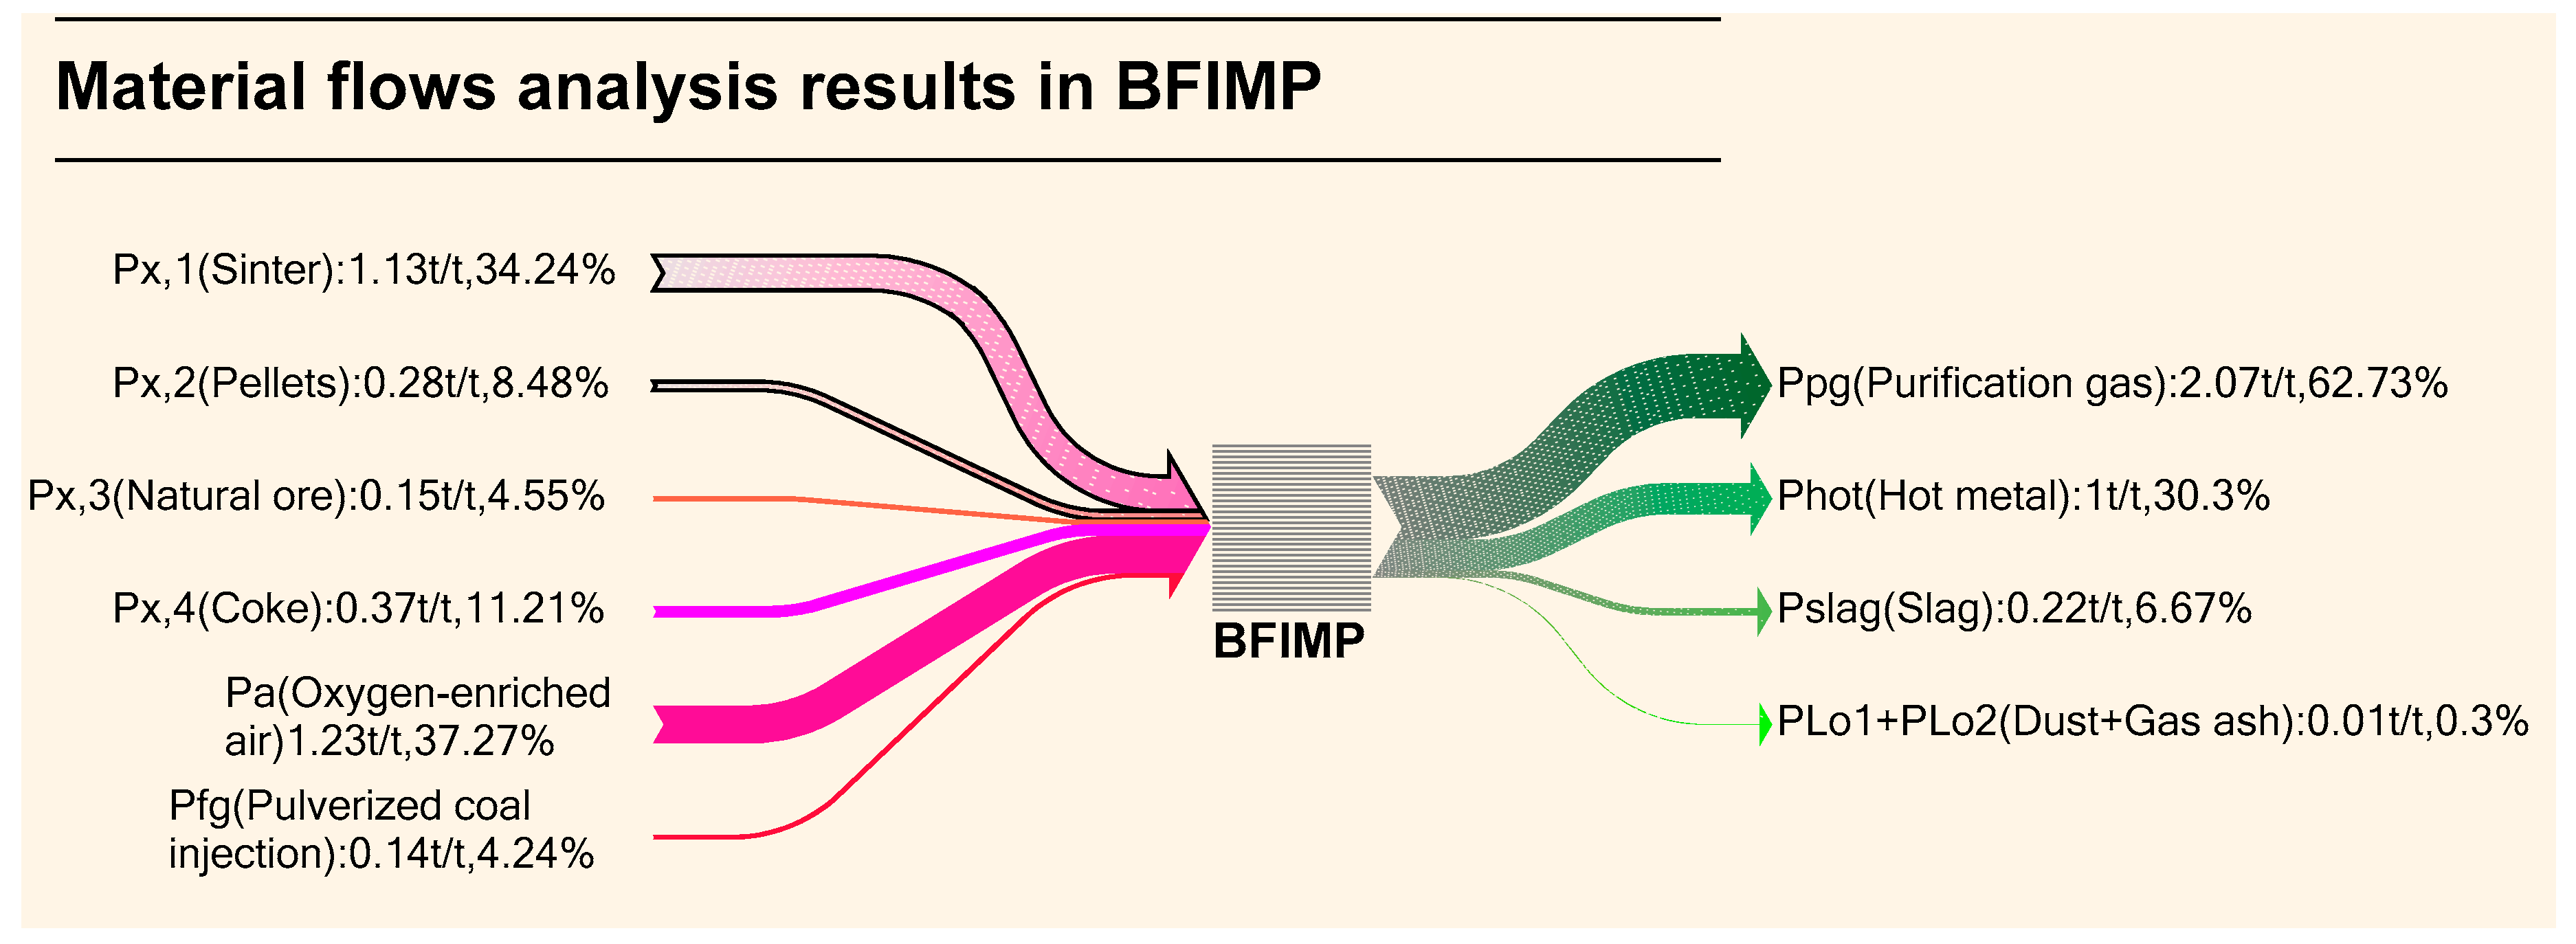
Material flows analysis is based on the material balance between raw materials and output products. Since the amount of the gas mud, which is produced by the circulation cooling, is seldom, this part could be ignored. Then, the analytical results are shown in Figure 4.
(i) The material flows (including input items and output items) are all listed out through the material balance in BFIMP.
(ii) The proportions of material flow input items and output items are all clearly indicated. For example, the amount of sinter (Px,1), coke (Px,4) and oxygen-enriched air (Pa) accounted for about 83% in all material flow input items. Meanwhile, the purification gas (Ppg) and hot metal (Phot) accounted for about 93% in all material flow output items. Therefore, these items should be given more attention.

3.2.2. Energy Flows Analysis Results

(1) Energy flows analysis of the BS:
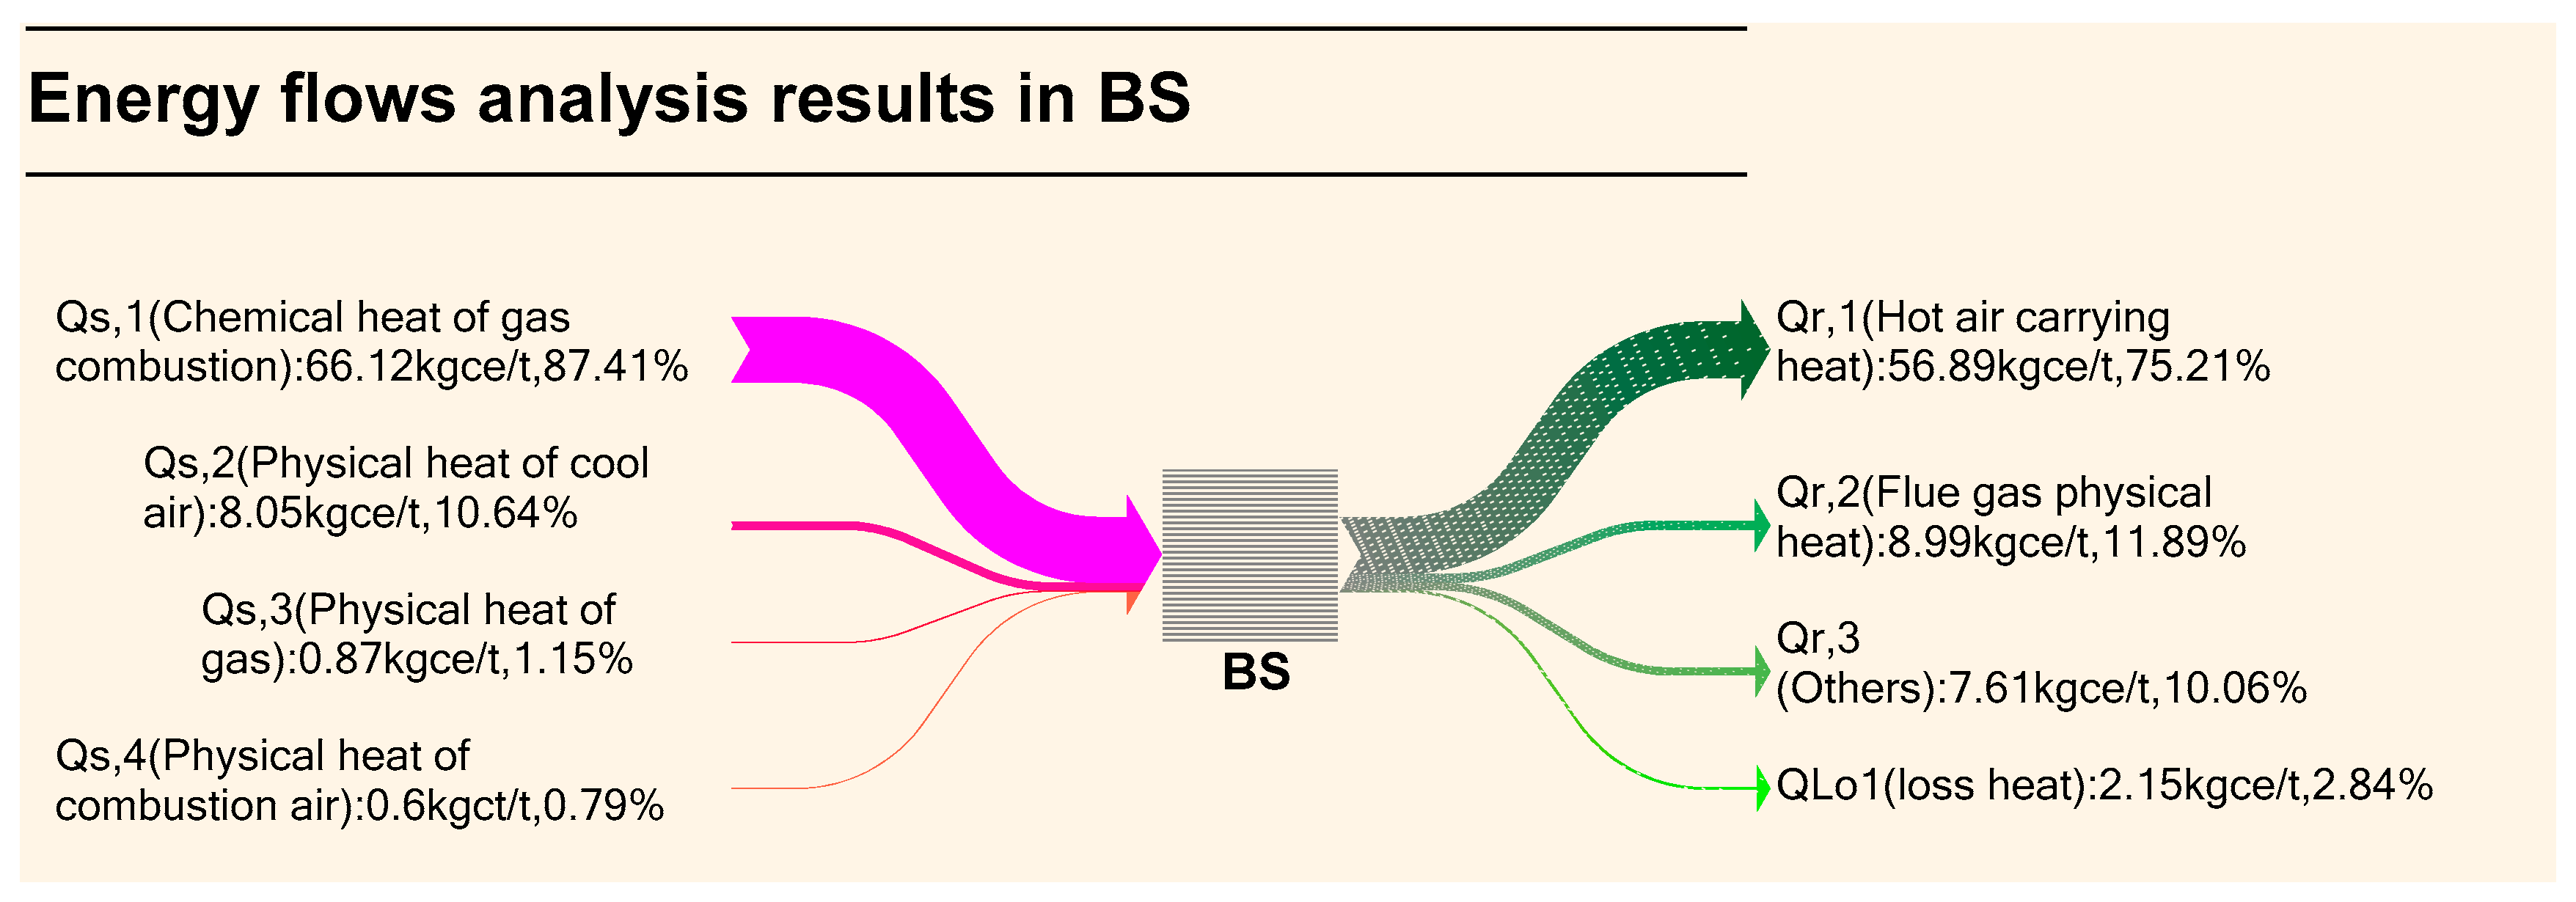
The energy flows analysis results of the BS are shown in Figure 5.
(i) The energy flow input items and output items are all listed out through thermal equilibrium in BS.
(ii) The proportions of energy flow input items and output items are all clearly indicated in BS. For example, chemical heat of gas combustion (Qs,1) is the main input item (accounted for about 87%) among all energy flow input items in BS. The 75% amount of heat quantity has carried out by hot air carrying heat (Qr,1) in all energy flow output items.
(2) Energy flows analysis of the BF body:
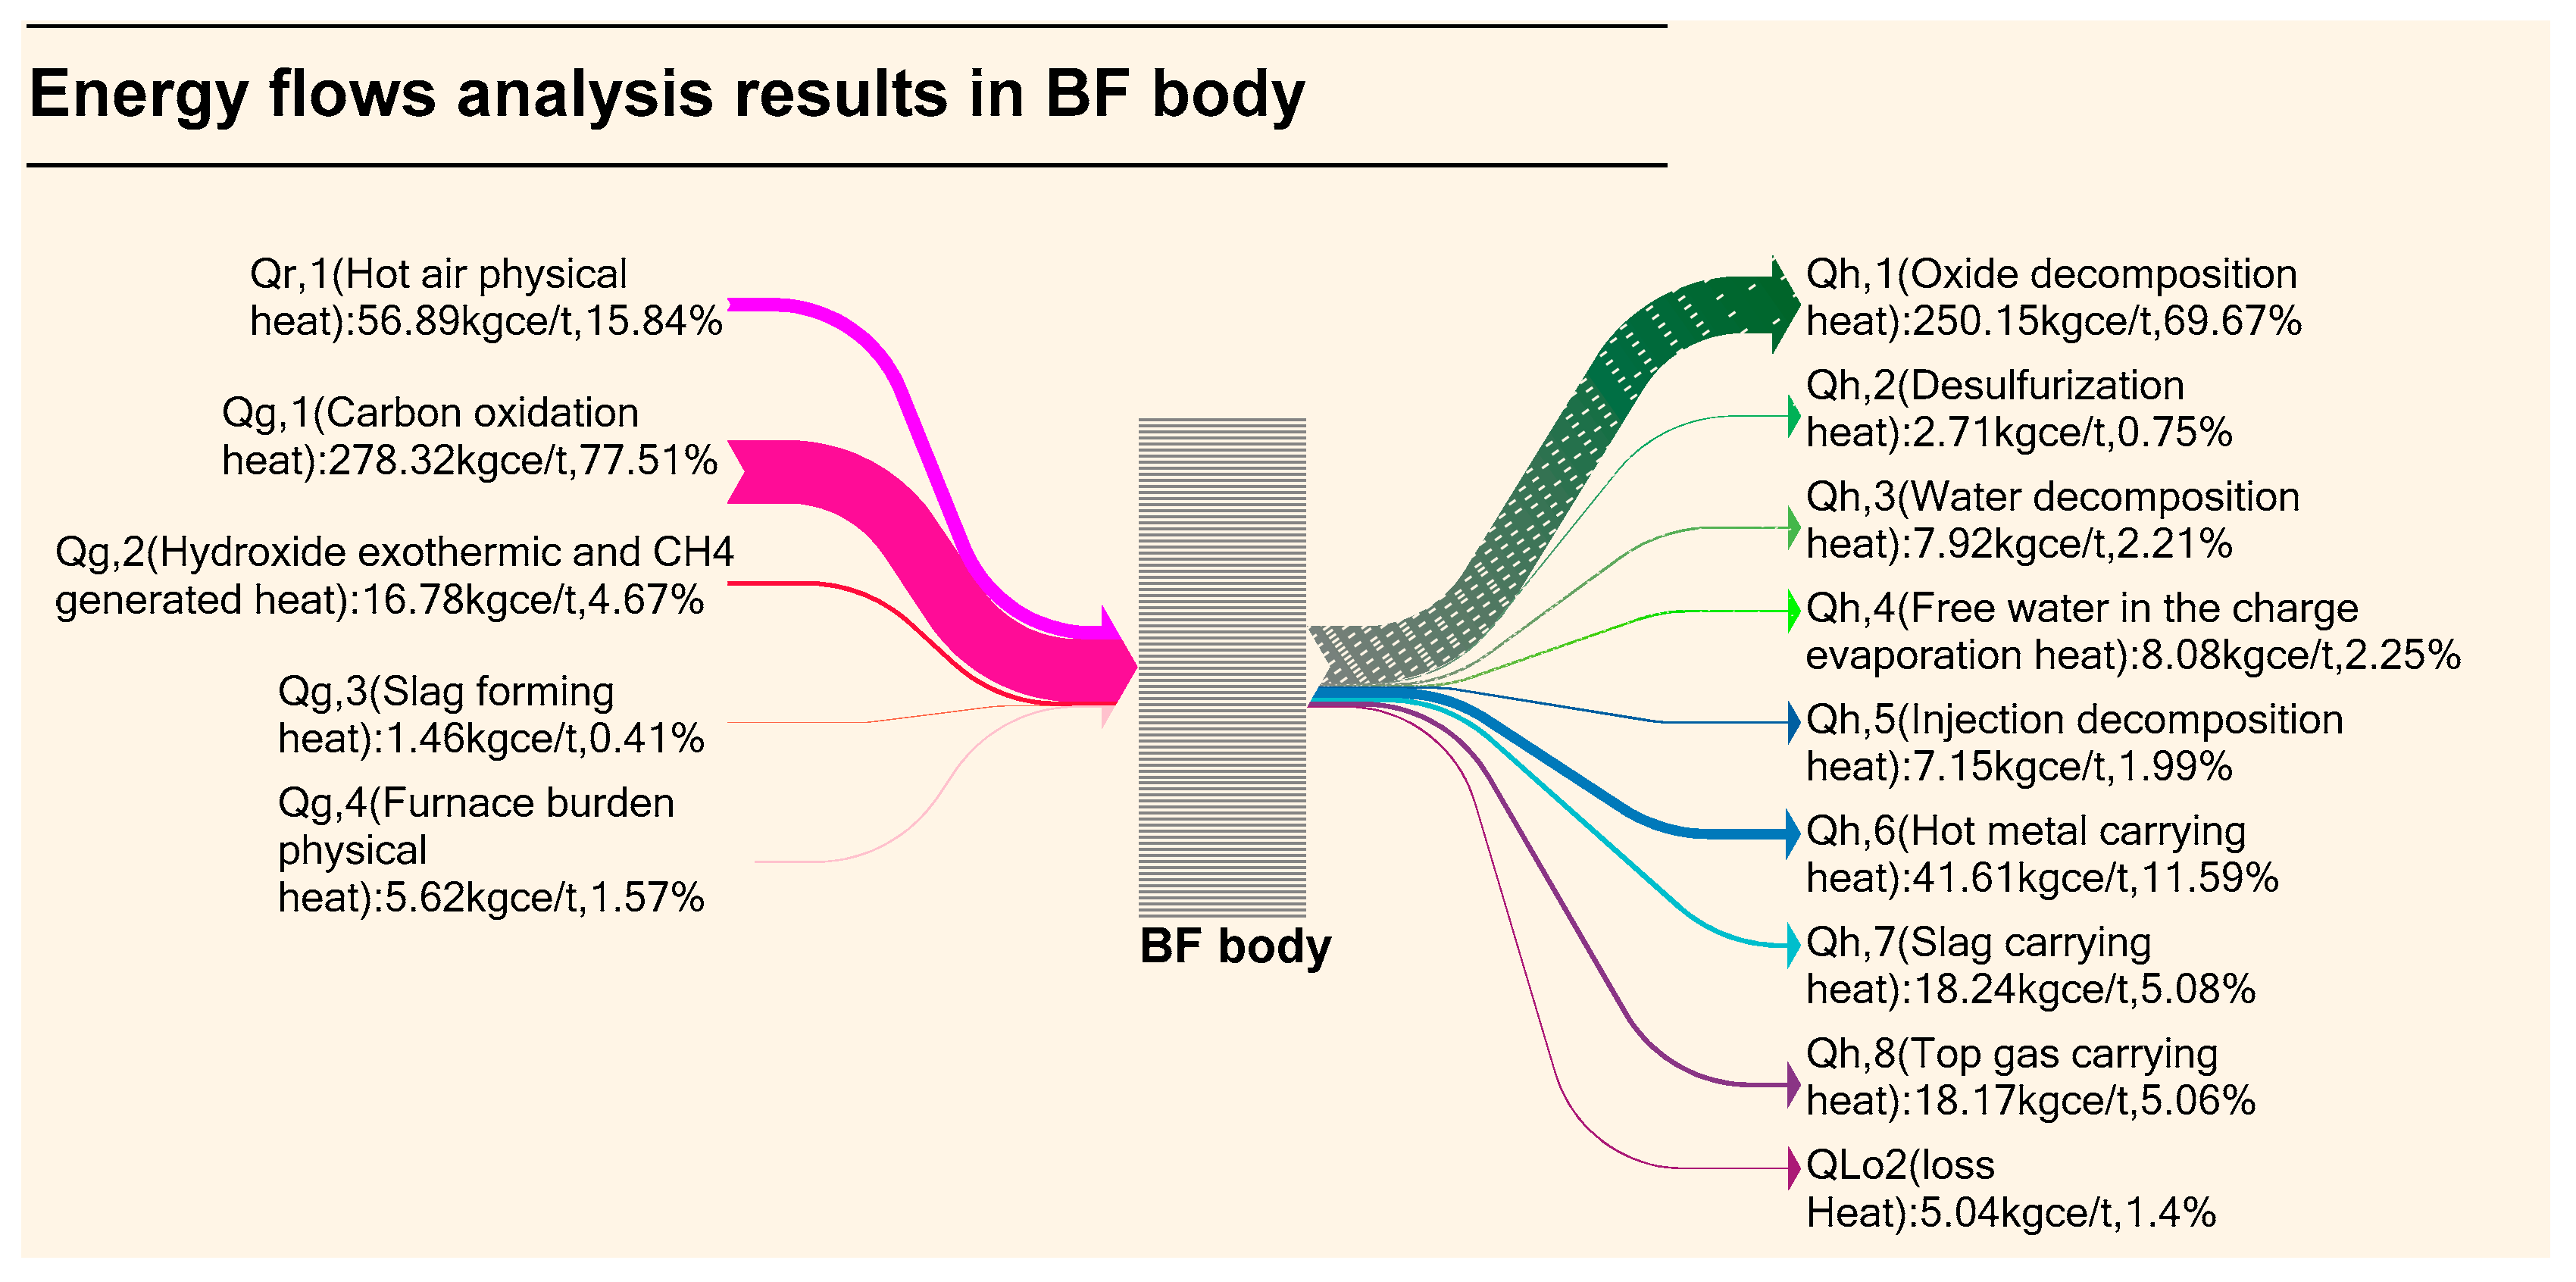
The energy flows analysis results of the BF body are shown in Figure 6.
(i) The energy flow input items and output items are all listed out through thermal equilibrium in the BF body.
(ii) The proportions of energy flow input items and output items are all clearly indicated in the BF body. For example, the amount of hot air physical heat (Qr,1) and carbon oxidation heat (Qg,1) accounted for 93% in all energy flow input items. The oxide decomposition heat (Qh,1) and hot metal carrying heat (Qh,6) accounted for 81% in all energy flow output items.

3.3. All-Factors Analysis on Energy Consumption in BFIMP

3.3.1. PCA

As shown in Figure 6, the carbon oxidation heat (Qg,1), which accounted for 77.51% of the total heat consumption, is the main energy source in the BF body. Coke and pulverized coal injection are the main carriers of carbon oxidation heat [33,34,35]. Therefore, these two parameters can reflect the energy consumption for BFIMP.
Usually, the percentage of coke in total material consumption is called CR, the percentage of pulverized coal injection in total material consumption is called PCIR. It has been proved that that the PCIR improvement and CR reduction are the most effective energy saving measures in BFIMP [36]. Therefore, the influence factors analysis on PCIR and CR will be carried out in this paper. According to the material flows analysis results (as shown in Figure 4) and energy flows analysis results (as shown in Figure 5; Figure 6), the influence factors on CR and PCIR can be achieved. In addition, operation parameters have an important impact on CR and PCIR, too. Then, three kinds of parameters are shown in Table 1.
As shown in Table 1, the significant influence factors on the CR mainly included: Sinter size, ore grade, sinter alkalinity, sinter tumbler index, slag ratio, PCIR and blast temperature, due to their lower p values (≤0.05), whereas the PCIR is the best influence factors among them. The other influence factors were weakly correlated with CR due to their higher p values (>0.05). Moreover, the significant influence factors on the PCIR mainly included: Sinter grade, ore grade, sinter alkalinity, M10, blast volume, blast temperature, oxygen enrichment ratio and top temperature, due to their lower p values (≤0.05).

3.3.2. MLR Models on CR and PCIR

The CR and the PCIR prediction models could be established through MLR models, based on the high correlation influence factors (as shown in Table 1). On the one hand, these prediction models have higher precision. On the other hand, this method could reduce the prediction models complexity due to a reduction in the number of variables.
Then, the fitting degrees of the MLR models were 95% and 94% respectively. In addition, these models were validated by actual production data, too. The fitting coefficients are shown in Table 2. Standardized coefficients (as shown in Table 2), which were calculated through the normalization method, eliminated the influence of dimensional differences among various parameters. Therefore, standardized coefficients could qualitatively reflect the influence intensity of each parameter on CR and PCIR. As shown in Table 2, the PCIR had the highest correlation with the CR among the main factors. Meanwhile, sinter grade had the highest correlation with the PCIR.

4. Discussion

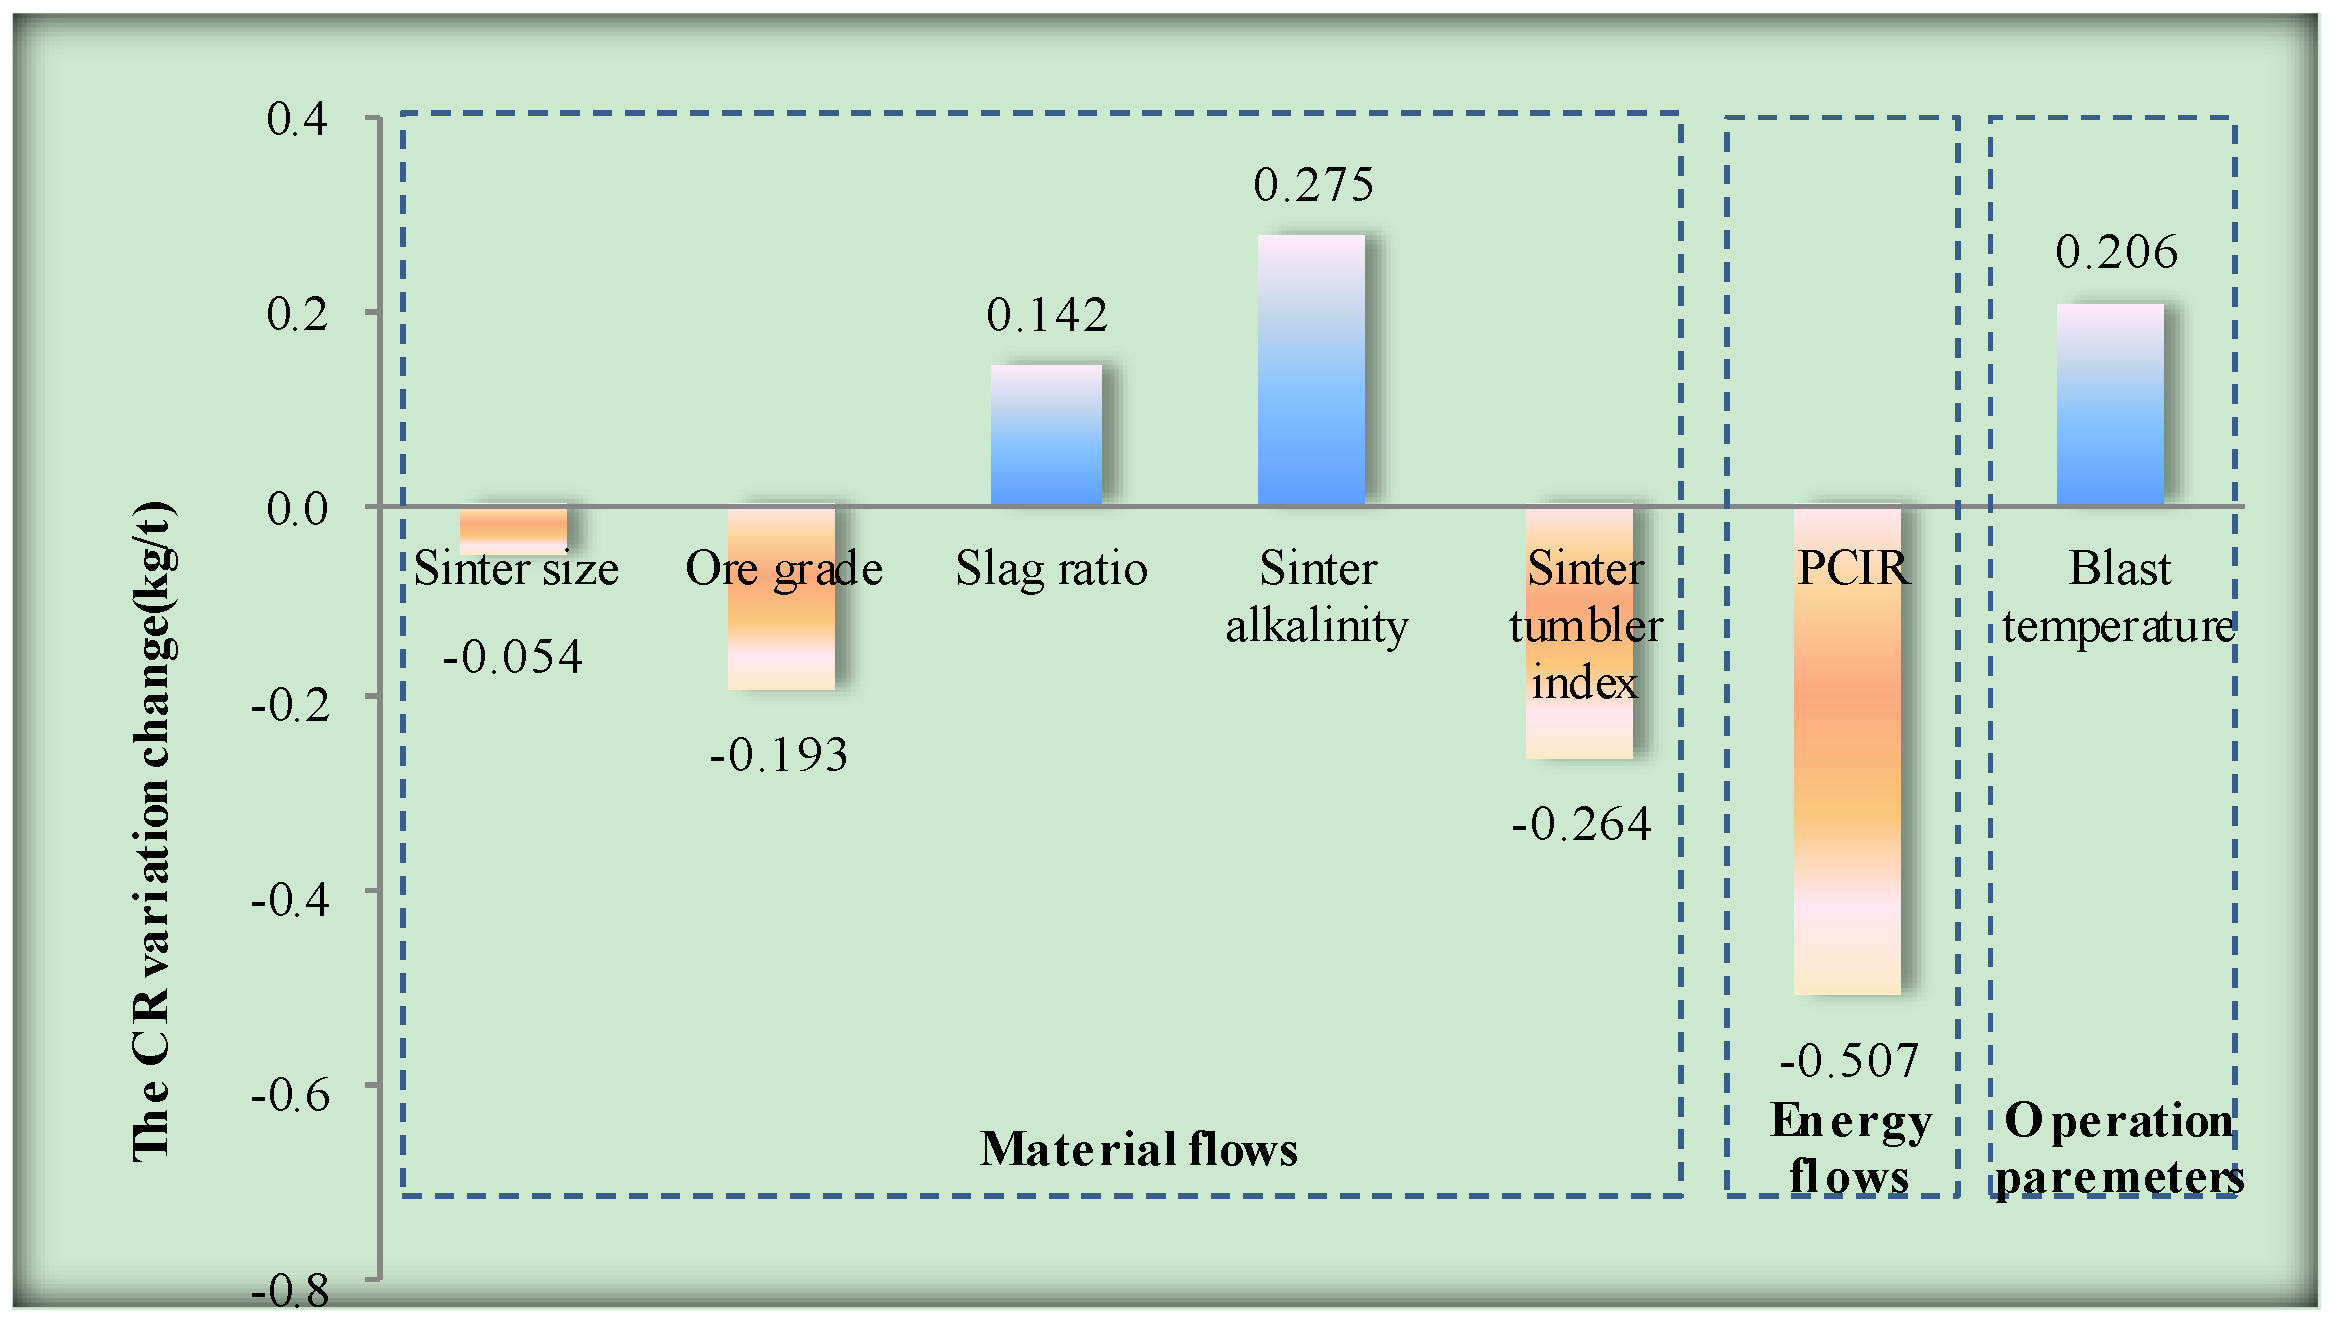
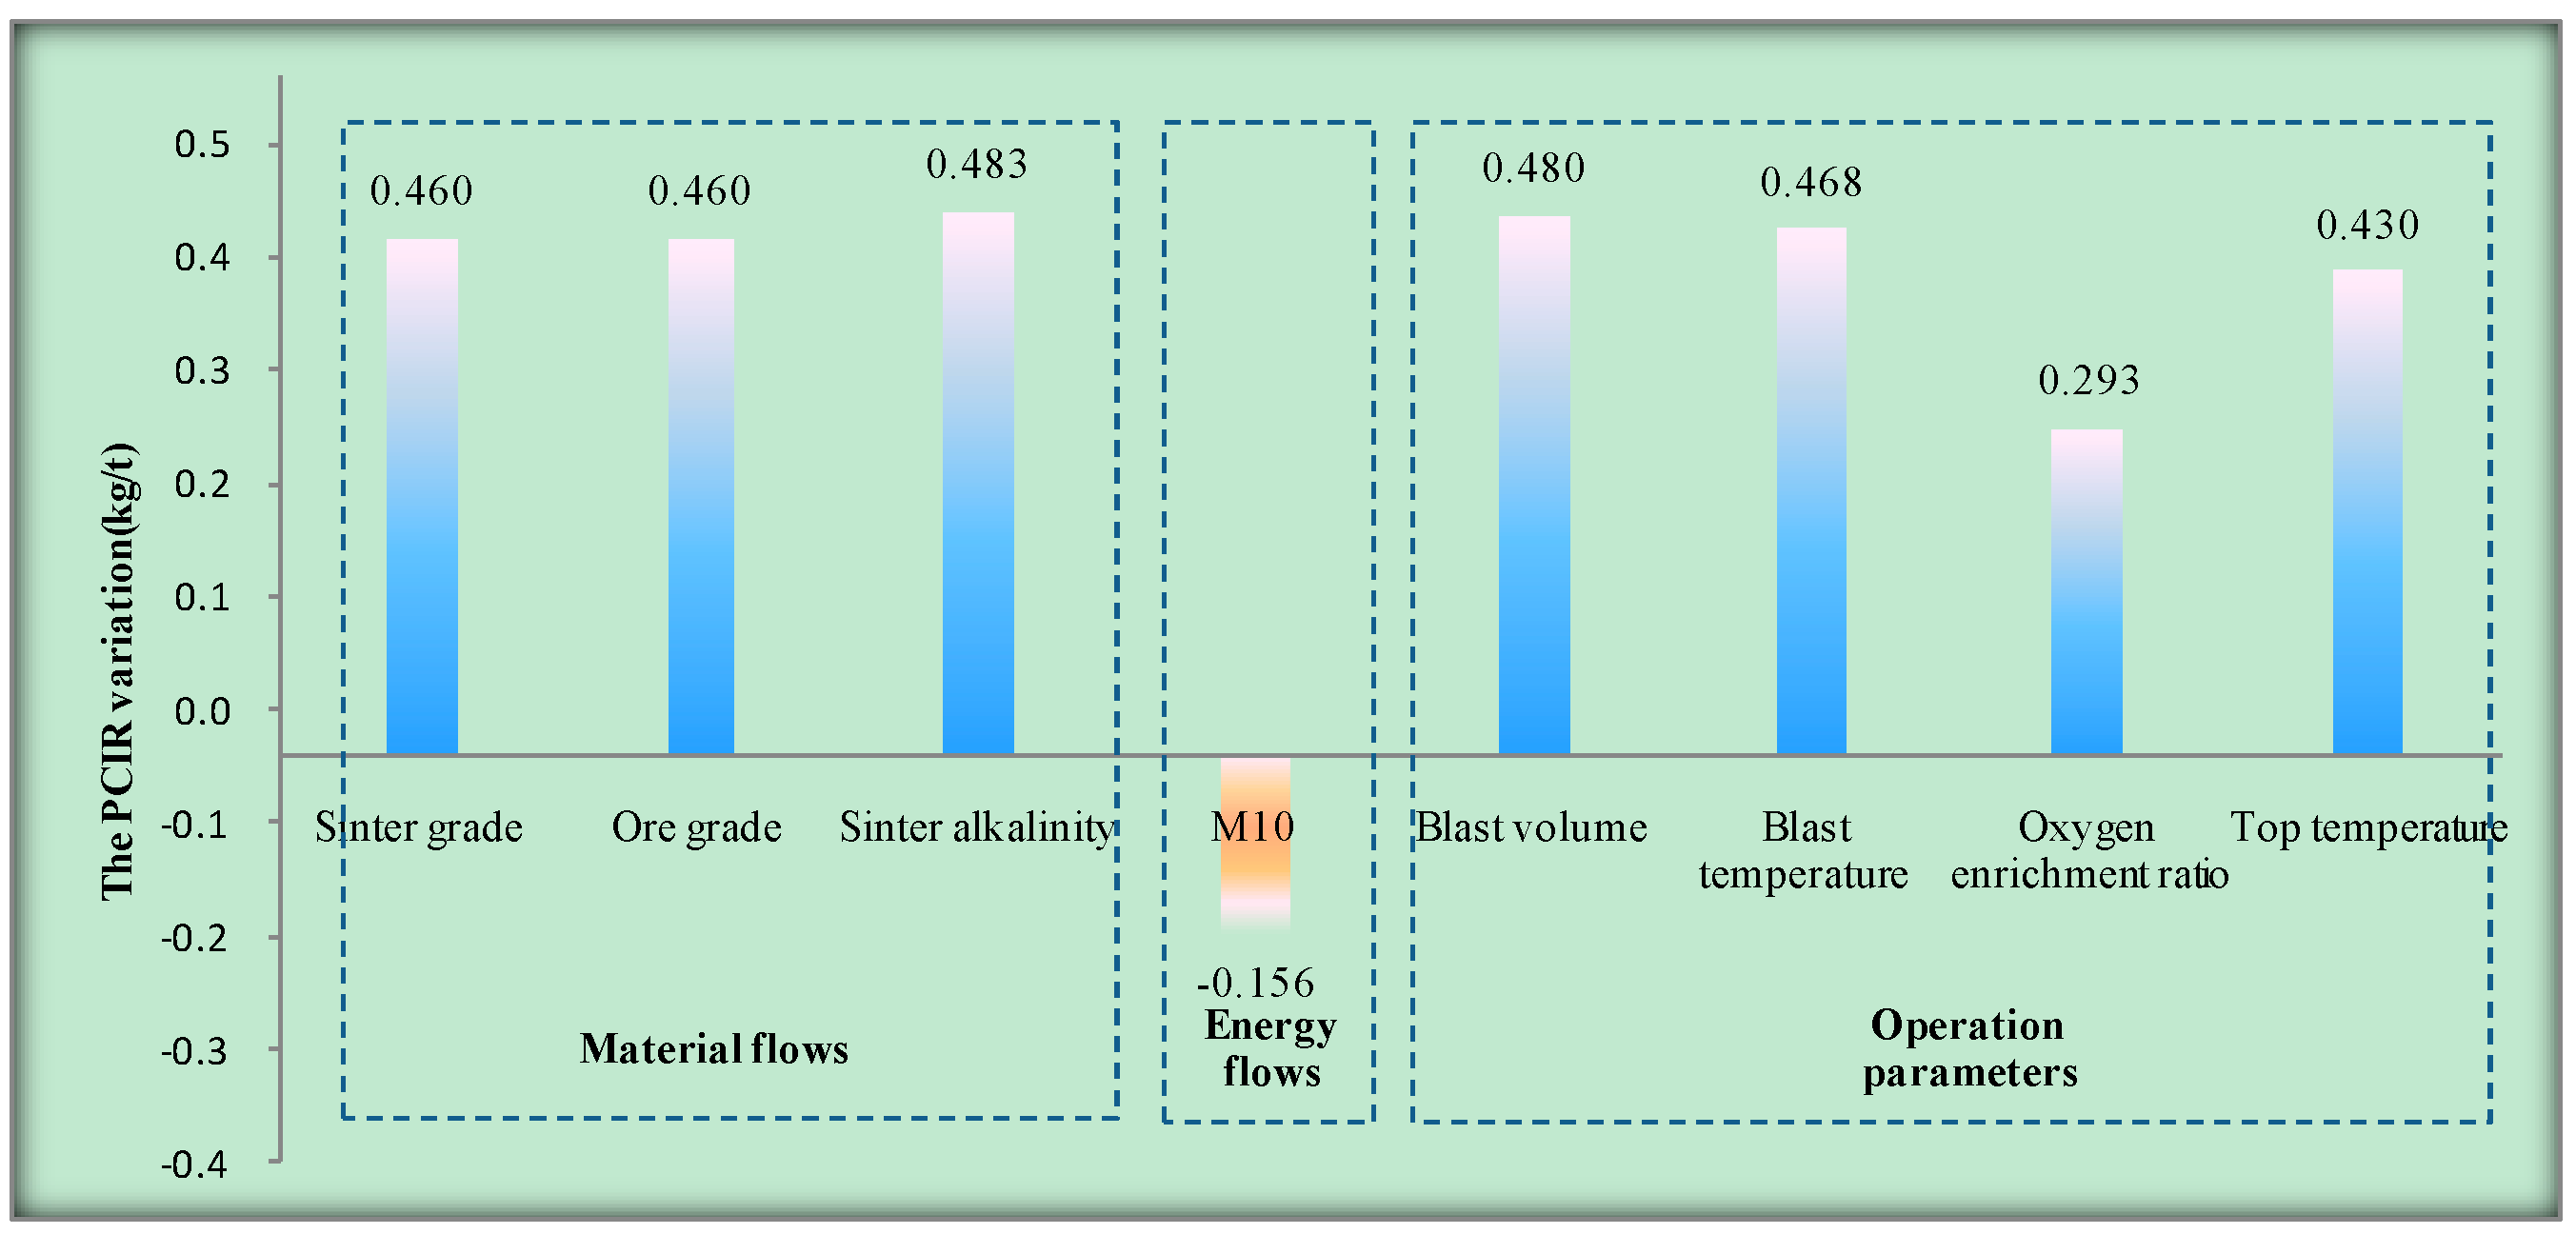
Furthermore, a quantitative analysis was adopted to evaluate the influence intensity of the factors (independent variables) on the dependent variables (CR or PCIR). Generally, every independent variable was divided into 100 parts between minimum and maximum, which was achieved using historical production data (as shown in Table 3). Then, the variation of the dependent variable, which was caused by the change of independent variable 1%, could be calculated through MLR models. Quantitative influence intensity of significant factors on CR and PCIR are shown in Figure 7 and Figure 8.
Slag ratio, sinter alkalinity and blast temperature had a positive influence on CR (as shown in Figure 7), the other factors had a negative influence. Meanwhile, the influence intensity of PCIR was the greatest among them on CR. CR would reduce by 0.507 kg/t when PCIR increased by 1% (0.84 kg/t), whereassinter size was the weakest.
As shown in Figure 8, M10 had a negative influence on PCIR among the main factors. The other factors had a positive influence. The influence intensity of sinter alkalinity was the greatest among them on PCIR. PCIR would increase by 0.483 kg/t when sinter alkalinity was promoted to 1% (0.005%), whereas M10 was the weakest.
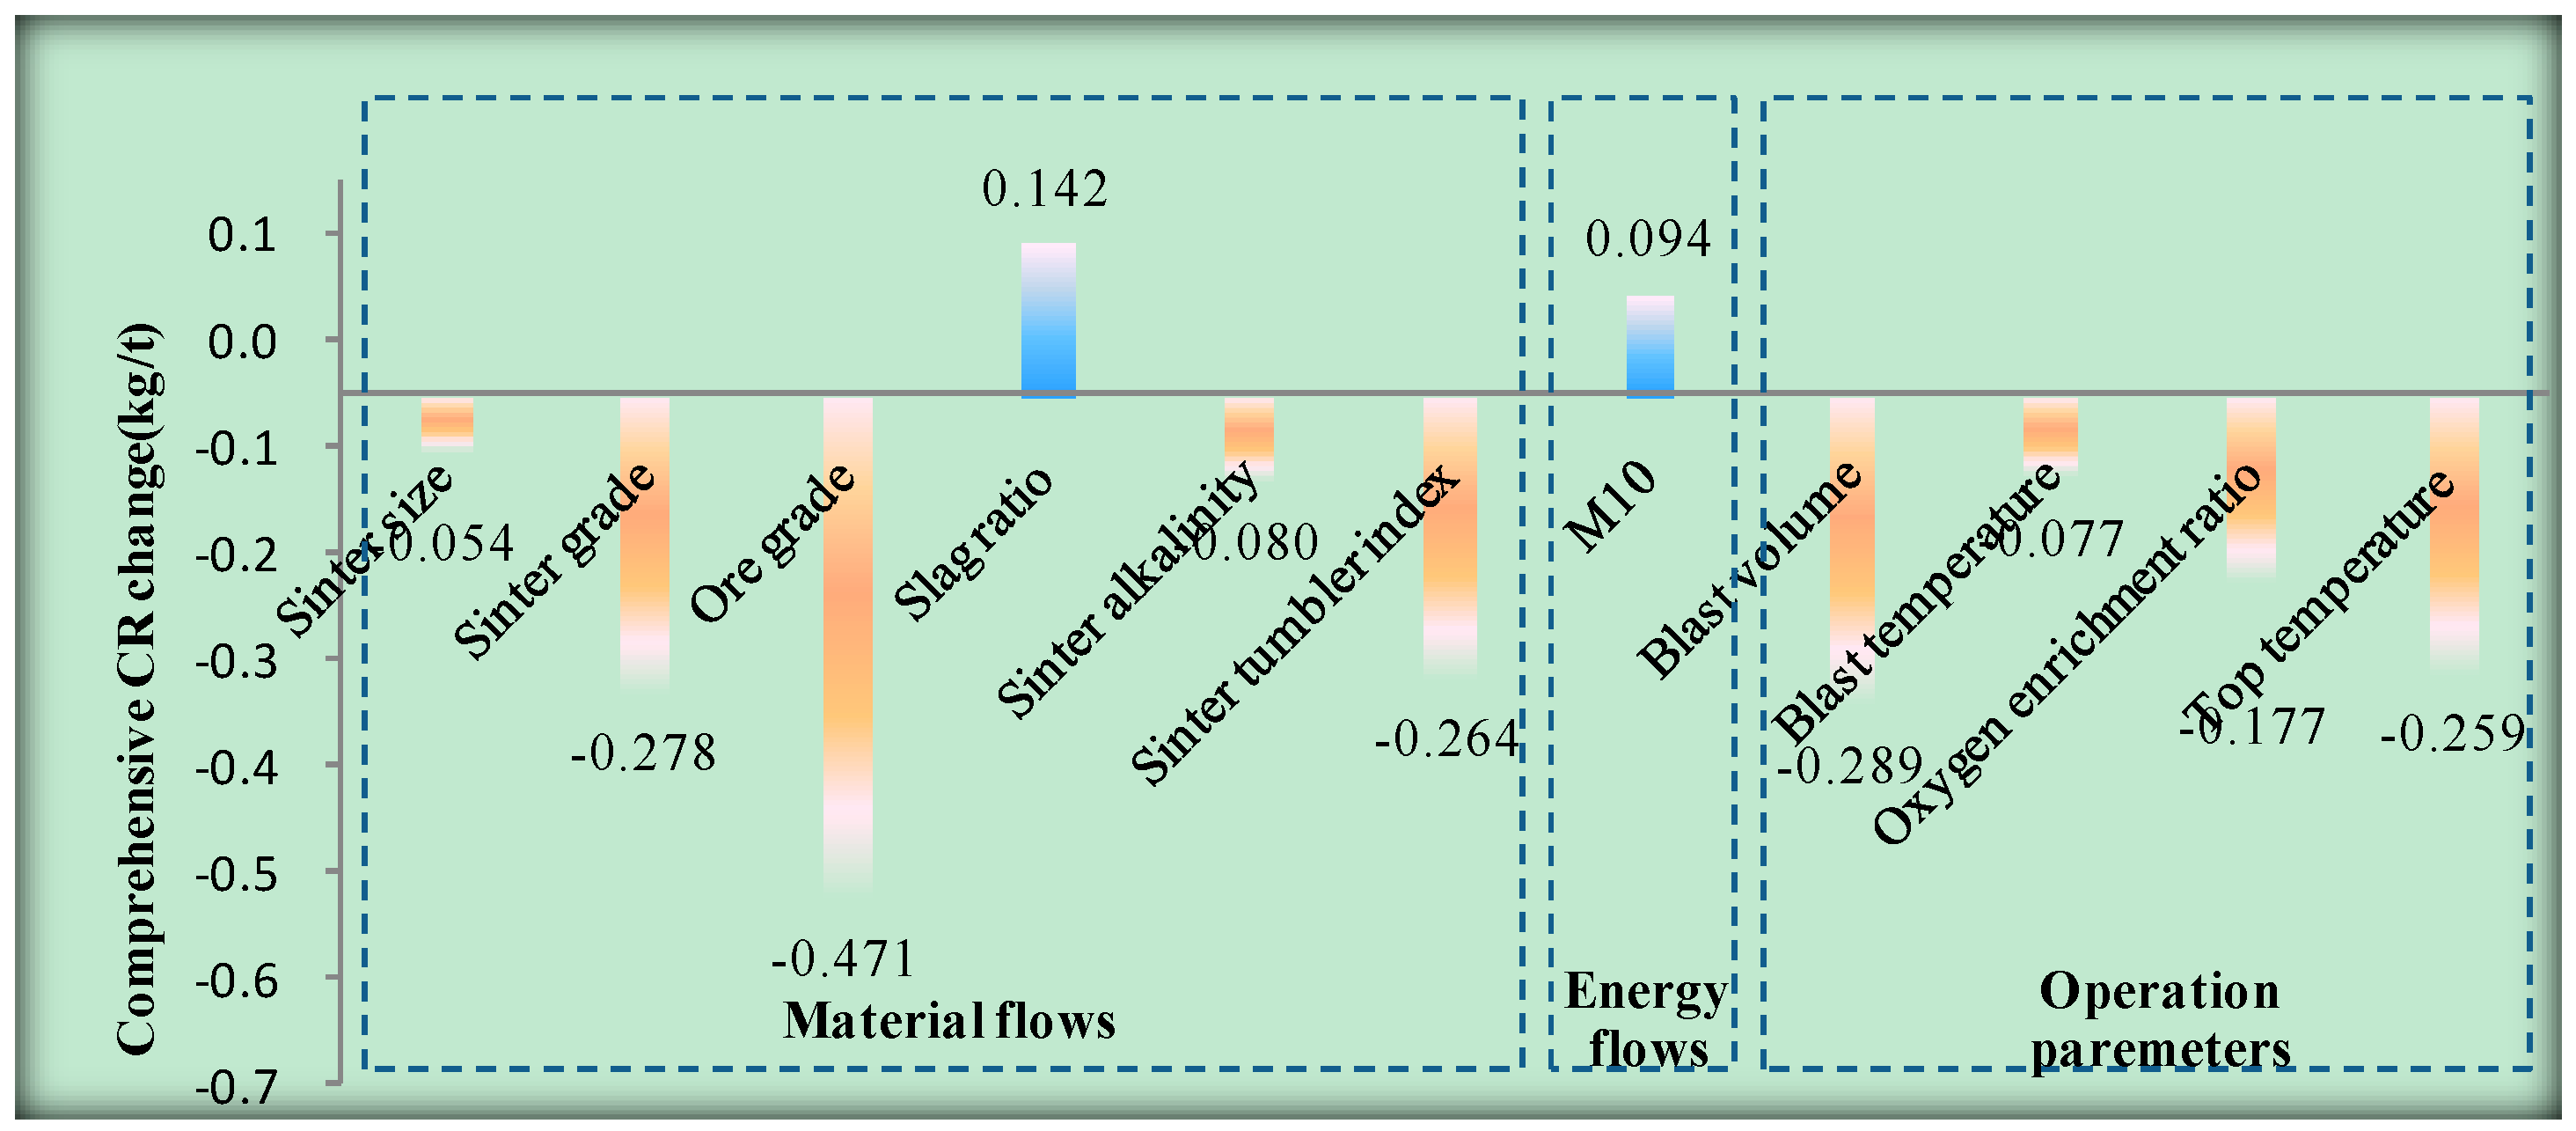
As shown previously, some factors not only affected the CR, but also affected the PCIR, such as ore grade, sinter alkalinity and blast temperature. For example, CR would decrease and PCIR would increase with ore grade increasing. Furthermore, CR would continue to fall due to the improvement of PCIR (as shown in Figure 7 and Figure 8). Therefore, ore grade had a comprehensive effect on CR. Meanwhile, it was the same for sinter alkalinity and blast temperature. In order to further analyze this problem, the influence factors, which affected PCIR, were converted to CR. Consequently, the comprehensive influence intensity on CR could be achieved (as shown in Figure 9).
In general, the slag ratio and M10 had a positive influence on CR among influence factors, whereas the rest of the factors had a negative influence (as shown in Figure 9). Meanwhile, the influence intensity of the ore grade was the strongest; the sinter size was the weakest among the material parameters. CR would reduce by 0.471 kg/t, when the ore grade increased by 1% (0.48 kg/t). CR would only reduce by 0.054 kg/t, when the sinter size increased by 1% (0.053 mm). It is worth mentioning that ore grade and sinter alkalinity had a positive influence not only on PCIR, but also on CR. Although CR would increase with the improvement of ore grade and sinter alkalinity, CR would reduce with the improvement of PCIR, which was also caused by increasement of ore grade and sinter alkalinity. Therefore, ore grade and sinter alkalinity had a negative influence on CR finally after conversion calculation.
M10, which belongs to the unique energy flows parameter, had an impact on CR. CR would increase by 0.094kg/t when the M10 increased by 1% (0.021%).
Among the operation parameters, the influence intensity of blast volume was the strongest. CR would reduce by 0.289 kg/t when blast volume increased by 1% (7.09 m3/min), whereas blast temperature was the weakest. As before, blast temperature had also a positive influence on the CR and PCIR (as show in Figure 7 and Figure 8). Eventually, blast temperature had a negative influence on CR after conversion calculation (as shown in Figure 9). CR would reduce by 0.077 kg/t when blast temperature increased by 1% (1.64°C).
In summary, there were many influence factors, which determined the amount of PCIR and CR. Therefore, it is a very important energy saving direction to determine how to improve these influence factors in BFIMP. Then, three kinds of parameters (material flows, energy flows and operation parameters) will be further discussed.
(1) Material flows improvement:
The improvement of sinter size, ore grade, sinter grade, sinter tumbler index and sinter alkalinity could improve the permeability in the BF body. Moreover, the production status could be more stable. Therefore, the improvement of these factors provides favorable conditions for increasing the PCIR. Meanwhile, the improvement of ore grade and sinter grade is conducive to a reduction of the slag ratio. Moreover, the amount of PCIR and CR will also drop.
(2) Energy flows improvement:
M10 is a physical performance index, which can reflect the coke abrasion strength. The decrease of M10 is beneficial to charge column permeability for gas in the BF body, too. Therefore, if the amount of pulverized coal injection is further increased, the quantity of coke could be dropped.
(3) Operation parameters improvement:
The increase of blast volume, blast temperature and oxygen enrichment ratio can effectively maintain a high temperature in the combustion zone. Moreover, they are also conducive to accelerating the pulverized coal decomposition and combustion. In addition, the improvement of blast volume and blast temperature is also favorable to blow the hearth center of the BF body (especially for pyknic-type BF). Furthermore, the increase of blast temperature, which can improve the heat input of the BF body, can reduce the demand for coke or pulverized coal. Meanwhile, the combustion efficiency of coke and pulverized coal are improved due to the increase of the oxygen enrichment ratio. Then, the amount of flue gas is further reduced. Therefore, the improvements of blast volume, blast temperature and oxygen enrichment ratio are very effective measures of energy saving in BFIMP. Additionally, top temperature, which directly can reflect gas distribution and blast furnace status, is determined by heat exchange between blast furnace gas and furnace charge. CR will drop with top temperature increasing. Therefore, top temperature, which is controlled in higher areas within allowable range, is also an effective energy saving measure.
The analysis indicates the following findings.
(1)
The effective energy saving measures could be achieved through the all-factors analysis approach.
(2)
The case study shows that there were 26 influence factors on energy consumption in BFIMP. Nevertheless, the seven influence factors were highly correlated with CR, and the eight influence factors had highly correlation on PCIR through the PCA analysis.
(3)
The PCIR improvement was the most effective measure for reducing CR, and the increase of sinter alkalinity was the most favorable for PCIR in the case BFIMP.

5. Conclusions

An all-factors analysis approach on energy consumption for BFIMP in the iron and steel industry was proposed in this paper. Then, the all-factors analysis approach was successfully applied to a case BFIMP. The key influence factors on energy consumption were identified in this case BFIMP. Lastly, some suggestions on energy conservation were put forward. Generally, the major contributions of this paper are described as follows:
(1)
An all-factors analysis approach on energy consumption was proposed in BFIMP in this paper. This method mainly included four steps: Data collection, all-factors analysis based on material flows and energy flows, influence intensity analysis on energy consumption in BFIMP and suggestion and summary. The availability of this method was validated by a case BFIMP.
(2)
The case study shows that the improvement of PCIR was conducive to a reduction of CR very much. The increase of sinter alkalinity was the most effective measure for PCIR.
(3)
The proposed all-factors analysis approach on energy consumption, which provided an effective measure of energy saving, could widely be used in various BFIMPs, too.

Author Contributions

Conceptualization: D.C. and B.L.; methodology, B.L.; validation, D.C. and S.W.; formal analysis, D.C. and S.W.; investigation, D.C., B.L. and S.W.; resources, D.C. and B.L.; data curation, B.L. and Kai Tang; writing—original draft preparation, D.C. and B.L.; writing—review and editing, Biao Lu; visualization, B.L., K.T. and S.W.; supervision, B.L. and S.W.; funding acquisition, D.C. and B.L.

Funding

This research was funded by the National Nature Science Foundation of China (Grant NO. 51804002) and the Scientific Researching Fund Projects for Young Teacher of Anhui University of Technology (Grant NO. QZ201614).

Acknowledgments

The authors would like to thank XuShi for help with administrative and technical support.

Conflicts of Interest

The authors declare no conflict of interest.

References

  1. Mauricio, R.; Mikko, H.; Henrik, S. Principal Component Analysis of Blast Furnace Drainage Patterns. Processes 2019, 7, 519. [Google Scholar] [CrossRef]
  2. Lu, B.; Tang, K.; Chen, D.; Han, Y.; Wang, S.; He, X.; Chen, G. A Novel Approach for Lean Energy Operation Based on Energy Apportionment Model in Reheating Furnace. Energy 2019, 182, 1239–1249. [Google Scholar] [CrossRef]
  3. Matsuda, K.; Tanaka, S.; Endou, M.; Iiyoshi, T. Energy saving study on a large steel plant by total site based pinch technology. Appl. Therm. Eng. 2012, 43, 14–19. [Google Scholar] [CrossRef]
  4. Lu, B.; Chen, G.; Chen, D.; Yu, W. An energy intensity optimization model for production system in iron and steel industry. Appl. Therm. Eng. 2016, 100, 285–295. [Google Scholar] [CrossRef]
  5. Chen, D.; Lu, B.; Chen, G.; Yu, W. Influence of the production fluctuation on the process energy intensity in iron and steel industry. Adv. Prod. Eng. Manag. 2017, 12, 75–87. [Google Scholar] [CrossRef] [Green Version]
  6. Chen, W.; Yin, X.; Ma, D. A bottom-up analysis of China’s iron and steel industrial energy consumption and CO2 emissions. Appl. Energy 2014, 136, 1174–1183. [Google Scholar] [CrossRef]
  7. Li, Y.; Zhu, L. Cost of energy saving and CO2 emissions reduction in China’s iron and steel sector. Appl. Energy 2014, 130, 603–616. [Google Scholar] [CrossRef]
  8. Cai, W.; Liu, C.; Lai, K.; Li, L.; Cunha, J.; Hu, L. Energy performance certification in mechanical manufacturing industry: A review and analysis. Energy Convers. Manag. 2019, 186, 415–432. [Google Scholar] [CrossRef]
  9. Emi, T. Optimizing Steelmaking System for Quality Steel Mass Production for Sustainable Future of Steel Industry. Steel Res. Int. 2014, 85, 1274–1282. [Google Scholar] [CrossRef]
  10. Liu, X.; Chen, L.; Feng, H.; Qin, X.; Sun, F. Constructal design of a blast furnace iron-making process based on multi-objective optimization. Energy 2016, 109, 137–151. [Google Scholar] [CrossRef]
  11. Yilmaz, C.; Wendelstorf, J.; Turek, T. Modeling and simulation of hydrogen injection into a blast furnace to reduce carbon dioxide emissions. J. Clean. Prod. 2017, 154, 488–501. [Google Scholar] [CrossRef]
  12. Hou, Q.; Dianyu, E.; Kuang, S.; Li, Z.; Yu, A.B. DEM-based virtual experimental blast furnace: A quasi-steady state model. Powder Technol. 2017, 314, 557–566. [Google Scholar] [CrossRef]
  13. Jin, P.; Jiang, Z.; Bao, C.; Lu, Y.; Zhang, J.; Zhang, X. Mathematical Modeling of the Energy Consumption and Carbon Emission for the Oxygen Blast Furnace with Top Gas Recycling. Steel Res. Int. 2016, 87, 320–329. [Google Scholar] [CrossRef]
  14. Zhou, P.; Yuan, M.; Wang, H.; Chai, T. Data-Driven Dynamic Modeling for Prediction of Molten Iron Silicon Content Using ELM with Self-Feedback. Math. Probl. Eng. 2015, 2015, 326160. [Google Scholar] [CrossRef]
  15. Yin, R. The essence function and future development model of steel manufacturing process. Sci. China Technol. Sci. 2008, 38, 1365–1377. [Google Scholar]
  16. Zetterholm, J.; Ji, X.; Sundelin, B.; Martin, P.M.; Wang, C. Model development of a blast furnace stove. Energy Procedia 2015, 75, 1758–1765. [Google Scholar] [CrossRef]
  17. Liu, X.; Chen, L.; Qin, X.; Sun, F. Exergy loss minimization for a blast furnace with comparative analyses for energy flows and exergy flows. Energy 2015, 93, 10–19. [Google Scholar] [CrossRef]
  18. Zhou, B.; Ye, H.; Zhang, H.; Li, M. Process monitoring of iron-making process in a blast furnace with PCA-based methods. Control Eng. Pract. 2016, 47, 1–14. [Google Scholar] [CrossRef]
  19. Jin, P.; Jiang, Z.; Bao, C.; Hao, S.; Zhang, X. The energy consumption and carbon emission of the integrated steel mill with oxygen blast furnace. Resour. Conserv. Recy. 2017, 117, 58–65. [Google Scholar] [CrossRef]
  20. Kuang, S.B.; Li, Z.Y.; Yan, D.L.; Qi, Y.H.; Yu, A.B. Numerical study of hot charge operation in iron making blast furnace. Miner. Eng. 2014, 63, 45–56. [Google Scholar] [CrossRef]
  21. Liao, J.; Yu, A.B.; Shen, Y. Modelling the injection of upgraded brown coals in an ironmaking blast furnace. Powder Technol. 2017, 314, 550–556. [Google Scholar] [CrossRef]
  22. Dong, Z.; Wang, J.; Zuo, H.; She, X.; Xue, Q. Analysis of gas–solid flow and shaft-injected gas distribution in an oxygen blast furnace using a discrete element method and computational fluid dynamics coupled model. Particuology 2017, 32, 63–72. [Google Scholar] [CrossRef]
  23. Miao, Z.; Zhou, Z.; Yu, A.B.; Shen, Y. CFD-DEM simulation of raceway formation in an ironmaking blast furnace. Powder Technol. 2017, 314, 542–549. [Google Scholar] [CrossRef]
  24. Yeh, C.-P.; Du, S.-W.; Tsai, C.-H.; Yang, R.-J. Numerical analysis of flow and combustion behavior in tuyere and raceway of blast furnace fueled with pulverized coal and recycled top gas. Energy 2012, 42, 233–240. [Google Scholar] [CrossRef]
  25. Shen, Y.S.; Yu, A.B. Modelling of injecting a ternary coal blend into a model ironmaking blast furnace. Miner. Eng. 2016, 90, 89–95. [Google Scholar] [CrossRef]
  26. Shen, Y.; Yu, A.; Austin, P.; Zulli, P. Modelling in-furnace phenomena of pulverized coal injection in ironmaking blast furnace: Effect of coke bed porosities. Miner. Eng. 2012, 33, 54–65. [Google Scholar] [CrossRef]
  27. Zhao, H.; Bai, Y.; Cheng, S. Effect of Coke Reaction Index on Reduction and Permeability of Ore Layer in Blast Furnace Lumpy Zone Under Non-Isothermal Condition. J. Iron Steel Res. Int. 2013, 20, 6–10. [Google Scholar] [CrossRef]
  28. De Castro, J.A.; de Mattos Araújo, G.; de Oliveira da Mota, I.; Sasaki, Y.; Yagi, J. Analysis of the combined injection of pulverized coal and charcoal into large blast furnaces. J. Mater. Res. Technol. 2013, 2, 308–314. [Google Scholar] [CrossRef] [Green Version]
  29. Gupta, S.; Ye, Z.; Kim, B.; Kerkkonen, O.; Kanniala, R.; Sahajwalla, V. Mineralogy and reactivity of cokes in a working blast furnace. Fuel Process. Technol. 2014, 117, 30–37. [Google Scholar] [CrossRef]
  30. Jiang, S.; Shen, X.; Zheng, Z. Gaussian Process-Based Hybrid Model for Predicting Oxygen Consumption in the Converter Steelmaking Process. Processes 2019, 7, 352. [Google Scholar] [CrossRef]
  31. Bahgat, M.; Halim, K.S.A.; Heba, A.E.-K.; Mahmoud, I.N. Blast Furnace Operating Conditions Manipulation for Reducing Coke Consumption and CO2 Emission. Steel Res. Int. 2012, 83, 686–694. [Google Scholar] [CrossRef]
  32. SJung, S.; Chang, W. Clustering stocks using partial correlation coefficients. Phys. A Stat. Mech. Appl. 2016, 462, 410–420. [Google Scholar]
  33. Shen, Y.S.; Yu, A.B.; Austin, P.R.; Zulli, P. CFD study of in-furnace phenomena of pulverised coal injection in blast furnace: Effects of operating conditions. Powder Technol. 2012, 223, 27–38. [Google Scholar] [CrossRef]
  34. Lomas, H.; Roest, R.; Gupta, S.; Pearson, R.A.; Fetscher, R.; Jenkins, D.R.; Pearce, R.; Kanniala, R.; Merrick, M.R. Petrographic analysis and characterisation of a blast furnace coke and its wear mechanisms. Fuel 2017, 200, 89–99. [Google Scholar] [CrossRef]
  35. Gasparinia, V.M.; de Castro, L.F.A.; Quintas, A.C.B.; de Souza Moreira, V.E.; Viana, A.O.; Andrade, D.H.B. Thermo-chemical model for blast furnace process control with the prediction of carbon consumption. J. Mater. Res. Technol. 2017, 6, 220–225. [Google Scholar] [CrossRef]
  36. Zou, C.; She, Y.; Shi, R. Particle size-dependent properties of a char produced using a moving-bed pyrolyzer for fueling pulverized coal injection and sintering operations. Fuel Process. Technol. 2019, 190, 1–12. [Google Scholar] [CrossRef]
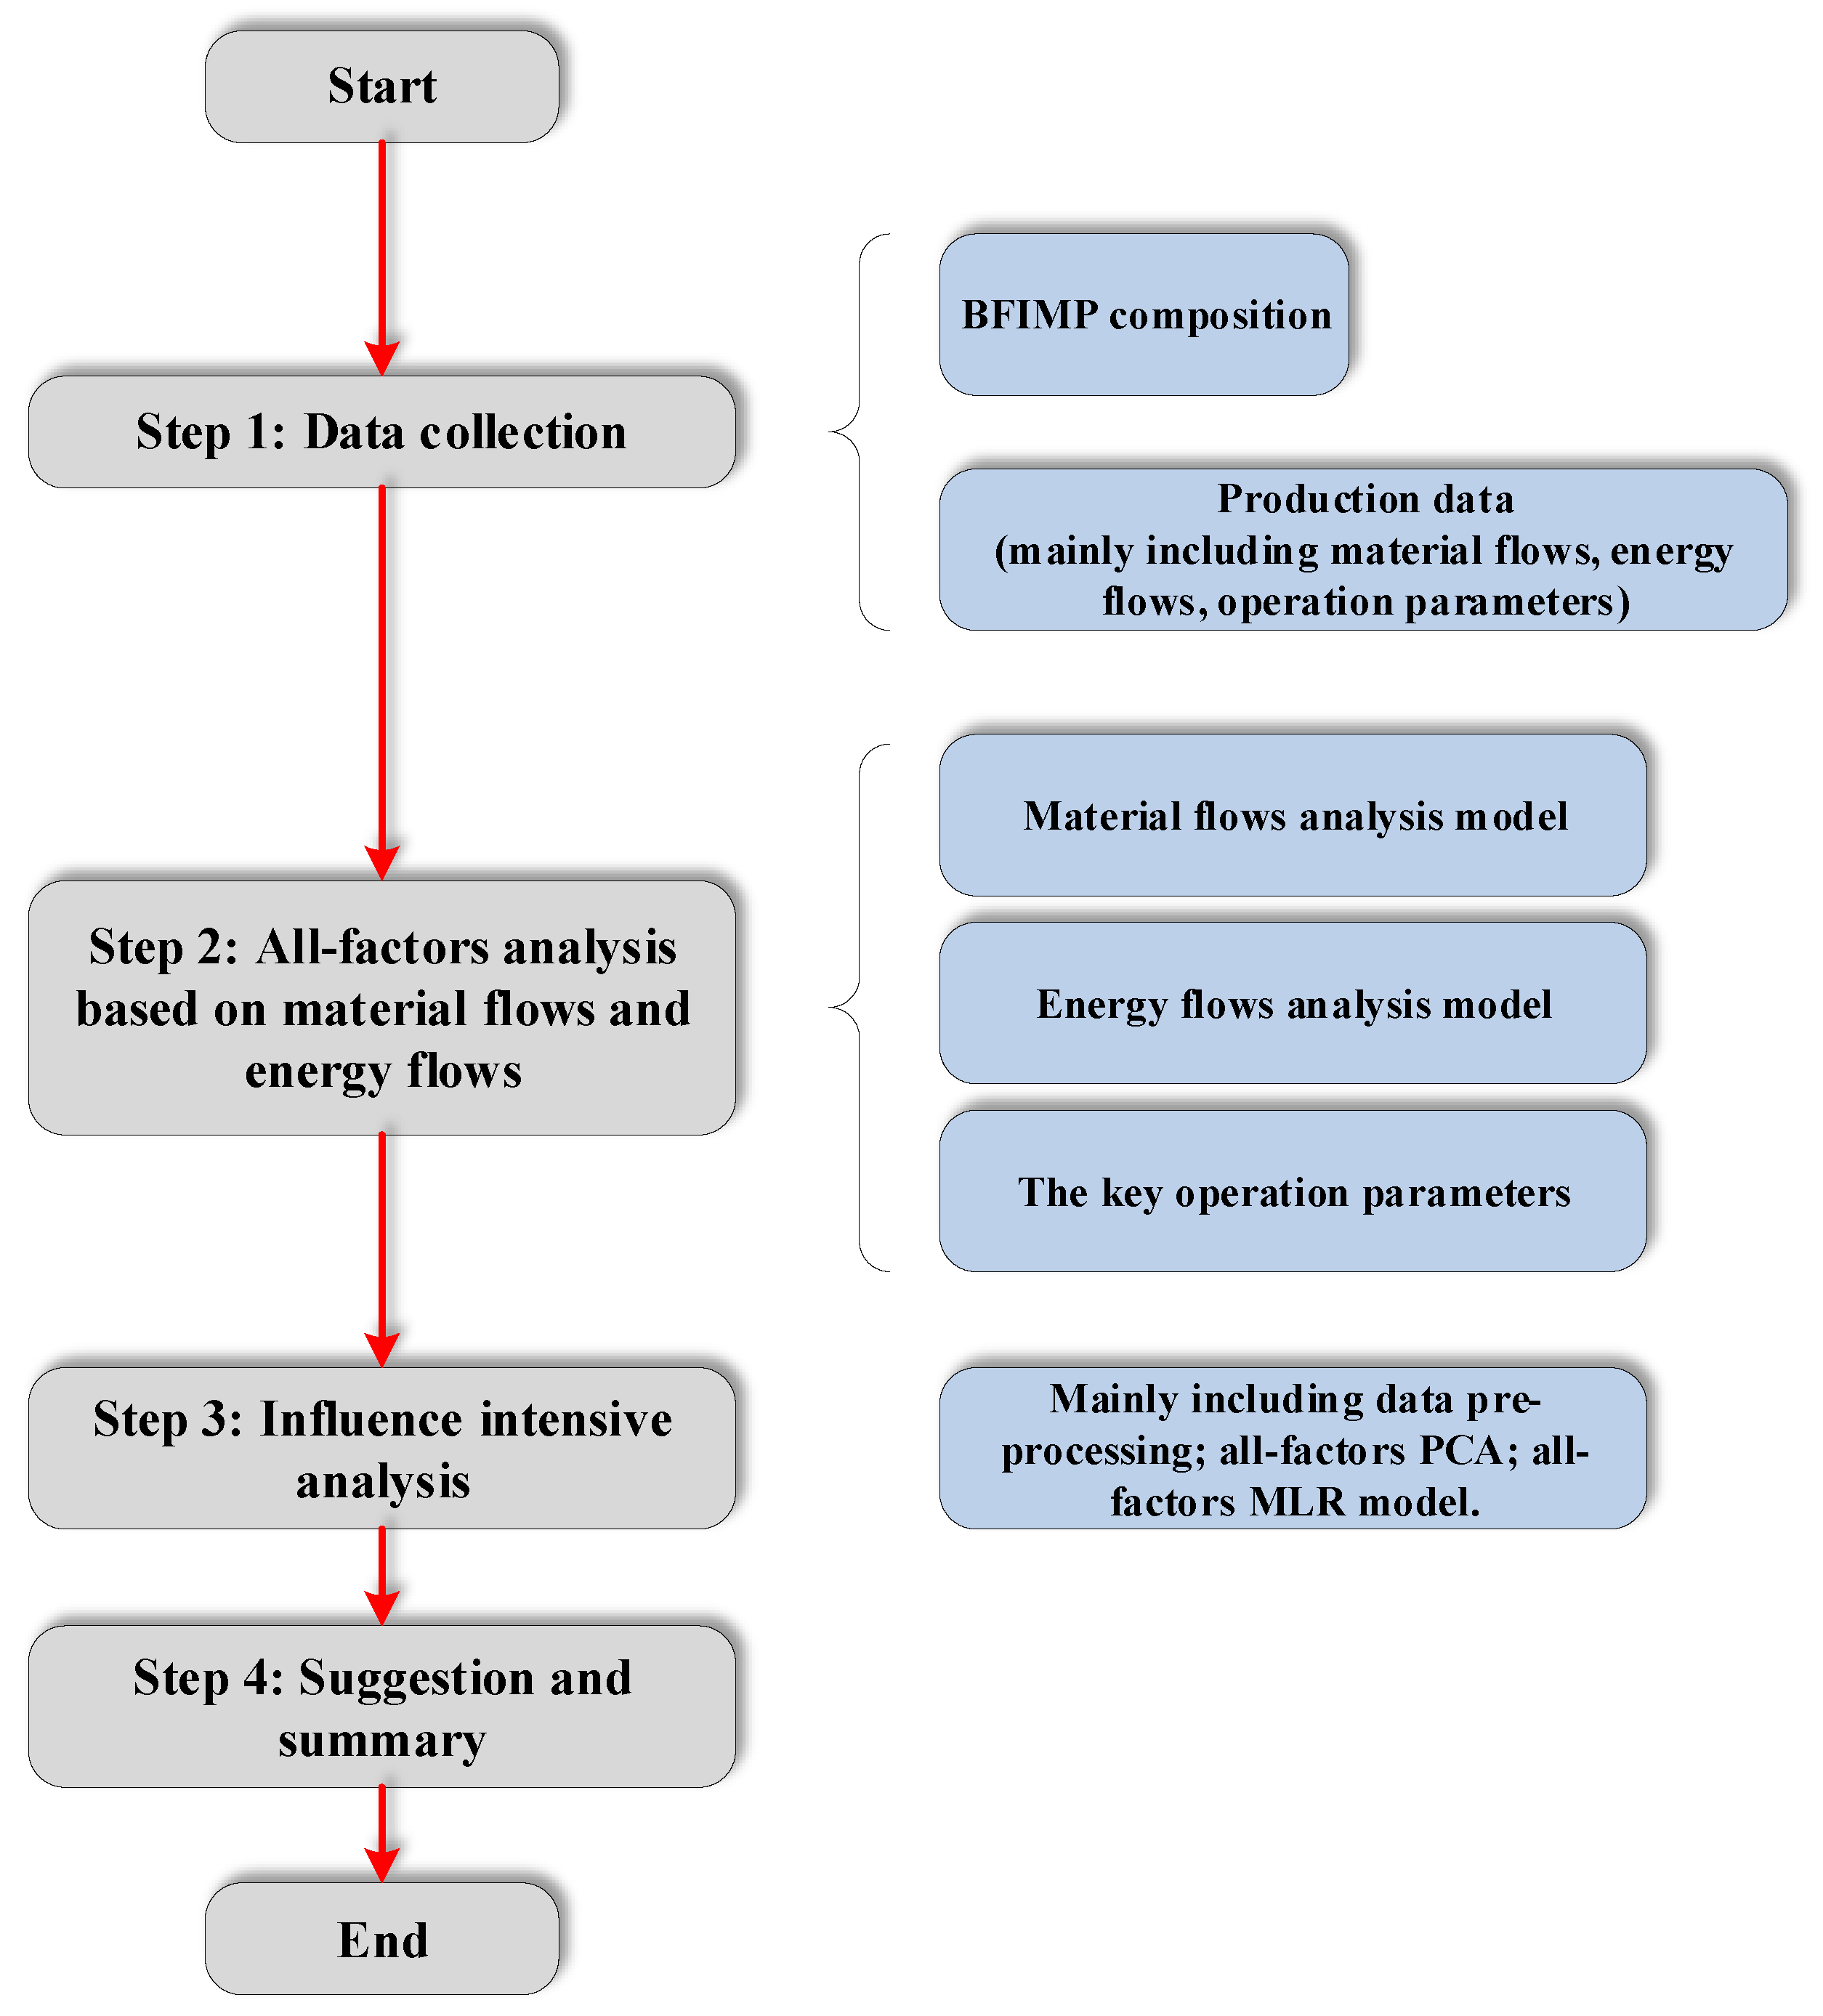
Figure 1. The research route of the all-factors analysis approach.
Processes 07 00607 g001
Figure 2. Material flows analysis model
Processes 07 00607 g002
Figure 3. Energy flows analysis model.
Processes 07 00607 g003
Figure 4. Material flows analysis results in blast furnace iron making process (BFIMP).
Processes 07 00607 g004
Figure 5. Energy flows analysis results in the blast system (BS).
Processes 07 00607 g005
Figure 6. Energy flows analysis results in the blast furnace (BF) body.
Processes 07 00607 g006
Figure 7. The influence intensity of significant factors on CR.
Processes 07 00607 g007
Figure 8. The influence intensity of significant factors on PCIR.
Processes 07 00607 g008
Figure 9. The comprehensive influence intensity of significant factors on CR.
Processes 07 00607 g009
Table 1. Influence factors analysis on coke ratio (CR) and pulverized coal injection ratio (PCIR) in BFIMP by partial correlation analysis (PCA).
Classification of Influence FactorsInfluence FactorsCRPCIR
p ValueCorrelation Degreep ValueCorrelation Degree
Constant0.002 0.000
MaterialFlows ParametersSinter grade0.44−0.0620.0000.299
Sinter size0.023−0.1850.203−0.104
Pellet grade0.506−0.0540.8000.021
Ore grade0.047−0.1610.0020.253
Sinter alkalinity0.0010.2770.0000.334
Sinter tumbler index0.000−0.4190.758−0.025
Sinter screening index0.135−0.1220.571−0.046
Clinker ratio0.4260.0650.6950.032
Slag ratio0.0210.1870.334−0.079
PCIR0.000−0.598
Energy Flows ParametersCoke size0.3430.0770.1310.123
Coke ash0.471−0.0590.175−0.110
Coke volatile0.227−0.0980.093−0.136
Coke sulfur0.8110.0200.1650.113
M400.6410.0380.9040.010
M100.579−0.0450.013−0.201
Coal ash0.534−0.0510.075−0.144
Coal volatile0.146−0.1180.4680.059
Operation ParametersBlast volume0.4110.0670.0000.398
Blast temperature0.0040.2330.0010.273
Blast pressure0.719−0.0290.0710.146
Oxygen enrichment ratio0.4490.0620.0000.319
Permeability0.3530.0760.947−0.005
Top gas pressure0.103−0.1330.3410.078
Top temperature0.199−0.1050.0000.457
Noted: M40, resistance to crushing of coke; M10, abrasion strength of coke.
Table 2. Multivariate linear model (MLR) modelson CR and PCIR.
Classification of Influence FactorsInfluence FactorsCRPCIR
Unstandardized CoefficientsStandardized CoefficientsCorrelation DegreeUnstandardized CoefficientsStandardized CoefficientsCorrelation Degree
Constant996.644 −2148.358
Material Flows ParametersSinter grade 21.4250.5390.425
Sinter size−1.019−0.053−0.117
Ore grade−0.403−0.093−0.1930.9600.2410.365
Sinter alkalinity55.1950.2810.51697.0980.5380.429
Sinter tumbler index−11.523−0.277−0.477
Slag ratio0.2670.1390.264
PCIR−0.603−0.554−0.725
Energy Flows ParametersM10 −7.424−0.135−0.223
Operation ParametersBlast volume 0.0680.4850.577
Blast temperature0.1250.1470.2890.2850.3650.414
Oxygen enrichment ratio 7.7660.3050.321
Top temperature 0.2540.3300.486
Table 3. The range of the influence factors (independent variable).
Classification of Influence FactorsInfluence FactorsMin Value (xmin,i)Max Value (xmax,i)1% Increment (xmax,i-xmin,i)/100
Material Flows ParametersSinter grade (%)55.757.80.021
Sinter size (mm)2530.30.053
Ore grade (%)41.689.60.48
Sinter alkalinity (%)1.82.30.005
Sinter tumbler index (%)76.979.90.03
Slag ratio (kg/t)2863390.53
PCIR (kg/t)87.9171.90.84
Energy Flows ParametersM10 (%)4.66.70.021
Operation ParametersBlast volume (m3/min)595566647.09
Blast temperature (℃)108612501.64
Oxygen enrichment ratio (%)0.84.60.038
Top temperature (℃)1192881.69