Article

Comparison of Growth Characteristics and Properties of CVD TiN and TiO2 Anti-Coking Coatings

1
College of Chemical Engineering, Guizhou Institute of Technology, Guiyang 550003, China
2
Engineering Technology Research Center of Fluorine and Silicon Material, Guiyang 550003, China
*
Authors to whom correspondence should be addressed.
Processes 2019, 7(9), 574; https://doi.org/10.3390/pr7090574
Submission received: 20 July 2019 / Revised: 26 August 2019 / Accepted: 26 August 2019 / Published: 30 August 2019
(This article belongs to the Special Issue Thin Film Processes)

Abstract

:
Coating metals with anti-coking materials inhibit their catalytic coking and are especially beneficial in the pyrolysis of hydrocarbon fuels. It is believed that growth characteristics and properties may play a pivotal role in the anti-coking performance of chemical vapor deposition (CVD) coatings. In this study, TiN and TiO2 coatings were obtained by CVD using TiCl4–N2–H2 and TiCl4–H2–CO2 systems, respectively. The effects of deposition time, residence time, and partial pressure were examined, and the coating microstructure was characterized by scanning electron microscopy (SEM). The results reveal that the effect of deposition parameters on the growth characteristics of TiN and TiO2 coatings is very different. The growth of the TiN coating shows characteristics of the island growth model, while the TiO2 coating follows the layer model. In general, the growth rate of the star-shaped TiN crystals is higher than that of crystals of other shapes. For the TiO2 coating, the layer mode growth characteristics indicate that the morphology of the TiO2 coating does not change significantly with the experimental conditions. Coking tests showed that the morphology of non-catalytic cokes is not only affected by the temperature, pressure, and coking precursor, but is also closely related to the surface state of the coatings. Both TiN and TiO2 coatings can effectively prevent catalytic coking and eliminate filamentous cokes. In some cases, however, the N or O atoms in the TiN and TiO2 coatings may affect common carbon deposits formed by non-catalytic coking, such as formation of needle-like and flaky carbon deposits.

Graphical Abstract

1. Introduction

The formation of cokes on metallic surfaces from thermal decomposition of hydrocarbon fuels pyrolysis is a major concern in the development of hypersonic aircraft, in which the fuel serves as not only the propellant, but also the ideal coolants to resolve the problem of thermal management by removing the waste heat from aircrafts with the physical and chemical heat sink (sensible heat-absorbing and cracking heat-absorbing) [1,2,3]. Not only that, coking and anti-coking have become the important subject of attention for many researchers at home and abroad, in the chemical, energy, environmental protection, aerospace, military, and other fields [4,5,6]. The formation of cokes is often accompanied by metal dusting, which is a serious form of carburization of Fe-, Ni-, and Co-base alloys. It not only leads to the disintegration of the metal substrate into small metal particles, leaving pits and grooves, but also causes severe catalytic coking in its wake, thus deteriorating the heat transfer process by sharply increasing heat resistances and weakening the substrate [7]. Recently, the coating method has been used to inhibit the catalytic coking of metal, and this has been especially beneficial during the pyrolysis of hydrocarbon fuels. Eser et al. [8] studied alumina, zirconia (ZrO2), tantalum oxide (Ta2O5), and platinum coatings obtained by metal organic chemical vapor deposition (MOCVD) on AISI 304 foils to alleviate coking due to thermal oxidation in the thermal stressing of Jet A (350 °C and 3.5 MPa, 1 mL/min for 5 h), and observed that the effectiveness of the coatings in mitigating carbon deposition decreases in the following order: Pt > Ta2O5 > alumina from acetylacetonate > ZrO2 > alumina from aluminum trisecondary butoxide > AISI 304. Similarly, Liu et al. [9] investigated a series of alumina coatings with different thicknesses (318–1280 nm) in SS321 tubes (2 mm i.d.) obtained by MOCVD using aluminum trisecondary butoxide and evaluated their anti-coking performance during the thermal cracking of Chinese RP-3 jet fuel under supercritical conditions (inlet temperature, 575 °C; outlet temperature, 650 °C; pressure, 5 MPa). Their results indicated that the anti-coking performance increased from 37% to 69% as the thickness of alumina coatings increased from 318 to 1280 nm. In addition, Xu et al. [10,11,12] published a series of articles on the anti-coking property of the SiO2/S composite coating during light naphtha steam cracking and reported that the SiO2/S coating reduces coke yield by 60% compared with the uncoated tube. More recently, Liu et al. [13] prepared a MnCr2O4 spinel coating on HP40 alloy by pack cementation and subsequent thermal oxidation and applied it to inhibit coke formation during light naphtha thermal cracking. Their result showed that the anti-coking performance of the MnCr2O4 spinel coating exceeded 60% during the thermal cracking of light naphtha. In previous works, the anti-coking performances of TiN, TiO2, and TiC coatings were investigated [14,15,16,17]. The results show that TiN, TiO2, and TiC coatings have an obvious anti-coking effect; especially, the anti-coking performance of the TiN coating exceed 90%, and the anti-coking effect of the coatings vary in the order TiN = TiC > TiO2. Therefore, the anti-coking performance of Ti-based coatings obtained by CVD is often superior to that of the common SiO2, Al2O3, and MnCr2O4 spinel coatings.
Although the TiN and TiC coatings show excellent anti-coking properties, the nature and mechanism of their anti-coking effect is not very clear. It is well known that coke is mainly formed on the interface of the metal substrate with hydrocarbon fuels, and that both the chemical composition and surface roughness affect the coking process significantly. With regard to the chemical composition, many studies have shown that some metals, such as Fe, Ni, and Mo, on the surface of the reaction channels have a catalytic effect for coking, while other metals, such as Cu, Si, Al, Cr, Ti, Nb, and Ta, are found to inhibit coking [18,19,20]. With regard to the surface roughness, Crynes et al. [21] examined the effect of surface roughness on coke formation during the pyrolysis of light hydrocarbon feedstock using polished metal coupons of Incoloy 800. The results showed that the coking rate reduced sharply after polishing; the ratio of carbon formed on the unpolished coupons to the polished ones varied from 5.6 for iso-butane to 28.1 for ethene. Similarly, Marek and Albright [22,23] and Gregg and Leach [24] also found reduced coke formation on the metal surface after polishing. However, Durbin and Castle [25] found that the amount of coke on a polished specimen did not drop compared with the unpolished specimen during acetone pyrolysis. They explained that this might be because of the increasing temperature on the metal surface during the process of heat treatment. In conclusion, it is believed that the growth characteristics and properties may play a pivotal role in the anti-coking performance of CVD coatings.
Furthermore, on the basis of previous works, the TiN coating has excellent anti-coking performance, but poor oxidation resistance, while the TiO2 coating has good oxidation resistance at high temperature, but poor anti-coking performance [26]. This paper tries to provide more information on the relationship between the anti-coking performance and the growth characteristics and properties of CVD TiN and TiO2 anti-coking coatings, and thus provide guidance for designing better anti-coking coatings.

2. Experimental Details

The preparation of TiN and TiO2 coatings was conducted in a horizontal and tubular hot-wall reactor with 11 mm i.d. and 300 mm in length under atmospheric pressure. The 310S stainless steel foils (10 mm × 10 mm × 0.9 mm) were selected as the substrate. In general, preparation of TiN coating by the CVD method includes the following two systems: the TiCl4–NH3–H2 system and the TiCl4–N2–H2 system. Their basic chemical equations for the preparation of the TiN coating are as follows:
2TiCl4 (g) + 2NH3 (g) + H2 → 2TiN (s) + 8HCl (g),
2TiCl4 (g) + 4H2 (g) + N2 (g) → 2TiN (s) + 8HCl (g),
where (s) means solid phase and (g) means gas phase. Equation (1) may react at a low temperature of 400–700 °C, but obtain a poor quality of the TiN coating. Conversely, Equation (2) needs a high reaction temperature of 700–1200 °C, but gains a good quality of the TiN coating. Because of the high temperatures of the coking process, and possibly the high pressures, the TiN coating of this work was prepared using the TiCl4–N2–H2 system.
The thermal CVD deposition process of TiO2 coatings was prepared by the TiCl4–H2–CO2 system. This is comprised of two homogeneous gas-phase reactions, which can be described by the following chemical reactions:
CO2 (g) + H2 (g) → CO (g) + H2O (g),
2H2O (g) + TiCl4 (g) → TiO2 (s) + 4HCl (g),
where Equation (3) is the homogeneous “water gas shift” reaction to in situ produce the water used in the hydrolysis reaction. Then, TiCl4 reacted with H2O vapor to gain the TiO2 coating, as shown in Equation (4).
More details about the preparation of TiN and TiO2 coatings were described elsewhere [15,16]. It is noteworthy to point out that a preheating furnace was fixed at 650 °C, so that reactants can preheat adequately to the deposition temperature before reaching the surface of substrate, and remove the trace oxygen in system. Moreover, to obtain the growth characteristics and properties of CVD TiN and TiO2 coatings, the influence of deposition time, residence time, and partial pressure on coating deposition was investigated in detail in the process of experiment. The influence of temperature on TiN and TiO2 coatings was described in previous works [15,16]. All CVD experiments are based on the following typical experimental condition, as shown in Table 1.
The coking test was employed to evaluate the properties of the TiN and TiO2 coatings. All the tests were carried out in a tubular reactor made of quartz (16 mm i.d. and 350 mm in length), which was placed horizontally inside an electrical furnace. Cyclohexane was used as the cracking feedstock, and the experimental parameters are shown in Table 2. Before the test, the uncoated and TiN-coated specimens were ultrasonically cleaned in acetone and dried in high purity nitrogen (HP–N2) for 30 min. Then, a specimen was placed in the center of the tube reactor and HP–N2 passed through the reaction system for 30 min to purge the air inside. Subsequently, the reactor was heated to 770 °C at a rate of 15 °C/min under the HP–N2 atmosphere protection. The cracking time was fixed at 1.5 h. The reactor was turned off after 1.5 h, and cooled to room temperature in HP–N2. More details about the coking test were described elsewhere [15].
After CVD and the coking test, the morphologies of as-deposited and coked TiN and TiO2 coatings were characterized by scanning electron microscopy (SEM) (Hitachi-S-4800, Japan).

3. Results and Discussion

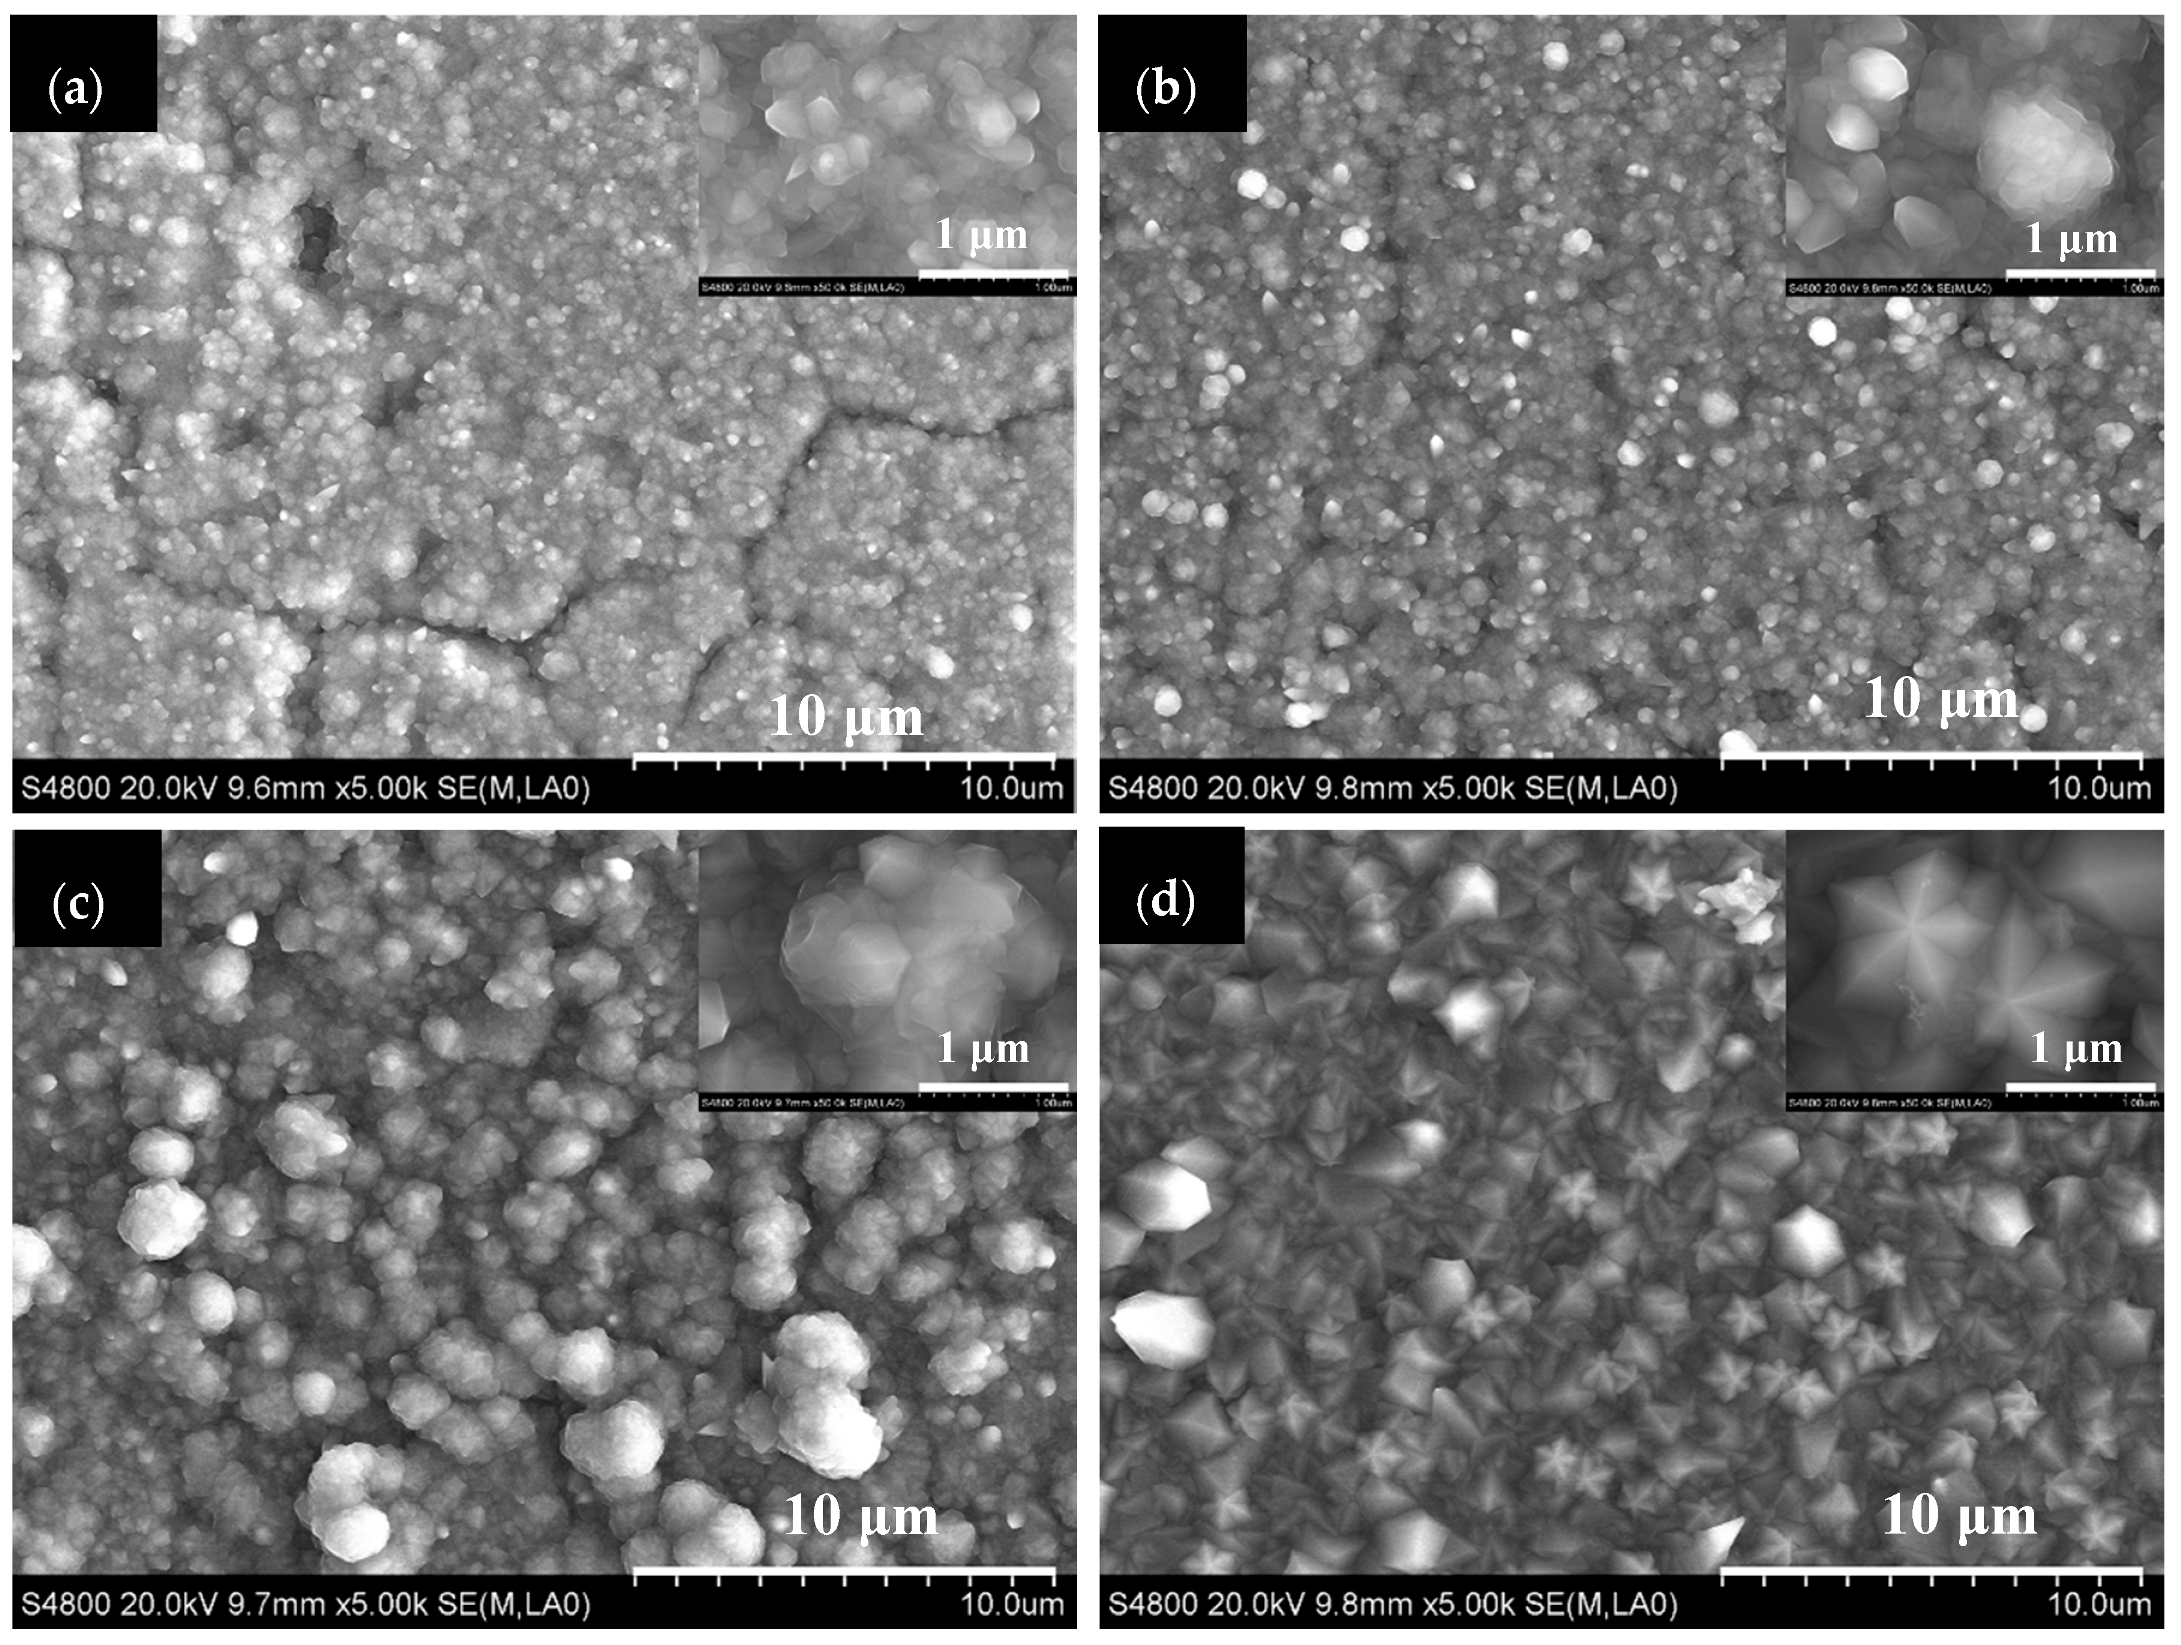
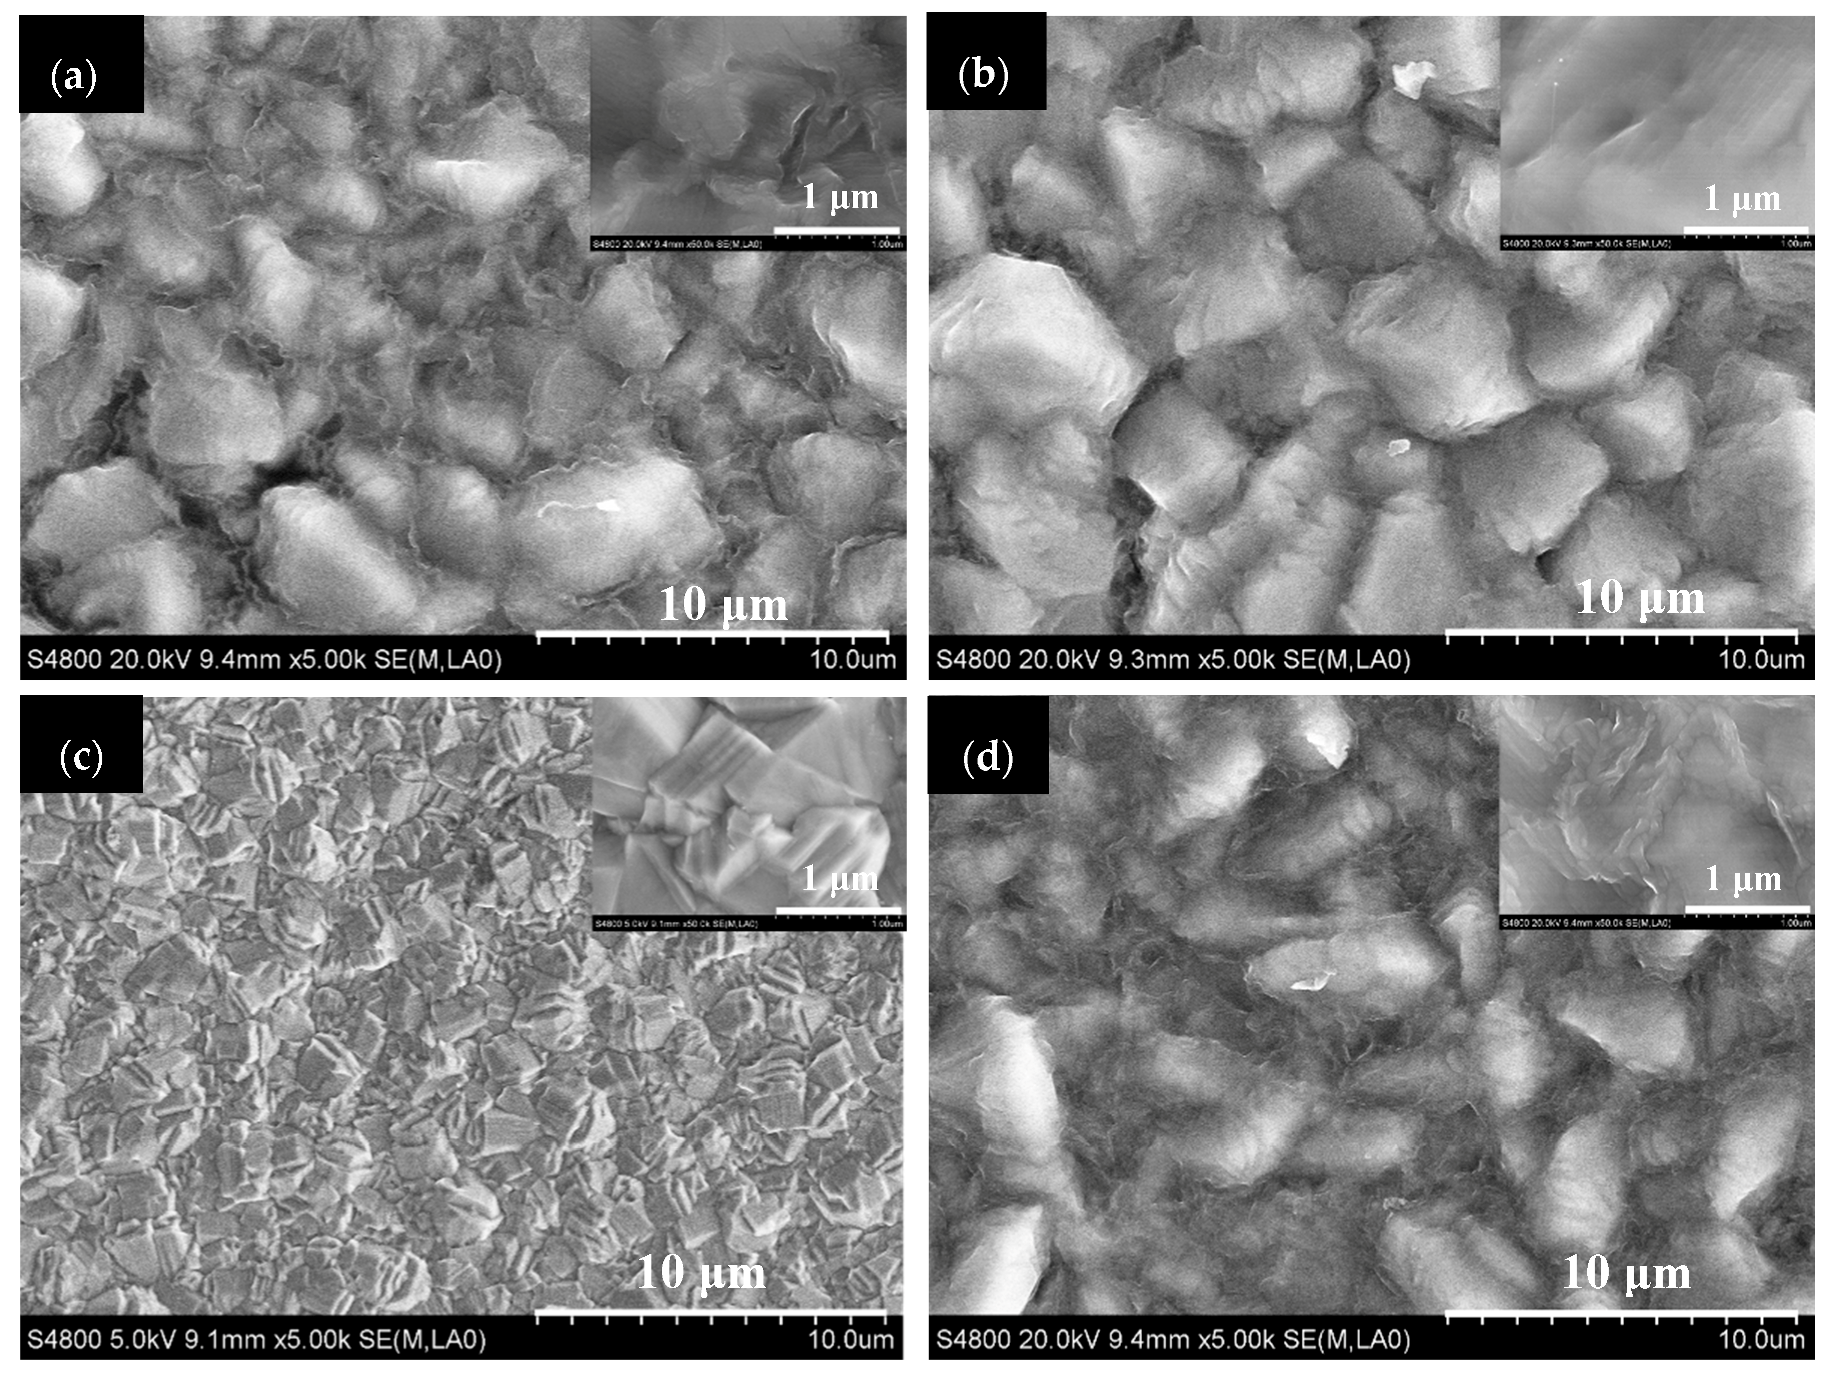
3.1. The Effect of Deposition Time

SEM micrographs of the TiN and TiO2 surfaces with different deposition times are shown in Figure 1. The micrographs indicate that the morphologies of TiN and TiO2 coatings change significantly as the deposition time increases. For the TiN coating, when the deposition time was 5 min, a lot of fine particles intermixed with large spherical particles appeared on the surface of the 310S substrate (Figure 1a). Under higher magnification, it could be seen that these spherical particles consisted of crystallites and showed a rounded agglomerate structure, which was caused by the slow surface mobility of adsorbed reactant molecules and continuous nucleation in this case. However, some original cracks of the 310S substrate were still observed, which suggested that the thickness of the TiN coating after 5 min was not enough to completely cover the surface of the substrate. Similarly, when the deposition time was 30 min, a large number of fine particles, which also consisted of crystallites, appeared on the surface of the substrate (Figure 1b); however, there were fewer surface cracks than on the coating with the deposition time of 5 min. On the one hand, the thickness of the TiN coating increased with the increase of deposition time, and it effectively covered the cracks. On the other hand, with the progress of the deposition process, a secondary nucleation process occurred at the area of the cracks, resulting in the gradual decrease of the cracks. When the deposition time was 90 min, the TiN coating was fully grown to form obvious star-shaped crystals intermixed with lenticular crystals (Figure 1c). The mechanism of formation of star-shaped TiN crystals was proposed by Cheng et al. [27,28] The five extrusion arms of the star-shaped TiN crystals are the result of preferred growth at the five (111) twin boundaries, and the growth rate of these crystals is higher than that of crystals of other shapes.
For the TiO2 coating, when the deposition time was 5 min, it formed irregular particles with a size of approximately 100–1000 nm, and these irregular particles were connected to each other in a plate-like structure (Figure 1d). Meanwhile, the original cracks on the 310S surface disappeared completely with only a few small holes that could be seen under higher magnification. As the deposition time increased from 5 min to 30 min, the small, irregular particles disappeared and were replaced by small hill-like structures with obvious crystal characteristics (Figure 1e). As the deposition time was further increased to 90 min, the morphology of the TiO2 coating changed to a bigger smooth stone-like structure with sharp edges (Figure 1f).
Thus, it can be seen that the effect of deposition time on the growth characteristics of TiN and TiO2 coatings is very different. According to Spiller et al. [29], there are three possible modes of crystal growth on surfaces, namely, the island or Volmer–Weber mode, the layer or Frank–van der Merwe mode, and the layer-plus-island or Stranski–Krastanov mode. In the island (Volmer–Weber) mode, small clusters are nucleated directly on the substrate surface and these grow into islands of the condensed phase. The growth of the TiN coating shows the characteristics of island growth. At the beginning of the deposition, reactant molecules are adsorbed on the surface of the 310S substrate, and then react on the surface to form island nucleation clusters because the atoms (or molecules) of the deposit are more strongly bound to each other than to the substrate. Therefore, many cracks are formed among the islands. As the deposition time increases, because of the growth of the nuclei and the occurrence of secondary nucleation, the islands are linked together and become closely integrated. Subsequently, the cracks on the surface of the TiN coating gradually disappear. In contrast, the growth characteristics of the TiO2 coating can be explained by the layer (Frank–van der Merwe) model, in which the atoms (or molecules) of the deposit are more strongly bound to the substrate than to each other. This mode displays characteristics that contrast with the growth of the TiN coating. In this case, the nuclei of the TiO2 film are sufficiently activated and grow rapidly. The nuclei combine quickly and form a continuous film, which ultimately leads to the disappearance of the cracks on the substrate surface. As the deposition time increases, the TiO2 grain grows gradually, and the crystal structure tends to become complete. However, all three modes of crystal growth are thought to occur on surfaces in the absence of surface defects and interdiffusion and, consequently, the actual situation may be more complicated than the three separate cases.

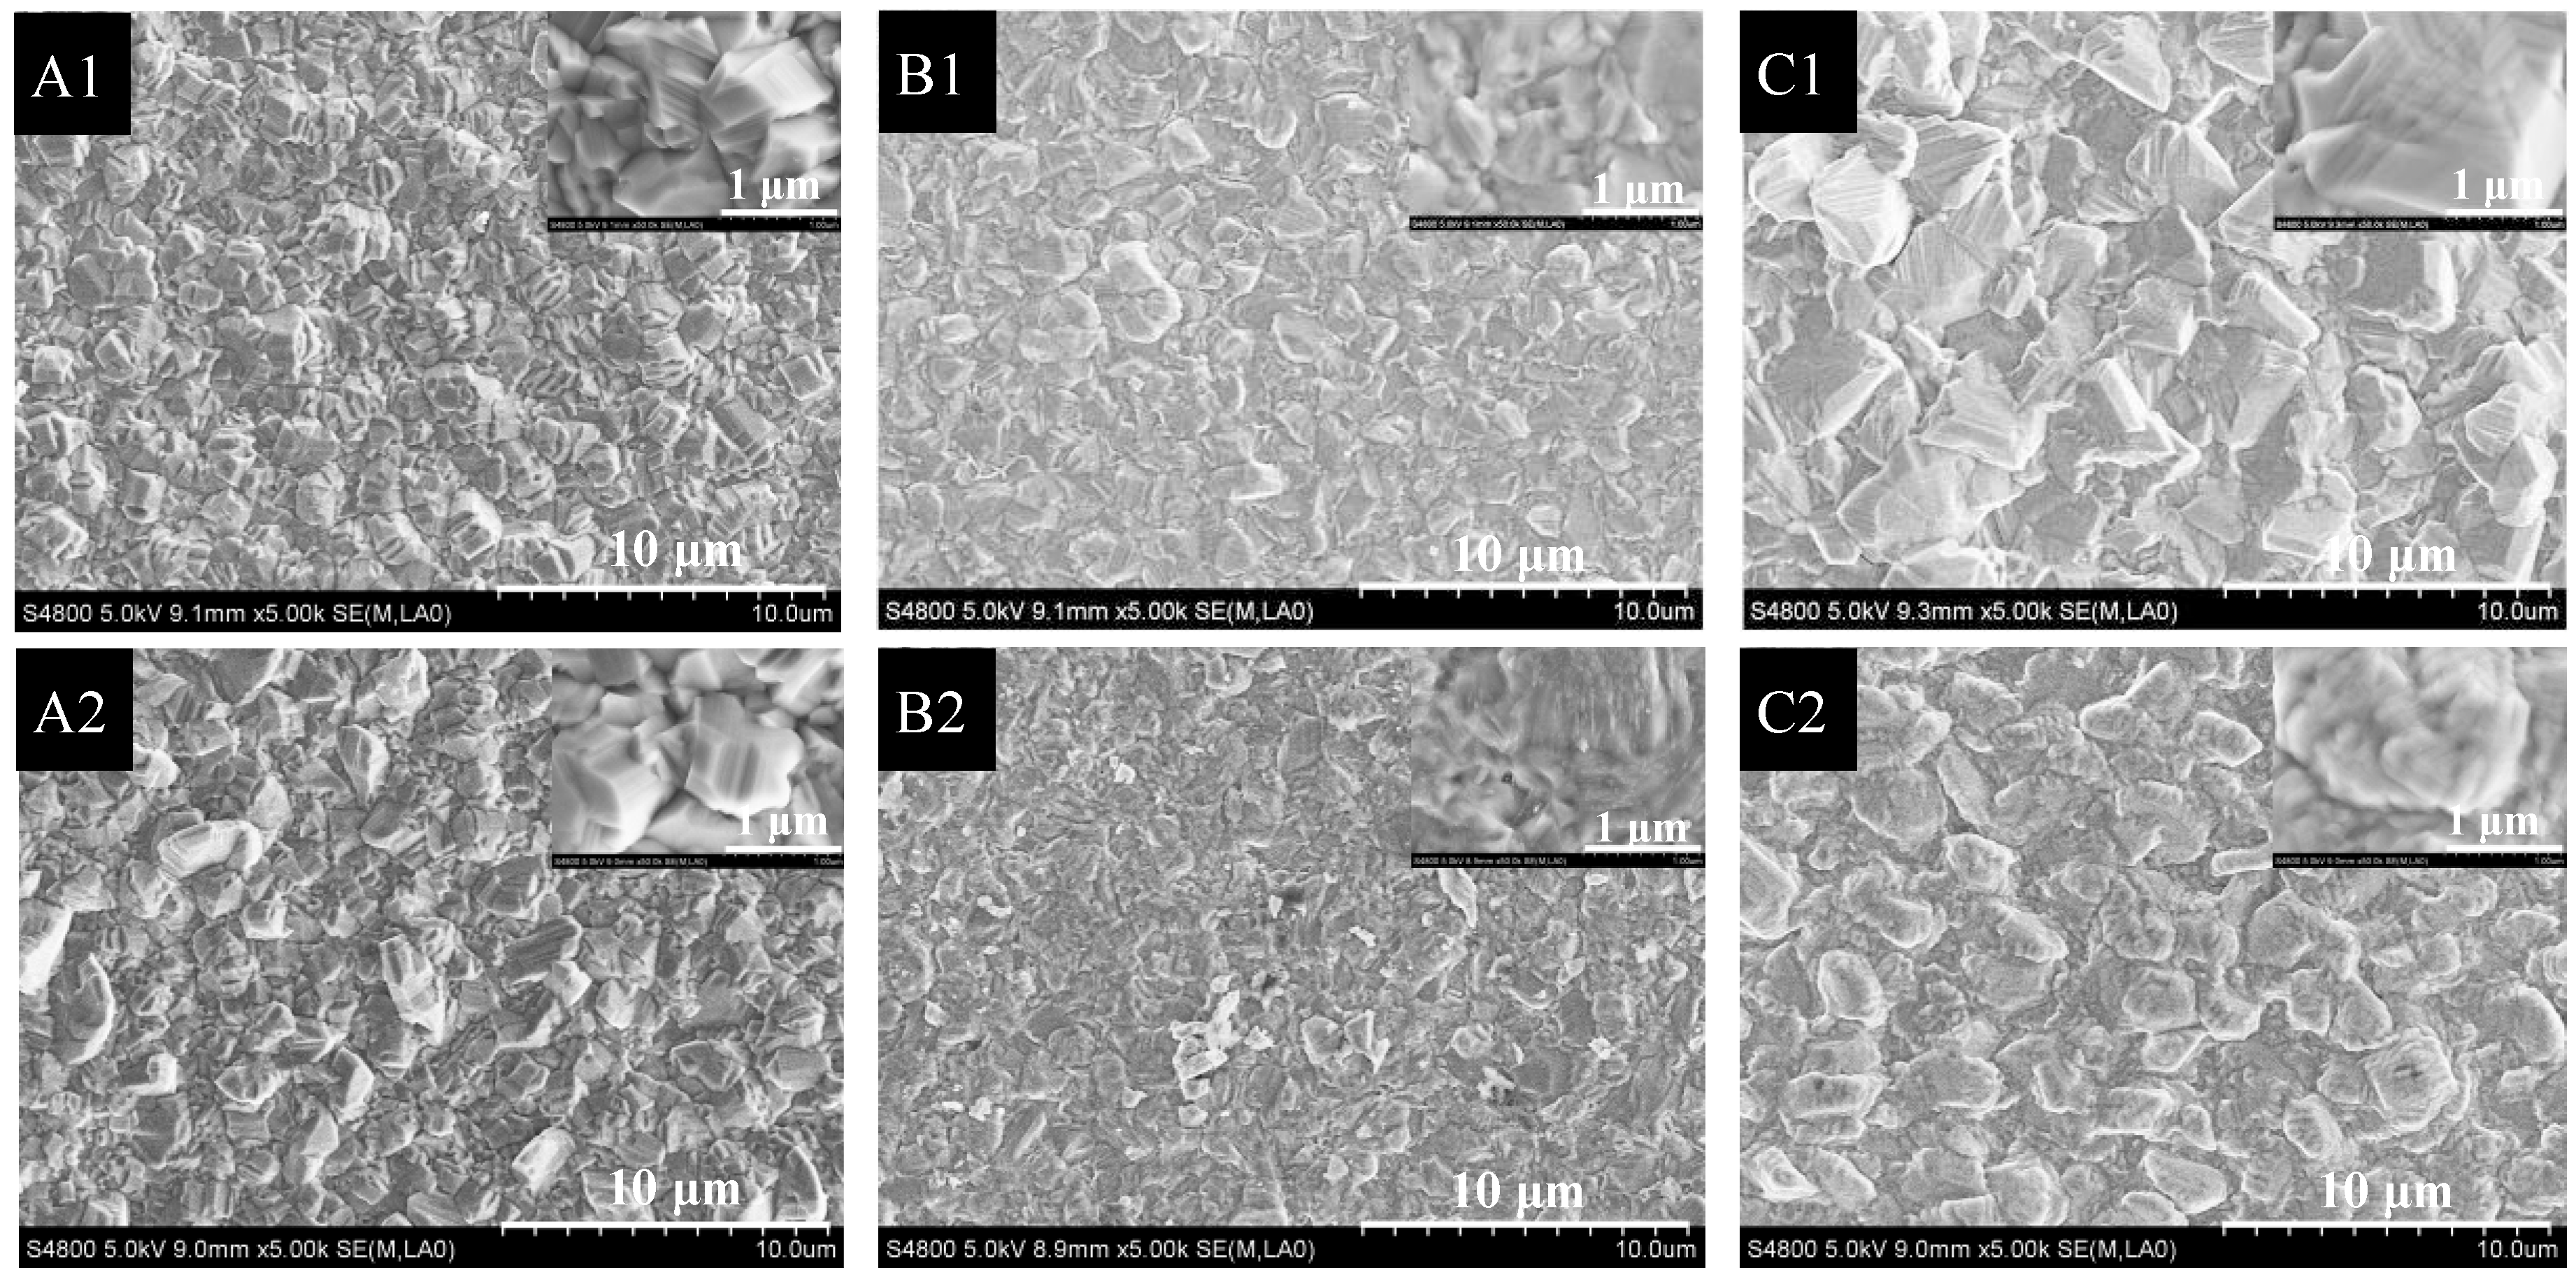
3.2. The Effect of Residence Time

In this experiment, the residence time was changed by changing the total flow rate without changing the deposition time and partial pressure of all the components. Figure 2 shows the SEM images of TiN coating at 850 °C for 1.5 h at different rates of total flow rate. It can be seen from Figure 2a that when the residence time was long (the total flow rate is 0.14 times as high as that of the typical experiment, as seen in Table 1), the TiN coating also showed cracks, which are typically island growth features, despite the deposition time of up to 90 min. The long residence time means that the reactants can react adequately, nucleate, and grow on the surface of the substrate. However, because of the reduction of the entire reactants in this case, the nuclei did not have sufficient raw materials to grow and form the complete star-shaped TiN crystals. Similar situations occurred at 0.4 times the total flow rate (Figure 2b). The difference is that the particle size of TiN (about 500 nm) in this case was obviously larger than that corresponding to 0.14 times the total flow rate (about 200 nm). When the total flow rate increased to 0.71 times, the TiN coating showed a nodule-like morphology, which was composed of a rounded agglomerate structure and formed by continuous nucleation reaction (Figure 2c). It is worth noting that the star-shaped structure of TiN crystal was visible under higher magnification. As the total flow rate reached 1.28 times, many star-shaped TiN crystals with a size of approximately 1 μm appeared on the substrate surface (Figure 2d).
Figure 3 shows the SEM images of the TiO2 coating at 800 °C for 1.5 h at different multiples of the total flow rate. It is clear from Figure 3 that no cracks appear on the surface of the TiO2 coating at different multiples of the total flow rate. This result again confirmed that the TiO2 coating belongs to the layer mode. Interestingly, the morphologies of the TiO2 coating at 0.4, 0.6, and 1.4 times the total flow rate are very similar, consisting of granular structures with blurred edges (Figure 3a,b,d). It is known that the TiO2 coating is formed according to Equations (3) and (4). Here, Equation (3) is the homogeneous “water gas shift” reaction, which was investigated comprehensively by Tingey [30]. According to the equation, the water formation rate above 800 °C is given by
d[H2O]/dt = 7.6 × 10⁴ × e −78,000/RT × [H2] 1/2 × [CO2].
The reaction represented by Equation (4) is very intense even at room temperature. Therefore, the blurred edges may be the amorphous TiO2, which was formed by rapid reaction and deposition in the gas phase. However, the TiO2 coating formed at 0.8 times the total flow rate (Figure 3c) was very similar to that corresponding to the basic total flow rate (Figure 1f), which shows a smooth stone-like structure with sharp edges. In this case, the TiO2 coating has a better crystal structure. This result indicates that a suitable value of total flow is needed for obtaining a better crystal structure of the TiO2 coating.

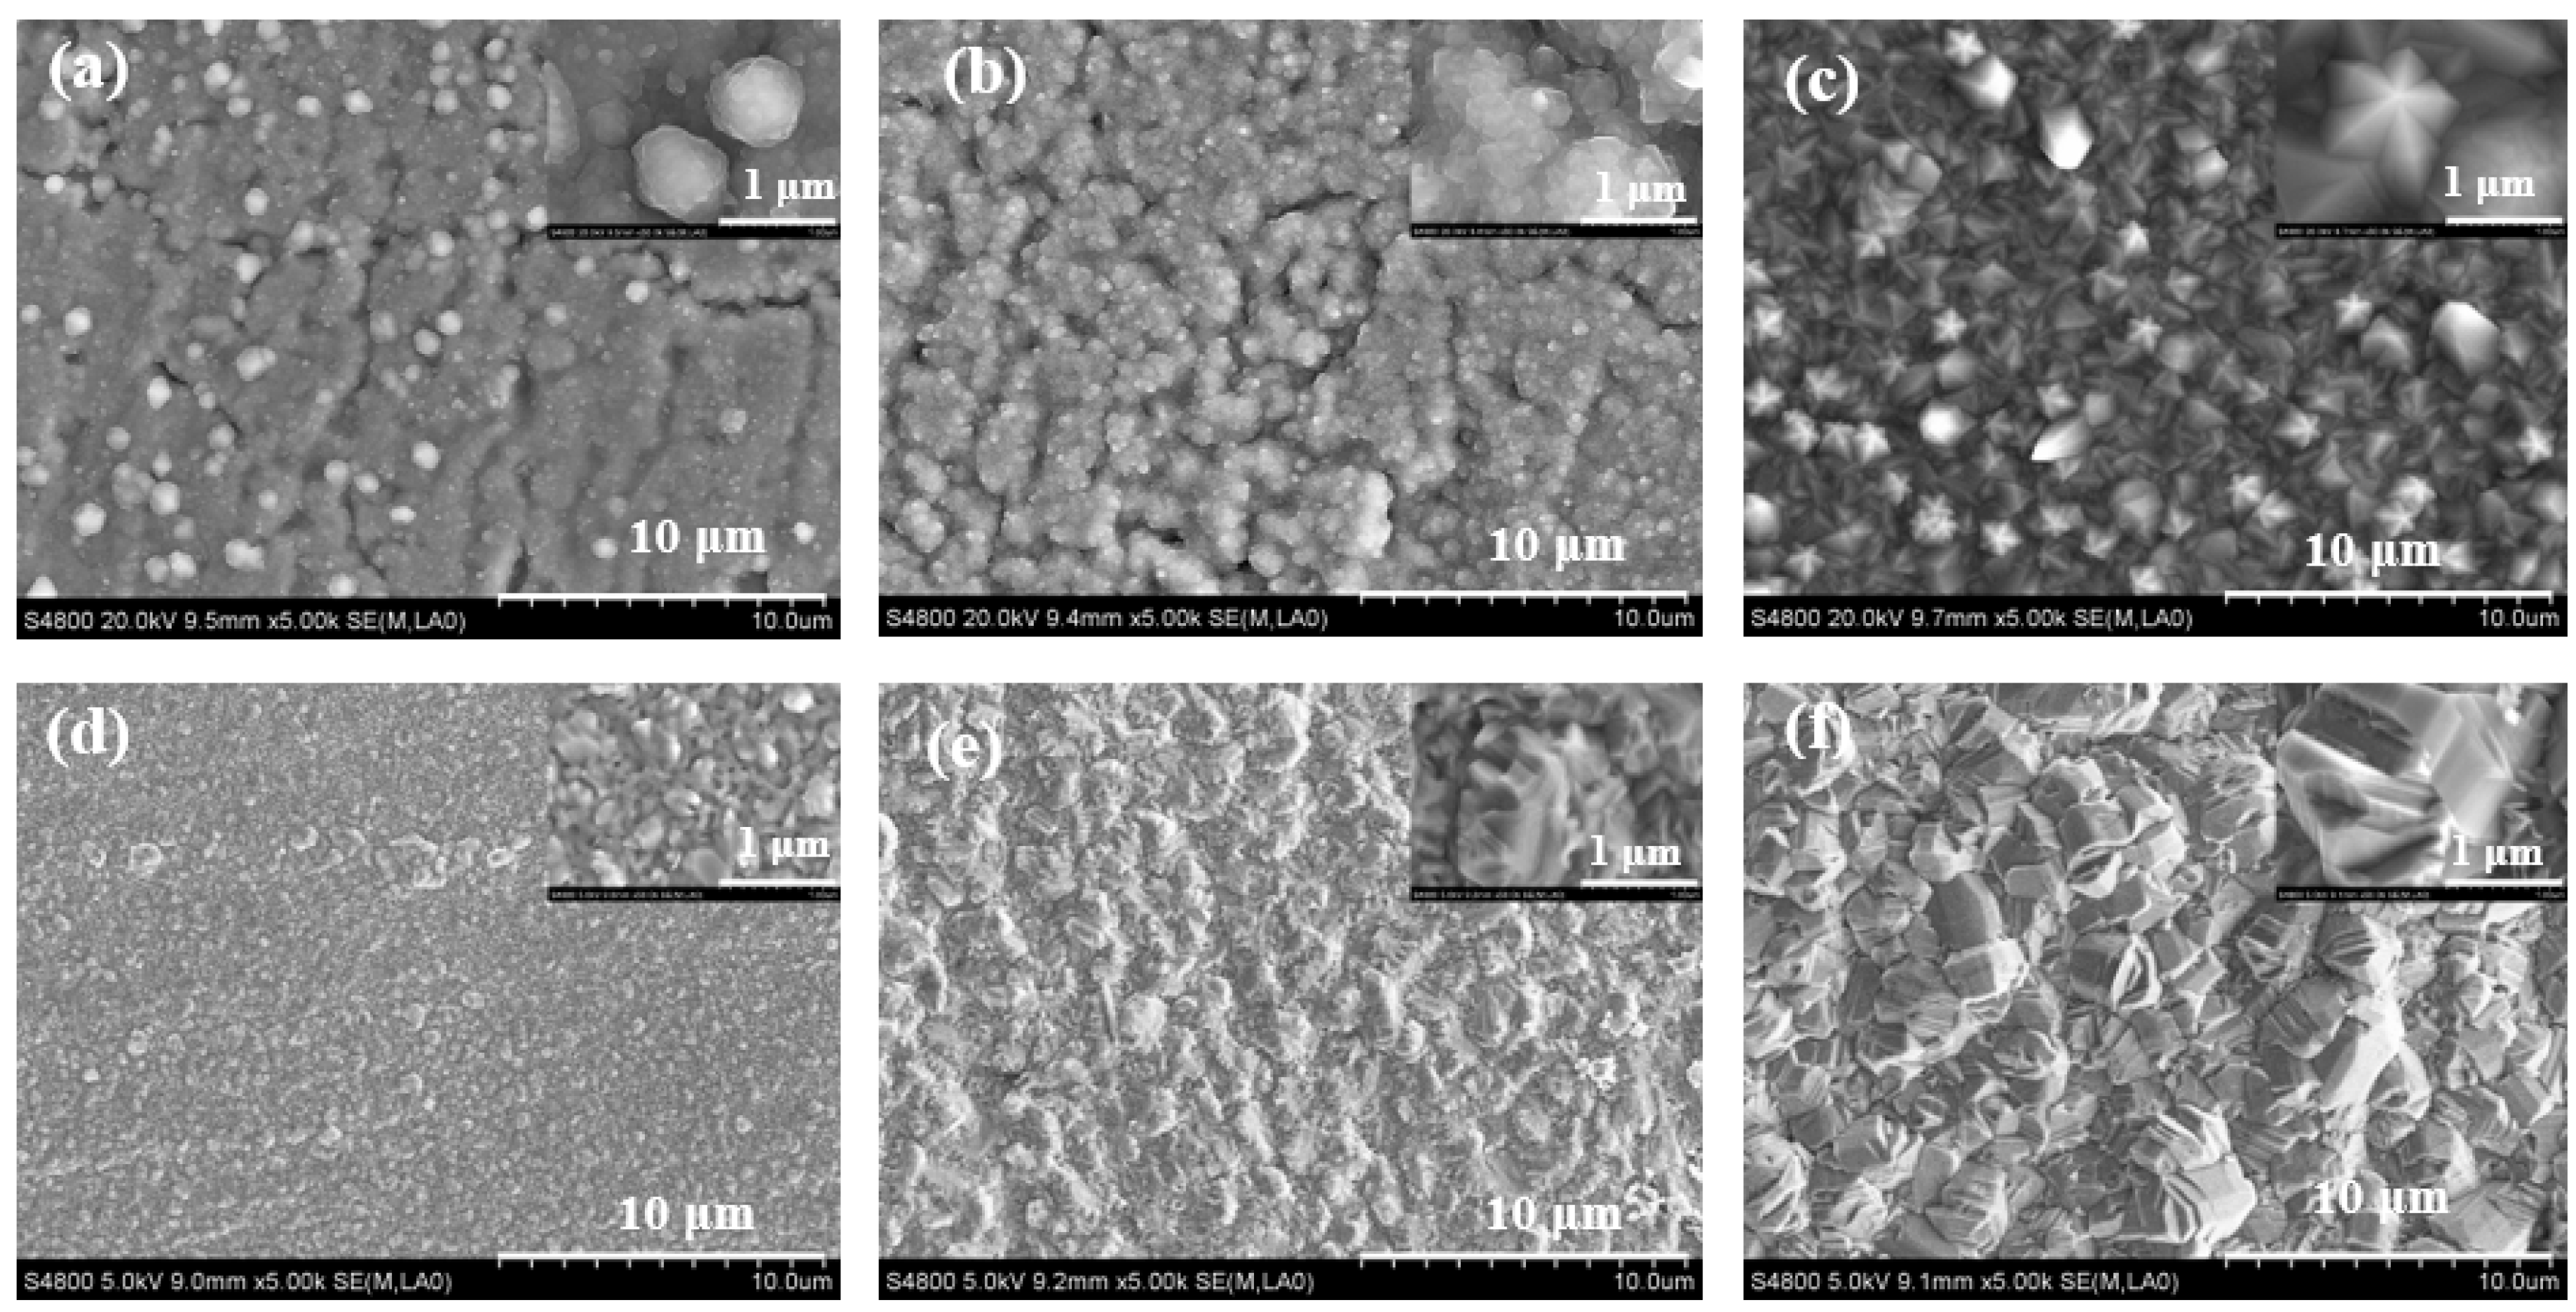
3.3. The Effect of Partial Pressure

In this work, the partial pressure was changed by changing the flow rate of each component. Figure 4 shows the SEM images of TiN at 850 °C for 1.5 h at different flow rates of each component. As shown in Figure 4A, as the flow rate of the H2 diluent gas was reduced from 1.83 L/min (base value, Table 1) to 0.95 L/min, the morphologies of the TiN coatings showed nodules (Figure 4(A1)) and the rounded agglomerate structure (Figure 4(A2)). Under a higher magnification, the incompleteness of the star-shaped TiN crystal structure was visible. As shown in Figure 4B, as the flow rate of N2 was reduced from the base value of 1.40 L/min to 0.40 L/min, the star-shaped structure of TiN coatings gradually disappeared, and then presented a disordered sheet structure (Figure 4(B2)). It can be seen that the appropriate flow rate of the H2 diluent gas and N2 is the necessary condition for obtaining the star-shaped structure of the TiN coating. However, as the flow rate of the H2 carrier gas decreased from the base value of 0.95 L/min to 0.20 L/min, the star-shaped structure of the TiN coating first changed to lenticular crystals at 0.65 L/min (Figure 4(C1)), and then changed into larger star-shaped crystals at 0.20 L/min (Figure 4(C2)). Cheng et al. [31] also observed a similar situation in the CVD TiN coating process, and explained that the (111) twin-plane re-entrant corner is the primary growth source in this temperature range for CVD TiN and the extrusion of re-entrant twin boundaries results in plate-like or lenticular crystals. Generally, the microstructure is strongly dependent on the deposition temperature and partial pressure of reaction gas in the CVD process. The influence of the partial pressure may be that the carrier gas contains H2 and TiCl4, thus it has a double influence on the morphology of the TiN coating.
The effects of partial pressures of the H2 diluent, carrier gas, and CO2 on the surface morphology of TiO2 coating at 800 °C are shown in Figure 5. It was clear that the morphology of the TiO2 coating changed a little with decreasing H2 partial pressures. This may be because of the high rate of the water gas shift reaction at 800 °C and the severe hydrolysis of TiCl4 (corresponding to Equation (5) and Equation (4)) that makes the TiO2 coating grow very fast in the layer mode. The effect of decreasing the TiCl4 and CO2 partial pressures on the morphology of TiO2 coating is similar to that resulting from the decrease of H2 partial pressures. The result indicated that the morphology of the TiO2 coating is a little affected by the partial pressure. In addition, it was found that the size of the TiO2 particles changed by the CO2 partial pressure is obviously larger than that obtained by changing the partial pressure of H2 and TiCl4. This indicates that the growth rate of the TiO2 grain is most sensitive to the water gas shift reaction.

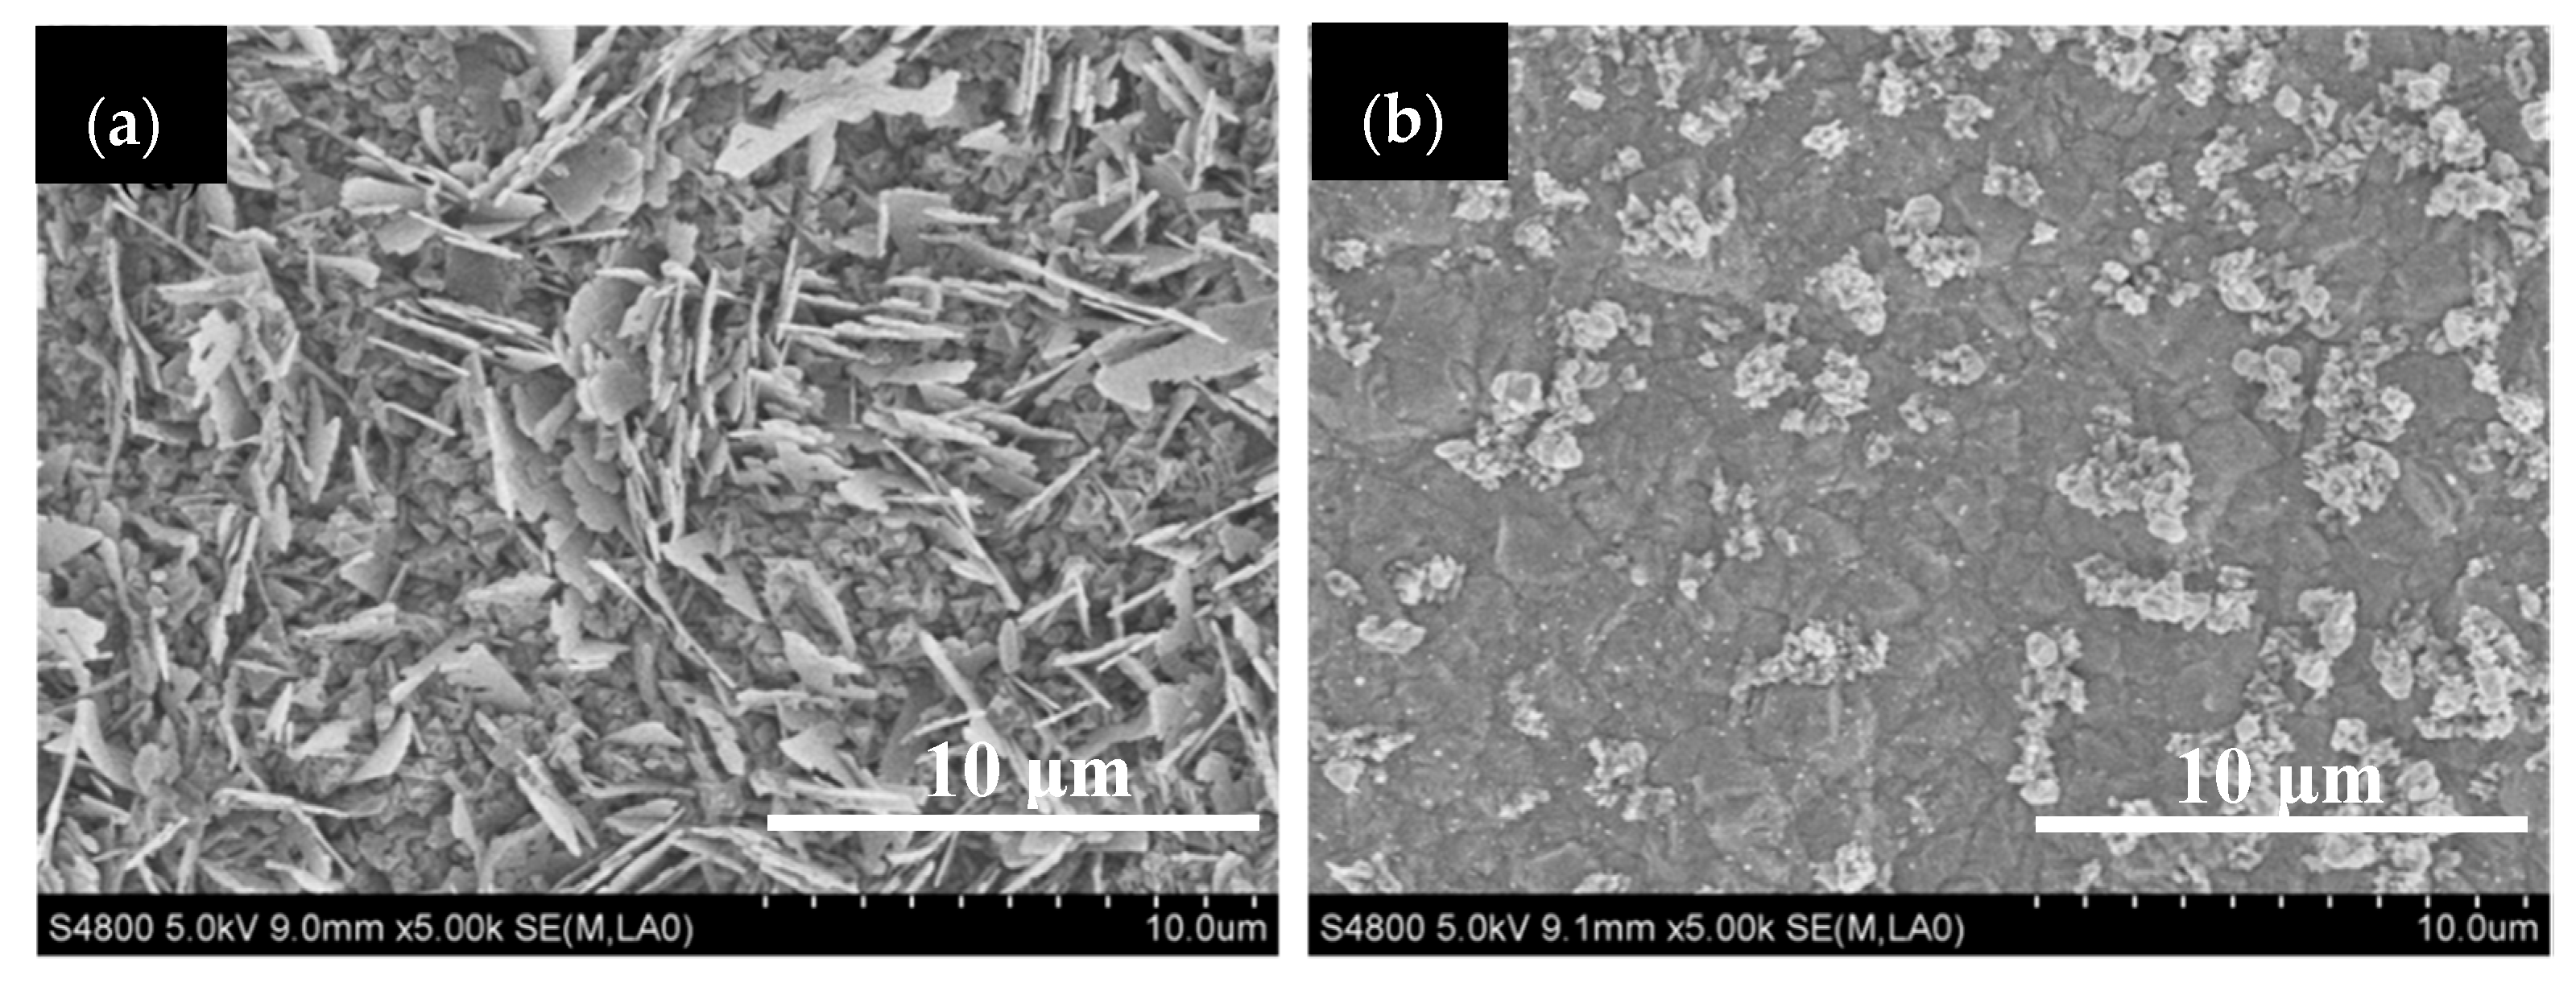
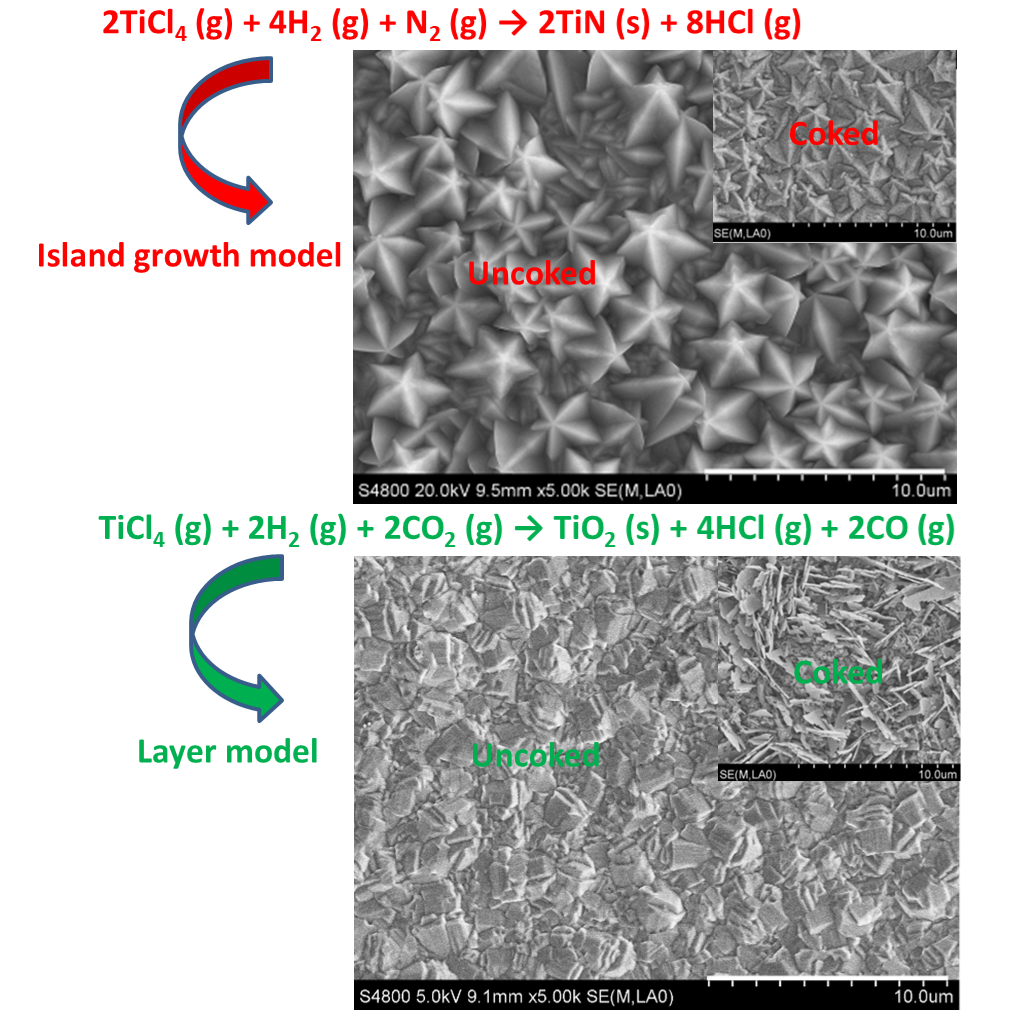
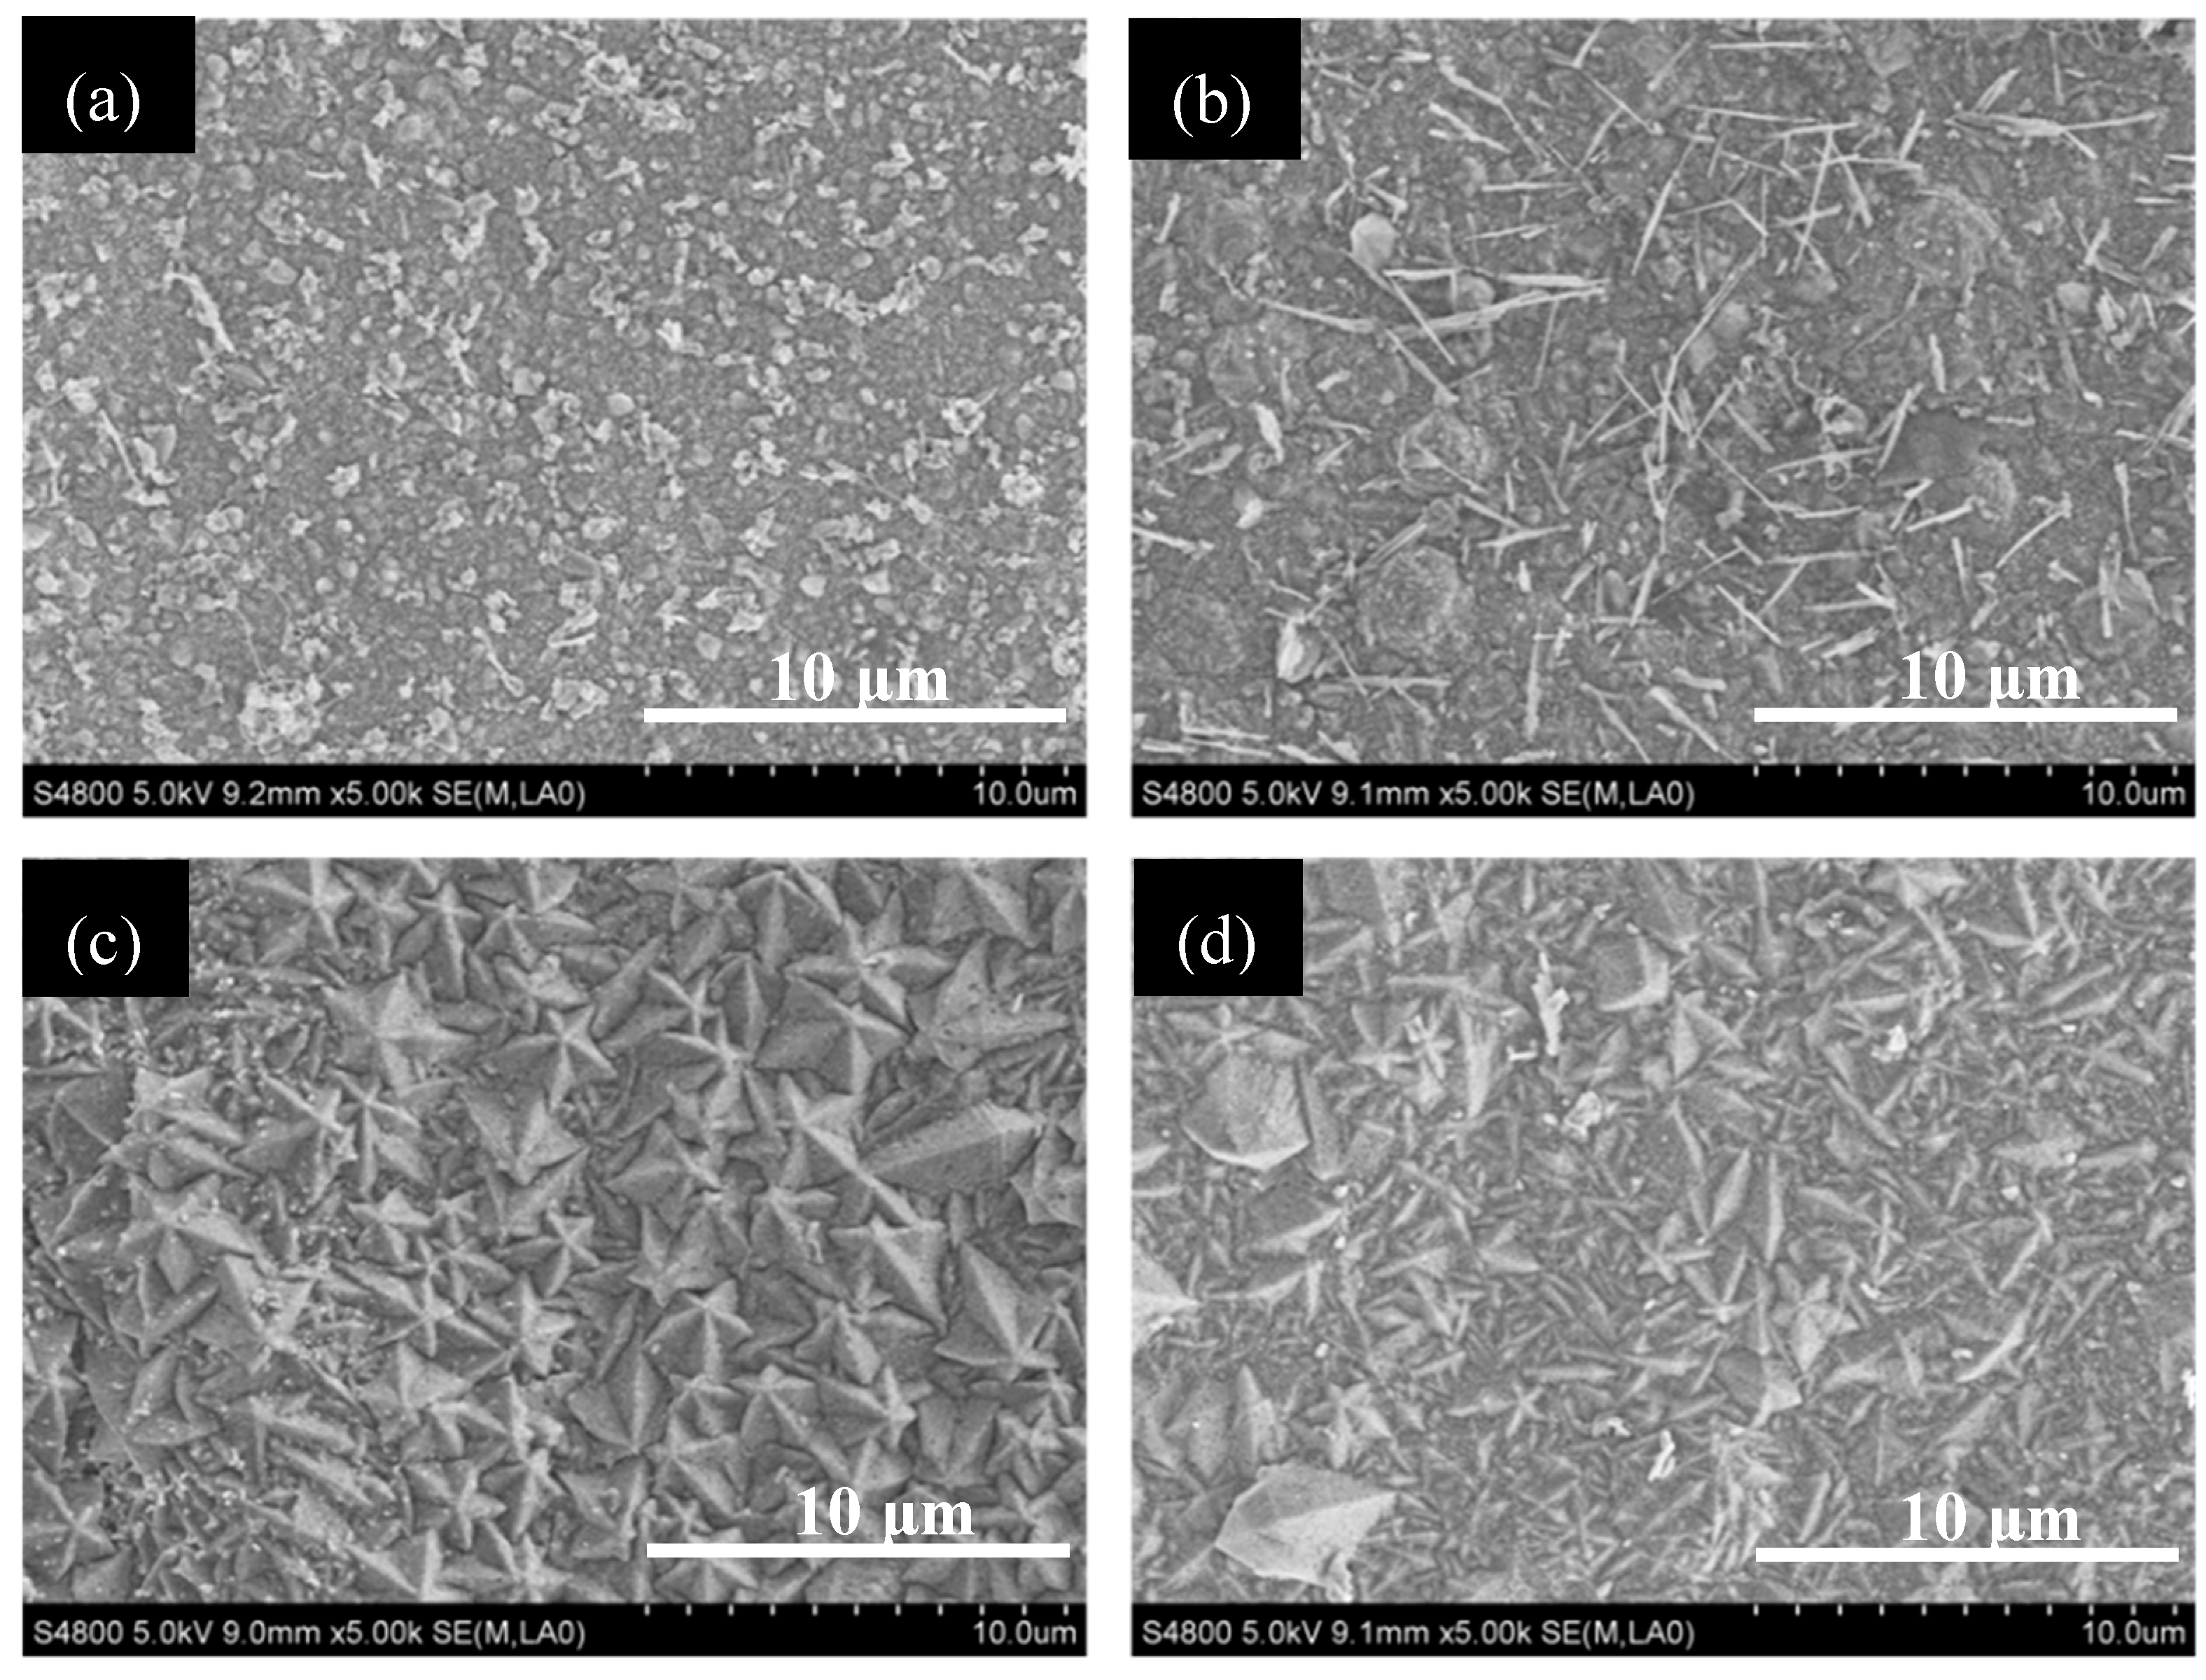
3.4. The Anti-Coking Properties of TiN and TiO2 Coatings

In order to evaluate the effect of growth characteristics on the properties of TiN and TiO2 coatings, coatings with different micromorphologies were selected for the coking test. Figure 6a–d present SEM images (5000:1) of cokes formed on the surface of TiN coatings having different morphologies after cyclohexane steam pyrolysis at 770 °C for 1.5 h. It is obvious that no filamentous cokes formed by metal catalytic coking appear on the surface of all samples. The result demonstrates that the different micromorphology of TiN coatings is uniform and dense, thus it can completely cover the metal substrate and prevent the metal catalytic coking. Meanwhile, carbon deposits are markedly different on the surface of TiN coatings with different morphologies: irregular particles as seen in Figure 6a, needle-like structures as seen in Figure 6b, and fine dust-like particles as seen in Figure 6c,d. When the TiN coating covers the metal substrate surface, the surface reaction of metal catalytic coking is prevented, while the free radical and olefin condensation coking in the bulk phase is dominant. Therefore, reactions in the gas phase are responsible for these structures, and this indicates that the surface microstructure of the coating can affect the structure of carbon deposits.
For the TiO2 coating, the layer-mode growth characteristics specify that the morphology of TiO2 coating is a small change with the change in experimental conditions. To perform the coking tests, samples with significantly different particle sizes were chosen, as shown in Figure 5(A1) and Figure 5(C1). Figure 7a,b present the SEM images (5000:1) of cokes on the surface of TiO2 coatings with different particle sizes that were prepared at different partial pressures. In addition, it was clear that no metal-catalytic filamentous cokes appeared on the TiO2 coating surfaces. Most interestingly, the morphologies of the cokes were very different, as seen in the flaky carbon deposits in Figure 7a and the irregular carbon particles in Figure 7b. A large number of studies have shown that these cokes are amorphous carbon deposits owing to the non-catalytic coking [32,33]. The result suggested that the morphology of non-catalytic cokes is not only affected by the temperature, pressure, and coking precursor, but is also closely related to the surface state of the coatings. In brief, the comparison of the cokes formed on the surface of TiN and TiO2 coatings indicated that both TiN and TiO2 coatings can effectively prevent catalytic coking and eliminate filamentous cokes. Common types of carbon deposits formed by the non-catalytic coking are granular amorphous cokes; however, in some cases, needle-like and flaky carbon deposits are formed, which may be affected by the N or O atoms of the TiN and TiO2 coatings.

4. Conclusions

A series of studies about the growth characteristics and properties of CVD TiN and TiO2 anti-coking coatings reveal that the effect of deposition parameters on the growth characteristics of TiN and TiO2 coatings is very different, and it is strongly dependent on deposition time, residence time, and partial pressure. The growth of TiN coating shows the characteristics of the island growth because the atoms (or molecules) of the deposit are more strongly bound to each other than to the substrate. Differently, the growth characteristics of TiO2 coating growth can be explained by the layer (Frank–van der) mode, which happens when the atoms (or molecules) of the deposit are more strongly bound to substrate than to each other. In general, the growth rate of the star-shaped TiN crystals is higher than that of crystals of other shapes. For the TiO2 coating, the growth characteristics of the layer mode indicate that the morphology of the TiO2 coating does not change significantly with the experimental conditions. The size of the TiO2 particles changed by the CO2 partial pressure is obviously larger than that obtained by changing the partial pressure of H2 and TiCl4. This indicates that the growth rate of the TiO2 grain is most sensitive to the water gas shift reaction.
A coking test was conducted to evaluate the properties of TiN and TiO2 coatings using cyclohexane steam pyrolysis at 770 °C for 1.5 h. Most interestingly, carbon deposits are very different on the surface of TiN coatings with a different morphology of irregular particles, needle-like structure, and fine dust-like particles. Flaky carbon deposits and irregular carbon particles of cokes on the surface of different particle sizes of TiO2 coatings that are prepared by different partial pressures are observed. The result suggested that the morphology of non-catalytic cokes is not only affected by temperature, pressure, and coking precursor, but is also closely related to the surface state of the coatings. In summary, from a comparison of the cokes on the surface of the TiN and TiO2 coatings, both TiN and TiO2 coatings can effectively prevent catalytic coking and eliminate filamentous cokes. In some cases, however, the N or O atoms in the TiN and TiO2 coatings may affect common carbon deposits formed by non-catalytic coking, such as formation of needle-like and flaky carbon deposits.

Author Contributions

S.T. and A.T. conceived and designed the experiments; T.L. and J.G. performed the experiments; S.T. and S.D. analyzed the data; A.T. contributed reagents/materials/ analysis tools; S.T. wrote the paper.

Funding

The research was funded by A Plan Project by Department of Science and Technology of Guizhou Province (Qiankehe LH Zi [2016] 7104), Natural science foundation of Guizhou Provincial Department of Education (Qianjiaohe KY Zi [2016] 014), and the Doctoral Scientific Research Foundation of Guizhou Institute of Technology.

Acknowledgments

We would like to sincerely thank Professor Zhu and Professor Wang of Sichuan University for their selfless help. In addition, we should also thank the provincial first-class platform of the Chemical Engineering Practice Teaching Center and the support of College Students’innovation and entrepreneurship.

Conflicts of Interest

The authors declare no conflict of interest.

References

  1. Jin, B.; Jing, K.; Liu, J.; Zhang, X.; Liu, G. Pyrolysis and coking of endothermic hydrocarbon fuel in regenerative cooling channel under different pressures. J. Anal. Appl. Pyrolysis 2017, 125, 117–126. [Google Scholar] [CrossRef]
  2. Edwards, T.; Propul, J. Liquid fuels and propellants for aerospace propulsion: 1903–2003. Power 2003, 19, 1089–1107. [Google Scholar] [CrossRef]
  3. Cheng, K.; Liang, S.; Huai, X. Effects of chemical heat sink generated by an oxalic acid cooling stream on film-cooling effectiveness. Exp. Heat Transf. 2016, 29, 113–123. [Google Scholar] [CrossRef]
  4. Wang, H.; Yang, W.; Tian, P.; Zhou, J.; Tang, R.; Wu, S. A highly active and anti-coking Pd-Pt/SiO2 catalyst for catalytic combustion of toluene at low temperature. Appl. Catal. A-Gen. 2017, 529, 60–67. [Google Scholar] [CrossRef]
  5. Masirana, N.; Vo, D.V.N.; Salam, M.A.; Abdullah, B. Improvement on coke formation of CaO-Ni/Al2O3 catalysts in ethylene production via dehydration of ethanol. Procedia Eng. 2016, 148, 1289–1294. [Google Scholar] [CrossRef]
  6. Ding, R.; Taylor, M.P.; Chiu, Y.L.; Smith, N.; Mowforth, C.W.; Evans, H.E. Influence of pre-oxidation on filamentary carbon deposition on 20Cr25Ni stainless steel. Oxid. Met. 2019, 91, 589–607. [Google Scholar] [CrossRef]
  7. Zeng, Z.; Natesan, K. Relationship of carbon crystallization to the metal-dusting mechanism of nickel. Chem. Mat. 2003, 15, 872–878. [Google Scholar] [CrossRef]
  8. Mohan, R.; Eser, S. Effectiveness of low-pressure metal–organic chemical vapor deposition coatings on metal surfaces for the mitigation of fouling from heated jet fuel. Ind. Eng. Chem. Res. 2011, 50, 7290–7304. [Google Scholar] [CrossRef]
  9. Yang, C.; Liu, G.; Wang, X.; Jiang, R.; Wang, L.; Zhang, X. Preparation and anti-coking performance of MOCVD alumina coatings for thermal cracking of hydrocarbon fuels under supercritical conditions. Ind. Eng. Chem. Res. 2012, 51, 1256–1263. [Google Scholar] [CrossRef]
  10. Wang, Z.; Xu, H.; Zhou, J.; Luan, X. Simulation of SiO2/S coating deposition in a pilot plant set-up for coking inhibition. Chem. Eng. Res. Des. 2013, 91, 120–133. [Google Scholar] [CrossRef]
  11. Zhou, J.; Wang, Z.; Luan, X.; Xu, H. Anti-coking property of the SiO2/S coating during light naphtha steam cracking in a pilot plant setup. Anal. J. Appl. Pyrol. 2011, 90, 7–12. [Google Scholar] [CrossRef]
  12. Zhou, J.; Xu, H.; Liu, J.; Qi, X.; Zhang, L.; Jiang, Z. Study of anti-coking property of SiO2/S composite coatings deposited by atmospheric pressure chemical vapor deposition. Mater. Lett. 2007, 29, 5087–5090. [Google Scholar] [CrossRef]
  13. Bao, B.; Liu, J.; Xu, H.; Liu, B.; Zhang, W. Inhibitory effect of MnCr2O4 spinel coating on coke formation during light naphtha thermal cracking. RSC Adv. 2016, 6, 68934–68941. [Google Scholar] [CrossRef]
  14. Tang, S.; Gao, S.; Hu, S.; Wang, J.; Zhu, Q.; Chen, Y.; Li, X. Inhibition effect of APCVD titanium nitride coating on coke growth during n-hexane thermal cracking under supercritical conditions. Ind. Eng. Chem. Res. 2014, 53, 5432–5442. [Google Scholar] [CrossRef]
  15. Tang, S.; Gao, S.; Wang, S.; Wang, J.; Zhu, Q.; Chen, Y.; Li, X. Characterization of CVD TiN coating at different deposition temperatures and its application in hydrocarbon pyrolysis. Surf. Coat. Technol. 2014, 258, 1060–1067. [Google Scholar] [CrossRef]
  16. Tang, S.; Wang, J.; Zhu, Q.; Chen, Y.; Li, X. Preparation of rutile TiO2 coating by thermal chemical vapor deposition for anti-coking applications. ACS Appl. Mater. Interfaces 2014, 6, 17157–17165. [Google Scholar] [CrossRef]
  17. Tang, S.; Shi, N.; Wang, J.; Tang, A. Comparison of the anti-coking performance of CVD TiN, TiO2 and TiC coatings for hydrocarbon fuel pyrolysis. Ceram. Int. 2017, 43, 3818–3823. [Google Scholar] [CrossRef]
  18. Altin, O.; Eser, S. Analysis of solid deposits from thermal stressing of a JP-8 fuel on different tube surfaces in a flow reactor. Ind. Eng. Chem. Res. 2001, 40, 596–603. [Google Scholar] [CrossRef]
  19. Baker, R.T.K.; Chludzinski, J.J.; Lund, C.R.F. Further studies of the formation of filamentous carbon from the interaction of supported iron particles with acetylene. Carbon 1987, 25, 295–303. [Google Scholar] [CrossRef]
  20. Reyniers, M.S.G.; Froment, G.F. Influence of metal surface and sulfur addition on coke deposition in the thermal cracking of hydrocarbons. Ind. Eng. Chem. Res. 1995, 34, 773–785. [Google Scholar] [CrossRef]
  21. Crynes, L.L.; Crynes, B.L. Coke formation on polished and unpolished Incoloy 800 coupons during pyrolysis of light hydrocarbons. Ind. Eng. Chem. Res. 1987, 26, 2139–2144. [Google Scholar] [CrossRef]
  22. Marek, J.C.; Albright, L.F. Formation and removal of coke deposited on stainless steel and vycor surfaces from acetylene and ethylene. ACS Symp. 1982, 202, 123–149. [Google Scholar]
  23. Marek, J.C.; Albright, L.F. Surface phenomena during pyrolysis: The effects of treatments with various inorganic gases. ACS Symp. 1982, 202, 151–175. [Google Scholar]
  24. Gregg, S.J.; Leach, H.F. Reaction of nickel with carbon monoxide at elevated temperatures. J. Catal. 1966, 6, 308–313. [Google Scholar] [CrossRef]
  25. Durbin, M.J.; Castle, J.E. Carbon deposition from acetone during oxidation of iron—the effects of chromium and nickel. Carbon 1976, 14, 27–33. [Google Scholar] [CrossRef]
  26. Tang, S.; Wang, J.; Zhu, Q.; Chen, Y.; Li, X. Oxidation behavior of CVD star-shaped TiN coating in ambient air. Ceram. Int. 2015, 41, 9549–9554. [Google Scholar] [CrossRef]
  27. Cheng, H.; Lin, T.; Hon, M. Multiple twins induced preferred growth in TiN and SiC films prepared by CVD. Scripta Mater. 1996, 35, 113–116. [Google Scholar] [CrossRef]
  28. Cheng, H.; Hon, M. Growth mechanism of star-shaped TiN crystals. J. Cryst. Growth 1994, 142, 117–123. [Google Scholar] [CrossRef]
  29. Venables, J.A.; Spiller, G.; Hanbucken, M. Nucleation and growth of thin films. Rep. Prog. Phys. 1992, 47, 5–29. [Google Scholar]
  30. Tingey, G.L. Kinetics of the water-gas equilibrium reaction. I. the reaction of carbon dioxide with hydrogen. J. Phys. Chem. 1966, 70, 1406–1412. [Google Scholar] [CrossRef]
  31. Cheng, H.E.; Chiang, M.J.; Hon, M.H. Growth characteristics and properties of TiN coating by chemical vapor deposition. J. Electrochem. Soc. 1995, 142, 1573–1578. [Google Scholar] [CrossRef]
  32. Xie, W.; Fang, W.; Li, D.; Xing, Y.; Guo, Y.; Lin, R. Coking of model hydrocarbon fuels under supercritical condition. Energy Fuels 2009, 23, 2997–3001. [Google Scholar] [CrossRef]
  33. Eser, S.; Venkataraman, A.R.; Altin, O. Deposition of carbonaceous solids on different substrates from thermal stressing of JP-8 and jet-A fuels. Ind. Eng. Chem. Res. 2006, 45, 8946–8955. [Google Scholar] [CrossRef]
Figure 1. Scanning electron microscopy (SEM) micrographs of TiN at 850 °C with different deposition time: (a) 5 min, (b) 30 min, and (c) 90 min; TiO2 at 800 °C with different deposition time: (d) 5 min, (e) 30 min, and (f) 90 min.
Processes 07 00574 g001
Figure 2. SEM images of TiN coating at 850 °C for 1.5 h at different times of the total flow rate: (a) 0.14, (b) 0.40, (c) 0.71, and (d) 1.28 times.
Processes 07 00574 g002
Figure 3. SEM images of the TiO2 coating at 800 °C for 1.5 h at different times of the total flow rate: (a) 0.4, (b) 0.6, (c) 0.8, and (d) 1.4 times.
Processes 07 00574 g003
Figure 4. SEM images of TiN at 850 °C for 1.5 h at different flow rate of each component; A group is the flow rate of H2 diluent gas (L/min): A1—1.29, A2—0.95; B group is the flow rate of N2 (L/min): B1—1.00, B2—0.40; C group is the flow rate of H2 carrier gas (L/min): C1—0.65, C2—0.20.
Processes 07 00574 g004
Figure 5. SEM images of TiO2 at 800 °C for 1.5 h at different flow rate of each component; A group is the flow rate of H2 diluent gas (L/min): A1—1.52, A2—1.32; B group is the flow rate of H2 carrier gas (L/min): B1—0.48, B2—0.18; C group is the flow rate of CO2 (mL/min): C1—80, C2—20.
Processes 07 00574 g005
Figure 6. SEM images of carbon deposits on the surface of TiN coatings with different micromorphology after the coking test: (a) disordered sheet structure (corresponding to Figure 4(B2)), (b) rounded agglomerate structure (corresponding to Figure 4(A2)), (c) big star-shaped crystals (corresponding to Figure 4(C2)), and (d) lenticular crystals (corresponding to Figure 4(C1)).
Processes 07 00574 g006
Figure 7. SEM images of carbon deposits on the surface of TiO2 coatings with different particle sizes after the coking test: (a) the flow rate of H2 diluent gas is 1.52 L/min (corresponding to Figure 5(A1)) and (b) the flow rate of CO2 is 80 mL/min (corresponding to Figure 5(C1)).
Processes 07 00574 g007
Table 1. A typical experimental condition for the preparation of the TiN and TiO2 coatings.
ConditionsTiN CoatingTiO2 Coating
Flow rate of H2 diluent gas (L/min)1.831.88
Flow rate of H2 carrier gas (L/min)0.950.88
Flow rate of N2 (L/min)1.40none
Flow rate of CO2 (mL/min)none40
Deposition press (atm)11
Preheating temperature (°C)650650
Substrate temperature (°C)850800
Vaporizer temperature (°C)2828
Gas line temperature (°C)100100
Deposition time (min)9090
Table 2. Parameters of the coking test.
ConditionsValue
Flow rate of N2 diluent gas (mL/min)17
Flow rate of N2 carrier gas (mL/min)73
Substrate temperature (°C)770
Pre-heater temperature (°C)400
Vaporizer temperature (°C)50
Experimental time (h)1.5
Gas line temperature (°C)130

