The Impact of Equilibrium Gas Pressure and Coal Particle Size on Gas Dynamic Diffusion in Coal


Abstract
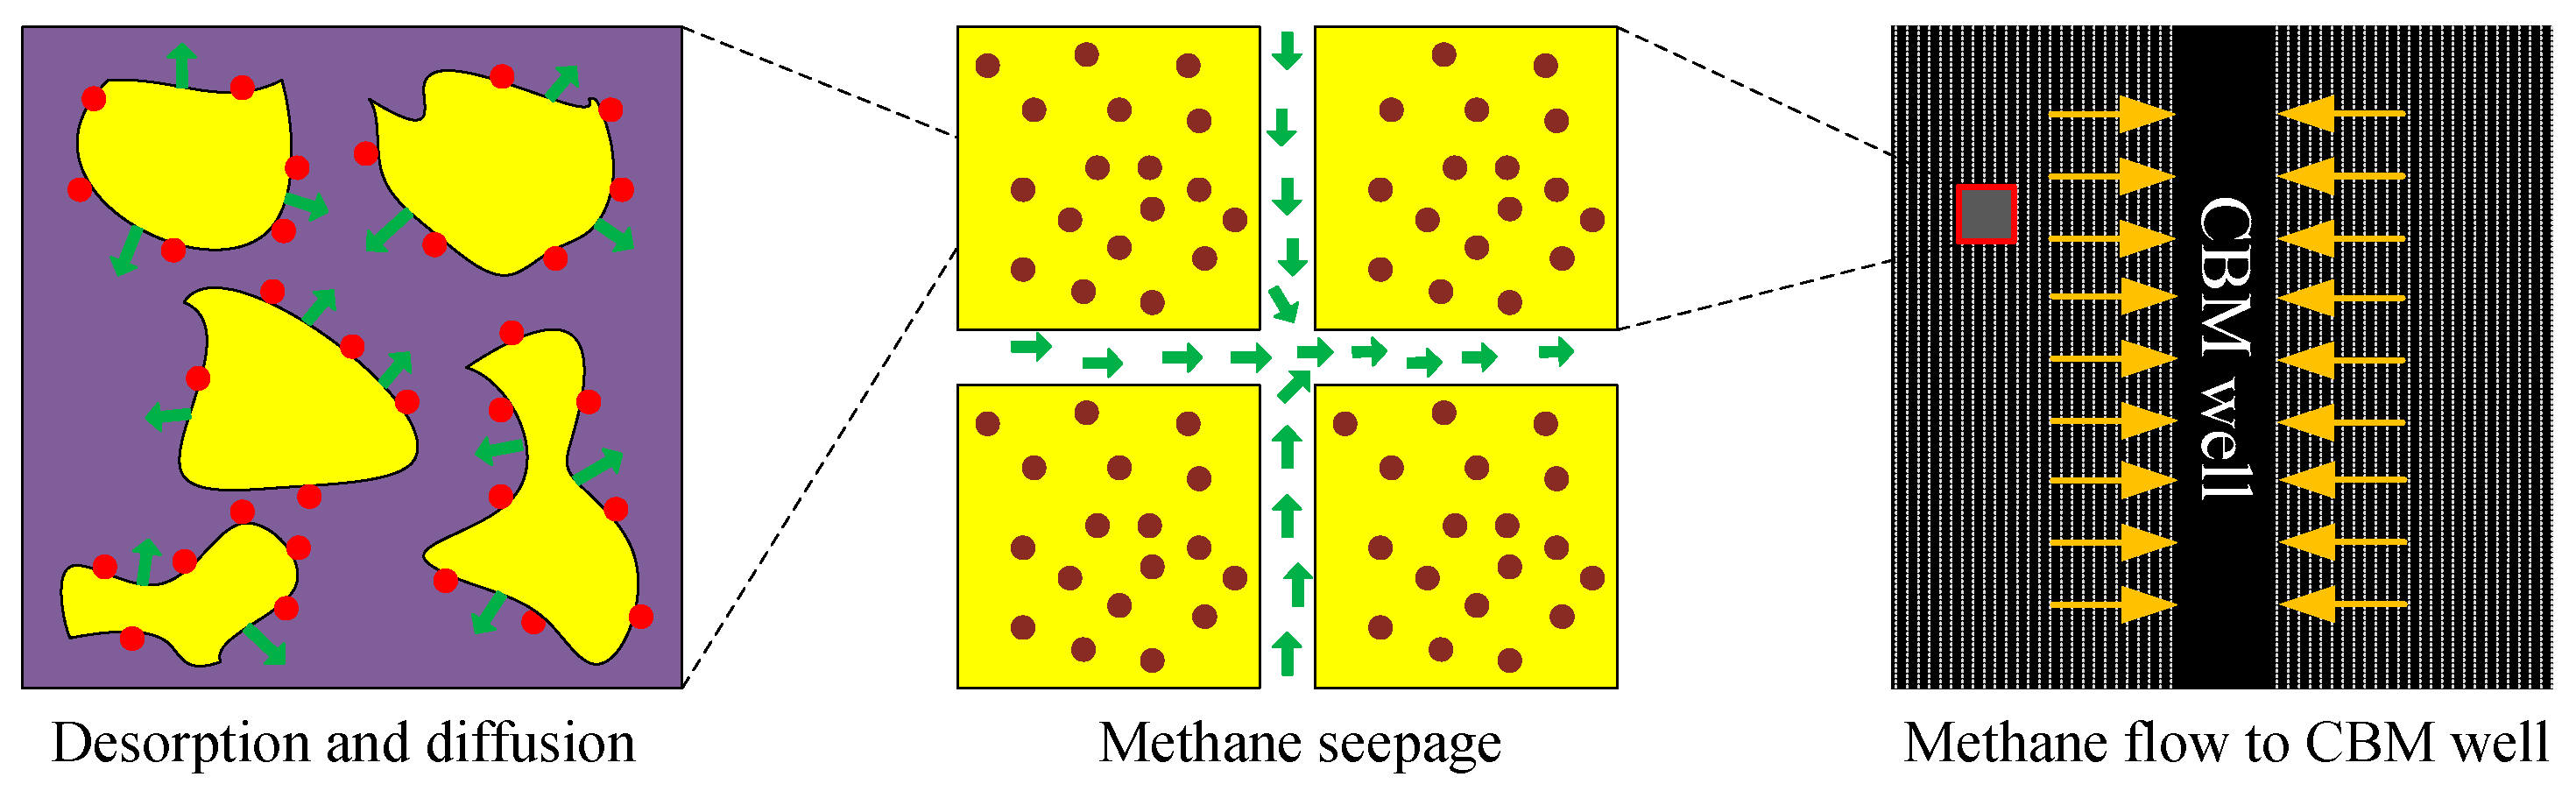
:1. Introduction
2. Diffusion Models
2.1. Unipore Model
2.2. Bidisperse Model
2.3. UDD Model
2.3.1. UDD Model in Coal
2.3.2. Diffusion Model and Initial and Boundary Conditions
2.3.3. Model Solution
2.4. Method for Estimating the Diffusivity
3. Experiments
3.1. Coal Samples
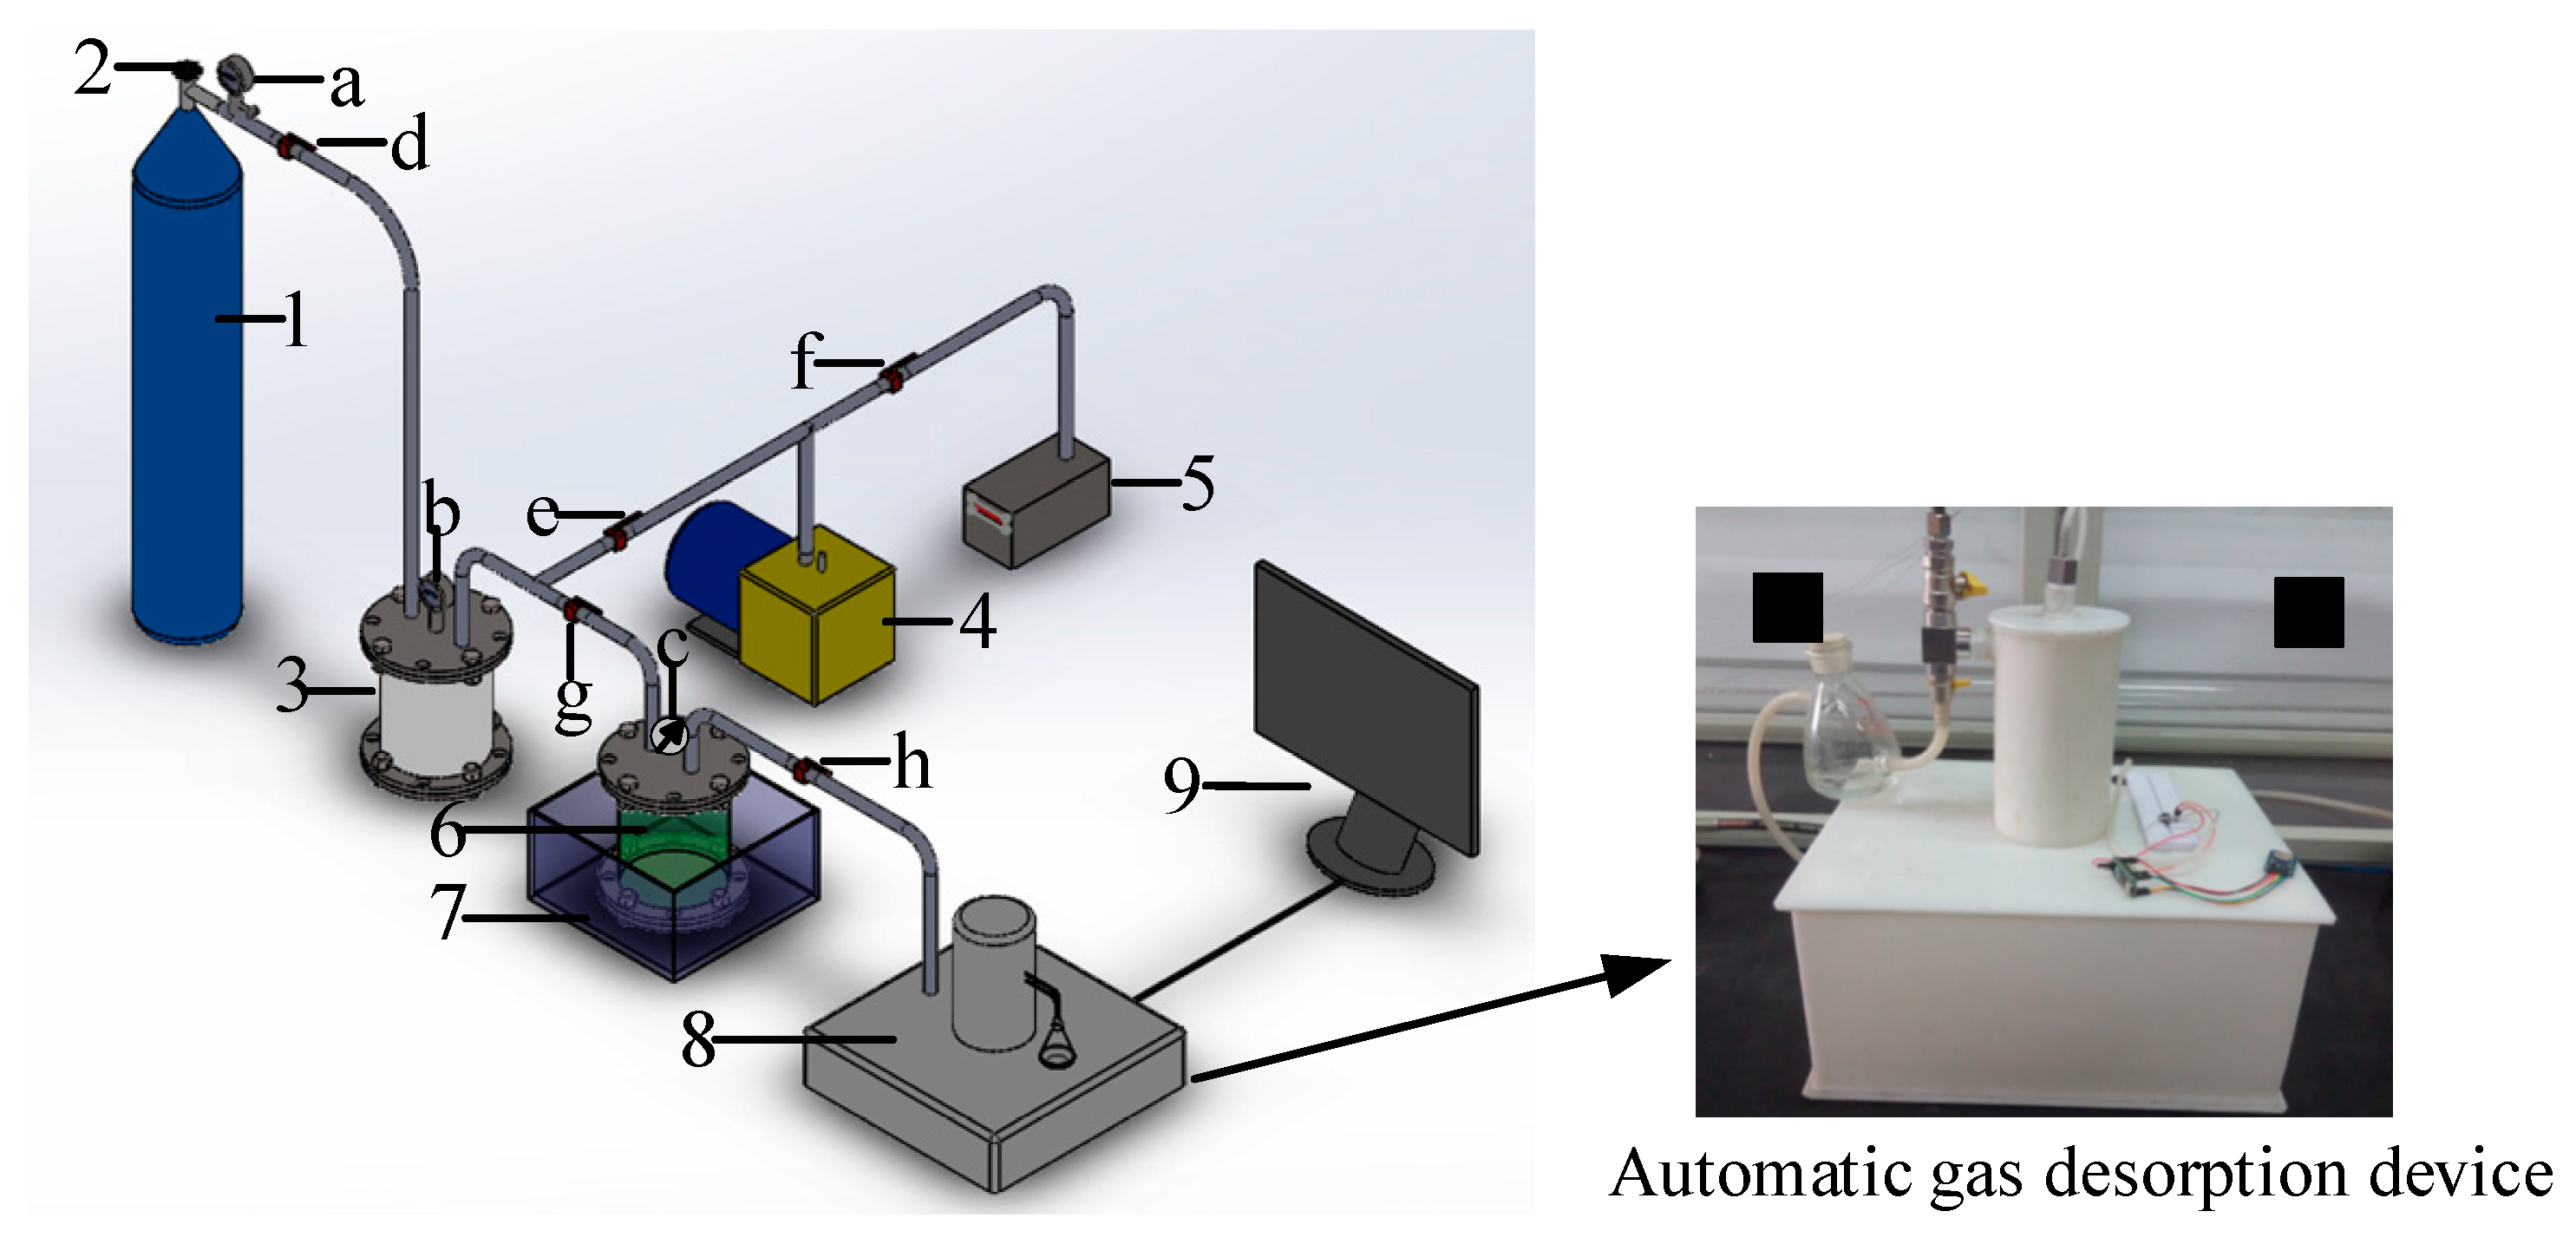
3.2. Experimental System
3.3. Experimental Methods
- (1)
- To avoid the impact of moisture, the three groups of coal samples with different particle sizes obtained by grinding and sieving were placed in an electrothermal isothermal drying box at 50 °C for 12 h to remove water from the coal. Then, the samples were put into the coal sample tank.
- (2)
- Based on the experiment’s requirements, after assembling the debugging equipment, the coal sample tank was put into an isothermal water bath, and the temperature was set to 298.15 K to maintain the experimental temperature in the range of 0.1 K and to keep the test temperature constant.
- (3)
- The valve (Valve g) was opened between the reference tank and sample tank, and the air and other gas impurities were removed using a vacuum pump (until the vacuum meter reads <10 Pa).
- (4)
- After vacuum degassing, Valve g was closed, and then CH4 was injected into the reference tank using a high-pressure CH4 cylinder, and the pressure relief valve was adjusted until the pressure of the reference tank was stabilized at 0.5 MPa. Then, Valve g was opened to allow CH4 into the sample tank. After the number on the pressure indicator was kept constant for 1 h, the valve between the sample tank and the reference tank was disconnected to continue to fill CH4 into the reference tank until the pressure reached 0.5 MPa. Next, the valves of the reference and sample tanks were opened until adsorption equilibrium. Meanwhile, the pressure remained constant. The process was repeated until the pressure remained at 0.5 MPa for 1 h, and the sample was at 0.5 MPa adsorption equilibrium pressure.
- (5)
- Once equilibrium was attained, the automatic desorption instrument was turned on and the data acquisition system was activated for gas desorption. The desorption lasted for 9000 s.
- (6)
- After the experiment of the three groups of coal samples was completed under 0.5 MPa, the experiment was repeated under 1.0 and 1.5 MPa until all desorption processes were completed.
4. Results
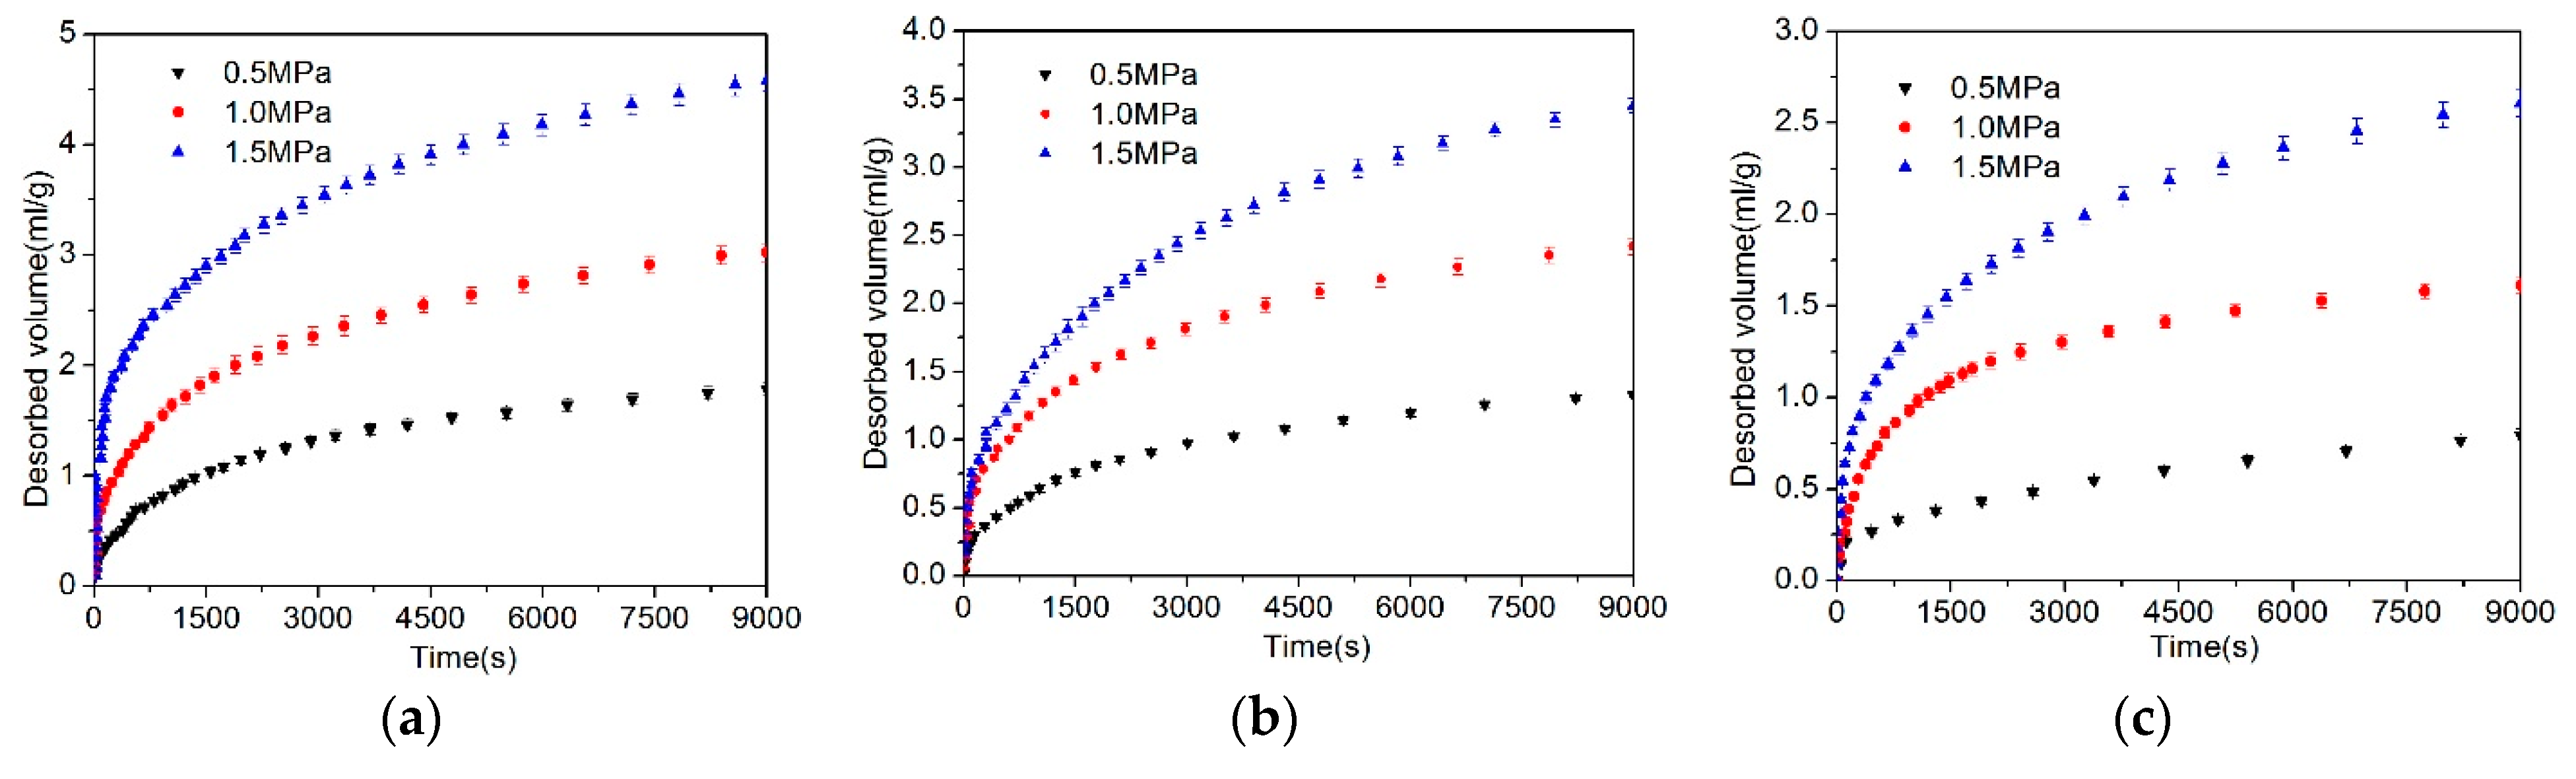
4.1. Desorbed Gas Volume
4.2. Fitting Results of the Unipore Model and Bidisperse Model
4.3. Fitting Results of the UDD Model
5. Discussion
5.1. Comparison of the Unipore, Bidisperse, and UDD Models
5.2. Effect of Particle Size on the Diffusion Coefficient
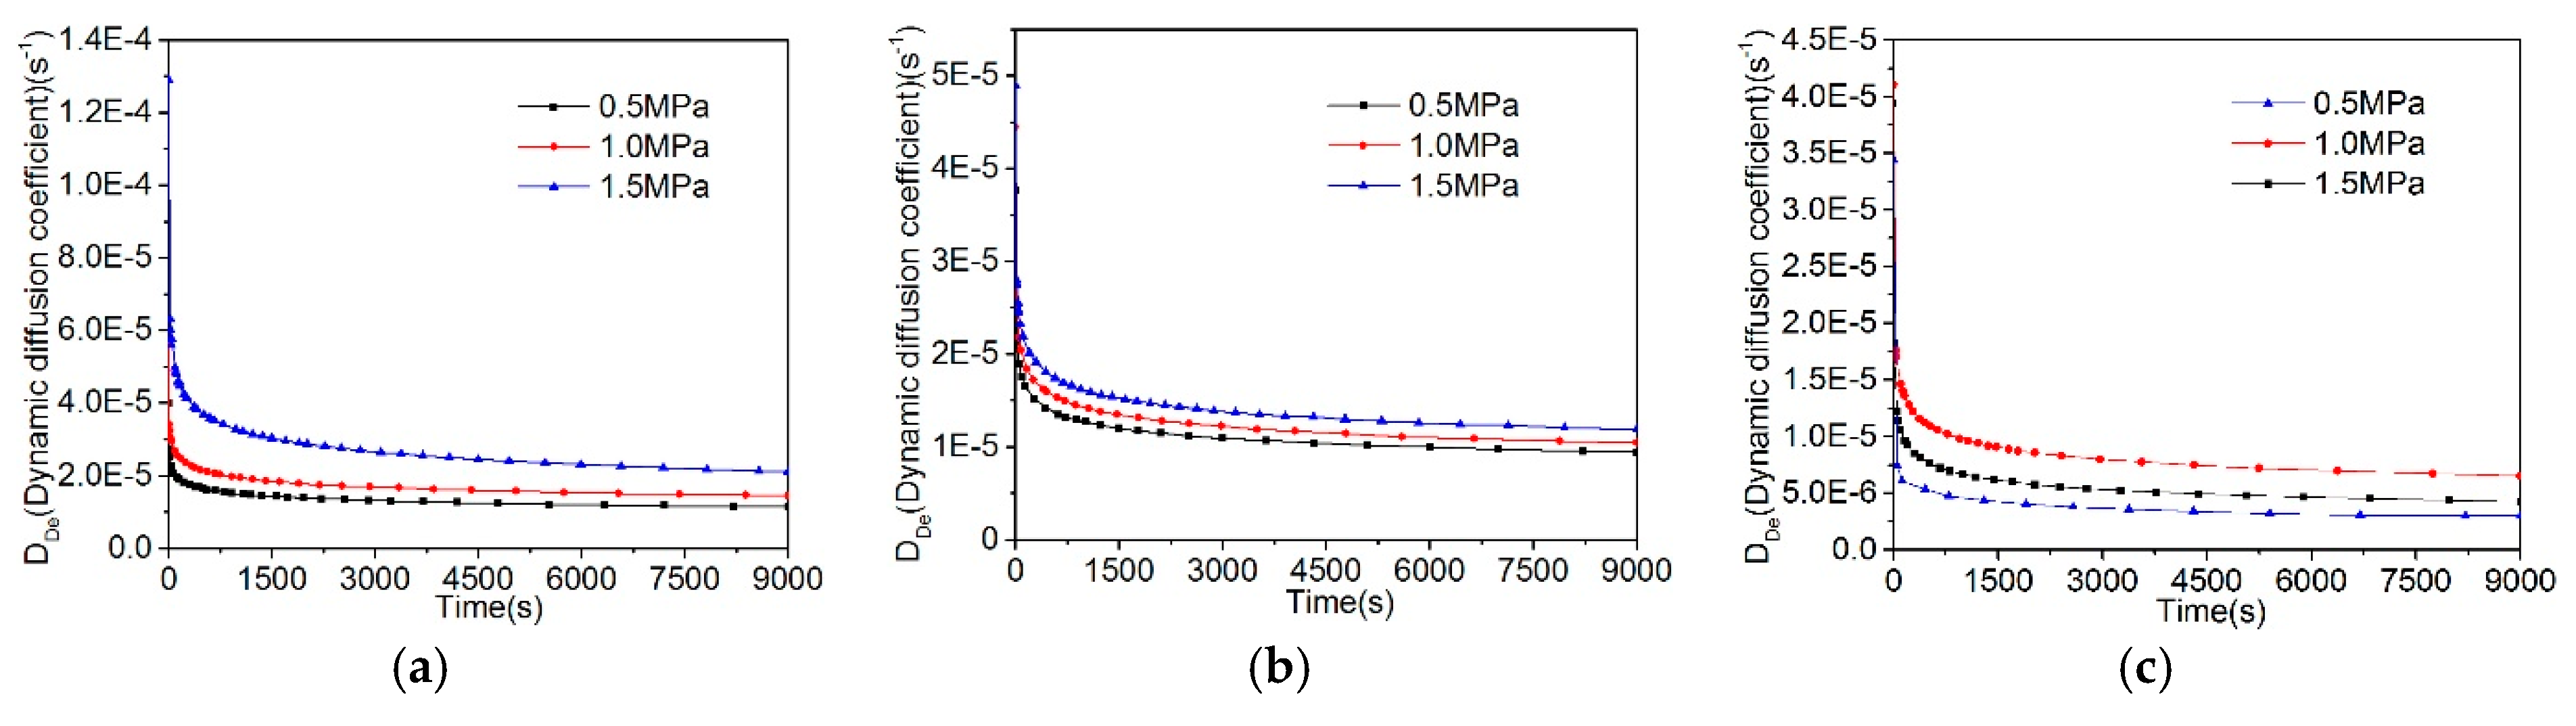
5.3. Effect of Gas Pressure on the Diffusion Coefficient
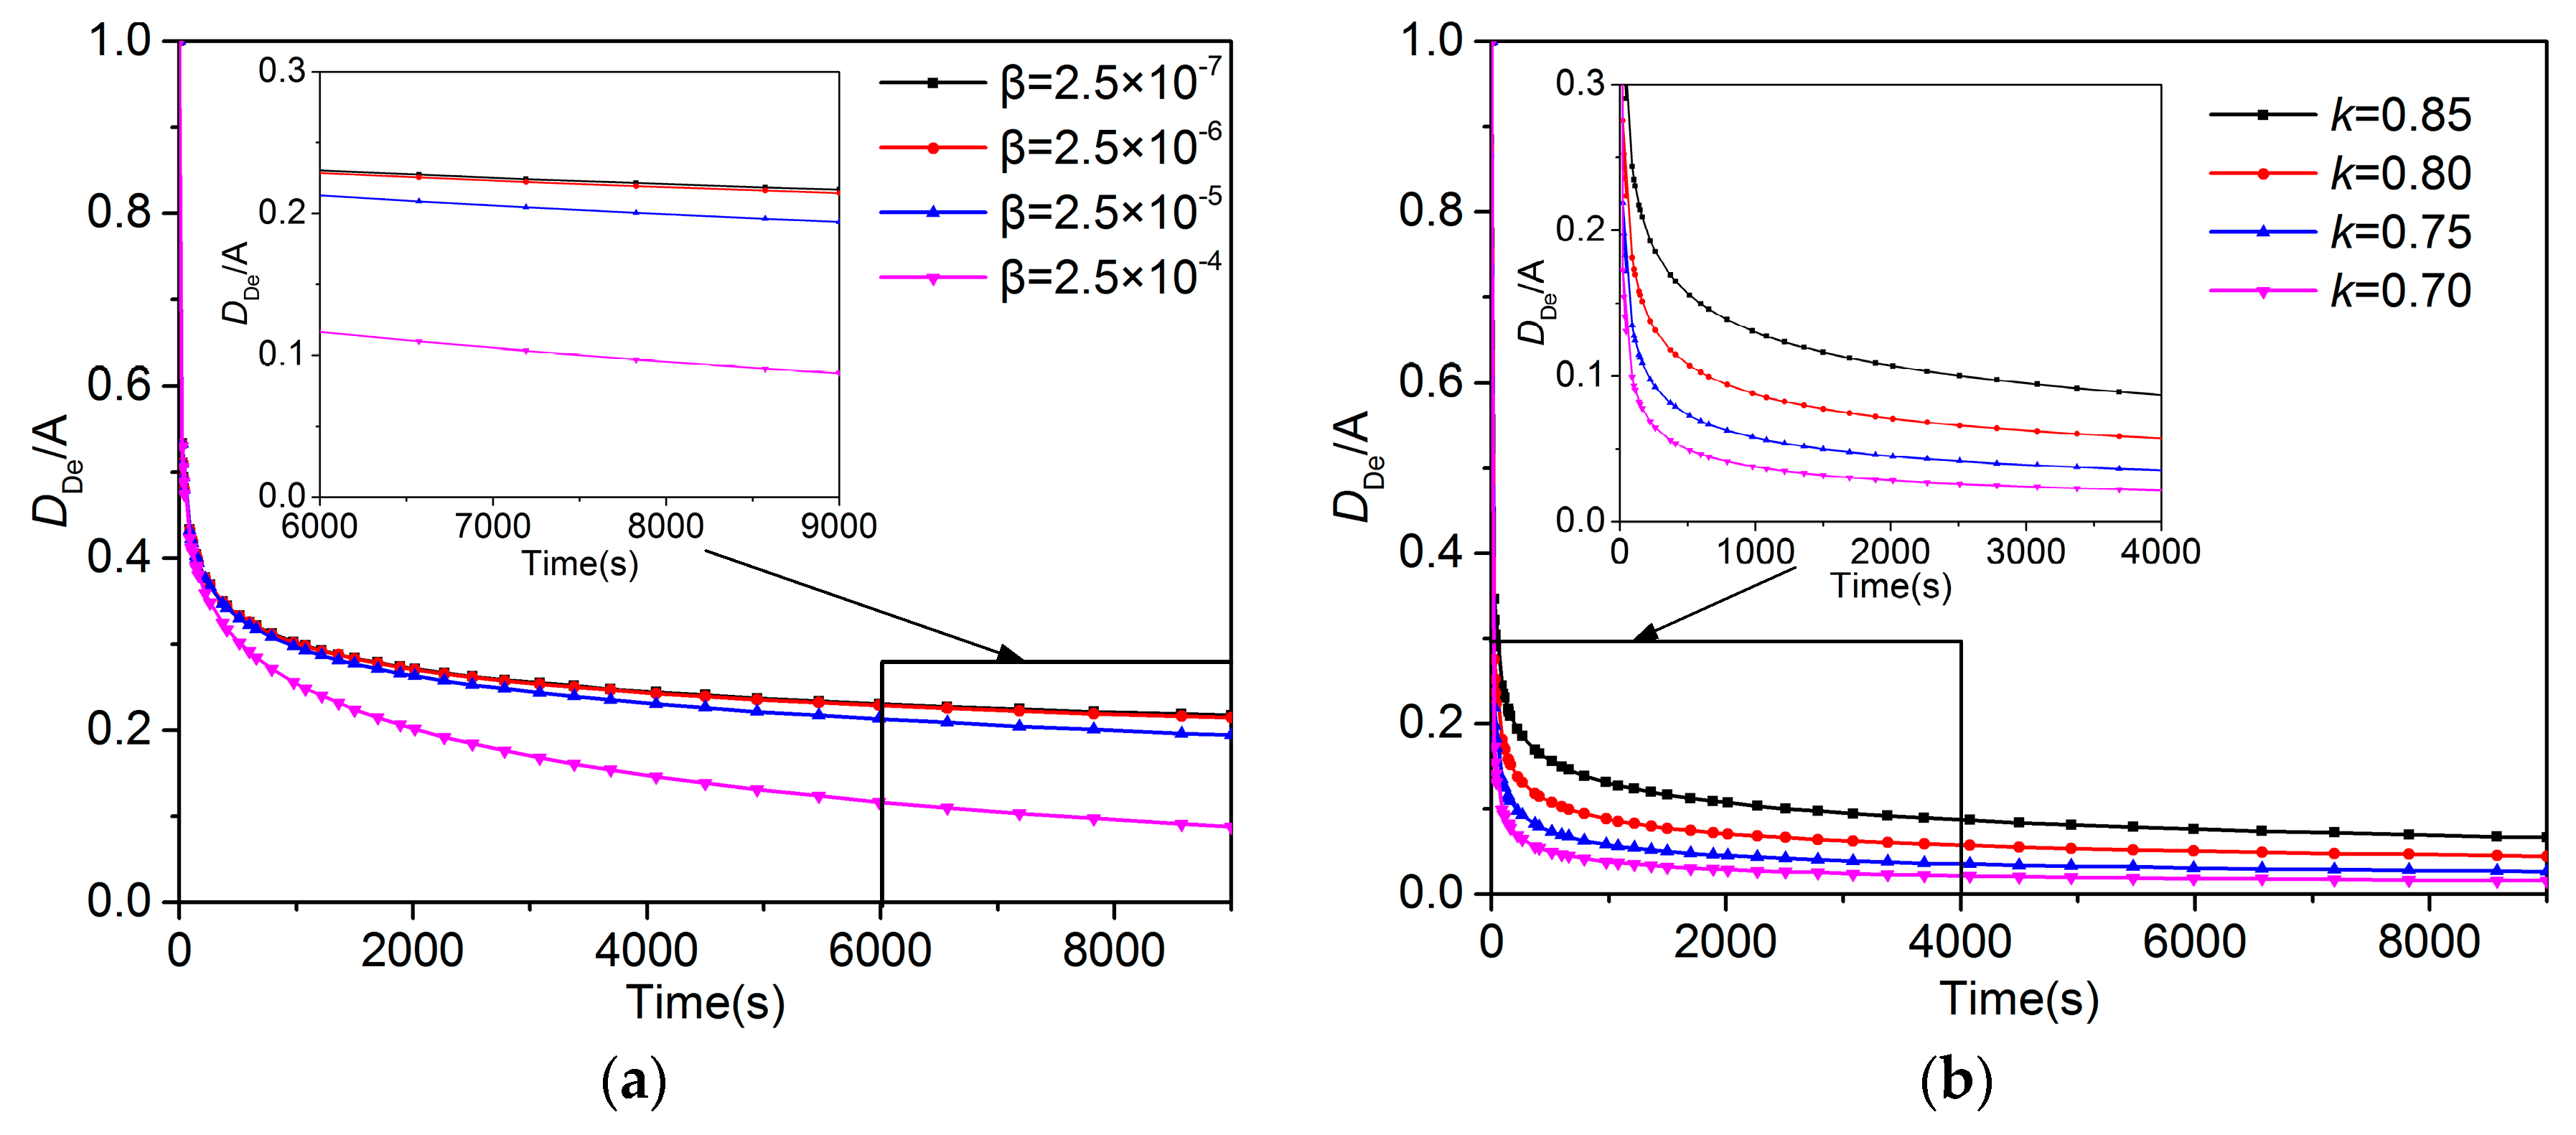
5.4. Meanings of the A, β, and K in the UDD Model
6. Conclusions
- (1)
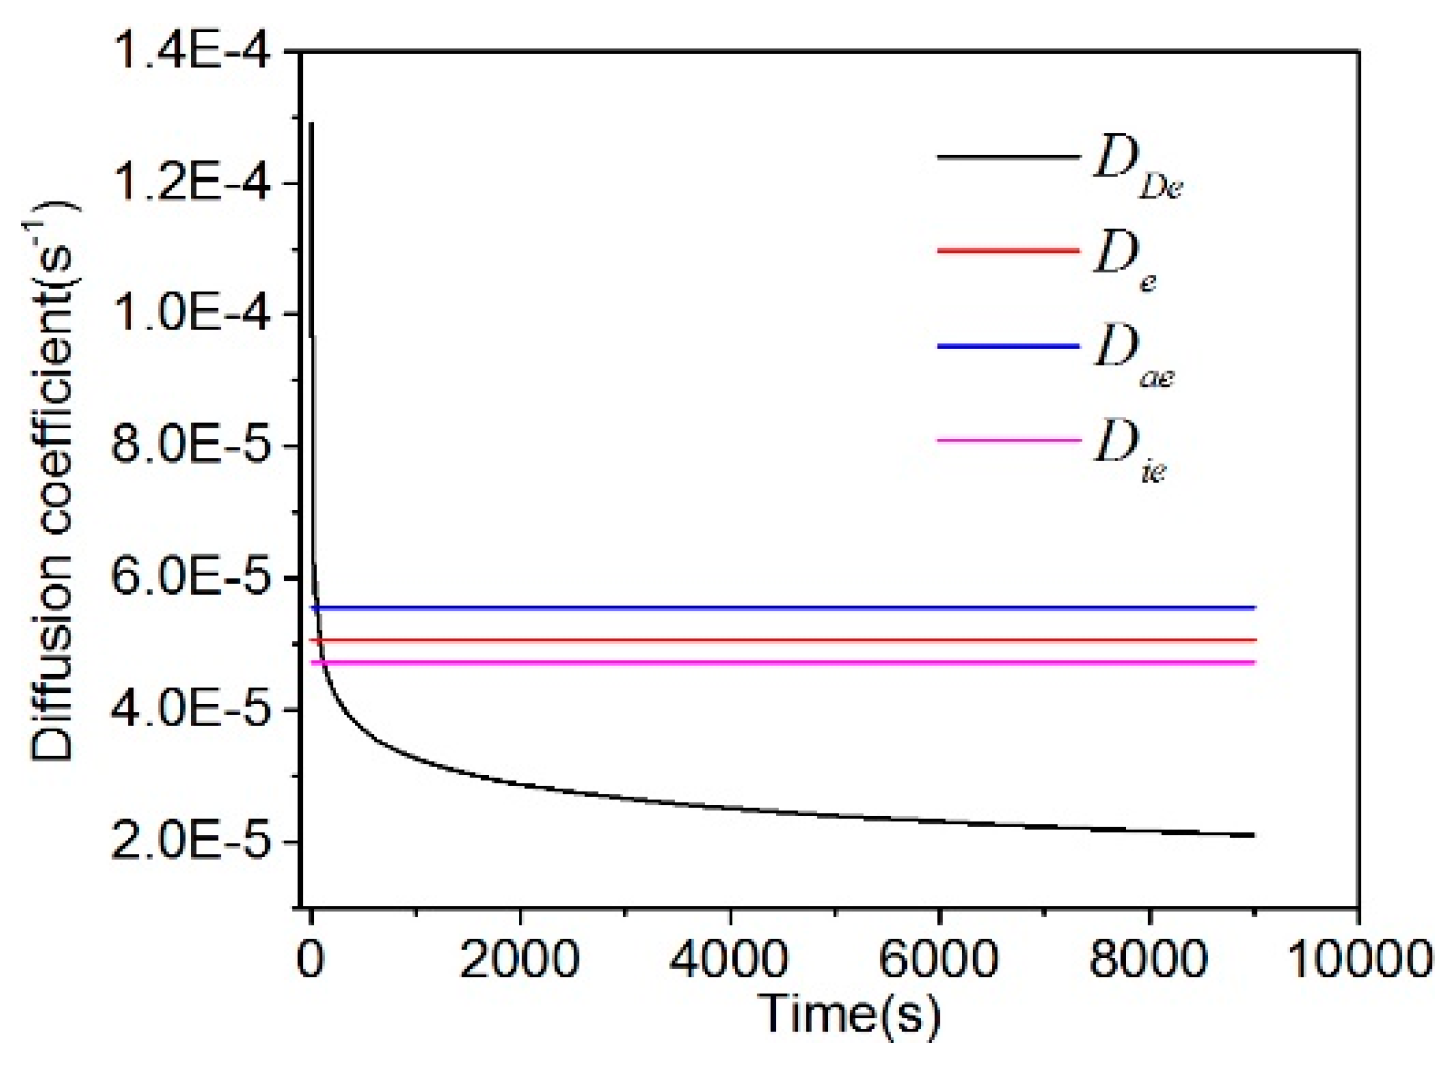
- Compared with the unipore model, the bidisperse and UDD models could better describe gas diffusion in coal, and the fitting effect of the UDD model is better than the bidisperse model. In addition, the UDD model could well simulate the entire diffusion process and illustrate the dynamic attenuation characteristics of the gas diffusion process. The diffusion coefficients of the three models are in the order of magnitude of 10−4 s−1–10−6 s−1.
- (2)
- Based on the calculation results of the diffusion coefficients (De, Dae, Die, and DDe) of the three models, the effective diffusion coefficients of gases decrease with the increase of the particle size.
- (3)
- In the unipore model, the diffusion coefficients of the coal samples with three particle sizes exhibited a positive correlation with pressure. In the bidisperse and UDD models, based on the calculation results of the diffusion coefficients Die, Dae, and DDe, the diffusion coefficients of 0.25–0.5 mm and 0.5–1.0 mm coal samples increase with the increase of pressure, exhibiting a positive correlation with pressure. In addition, DDe and Dae of 1.0–1.25 mm coal samples increase first and then decreased with the increase of pressure. However, Die decreases first and then increases, suggesting no significant pressure dependence.
- (4)
- This study discussed the significance of the parameters in the UDD model. While A can be regarded as the initial diffusion coefficient, β and k can be regarded as the parameters controlling the decay of the diffusion coefficient. A negative correlation exists between β and the gas diffusion coefficient, suggesting that a smaller β value exerts a greater impact on the decay of the diffusion coefficient. Furthermore, k positively correlates with the gas diffusion coefficient, suggesting that a larger k value exerts a greater effect on the decay of the diffusion coefficient.
Author Contributions
Funding
Conflicts of Interest
References
- Alireza, K.; Richard, S.; Mihaela, G.; Sayyafzadeh, M. Effect of maceral composition and coal rank on gas diffusion in Australian coals. Int. J. Coal Geol. 2017, 173, 65–75. [Google Scholar]
- Charrière, D.; Pokryszka, Z.; Behra, P. Effect of pressure and temperature on diffusion of CO2 and CH4 into coal from the Lorraine basin (France). Int. J. Coal Geol. 2010, 81, 373–380. [Google Scholar] [CrossRef]
- Martina, S.; Zuzana, W.; Oldřich, P. The effect of moisture on the sorption process of CO2 on coal. Fuel 2012, 92, 187–196. [Google Scholar]
- Zhang, J. Experimental Study and Modeling for CO2 Diffusion in Coals with Different Particle Sizes: Based on Gas Absorption (Imbibition) and Pore Structure. Energy Fuels 2016, 30, 531–543. [Google Scholar] [CrossRef]
- Siemons, N.; Wolf, K.-H.A.; Bruining, J. Interpretation of carbon dioxide diffusion behavior in coals. Int. J. Coal Geol. 2007, 72, 315–324. [Google Scholar] [CrossRef]
- Guo, H.; Cheng, Y.; Ren, T.; Wang, L.; Yuan, L.; Jiang, H.; Liu, H. Pulverization characteristics of coal from a strong outburst-prone coal seam and their impact on gas desorption and diffusion properties. J. Nat. Gas Sci. Eng. 2016, 33, 867–878. [Google Scholar] [CrossRef]
- Nandi, S.; Walker, P. Activated diffusion of methane in coal. Fuel 1970, 49, 309–323. [Google Scholar] [CrossRef]
- Clarkson, C.; Bustin, R. The effect of pore structure and gas pressure upon the transport properties of coal: A laboratory and modeling study. 2. Adsorption rate modeling. Fuel 1999, 78, 1345–1362. [Google Scholar] [CrossRef]
- Pone, J.D.N.; Halleck, P.M.; Mathews, J.P. Sorption Capacity and Sorption Kinetic Measurements of CO2 and CH4 in Confined and Unconfined Bituminous Coal. Energy Fuels 2009, 23, 4688–4695. [Google Scholar] [CrossRef]
- Sun, Y. Investigation of Gas Adsorption and Diffusion Behavior Based on Three-Dimensional Pore Structure of Coal; China University of Mining and Technology: Beijing, China, 2018. (In Chinese) [Google Scholar]
- Cui, X.; Bustin, R.; Dipple, G. Selective transport of CO2, CH4, and N2 in coals: Insights from modeling of experimental gas adsorption data. Fuel 2004, 83, 293–303. [Google Scholar] [CrossRef]
- Pan, Z.; Connell, L.D.; Camilleri, M.; Connelly, L. Effects of matrix moisture on gas diffusion and flow in coal. Fuel 2010, 89, 3207–3217. [Google Scholar] [CrossRef]
- Crank, J. The Mathematics of Diffusion, 2nd ed.; Oxford University Press: London, UK, 1975. [Google Scholar]
- Ruckenstein, E.; Vaidyanathan, A.S.; Youngquist, G.R. Sorption by solids with bidisperse pore structure. Chem. Eng. Sci. 1971, 26, 1305–1318. [Google Scholar] [CrossRef]
- Pramod, T. Chapter 4: Diffusion of Gases from Coal. In Advanced Reservoir and Production Engineering for Coal Bed Methane; Gulf Professional Publishing: Houston, TX, USA, 2017; pp. 51–59. [Google Scholar]
- Wang, K.; Wang, G.; Ren, T.; Cheng, Y. Methane and CO2 sorption hysteresis on coal: A critical review. Int. J. Coal Geol. 2014, 132, 60–80. [Google Scholar] [CrossRef]
- Yang, X.; Wang, G.; Zhang, J.; Ren, T. The Influence of Sorption Pressure on Gas Diffusion in Coal Particles: An Experimental Study. Processes 2019, 7, 219. [Google Scholar] [CrossRef]
- Naveen, P.; Asif, M.; Ojha, K. Sorption Kinetics of CH4 and CO2 Diffusion in Coal: Theoretical and Experimental Study. Energy Fuels 2019, 31, 6825–6837. [Google Scholar] [CrossRef]
- Liu, H.; Mou, J.; Cheng, Y. Impact of pore structure on gas adsorption and diffusion dynamics for long-flame coal. J. Nat. Gas Sci. Eng. 2015, 22, 203–213. [Google Scholar] [CrossRef]
- Li, Z. Gas diffusion mechanism in multi-scale pores of coal particles and new diffusion model of dynamic diffusion coefficient. J. China Coal Soc. 2016, 41, 633–643. [Google Scholar]
- Marquadt, D. An algorithm for least-square estimation of non-linear parameters. J. Appl. Math. 1963, 11, 431–441. [Google Scholar]
- Wang, K.; Zang, J.; Feng, Y.; Wu, Y. Effects of moisture on diffusion kinetics in Chinese coals during methane desorption. J. Nat. Gas Sci. Eng. 2014, 21, 1005–1014. [Google Scholar] [CrossRef]
- Wang, G.; Ren, T.; Qi, Q.; Lin, J.; Liu, Q.; Zhang, J. Determining the diffusion coefficient of gas diffusion in coal: Development of numerical solution. Fuel 2017, 196, 47–58. [Google Scholar] [CrossRef]
- Guo, H.; Yuan, L.; Cheng, Y.; Wang, K.; Xu, C.; Zhou, A.; Zang, J.; Liu, J. Effect of moisture on the desorption and unsteady-state diffusion properties of gas in low-rank coal. J. Nat. Gas Sci. Eng. 2018, 57, 45–51. [Google Scholar] [CrossRef]
- Staib, G.; Sakurovs, R.; Gray, E.M.A. A pressure and concentration dependence of CO2 diffusion in two Australian bituminous coals. Int. J. Coal Geol. 2013, 116, 106–116. [Google Scholar] [CrossRef]
- Zang, J.; Wang, K.; Liu, A. Phenomenological Over-Parameterization of the Triple-Fitting-Parameter Diffusion Models in Evaluation of Gas Diffusion in Coal. Processes 2019, 7, 241. [Google Scholar] [CrossRef]
- Zhao, W.; Cheng, Y.; Pan, Z.; Wang, K.; Liu, S. Gas diffusion in coal particles: A review of mathematical models and their applications. Fuel 2019, 252, 77–100. [Google Scholar] [CrossRef]
- Zhang, Y. Geochemical Kinetics; Princeton University Press: Princeton, NJ, USA, 2008. [Google Scholar]
- Mitra, P.P.; Sen, P.N.; Schwartz, L.M. Short-time behavior of the diffusion coefficient as a geometrical probe of porous media. Phys. Rev. B 1993, 47, 8565–8574. [Google Scholar] [CrossRef] [PubMed]
- Kärger, J.; Ruthven, D.M.; Theodorou, D.N. Diffusion in Nanoporous Materials; John Wiley & Sons: Hoboken, NJ, USA, 2012. [Google Scholar]
- Loskutov, V.; Sevriugin, V.; Loskutov, V. A novel approach to interpretation of the time-dependent self-diffusion coefficient as a probe of porous media geometry. J. Magn. Reson. 2013, 230, 1–9. [Google Scholar] [CrossRef]
- Liu, Y.; Teng, Y.; Lu, G.; Jiang, L.; Zhao, J.; Zhang, Y.; Song, Y. Experimental study on CO2 diffusion in bulkn-decane and n-decane saturated porous media using micro-CT. Fluid Phase Equil. 2016, 417, 212–219. [Google Scholar] [CrossRef]
- Valiullin, R.; Skirda, V. Time dependent self-diffusion coefficient of molecules in porous media. J. Chem. Phys. 2001, 114, 452. [Google Scholar] [CrossRef]
- Faruk, C. Mass, Momentum, and Energy Transport in Porous Media. In Porous Media Transport Phenomena; Wiley Online Library: Hoboken, NJ, USA, 2011; pp. 281–351. [Google Scholar]
- Jia, B.; Tsau, J.S.; Reza, B. Evaluation of Core Heterogeneity Effect on Pulse-decay Experiment. In Proceedings of the 31st International Symposium of the Society of Core Analysts, Vienna, Austria, 28 August–1 September 2017. [Google Scholar]
- Guo, H.; Cheng, Y.; Yuan, L.; Wang, L.; Zhou, H. Unsteady-State Diffusion of Gas in Coals and Its Relationship with Coal Pore Structure. Energy Fuels 2016, 30, 7014–7024. [Google Scholar] [CrossRef]
- Nandi, S.P.; Walker, P.L. Activated diffusion of methane from coals at elevated pressures. Fuel 1975, 54, 81–86. [Google Scholar] [CrossRef]
- Nie, B.S.; Yang, T.; Li, X. Research on Diffusion of Methane in Coal Particles. J. China Univ. Min. Technol. 2013, 42, 975–980. [Google Scholar]
- Yang, Q.L. Experimental Study on Gas Discharge Law of Coal Particles. Saf. Coal Mines 1987, 2, 9–16. [Google Scholar]
- Yue, G.; Wang, Z.; Xie, C.; Tang, X.; Yuan, J. Time-Dependent Methane Diffusion Behavior in Coal: Measurement and Modeling. Transp. Porous Media 2017, 116, 319–333. [Google Scholar] [CrossRef]
- Yang, Y.; Liu, S. Estimation and modeling of pressure-dependent gas diffusion coefficient for coal: A fractal theory-based approach. Fuel 2019, 253, 588–606. [Google Scholar] [CrossRef]
- Wang, Y.; Liu, S. Estimation of pressure-dependent diffusive permeability of coal using methane diffusion coefficient: Laboratory measurements and modeling. Energy Fuels 2016, 30, 8968–8976. [Google Scholar] [CrossRef]
- Jia, B.; Tsau, J.-S.; Barati, R. Different Flow Behaviors of Low-Pressure and High-Pressure Carbon Dioxide in Shales. SPE J. 2018, 23, 1452–1468. [Google Scholar] [CrossRef]
- Saghafi, A.; Faiz, M.; Roberts, D. CO2 storage and gas diffusivity properties of coals from Sydney Basin, Australia. Int. J. Coal Geol. 2007, 70, 240–254. [Google Scholar] [CrossRef]
- Ciembroniewicz, A.; Marecka, A. Kinetics of CO2 sorption for two Polish hard coals. Fuel 1993, 72, 405–408. [Google Scholar] [CrossRef]
- Smith, D.M.; Williams, F.L. Diffusional Effects in the Recovery of Methane from Coalbeds. Soc. Pet. Eng. J. 1984, 24, 529–535. [Google Scholar] [CrossRef]
- Busch, A.; Gensterblum, Y.; Krooss, B.M.; Littke, R. Methane and carbon dioxide adsorption–diffusion experiments on coal: Upscaling and modeling. Int. J. Coal Geol. 2004, 60, 151–168. [Google Scholar] [CrossRef]
- Shi, J.; Durucan, S. A bidisperse pore diffusion model for methane displacement desorption in coal by CO2 injection. Fuel 2003, 82, 1219–1229. [Google Scholar] [CrossRef]


| Study | Model | Fluid | Effect of Increasing Pressure on Diffusion Coefficients | Experiment Conditions |
|---|---|---|---|---|
| Clarkson and Bustin (1999) [8] | Unipore, bidisperse | CO2, CH4 | Increase | 0 & 30 °C, 0–127 KPa & 0–5 MPa |
| Cui et al. (2004) [11] | Modified bidisperse | CO2, CH4 | Decrease | 30 °C, 0–7 MPa |
| Siemons et al. (2007) [5] | Two exponentials | CO2 | Slow term decreases | 0–6 MPa, 45 °C |
| Pone et al. (2009) [9] | Unipore-like model | CH4 | Decrease | 20 °C, 3.1 MPa |
| Pan et al. (2010) [12] | Bidisperse | CH4,CO2 | CH4 increase. CO2 no change | 26 °C, 0–4 MPa |
| Švábová et al. (2012) [3] | LDF single parameter | CO2 | Decrease | 45 & 55 °C, 0.1–0.8 MPa |
| Sun (2018) [10] | Unipore model | CH4,CO2 | No obvious regularity | 0–5.2 MPa |
| Mad% | Aad% | Ad% | Vad% | Vd% | Vdaf% | FCad% | FCd% |
|---|---|---|---|---|---|---|---|
| 1.3 | 12.06 | 11.39 | 10.04 | 9.72 | 11.36 | 78.69 | 76.12 |
| Size (mm) | 0.25 mm–0.5 mm | 0.5 mm–1.0 mm | 1.0 mm–1.25 mm | |||
|---|---|---|---|---|---|---|
| Pressure (MPa) | De (s−1) | R2 | De (s−1) | R2 | De(s−1) | R2 |
| 0.5 MPa | 3.58 × 10−05 | 0.9872 | 3.44 × 10−05 | 0.9846 | 3.36 × 10−05 | 0.9805 |
| 1.0 MPa | 4.11 × 10−05 | 0.9828 | 4.06 × 10−05 | 0.9833 | 3.64 × 10−05 | 0.9781 |
| 1.5 MPa | 5.06 × 10−05 | 0.9759 | 4.62 × 10−05 | 0.9901 | 3.82 × 10−05 | 0.9911 |
| Size (mm) | 0.25 mm–0.5 mm | 0.5 mm–1.0 mm | 1.0 mm–1.25 mm | |||||||||
|---|---|---|---|---|---|---|---|---|---|---|---|---|
| Pressure (MPa) | Dae (s−1) | Die (s−1) | η | R2 | Dae (s−1) | Die(s−1) | η | R2 | Dae (s−1) | Die(s−1) | η | R2 |
| 0.5 MPa | 3.58 × 10−05 | 2.96 × 10−05 | 0.762 | 0.9989 | 2.75 × 10−05 | 2.74 × 10−05 | 0.789 | 0.9992 | 2.51 × 10−05 | 1.21 × 10−05 | 0.745 | 0.9988 |
| 1.0 MPa | 3.92 × 10−05 | 3.33 × 10−05 | 0.816 | 0.9992 | 3.35 × 10−05 | 2.62 × 10−05 | 0.814 | 0.9974 | 3.23 × 10−05 | 1.05 × 10−05 | 0.769 | 0.9991 |
| 1.5 MPa | 5.56 × 10−05 | 4.73 × 10−05 | 0.830 | 0.9978 | 4.85 × 10−05 | 2.70 × 10−05 | 0.813 | 0.9987 | 3.01 × 10−05 | 1.76 × 10−05 | 0.738 | 0.9985 |
| Size (mm) | 0.25 mm–0.5 mm | 0.5 mm–1.0 mm | 1.0 mm–1.25 mm | |||||||||
|---|---|---|---|---|---|---|---|---|---|---|---|---|
| Pressure (MPa) | A | β | k | R2 | A | β | k | R2 | A | β | k | R2 |
| 0.5 MPa | 3.99 × 10−05 | 2.35 × 10−06 | 0.878 | 0.9994 | 3.76 × 10−05 | 1.28 × 10−07 | 0.854 | 0.9998 | 3.43 × 10−05 | 1.37 × 10−06 | 0.721 | 0.9997 |
| 1.0 MPa | 5.68 × 10−05 | 2.59 × 10−07 | 0.869 | 0.9996 | 4.43 × 10−05 | 8.28 × 10−04 | 0.822 | 0.9995 | 4.11 × 10−05 | 2.76 × 10−07 | 0.802 | 0.9996 |
| 1.5 MPa | 1.29 × 10−04 | 2.12 × 10−05 | 0.878 | 0.9991 | 4.89 × 10−05 | 3.64 × 10−08 | 0.851 | 0.9992 | 3.94 × 10−05 | 5.89 × 10−05 | 0.801 | 0.9994 |
© 2019 by the authors. Licensee MDPI, Basel, Switzerland. This article is an open access article distributed under the terms and conditions of the Creative Commons Attribution (CC BY) license (http://creativecommons.org/licenses/by/4.0/).
Share and Cite
Li, C.; Nie, Y.; Tian, J.; Zhao, Y.; Zhang, X. The Impact of Equilibrium Gas Pressure and Coal Particle Size on Gas Dynamic Diffusion in Coal. Processes 2019, 7, 571. https://doi.org/10.3390/pr7090571
Li C, Nie Y, Tian J, Zhao Y, Zhang X. The Impact of Equilibrium Gas Pressure and Coal Particle Size on Gas Dynamic Diffusion in Coal. Processes. 2019; 7(9):571. https://doi.org/10.3390/pr7090571
Chicago/Turabian StyleLi, Chengwu, Yao Nie, Jianwei Tian, Yuechao Zhao, and Xiaoqian Zhang. 2019. "The Impact of Equilibrium Gas Pressure and Coal Particle Size on Gas Dynamic Diffusion in Coal" Processes 7, no. 9: 571. https://doi.org/10.3390/pr7090571
APA StyleLi, C., Nie, Y., Tian, J., Zhao, Y., & Zhang, X. (2019). The Impact of Equilibrium Gas Pressure and Coal Particle Size on Gas Dynamic Diffusion in Coal. Processes, 7(9), 571. https://doi.org/10.3390/pr7090571