Article

Formation and Evolution Mechanism for Carbonaceous Deposits on the Surface of a Coking Chamber

1
Key Laboratory of Energy Thermal Conversion and Control of Ministry of Education, School of Energy and Environment, Southeast University, Nanjing 210096, China
2
Huatian Engineering & Technology Corporation, MCC, Ma’anshan 243005, China
3
School of Architecture and Civil Engineering, Anhui University of Technology, Ma’anshan 243002, China
*
Authors to whom correspondence should be addressed.
Processes 2019, 7(8), 508; https://doi.org/10.3390/pr7080508
Submission received: 12 July 2019 / Revised: 28 July 2019 / Accepted: 29 July 2019 / Published: 3 August 2019
(This article belongs to the Special Issue Gas Capture Processes)

Abstract

:
This work aimed to investigate the carbonaceous deposits on the surface of the coking chamber. Scanning electron microscopy (SEM), X-ray fluorescence spectrum (XRF), Fourier transform infrared spectrometer (FTIR), Raman spectroscopy, X-ray diffraction spectrum (XRD), and X-ray photoelectron spectroscopy (XPS) were applied to investigate the carbonaceous deposits. FTIR revealed the existence of carboxyl, hydroxyl, and carbonyl groups in the carbonaceous deposits. SEM showed that different carbonaceous deposit layers presented significant differences in morphology. XRF and XPS revealed that the carbonaceous deposits mainly contained C, O, and N elements, with smaller amounts of Al, Si, and Ca elements. It was found that in the formation of carbonaceous deposits, the C content gradually increased while the O and N elements gradually decreased. It was also found that the absorbed O2 and H2O took part in the oxidation process of the carbon skeleton to form the =O and –O– structure. The oxidation and elimination reaction resulted in change in the bonding state of the O element, and finally formed compact carbonaceous deposits on the surface of the coking chamber. Based on the analysis, the formation and evolution mechanisms of carbonaceous deposits were discussed.

1. Introduction

As an important chemical raw material, coke plays an indispensable role in the fields of metallurgy and energy. China is the largest coke supplier in the world and accounts for more than 70% of global production [1,2]. In 2016, China produced 449.1 million tons of coke [3]. Coke-making contains many processes, in which the coking chamber is the key carrier for coking. Thus, the operating status of the coking chamber significantly influences the production and quality of the coking process [4,5,6].
The coke-making process is a complex physical–chemical process [7,8,9,10]. The coal is pyrolyzed into many polycyclic aromatic hydrocarbon compounds: methane (CH4), hydrogen (H2), ammonium (NH3), sulfur dioxide (SO2), and so on. At the same time, the mineral composition, which contains many metal ions, also takes part in the coking process [11]. With the increase in coking operations, a compact carbonaceous deposit forms on the surface of the coking chamber, affecting its stable operation and shortening the lifetime of coke oven batteries, which not only decreases coking production, but also deteriorates the quality of the coking products [12]. Thus, it is important to investigate the formation and evolution processes of carbonaceous deposits on the surface of the coking chambers, which will benefit the enhancement of stable operations and prolong the lifetime of coke oven batteries [13].
In fact, carbonaceous deposits are significantly influenced by the temperature of the coke oven chamber, the gas phase, residence time of volatiles in the hot zone, and the surface on which the deposition takes place. A series of works have reported on the carbonaceous deposits on the surface of coke oven chambers. Furusa et al. investigated the influence of coal moisture and fine coal particles on carbonaceous deposits and clarified the formation mechanism of the carbonaceous deposits [14]. Uebo et al. researched the temperature and water presence on carbon depositions in laboratory tests, and tested brick pieces in the pilot plant oven [13]. Dumay et al. investigated the cracking conditions in the coke oven free space to better assess the parameters for the control of carbonaceous deposits. They also reported on a special device that could measure the growth of carbonaceous deposits in situ [15]. Krebs et al. investigated the influence of coal moisture content on carbonaceous deposits’ yield and microstructure in detail [16]. Additionally, some strategies were applied to remove the carbonaceous deposits including manual or mechanical removal by spearing, burning-off by nature, air flow from the door or charring hole, and decomposition by blowing exhaust gas into the top space [17]. Furthermore, some methods have been proposed to prevent carbonaceous deposits. Nakagava et al. reported that injecting atomized water into the free space of the coke oven chambers could significantly decrease carbonaceous deposits [18]. Ando et al. reported the chamber wall being coated with glassy products containing 18–70 wt% of SiO2, 10–60 wt% of Na2O, 2–14 wt% of BaO, 0.5–25 wt% of SrO, and 0.5–20 wt% of Fe2O3, which could significantly inhibit carbonaceous deposits [19].
However, most of the above-mentioned studies have focused on the influencing factors of carbonaceous deposits and most of the methods used to remove the carbon depositions were based on macro experiments, with few studies focused on the composition of carbonaceous deposits. Furthermore, the formation and evolution mechanism of carbonaceous deposits need to be further investigated, which are pivotal to effectively prevent carbonaceous deposits. Thus, this paper aimed to systematically investigate the difference of the carbonaceous deposits on the surface of the coking chamber. Scanning electron microscope (SEM), X-ray fluorescence spectrum (XRF), Fourier transform infrared spectrometer (FTIR), Raman spectroscopy, X-ray diffraction spectrum (XRD), and X-ray photoelectron spectroscopy (XPS) were used to research the morphological structure, elemental composition, and bonding states of different carbonaceous deposit layers. Furthermore, the formation and evolution mechanism of carbonaceous deposits on the surface of coking chambers were discussed. The above work will provide a theoretical basis for effectively inhibiting carbonaceous deposits on the surface of coke oven chambers, which will benefit the stable operation of coke ovens.

2. Materials and Methods

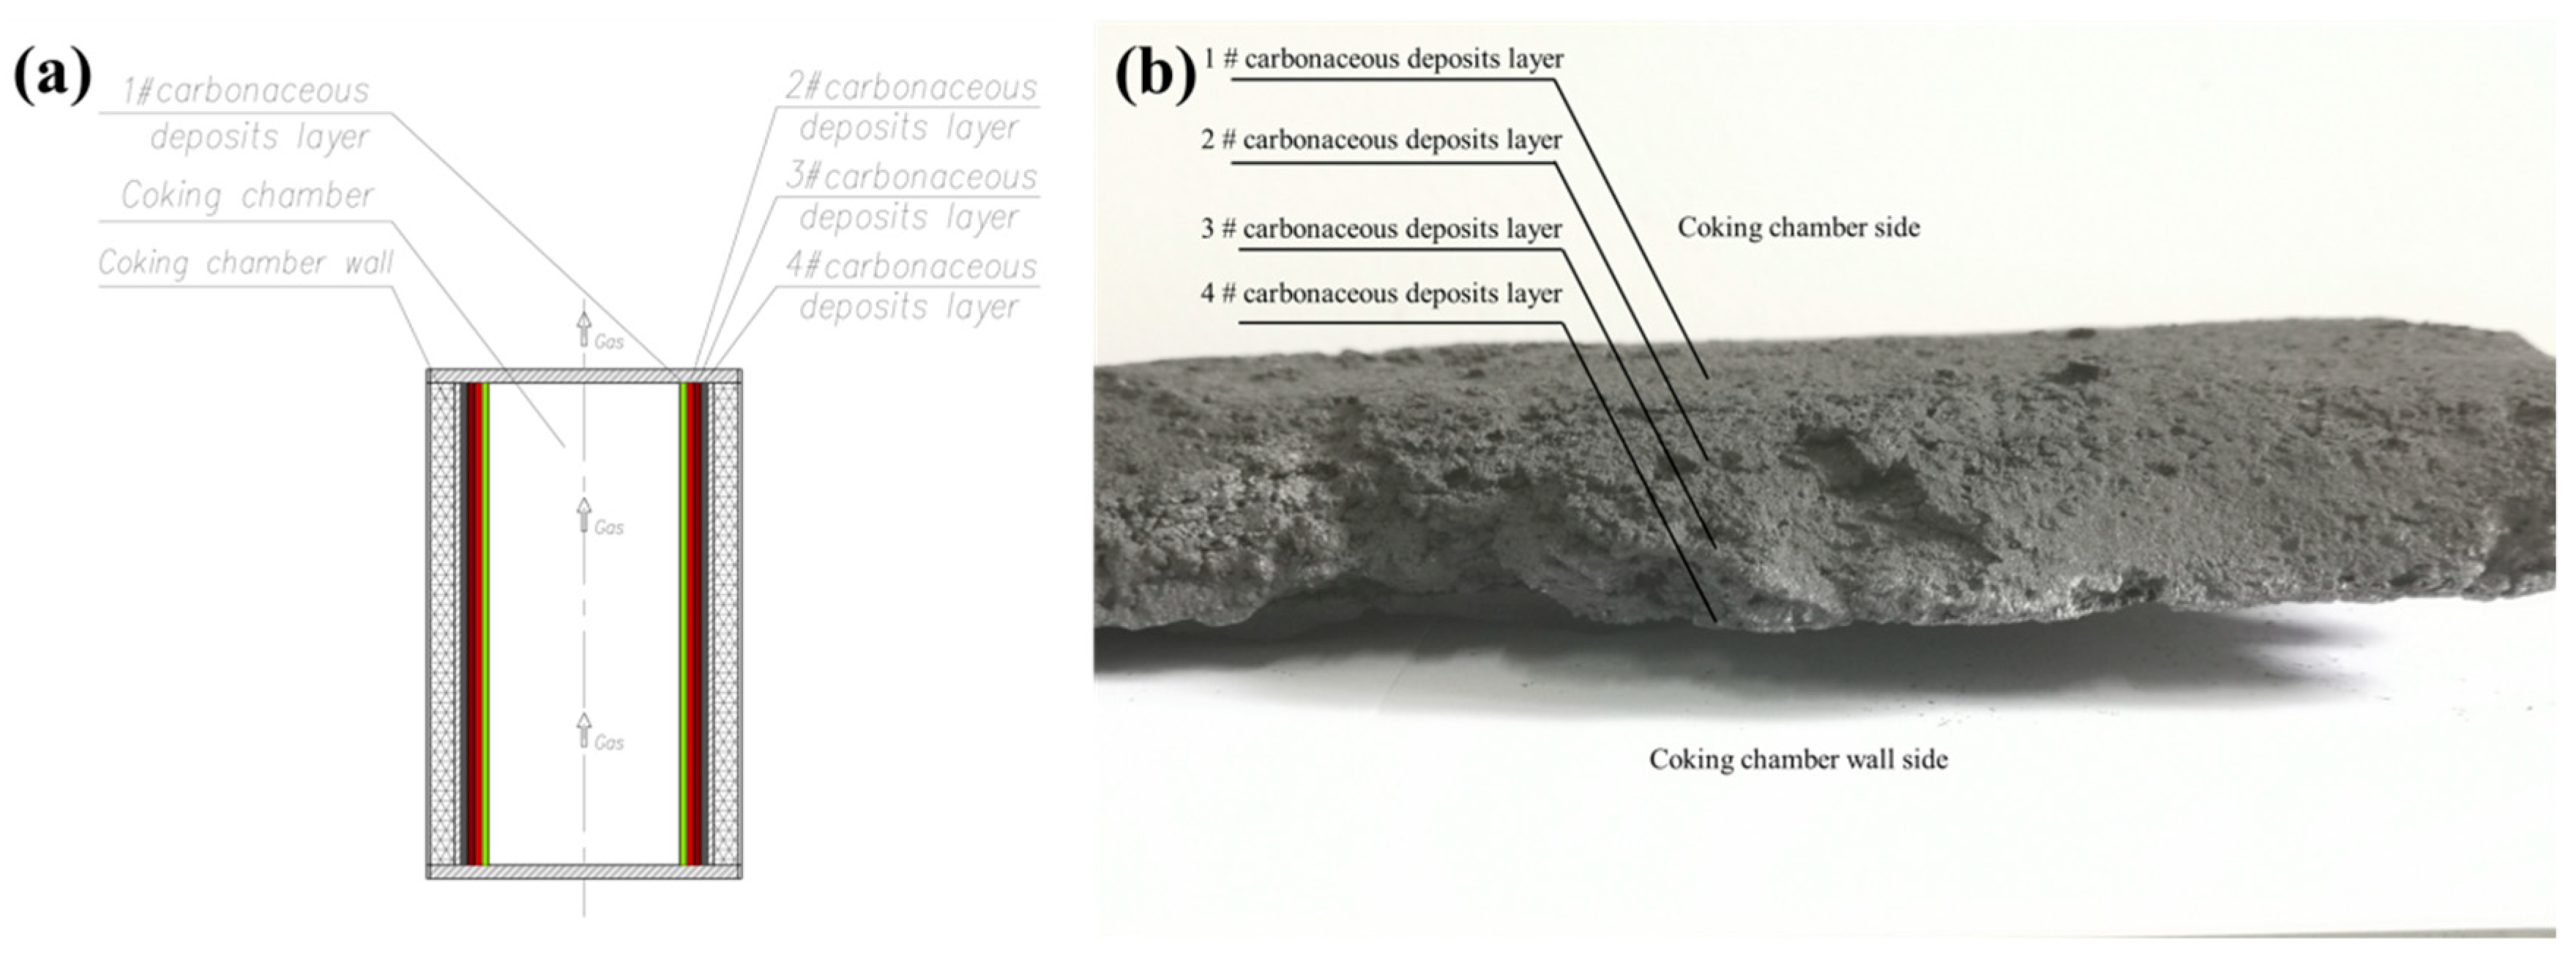
2.1. Sample Preparation

The carbonaceous deposit bulk was collected from the coking chamber of the No. 3 coking plant at the Ma’anshan Iron and Steel Co. Ltd. The coals used for coking were produced by the Huainan Mining Group. The bulk sample was obtained from the inner surface of the coking chamber, which had run for 16 months. As shown in Figure 1, the bulk carbonaceous deposit sample presented a length of 25–30 cm, a width of 10–15 cm, and a thickness of 3–4 cm. Small carbonaceous deposit samples with a length of 1 cm, a width of 1 cm, and a thickness of 0.3 cm were obtained from the bulk sample for further characterization, which were marked as #1, #2, #3, and #4. Figure 2 shows the position of the four carbonaceous deposit samples in the coking chamber and bulk sample, where sample #1 was close to the coking chamber and sample #4 was connected with the coking chamber wall.

2.2. Measurement and Characterization

Black carbonaceous deposit powders were obtained by the milled bulk sample in a planetary ball mill (XQM-4L, Kexi Laboratory Instrument Co Ltd., Nanjing, China) for 2 h at 300 rpm. X-ray fluorescence spectroscopy (XRF, ARL ADVANT’X Intellipower™ 3600, Thermo Scientific Nicolet, Waltham, MA, USA) was applied to investigate the elemental composition of the carbonaceous deposit powders with a working voltage of 60 kV, working current of 60 mA, and resolution of 0.01°.
Scanning electron microscopy (SEM, JSM-6490LV, JEOL Ltd., Tokyo, Japan) was applied to observe the morphology of small carbonaceous deposit samples with an accelerating voltage of 20 kV and resolution of 3 nm. Prior to observation, the sample surface was coated with a thin conductive layer.
The small carbonaceous deposit samples were ground into powders. Fourier-transformed infrared spectra spectroscopy (FTIR, Nicolet MAGNA-IR 750, Nicolet, Madison, WI, USA) was applied to characterize the powders of small carbonaceous deposit samples using a thin KBr disk. The transition mode was used and the wavenumber range was set from 4000 to 400 cm−1 with a resolution of 4 cm−1.
The powders of small carbonaceous deposit samples were investigated by Laser Raman spectroscopy (LRS, inVia, Renishaw, London, UK). The excitation wavelength was 514 nm with a wavenumber range set from 800 to 2000 cm−1 with a resolution of 1 cm−1.
The powders of small carbonaceous deposit samples were investigated by X-ray diffractometer (D8ADVANCE, Bruker, Karlsruhe, Germany) equipped with a Cu Kα tube and a Ni filter (λ = 0.154178 nm). The samples were scanned from 2θ = 10° to 80° with a step size of 0.02°.
X-ray photoelectron spectroscopy (XPS) with a VG Escalab Mark II spectrometer (Thermo-VG Scientific Ltd. Waltham, MA, USA) using Al Kα excitation radiation (hν = 1253.6 eV, resolution of 0.45 eV) was used to analyze the powders of small carbonaceous deposit samples.

3. Results and Discussion

3.1. Elemental Composition

Table 1 shows the XRF test results of the carbonaceous deposits on the surface of the coking chamber. It was found that the carbonaceous deposits mainly contained 34.51% of SO2, 30.54% of SiO2, 19.22% of Al2O3, and 5.6% of Fe2O3 (except the C element). Furthermore, small amounts of CaO, ZnO, MnO, and Cl with an abundance of 1.05–1.74% were detected in the carbonaceous deposits. All of the above data indicated that the carbonaceous deposits contained abundant S, Si, Al, Fe, and others, where S, Fe, Cr, and Al could significantly enhance the condensation reaction of polycyclic aromatic hydrocarbon compounds that result from the pyrolysis of coal, thus promoting the formation of carbonaceous deposits on the surface of the coking chamber.

3.2. Morphology

Scanning electron microscopy (SEM) was applied to investigate the morphology of different carbonaceous deposit layers on the surface of the coking chamber. Figure 3a presents sample #1 at low magnification, which presented a loose structure with many holes. Figure 3b shows sample #1 at high magnification, from which we found combined particles of 3–5 μm, which may have come from the condensation of polycyclic aromatic hydrocarbon in the coke-making process. Figure 3c shows sample #2 at low magnification, which presented a cluster structure. Figure 3d reveals that the cluster structure was composed of carbon particles with diameters of 0.5–2 μm. It was seen that the compactness of sample #2 was significantly enhanced when compared with #1. This may be due to the primary carbon particles possessing poor stability, which can split into smaller carbon particles. These carbon particles reacted with each other to form more compact carbonaceous deposit layers. Furthermore, there were obvious gaps between the clusters, which may be due to the carbon particles having many hydroxyls, carboxyls, and carbonyls on the surface. These groups reacted and released CO2 in the existence of metal ions (Fe, Al, Si) and high temperature. This phenomenon indicated that the primary carbon particles presented a metastable state, which can further split and combine with each other to form a compact carbonaceous deposit layer. Figure 3e,f display the morphology of sample #3, where the gap between the clusters disappeared, indicating the chemical reaction between the clusters at high temperature. Figure 3g,h displays the morphology of #4, which presented enhanced compactness compared with #3. The high magnification of sample #4 in Figure 3h showed a sponge structure with many holes, which may have resulted from the release of small molecules such as CO2 at high temperature.

3.3. X-ray Diffraction (XRD)

Figure 4 shows the XRD patterns of different carbonaceous deposit layers. A diffraction peak was found around 25.76° and 42.5°. The peaks at around 25.7° can be ascribed to (002), which was attributed to a hexagonal graphite structure. The peaks at around 42.5° corresponded to (100) peaks. As shown in Equations (1)–(4), the Bragg equation and Scherrer formula were introduced to calculate the structure parameter of different carbonaceous deposit layers [20,21,22,23]. In the equations, θ002 and θ100 are the diffraction angle of (002) and (100) peaks; β002 and β100 are the half-peak width of (002) and (100) peaks; d002 is the layer spacing; La is the diameter of the micro crystallite; Lc is the height of the layers; and N is the layer number of the aromatic structure. λ is the wavelength of the X-ray, and k1, k2 are the shape factors, where k1 = 1.84, k2 = 0.94 [24]. The calculated data are listed in Table 2.
d002 = λ/2sinθ002
La = k1λ/β100cosθ100
Lc = k2λ/β002cosθ002
N = Lc/d002 + 1
It can be seen from Table 2 that the #1, #2, #3, and #4 carbonaceous deposit layers presented d002 values from 0.3437 nm to 0.3482 nm, indicating little difference in the layer spacing between the different carbonaceous deposits. Additionally, sample #1 presented a La value of 30.81 nm, while #2 showed a decreased La value of 27.84 nm. This may be because the lamellar structure based on polycyclic aromatic compounds was not stable. Part of the lamellar was linked by chemical bonds such as ethers, esters, and aliphatics, which were destroyed at high temperature. We also found that samples #3 and #4 presented increased La values of 35.18 nm and 36.47 nm, respectively. This may have resulted from the edges of the lamellar structure reacting with each other at high temperature. Samples #1, #2, #3, and #4 presented Lc values of 9.97 nm, 9.85 nm, 8.93 nm, and 8.82 nm, respectively, indicating a decrease in the packing height of the lamellar structure from #1 to #4. This can be explained by the exfoliation of the out layered graphite lamellar by strong thermal radiation, which was consistent with the change in the N value.

3.4. Fourier Transform Infrared Spectrometer (FTIR)

The FTIR spectra of samples #1, #2, #3, and #4 are shown in Figure 5. As seen in the FTIR spectrum, the peak at the range of 3200–3700 cm−1 can be ascribed to the stretching vibration of –OH and –NH. The peak at 1631 cm−1 was assigned to the C=O stretching vibration and the absorption peak at 1086 cm−1 was assigned to the stretching vibration of the C–O band. The peaks at 671 cm−1 corresponded to the bending vibration of C–H in the benzene ring structures [21]. The peak at 471 cm−1 confirmed the existence of the Fe–O and Al–O band [25]. The FTIR test confirmed the existence of –COOH, –NH, and –OH structure in the carbonaceous deposit layers. It was also found that the peaks at 3433 cm−1 in #2 and #3 were stronger than that in #1, while #4 displayed weaker absorption at 3433 cm−1. This may be because there are few O2 and H2O entrained with polycyclic aromatic hydrocarbons to form carbonaceous deposit layers in the coke-making process. O2 and H2O could oxidize the carbonaceous deposits and form –COOH and –OH structures at high temperature and in the existence of metal ions (Fe, Al, etc.). However, the formed –COOH and –OH structures were not stable, and were eliminated from the carbon particle. Similar phenomena also existed at the characteristic peaks at 1631 cm−1 and 1086 cm−1, indicating the coexistence of the formation and elimination reaction of –COOH and –OH groups during the coke-making process. In this process, the high temperature in the coking chamber promoted the oxidation reaction, and also enhanced the elimination of –COOH and –OH groups, which will consume the absorbed O2 and H2O, thus promoting the formation of a compact carbonaceous deposit layer.

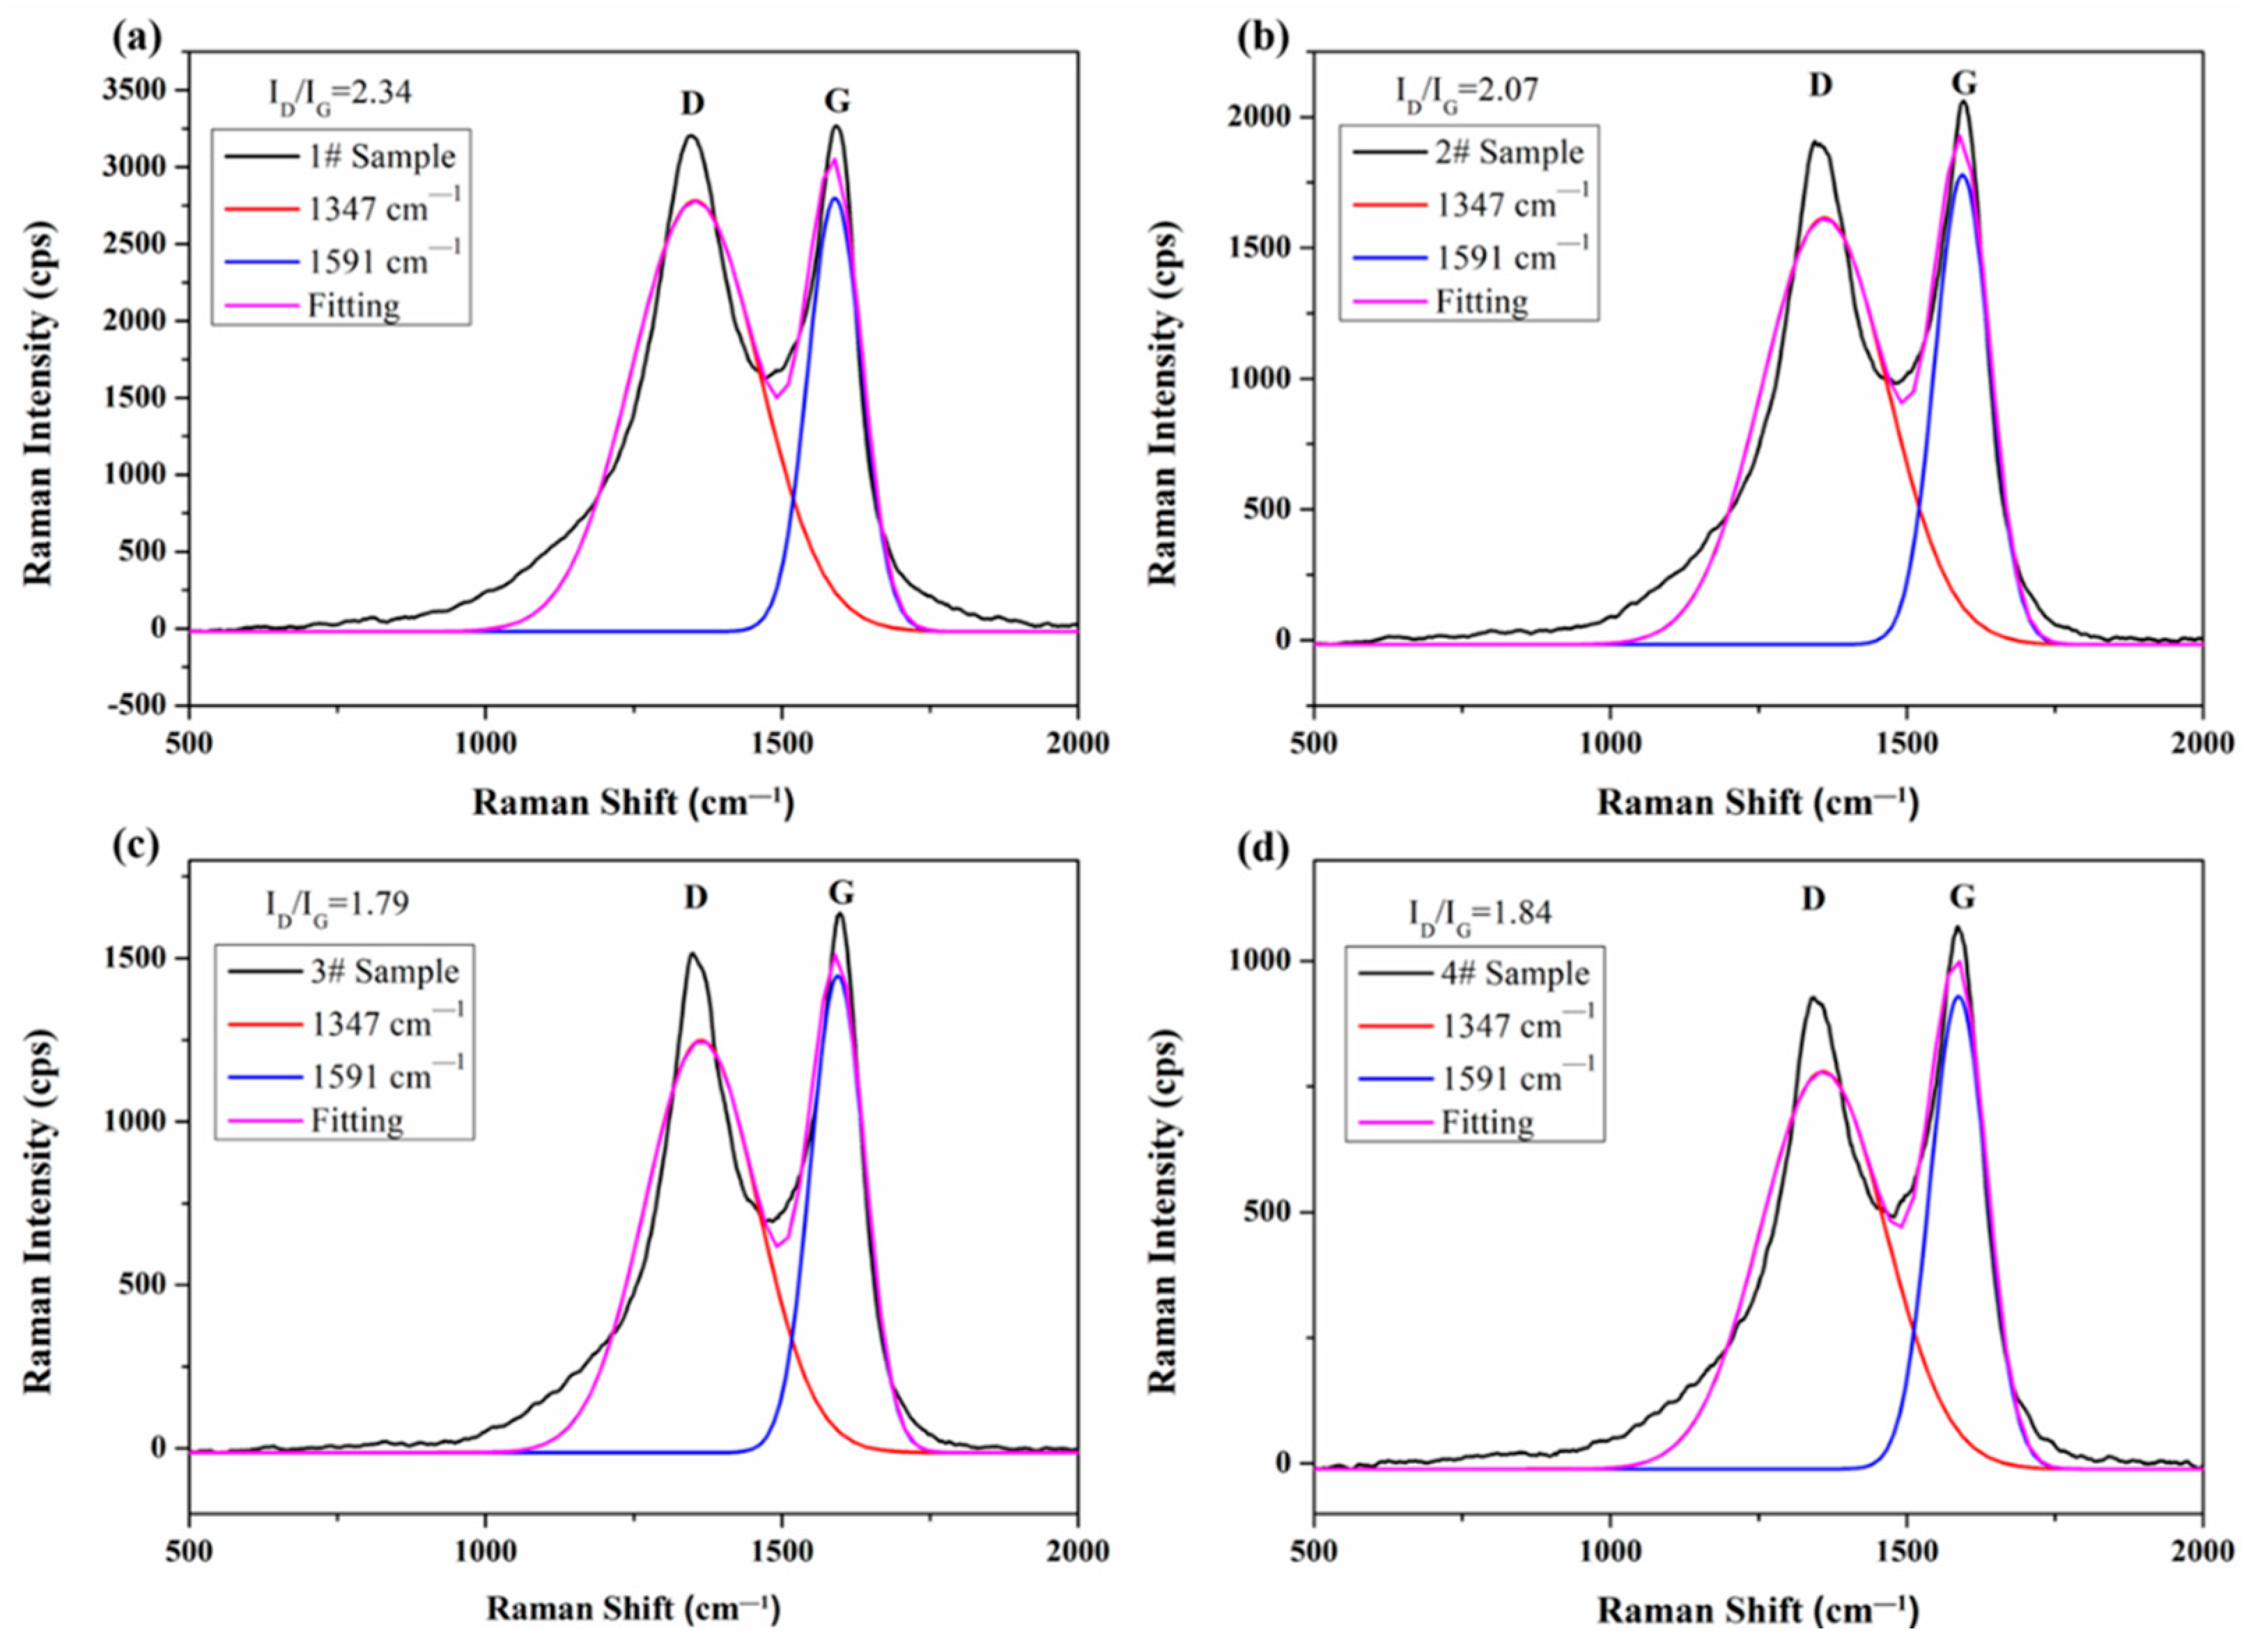
3.5. Raman Spectroscopy

Figure 6 shows the Raman spectra of samples #1#, #2, #3, and #4. As shown in Figure 6, the Raman spectra of the different carbonaceous deposit layers exhibited the G band at 1591 cm−1 and the D band at 1347 cm−1 [26]. The G band corresponded to the E2g mode of graphite related to the vibration of the sp2-bonded carbon atoms in two-dimensional carbon materials, while the D band related to the defects and disorder in the hexagonal graphitic layers. The result confirmed that the carbonaceous deposits contained crystalline carbon and amorphous carbon.
Furthermore, Raman spectroscopy was used to analyze the graphitization degree of the carbonaceous material by integrating the intensity ratio of the D to G bands (ID/IG). A lower ratio of ID/IG indicates a higher graphitization degree [27]. As shown in Figure 7, the ID/IG values followed the sequence of #1 (2.34) > #2 (2.07) > #3 (1.79) ≈ #4 (1.84), indicating that the high temperature improved the graphitization degree of the carbonaceous deposits.

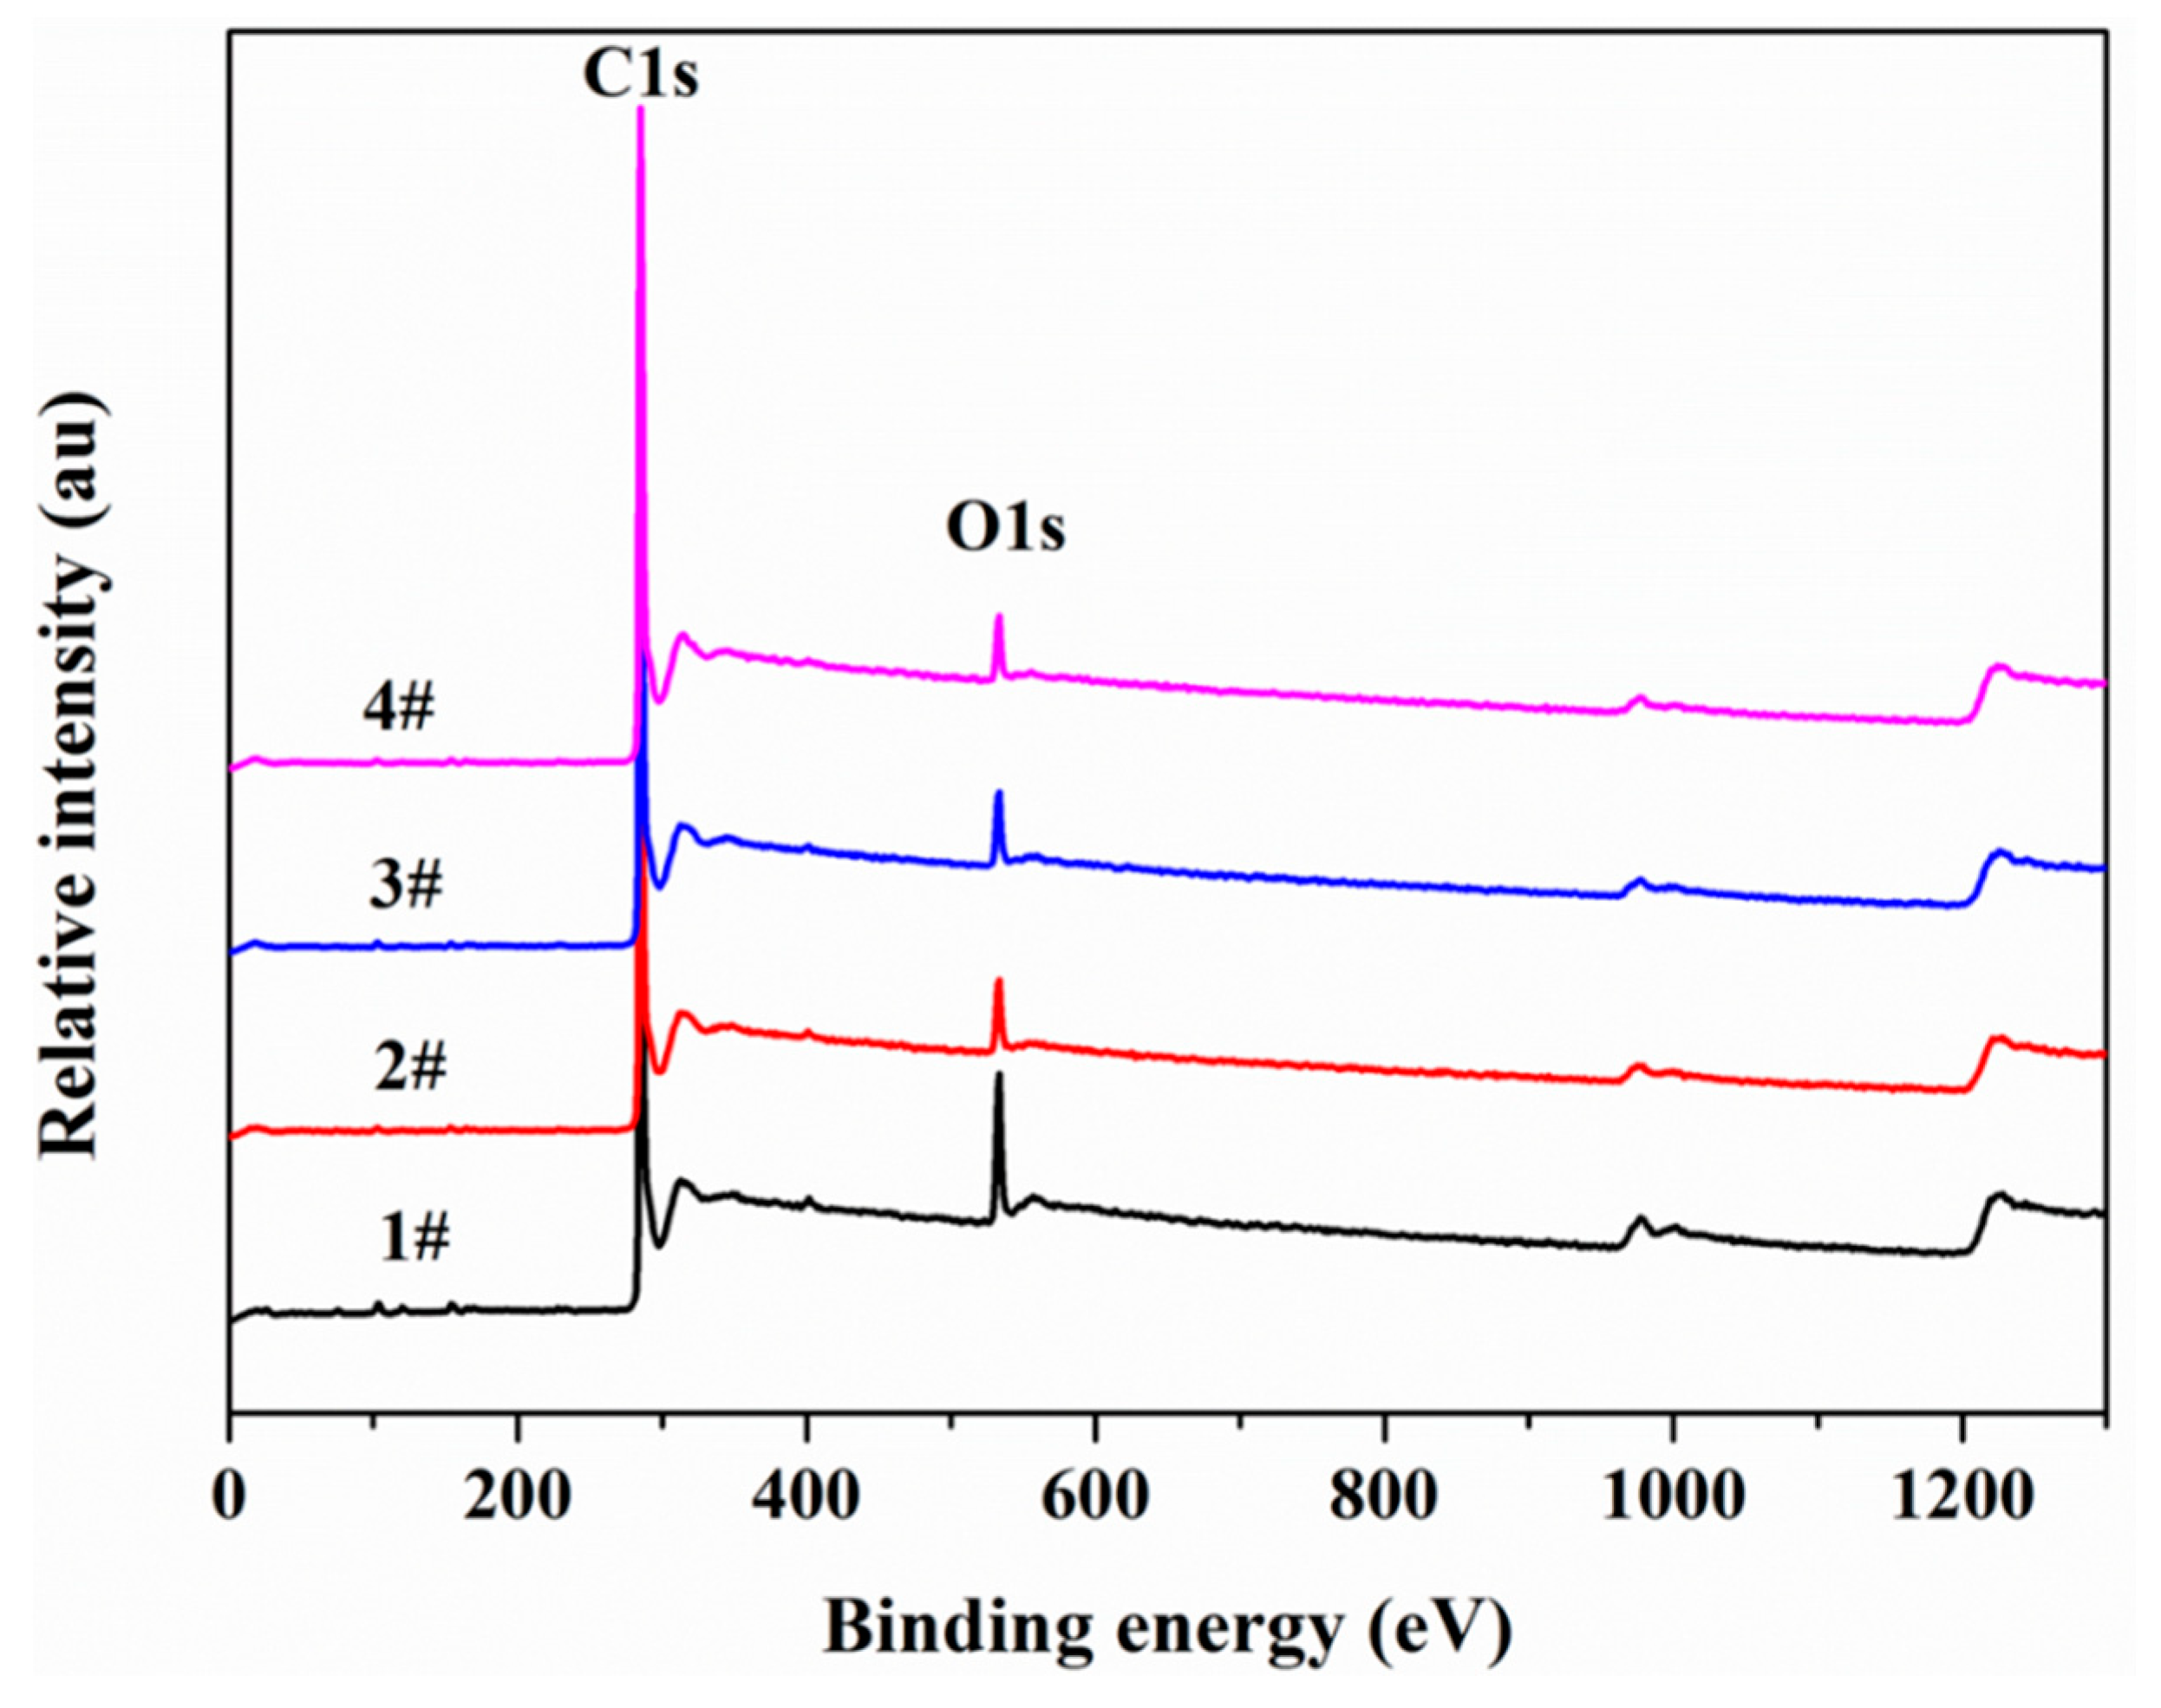
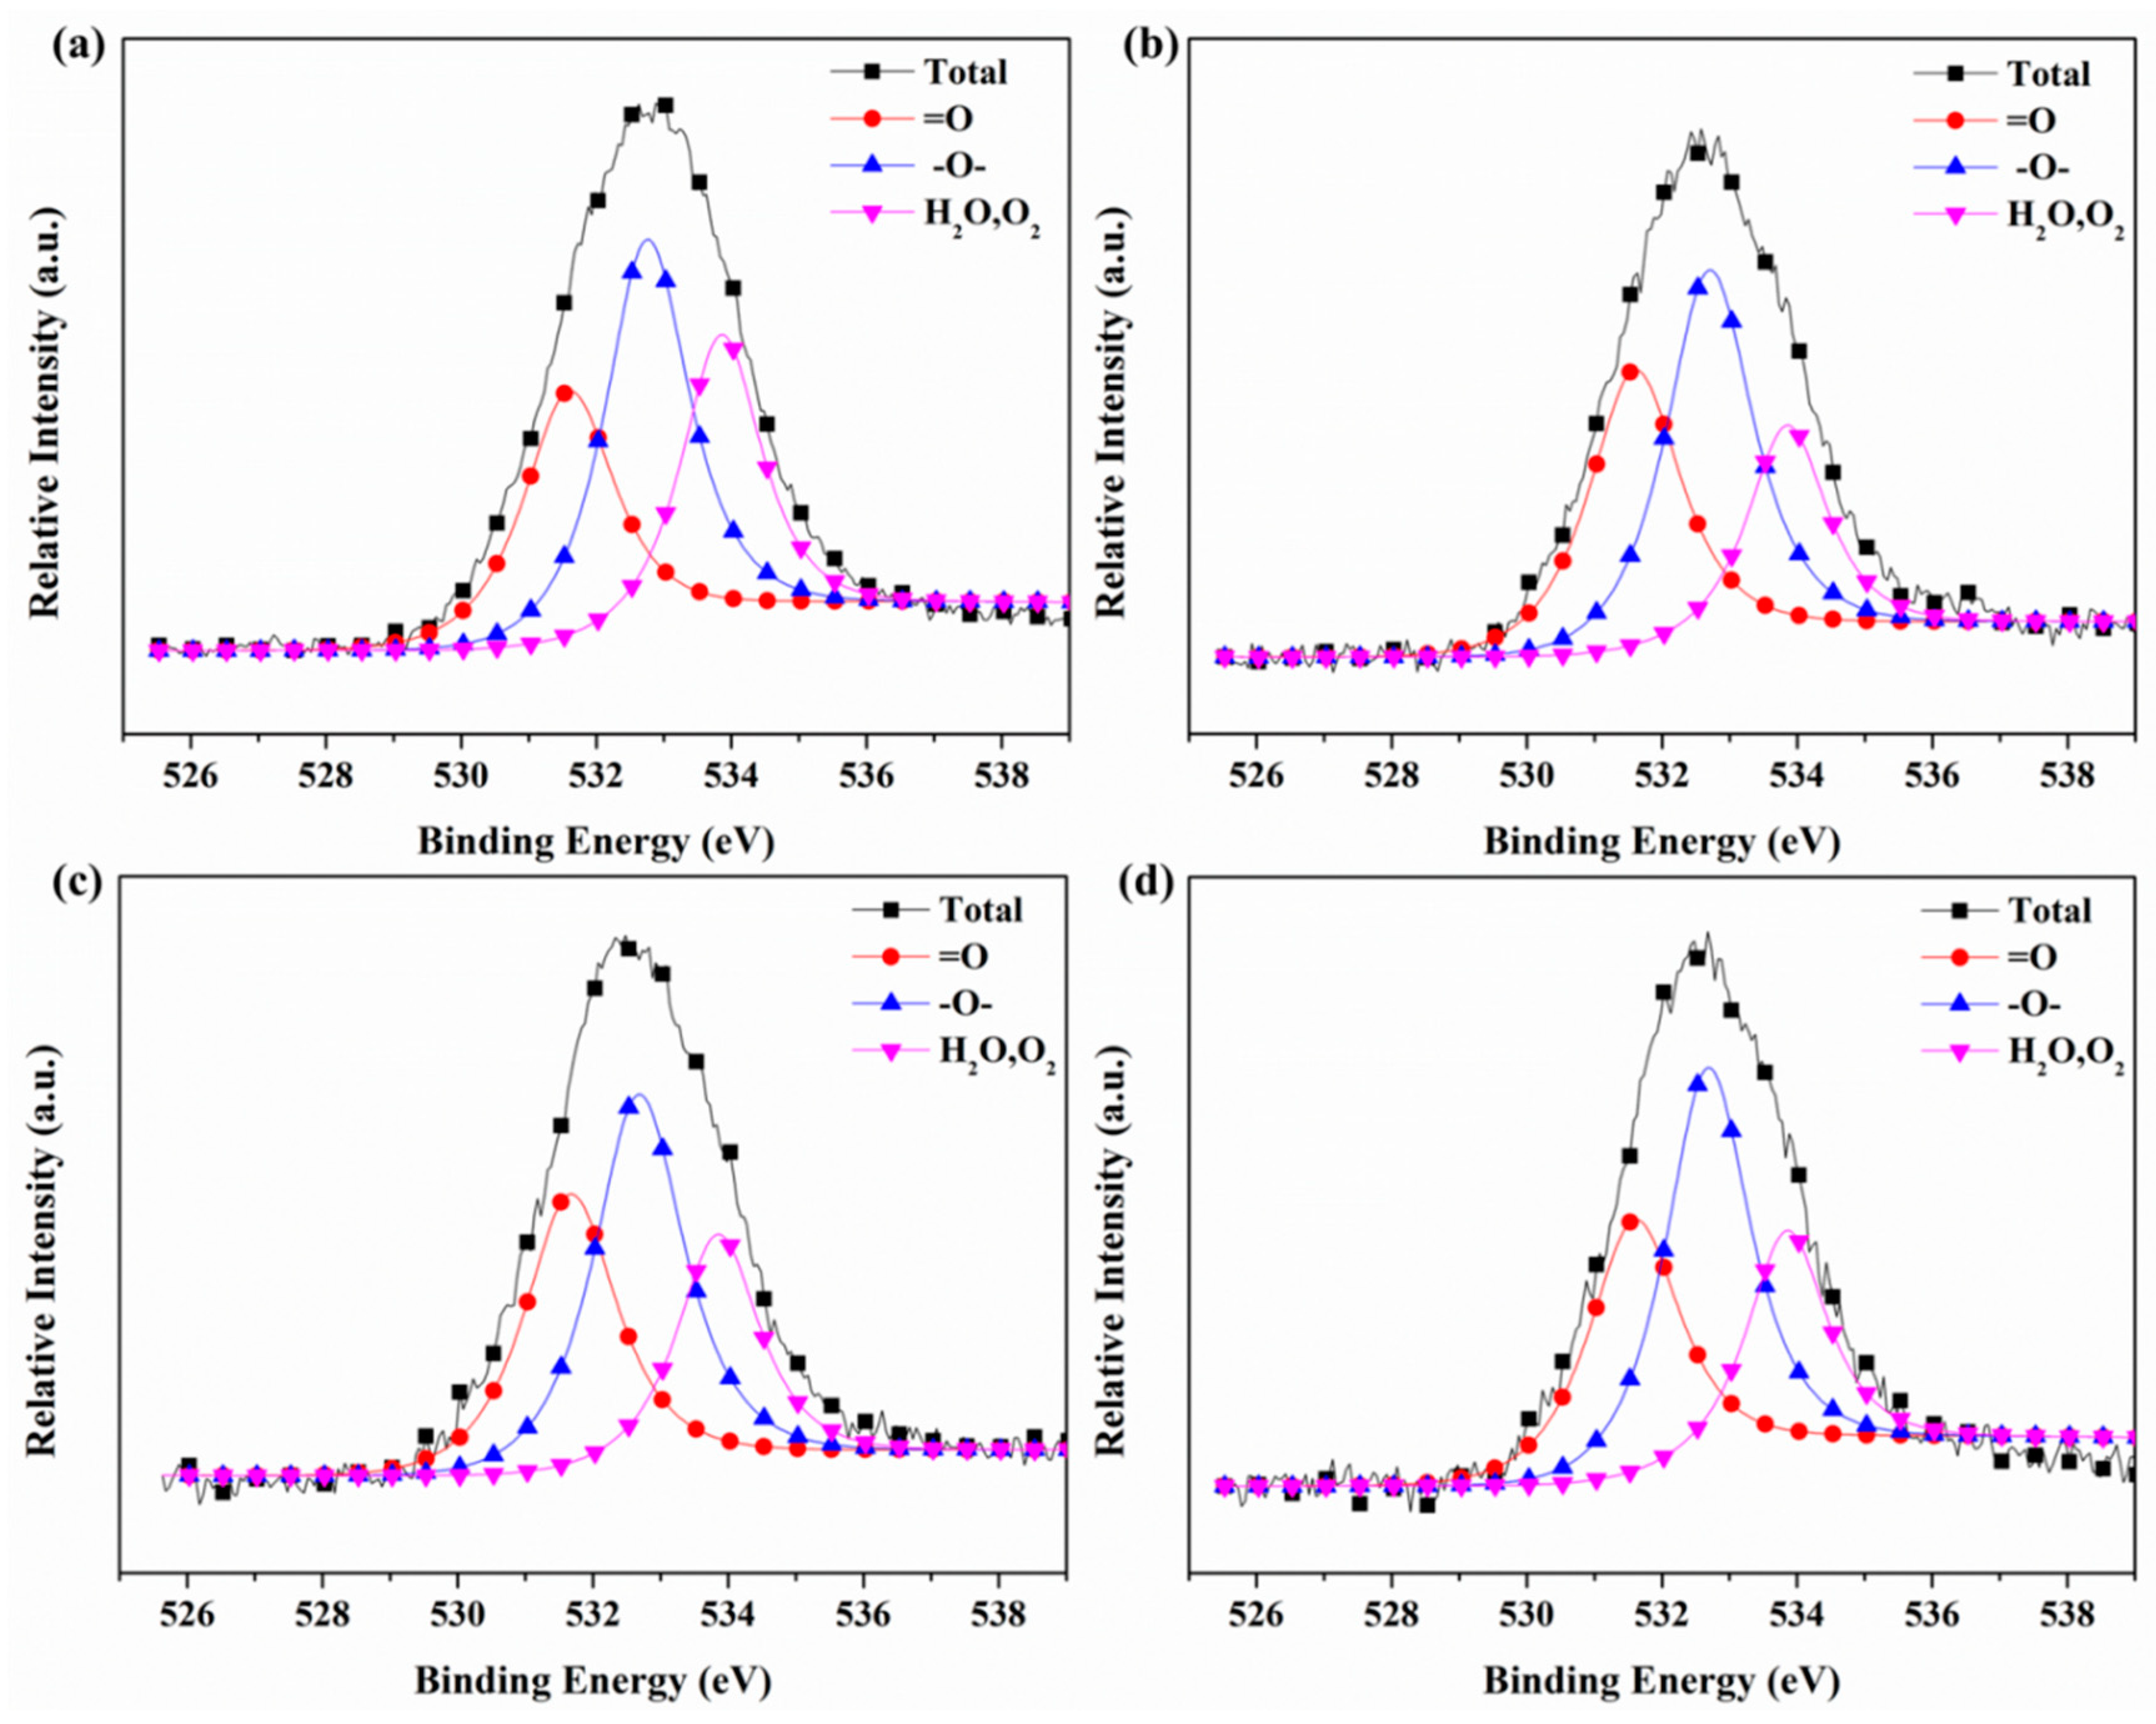
3.6. X-ray Photoelectron Spectroscopy (XPS)

The chemical components of different carbonaceous deposit layers were also investigated by XPS, and the corresponding spectra are shown in Figure 8. The strong peak at around 284 eV was the characteristic peak of C1s, while the peaks at about 532 eV can be ascribed to the characteristic peak of O1s [28]. Furthermore, spots of N, Al, Si, Ca, Fe, S, and P were detected from #1 to #4. The C, O, S, and P may have come from the polycyclic aromatic hydrocarbons compounds, and Al, Si, Fe, and Ca resulted from the ore composition in coal. The above metal ions can take part in the formation of carbonaceous deposits in the form of dust particles. The test results were consistent with the XRF test.
Furthermore, the quantitative content of the above elements were conducted, which are listed in Table 3. It was found that Al, Si, Ca, Fe, S, P, etc., presented small fluctuations in samples #1, #2, #3, and #4. However, C, O, and N showed significant change from #1 to #4. The four carbonaceous deposit layers presented enhanced C elemental content of 82.41%, 89.43%, 89.69%, and 91.51% from #1 to #4, respectively. At the same time, the O element showed a decreased content of 10.91%, 6.20%, 6.32%, and 5.14%, respectively. Furthermore, the N element displayed a similar change law with a 2.20% content of #1, 1.49% content of #2, 1.17% content of #3, and a 0.76% content of #4. The C/O ratio and C/N ratio were also introduced to research change in the four carbonaceous deposit layers. It was found that samples #1–4 presented increased C/O of 7.55, 14.42, 14.19, and 17.80 with increased C/N of 37.46, 60.02, 76.66, and 120.39, respectively, indicating the O and N element release process in the formation of carbonaceous deposit layers in the coking chamber. This may be explained by many of the structures of the phenols, alcohols, ethers, and amines not being stable enough, and were eliminated at high temperature and the metal ions. The elimination of N containing and O containing groups can increase the C/O and C/N values in the carbonaceous deposits, and significantly enhance the compactness of the carbonaceous deposit layer.
To further investigate the existing state and change law of C and O elements in the carbonaceous deposit layers, the peaks were resolved using peak analysis software (XPSPEAK4.1, kindly provided by Raymund W.M. Kwok, Department of Chemistry, the Chinese University of Hong Kong, Hong Kong, China). Figure 9 presents the peak separation fitting results of C1s for different carbonaceous deposits in the coking chamber. The peaks at 284.7 eV could be attributed to the C–C/C–H bond in aliphatic and aromatic species, which mainly resulted from a graphite carbon structure. The band at around 285.5 eV was assigned to the C–O/C–N bond in the structural formation of phenols, alcohols, ethers, and amines. The peaks at 287.4 eV were ascribed to the C=O/C=N bond in the formation of carbonyl, quinonyl, carboxylate, ester, and heterocyclic aromatic structures [28,29]. Table 4 lists the bond state content of the C element. It can be seen that #1 presented C–C/C–H, C–O/C–N, C=O/C=N contents of 69.73%, 21.68%, and 8.60%, respectively. In the carbonaceous deposit layer of #2, the content of C–C/C–H decreased to 64.59%, and the content of C–O/C–N and C=O/C=N were increased to 25.87% and 9.54%, respectively. This may be because the absorbed O2 and H2O in the primary carbonaceous deposits can oxidize the carbon skeletons to form C–O/C–N and C=O/C=N structures as well as decrease the C–C/C–H content. The carbonaceous deposit layer in sample #3 presented the three structure content of 66.60%, 24.51%, and 8.89%, while the carbonaceous deposit layer of sample #4 showed contents of 69.46%, 21.67%, and 8.87%, respectively. This may be due to the limited amount of absorbed O2 and H2O, which was consumed in the oxidation process. Furthermore, the formed C–O/C–N and C=O/C=N structures showed poor stability, which were eliminated at high temperature, resulting in the increase of C–O/C–N and C=O/C=N structures and enhanced C–C/C–H content in the carbonaceous deposits.
Figure 10 shows the separate fitting results of O1s for different carbonaceous deposit layers in the coking chamber. The peak at 531.6 eV was assigned to the =O structure of carbonyl, quinonyl, carboxylate, and esters in the carbonaceous deposits. The bond at around 532.8 eV was ascribed to the –O– structure in the form of alcohols, phenols, and ethers in the carbonaceous deposits. The peaks at 533.8 eV can be assigned to the absorbed O2 and H2O in the carbonaceous deposits [30,31]. Table 5 lists the bond state content of the O element. As shown in Table 5, #1 presented =O, –O–, and O2/H2O contents of 30.10%, 42.10%, and 27.80%, respectively. In Sample #2, the =O and –O– contents increased to 35.16% and 43.39%, while the O2/H2O content decreased to 21.44%. This may be due to the consumption of the absorbed O2 and H2O in the primary carbonaceous deposit to form the =O and –O– structure, thus increasing the content of the =O and –O– structure in the carbonaceous deposits. Sample #3 presents the three bonding states of 33.48%, 43.19%, and 23.33%, while #4 showed the three bonding states of 32.43%, 44.89%, and 22.68%. It was found that the –O– content was almost invariant when compared with the increase in the O2/H2O content and decrease of the =O content in #3 and #4. This may be because the =O structure products such as carboxylate and esters presented weaker stability when compared with typical –O– structure products, which were eliminated to release H2O, thus resulting in the decrease in the =O structure content and increase of the O2/H2O structure. The above results confirmed the coexistence of the oxidation and elimination process in the formation of carbonaceous deposits, which resulted in the change of contents for the O2/H2O, –O–, and =O structures.

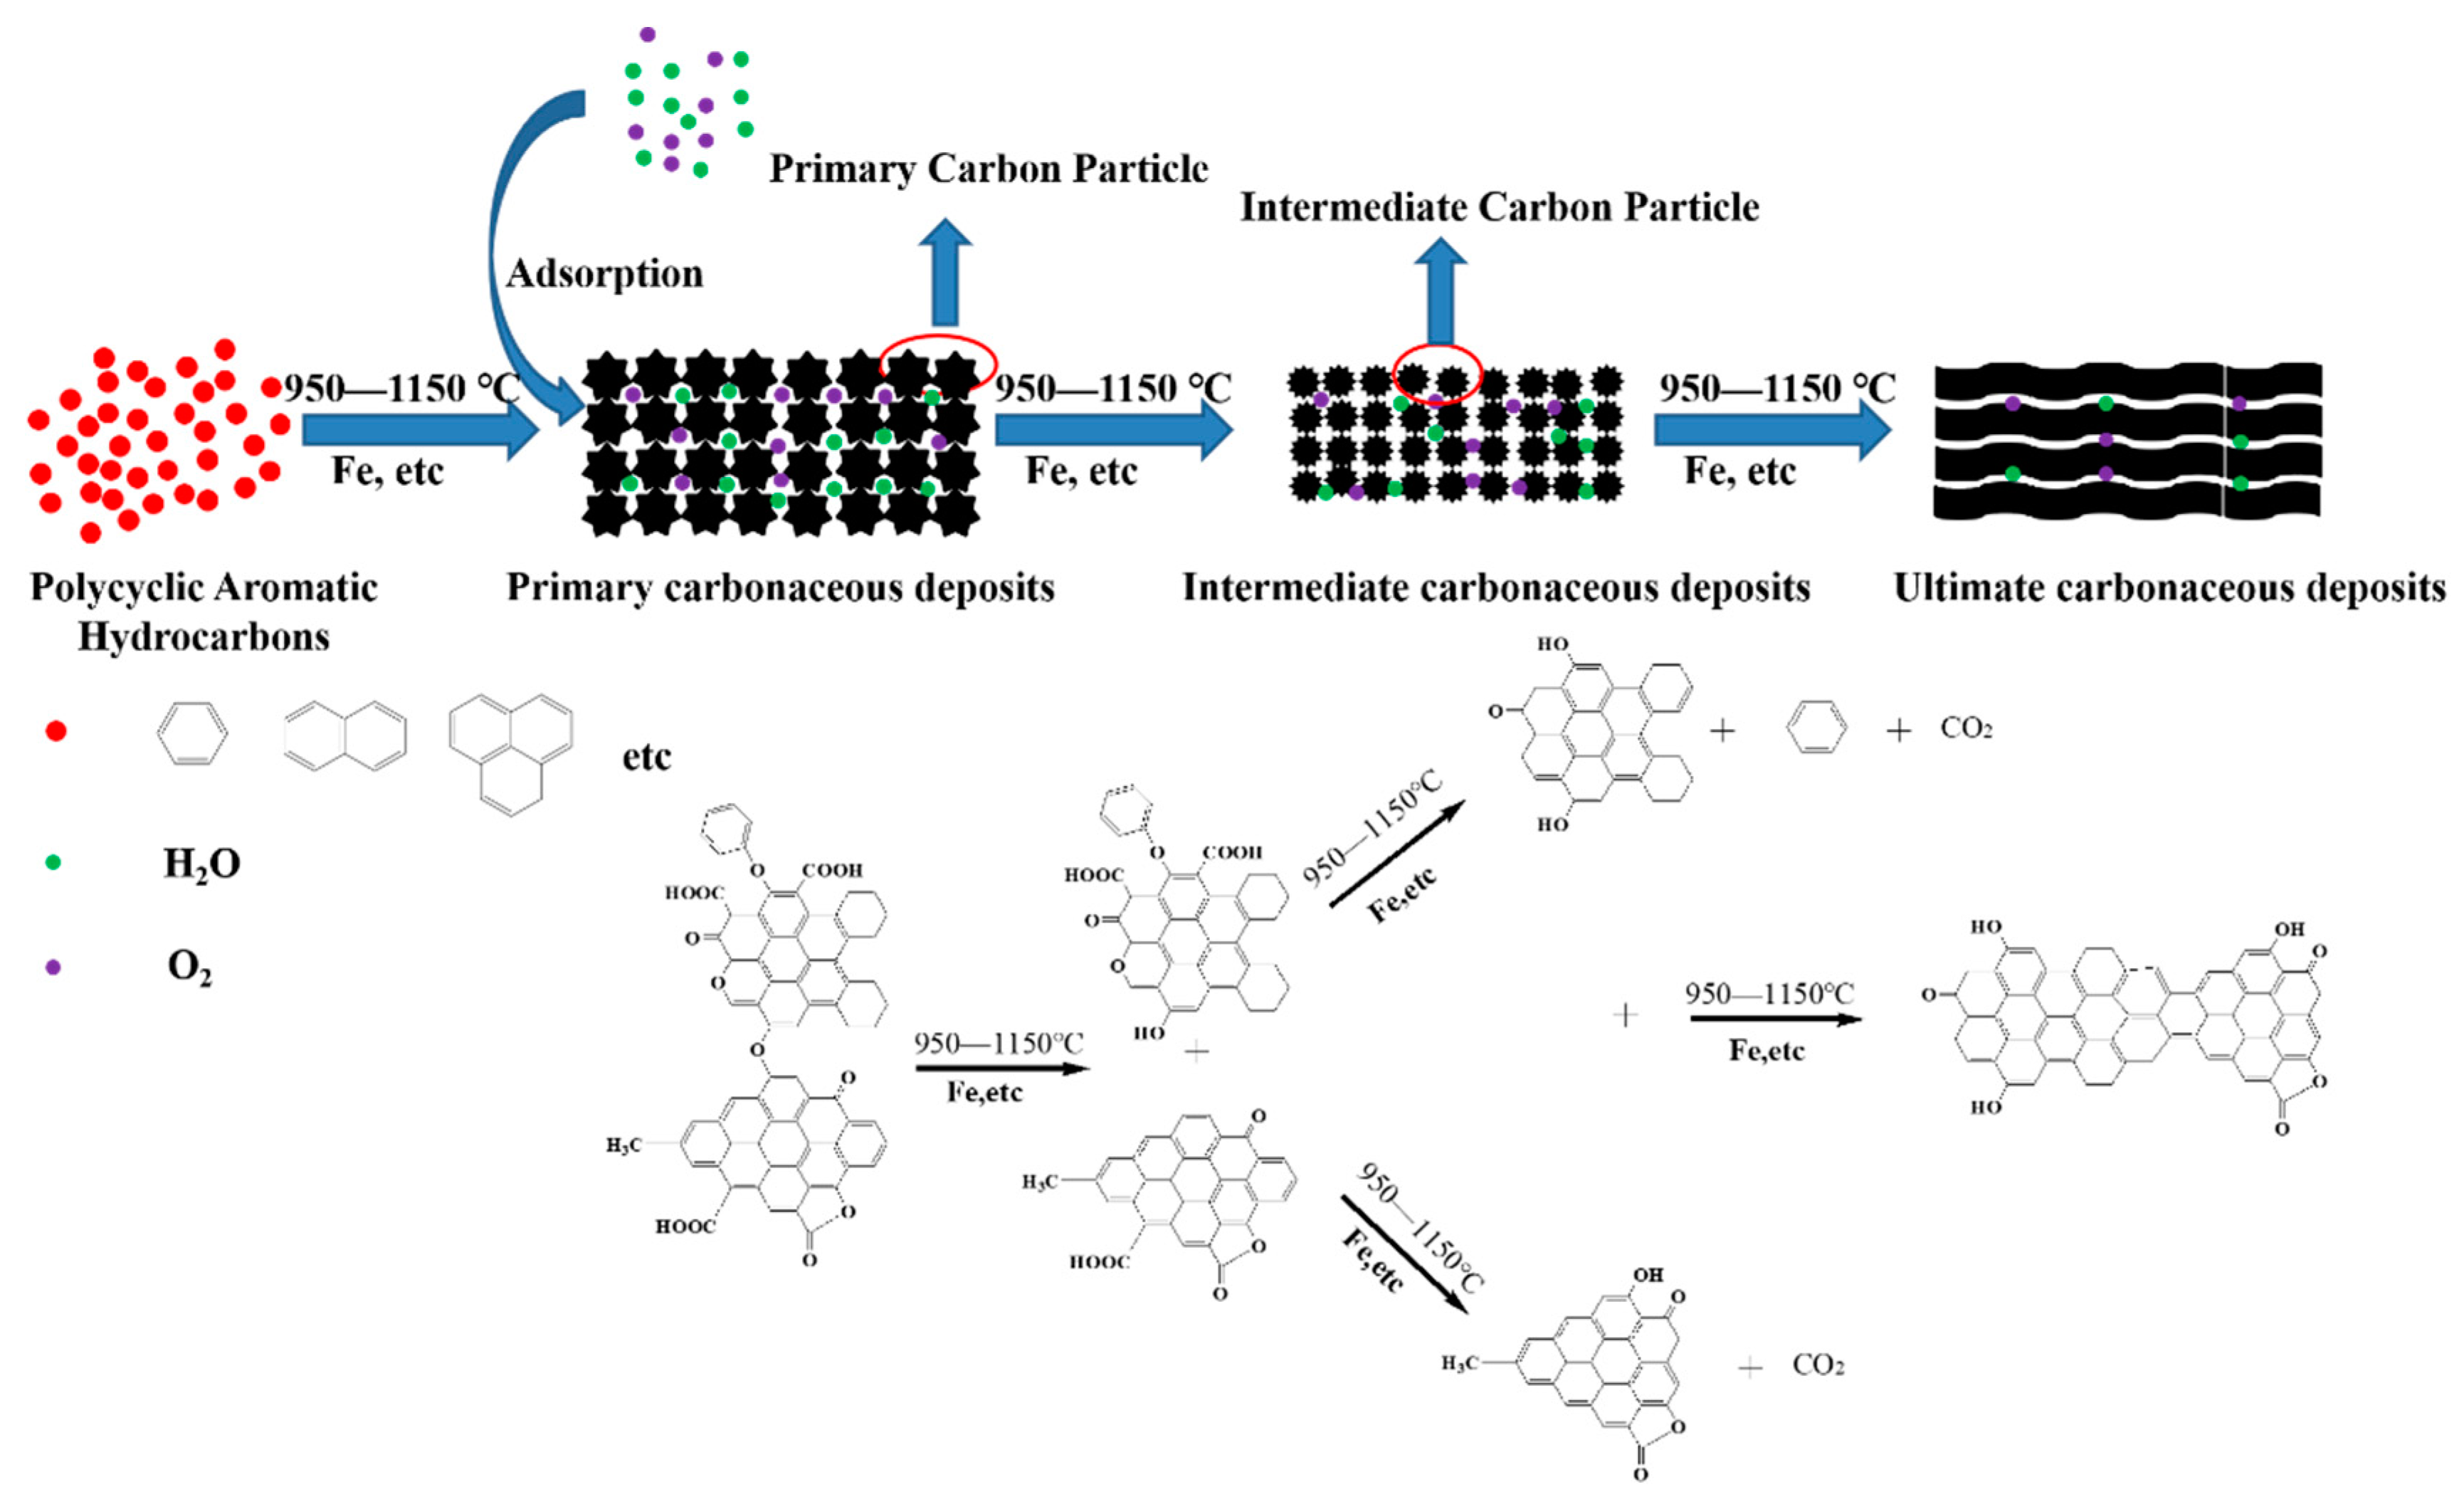
3.7. Mechanism Consideration

On the basis of the above results, the possible formation and evolution mechanism of the carbonaceous deposits on the surface of the coking chamber are presented in Figure 11. In the coke-making process, many polycyclic aromatic hydrocarbon (such as anthracene and naphthalene) molecules associate with each other to form primary carbon particles with diameter of 3–5 μm. The primary carbon particles absorb O2 and H2O molecules combined with dust particles (containing metal ions) to form loose primary carbonaceous deposits. The primary carbon particle was not stable, and split into smaller pieces of intermediate carbon particles with diameters of 0.5–2 μm. The intermediate carbon particles reacted with each other to form a cluster structure with a diameter of 5–20 μm. The cluster structure further reacted to form compact intermediate carbonaceous deposits. There were many carboxyl, hydroxyl, and carbonyl groups on the surface of the primary and intermediate carbon particles, which can be eliminated from the particles at high temperatures and metal ions to finally form terminal carbonaceous deposits with a more compact structure at high temperature.
In the formation of carbonaceous deposits, the absorbed O2 and H2O can oxidize carbon skeletons to form –O– (such as alcohol, phenol, and ether) and =O (such as carbonyl, carboxyl, and esters) structures, resulting in the change of the bonding state of the O element. At the same time, the =O containing structure and –O– containing structure in the carbonaceous deposits conduct an elimination reaction in the condition of high temperature and metal ions. The oxidation and elimination reaction resulted in the change of the bonding state of the O element, and formed compact carbonaceous deposits on the surface of the coking chamber.

4. Conclusions

In this work, carbonaceous deposits on the surface of the coking chamber were investigated by scanning electron microscopy (SEM), X-ray fluorescence spectroscopy (XRF), Fourier transform infrared spectrometry (FTIR), Raman spectroscopy, X-ray diffraction spectroscopy (XRD), and X-ray photoelectron spectroscopy (XPS). FTIR revealed the existence of carboxyl, hydroxyl, and carbonyl groups in the carbonaceous deposits. Raman spectroscopy confirmed the decreased ID/IG values from the #1 carbonaceous deposit layer to the #4 carbonaceous deposit layer, indicating an enhancement in the graphitization degree of the carbonaceous deposits. SEM showed that the carbonaceous deposits resulted from polycyclic aromatic hydrocarbons, which can react to form unstable primary carbon particles with diameters of 3–5 μm. The primary carbon particles can split into intermediate carbon particles with diameters of 0.5–2 μm. The intermediate carbon particles can further react to form compact secondary carbonaceous deposits and finally form compact terminal carbonaceous deposits. XRF revealed that the carbonaceous deposits mainly contained C, O, and N elements, with a spot of Al, Si, and Ca elements. It was found from the XPS that the C content gradually increased while O and N content gradually decreased in the formation of carbonaceous deposits. The peak fitting of the XPS results revealed that absorbed O2 and H2O took part in the oxidation process of the carbon skeleton to form =O and –O– structures. The oxidation and elimination reaction resulted in the change in the bonding state of the O element, and formed compact carbonaceous deposits on the surface of the coking chamber. Based on the analysis, the formation and evolution mechanism of carbonaceous deposits were discussed, which provides a theoretical basis for inhibiting the formation of carbonaceous deposits on the surface of the coking oven chamber and a significantly enhanced stable operation of a coke oven.

Author Contributions

Conceptualization, H.W. and B.J.; Methodology, H.W. and B.J.; Software, G.T.; Validation, H.W., B.J., X.W., and G.T.; Formal analysis, B.J.; Investigation, H.W. and G.T.; Resources, H.W.; Data curation, H.W. and G.T.; Writing—original draft preparation, H.W. and G.T.; Writing—review and editing, H.W. and G.T.; Visualization, G.T.; Supervision, H.W.; Project administration, H.W.; Funding acquisition, H.W., B.J., and X.W.

Funding

This work was financially supported by the National Natural Science Foundation of China (51806035, 51676038), the Natural Science Foundation of Jiangsu Province (BK20170669), and the Key Research and Development Projects of Anhui Province (1804a0802195).

Conflicts of Interest

The authors declare no conflicts of interest.

References

  1. Li, J.; Zhou, Y.; Simayi, M.; Deng, Y.Y.; Xie, S.D. Spatial-temporal variations and reduction potentials of volatile organic compound emissions from the coking industry in China. J. Clean. Prod. 2019, 214, 224–235. [Google Scholar] [CrossRef]
  2. Bai, X.F.; Ding, H.; Lian, J.J.; Ma, D.; Yang, X.Y.; Sun, N.X.; Xue, W.L.; Chang, Y.J. Coal production in China: Past, present, and future projections. Int. Geol. Rev. 2017, 60, 535–547. [Google Scholar] [CrossRef]
  3. Li, J.Y.; Ma, X.X.; Liu, H.; Zhang, X.Y. Life cycle assessment and economic analysis of methanol production from coke oven gas compared with coal and natural gas routes. J. Clean. Prod. 2018, 185, 299–308. [Google Scholar] [CrossRef]
  4. Terui, K.; Matsui, T.; Fukada, K.; Dohi, Y. Influence of Temperature Distribution in Combustion Chamber on Coke Cake Discharging Behavior. ISIJ Int. 2018, 58, 633–641. [Google Scholar] [CrossRef] [Green Version]
  5. Sobolewski, A.; Fitko, H. Individual regulation system of raw gas pressure in coke oven chambers. Przem. Chem. 2014, 93, 2115–2120. [Google Scholar]
  6. Zhang, R.D.; Gao, F.R. Multivariable decoupling predictive functional control with non-zero-pole cancellation and state weighting: Application on chamber pressure in a coke furnace. Chem. Eng. Sci. 2013, 94, 30–43. [Google Scholar] [CrossRef]
  7. Deng, J.; Zhao, J.Y.; Xiao, Y.; Zhang, Y.N.; Huang, A.C.; Shu, C.M. Thermal analysis of the pyrolysis and oxidation behaviour of 1/3 coking coal. J. Therm. Anal. Calorim. 2017, 129, 1779–1786. [Google Scholar] [CrossRef]
  8. Wu, Y.; Li, Y.; Jin, L.; Hu, H. Integrated process of coal pyrolysis with steam reforming of ethane for improving tar yield. Energy Fuels 2018, 32, 12268–12276. [Google Scholar] [CrossRef]
  9. Pretorius, G.N.; Bunt, J.R.; Gräbner, M.; Neomagus, H.; Waanders, F.B.; Everson, R.C.; Strydom, C.A. Evaluation and prediction of slow pyrolysis products derived from coals of different rank. J. Anal. Appl. Pyrolysis 2017, 128, 156–167. [Google Scholar] [CrossRef]
  10. Fidalgo, B.; van Niekerk, D.; Millan, M. The effect of syngas on tar quality and quantity in pyrolysis of a typical South African inertinite-rich coal. Fuel 2014, 134, 90–96. [Google Scholar] [CrossRef]
  11. Chen, X.; Zheng, D.; Guo, J.; Liu, J.; Ji, P. Energy analysis for low-rank coal based process system to co-produce semicoke, syngas and light oil. Energy 2013, 52, 279–288. [Google Scholar] [CrossRef]
  12. Marcin, S.; Ludwik, K. Evaluation of the energy consumption in coal coking by using a method for reconcilation of substance and energy balances. Przem. Chem. 2014, 93, 681–685. [Google Scholar]
  13. Uebo, K.; Kunimasa, H.; Suyama, S. Carbon deposition in a coke oven chamber at high productivity operation. Tetsu Hagane 2004, 90, 721–727. [Google Scholar] [CrossRef]
  14. Furusawa, A.; Nakagawa, T.; Maeno, Y.; Komaki, I. Influence of coal moisture control on carbon deposition in the coke oven chamber. ISIJ Int. 1998, 38, 1320–1325. [Google Scholar] [CrossRef]
  15. Dumay, D.; Gaillet, J.P.; Krebs, V.; Furdin, G.; Mareché, J.F. Formation and reduction of carbon deposits in coke ovens. Rev. Metall. Cah. Inf. Tech. 1994, 91, 1109–1116. [Google Scholar]
  16. Krebs, V.; Furdin, G.; Mareché, J.; Dumay, D. Effects of coal moisture content on carbon deposition in coke ovens. Fuel 1996, 75, 979–986. [Google Scholar] [CrossRef]
  17. Zymla, V.; Honnart, F. Coke oven carbon deposits growth and their burning off. ISIJ Int. 2007, 47, 1422–1431. [Google Scholar] [CrossRef]
  18. Nakagava, T.; Kudo, T.; Kamada, Y.; Suzuki, T.; Komaki, I. Control of Carbon Deposition in the Free Space of Coke Oven Chamber by Injecting Atomized Water. Tetsu Hagane 2002, 88, 386–392. [Google Scholar] [CrossRef]
  19. Ando, T.; Kasaoka, S.; Onozawa, T.; Nakai, S. Coating Composition for Carbonization Chamber for Coke Oven and Application Method. U.S. Patent 6,165,923, 26 December 2000. [Google Scholar]
  20. Yu, J.W.; Qiao, K.; Zhu, B.; Cai, X.; Liu, D.W.; Li, M.J.; Yuan, X.M. Structural research of activated carbon fibers during a novel phosphoric acid reactivation process assisted by sonication. Funct. Mater. Lett. 2018, 11, 1850066. [Google Scholar] [CrossRef]
  21. Liu, C.; Xiao, N.; Wang, Y.W.; Li, H.Q.; Wang, G.; Dong, Q.; Bai, J.P.; Xiao, J.; Qiu, J.S. Carbon clusters decorated hard carbon nanofibers as high-rate anode material for lithium-ion batteries. Fuel Process. Technol. 2018, 180, 173–179. [Google Scholar] [CrossRef]
  22. Gao, R.T.; Liu, B.Y.; Xu, Z.M. Fabrication of magnetic zeolite coated with carbon fiber using pyrolysis products from waste printed circuit boards. J. Clean. Prod. 2019, 231, 1149–1157. [Google Scholar] [CrossRef]
  23. Zheng, J.W.; Song, F.F.; Che, S.L.; Li, W.C.; Ying, Y.; Yu, J.; Qiao, L. One step synthesis process for fabricating NiFe2O4 nanoparticle loaded porous carbon spheres by ultrasonic spray pyrolysis. Adv. Powder Technol. 2018, 29, 1474–1480. [Google Scholar] [CrossRef]
  24. Sonibare, O.O.; Haeger, T.; Foley, S.F. Structural characterization of Nigerian coals by X-ray diffraction, Raman and FTIR spectroscopy. Energy 2010, 35, 5347–5353. [Google Scholar] [CrossRef]
  25. Chutia, S.; Narzari, R.; Bordoloi, N.; Saikia, R.; Gogoi, L.; Sut, D.; Bhuyan, N.; Kataki, R. Pyrolysis of dried black liquor solids and characterization of the bio-char and bio-oil. Mater. Today Proc. 2018, 5, 13193–23202. [Google Scholar] [CrossRef]
  26. Wang, K.; Deng, J.; Zhang, Y.N.; Wang, C.P. Kinetics and mechanisms of coal oxidation mass gain phenomenon by TG–FTIR and in situ IR analysis. J. Therm. Anal. Calorim. 2018, 132, 591–598. [Google Scholar] [CrossRef]
  27. Wang, S.G.; Gao, R.; Zhou, K.Q. The influence of cerium dioxide functionalized reduced graphene oxide on reducing fire hazards of thermoplastic polyurethane nanocomposites. J. Colloid Interface Sci. 2019, 536, 127–134. [Google Scholar] [CrossRef]
  28. Tang, G.; Zhang, R.; Wang, X.; Wang, B.; Song, L.; Hu, Y.; Gong, X. Enhancement of flame retardant performance of bio-based polylactic acid composites with the incorporation of aluminum hypophosphite andexpanded graphite. J. Macromol. Sci. Part A 2013, 50, 255–269. [Google Scholar] [CrossRef]
  29. Krawczyk, P. Effect of ozone treatment on properties of expanded graphite. Chem. Eng. J. 2011, 172, 1096–1102. [Google Scholar] [CrossRef]
  30. Bourbigot, S.; Le Bras, M.; Delobel, R.; Gengembre, L. XPS study of an intumescent coating: II. Application to the ammonium polyphosphate/pentaerythritol/ethylenic terpolymer fire retardant system with and without synergistic agent. Appl. Surf. Sci. 1997, 120, 15–29. [Google Scholar] [CrossRef]
  31. Zhang, P.; Hu, Y.; Song, L.; Ni, J.X.; Xing, W.Y.; Wang, J. Effect of expanded graphite on properties of high-density polyethylene/paraffin composite with intumescent flame retardant as a shape-stabilized phase change material. Sol. Energy Mater. Sol. Cells 2010, 94, 360–365. [Google Scholar] [CrossRef]
Figure 1. Dimensions of the bulk sample: (a) length and width; (b) thickness.
Processes 07 00508 g001
Figure 2. Distribution of each carbonaceous deposit layers: (a) schematic diagram; (b) digital photo.
Processes 07 00508 g002
Figure 3. SEM images of each carbonaceous deposit layer in the coking chamber: sample #1 carbonaceous deposit layer, (a,b); sample #2 carbonaceous deposit layer, (c,d); sample #3 carbonaceous deposit layer, (e,f); and sample #4 carbonaceous deposit layer, (g,h).
Processes 07 00508 g003
Figure 4. XRD spectra of each carbonaceous deposit layer in the coking chamber.
Processes 07 00508 g004
Figure 5. FTIR spectra of each carbonaceous deposit layer in the coking chamber.
Processes 07 00508 g005
Figure 6. Raman spectra of each carbonaceous deposit layer in the coking chamber.
Processes 07 00508 g006
Figure 7. Raman spectra of each carbonaceous deposit layer in the coking chamber: (a) #1 carbonaceous deposit layer; (b) #2 carbonaceous deposit layer; (c) #3 carbonaceous deposit layer; and (d) #4 carbonaceous deposit layer.
Processes 07 00508 g007
Figure 8. XPS spectra of each carbonaceous deposit layer in the coking chamber.
Processes 07 00508 g008
Figure 9. C1s spectra of each carbonaceous deposit layer in the coking chamber: (a) #1 carbonaceous deposit layer; (b) #2 carbonaceous deposit layer; (c) #3 carbonaceous deposit layer; and (d) #4 carbonaceous deposit layer.
Processes 07 00508 g009
Figure 10. O1s spectra of each carbonaceous deposit layer in the coking chamber: (a) #1 carbonaceous deposit layer; (b) #2 carbonaceous deposit layer; (c) #3 carbonaceous deposit layer; and (d) #4 carbonaceous deposit layer.
Processes 07 00508 g010
Figure 11. Schematic illustration for the formation and evolution mechanism for carbonaceous deposits on the surface of the coking chamber.
Processes 07 00508 g011
Table 1. XRF data of carbonaceous deposits on the surface of the coking chamber.
CompositionContent (wt%)Standard Error (wt%)
SO234.510.24
SiO230.540.23
Al2O319.220.20
Fe2O35.600.11
CaO1.740.07
ZnO1.440.06
Cr2O31.150.05
MnO1.150.05
Cl1.050.05
MgO0.7250.036
TiO20.6860.034
Na2O0.5950.037
K2O0.5910.029
P2O50.5740.029
Table 2. XRD structure parameters of each carbonaceous deposit layer in the coking chamber.
Sample2θ0022θ100d002/nmFWHM002/nmLa/nmFWHM100/nmLc/nmN
#125.9242.980.34370.85530.810.5679.9730
#225.7642.800.34580.86527.840.6279.8529
#325.6842.640.34680.95335.180.4968.9427
#425.5842.970.34820.96536.470.4798.8226
Table 3. XPS test data of each carbonaceous deposit layer in the coking chamber.
SampleC (%)O (%)NAlSiCaFeSPC/OC/N
#182.4110.912.201.121.730.500.370.540.217.5537.46
#289.436.201.490.760.910.270.280.430.2214.4260.02
#389.696.321.170.770.720.300.310.460.2614.1976.66
#491.515.140.760.850.620.390.250.230.2417.80120.39
Table 4. Bonding state content of the C element of each carbonaceous deposit layer.
SampleC–C/C–HC–O/C–NC=O/C=N
284.7 eV285.5 eV287.4 eV
#169.73%21.68%8.60%
#264.59%25.87%9.54%
#366.60%24.51%8.89%
#469.46%21.67%8.87%
Table 5. Bonding state content of the O element of each carbonaceous deposit layer.
Sample=O–O–O2/H2O
531.6 eV532.8 eV533.8 eV
#130.10%42.10%27.80%
#235.16%43.39%21.44%
#333.48%43.19%23.33%
#432.43%44.89%22.68%

