Article

Optimal Allocation of Energy Storage System Considering Price-Based Demand Response and Dynamic Characteristics of VRB in Wind-PV-ES Hybrid Microgrid

School of Electrical Engineering and Automation, Wuhan University, Wuhan 430000, China
*
Author to whom correspondence should be addressed.
Processes 2019, 7(8), 483; https://doi.org/10.3390/pr7080483
Submission received: 17 June 2019 / Revised: 14 July 2019 / Accepted: 19 July 2019 / Published: 1 August 2019
(This article belongs to the Special Issue Energy Storage System: Integration, Power Quality, and Operation)

Abstract

:
Studying the influence of the demand response and dynamic characteristics of the battery energy storage on the configuration and optimal operation of battery energy storage system (BESS) in the Wind-Photovoltaic (PV)-Energy Storage (ES) hybrid microgrid. A demand response model that is based on electricity price elasticity is established based on the time-of-use price. Take the capital-operating cost and direct economic benefit of the BESS and the loss of abandoned photovoltaic and wind power as the optimization objective, an optimal configuration method that considers the dynamic characteristics of the BESS and the maximum absorption of photovoltaic and wind power is proposed while using particle swarm optimization to solve. The results show that the configuration results considering the demand side response of the microgrid BESS can obtain better economy and reduce the storage capacity requirement, and the result shows that the efficiency of BESS relates to the load of the system, the distributed generation (DG) characteristics, and the dynamic characteristics of BESS. Meanwhile, the capacity and power of the energy storage configuration increase as the DG permeability increases due to the reverse load characteristic of the wind power.

1. Introduction

At present, it is difficult to integrate and dissipate large-scale distributed new energy. How to deal with the relationship between the output of distributed generation, energy storage system, and demand-side load [1,2,3] has become a research focus. The energy storage system plays an important role in coordinating the relationship of distributed power supply and the demand-side load with its reliable characteristics of peak shaving and frequency modulation since the distributed power supply and the demand side response load in the microgrid have great uncertainty. Reasonable allocation of energy storage in distribution network planning is an effective way to improve consumption of clean energy and efficiency of the system operation.
At present, some work has been done on the rational allocation of microgrid energy storage capacity optimization. In [4], the discrete Fourier transform is used to decompose the unbalanced power in the island-type microgrid into daily and hour components, which compressed air energy storage and sodium-sulfur battery balance, respectively, and it builds an optimal configuration model for energy storage capacity with a target for operating costs, etc. In [5], the selection of energy storage site and volume optimization model is established with the system node voltage fluctuation, load fluctuation, and total energy storage capacity as the target. The improved particle swarm optimization algorithm is used to obtain the Pareto solution set and select the optimal access scheme for energy storage. In [6], an island microgrid optimal configuration model with wind/light/pumped energy storage that considers load response is proposed, and the particle swarm algorithm is used to optimize the quantity or capacity of the main equipment in the microgrid. In [7], an optimization p model, which includes distributed generation sources, is proposed, in which the coordination of the energy storage system of the distribution network and the interruptible load response on the demand side is achieved. In [8], a robust optimization model for distribution network loss that is based on uncertainty of electricity price is constructed, and the optimal operation strategy under different influencing factors is analyzed. There are many researches on the optimized configuration of energy storage or demand side response of distribution network. However, there are not many planning studies that consider energy storage and demand side response at the same time. Existing studies have considered the impact of price-based demand response on optimal configuration of distribution energy storage with distributed power supplies less, and have seldom considered the dynamic model of the battery. The dynamic efficiency and dynamic absorption characteristics of the energy storage system will inevitably have great impact on the operation of the energy storage system, and the absence of these constraints in the model will weaken the validity of the model. As all-vanadium redox flow battery (VRB) has the advantages of high energy efficiency, fast response, many cycles, long life, and it has extremely good application prospects in the fields of distributed generation, peak load shaving, and so on. Among many battery energy storage systems, the all-vanadium flow battery energy storage system has gained wide attention due to its comprehensive performance and large-scale application [9]. Accordingly, the application of VRB in energy storage optimization configuration is a worthwhile research direction. Therefore, the optimal allocation of energy storage in the microgrid network while considering the demand response and the dynamic characteristics of the all-vanadium redox flow battery is a direction worthy of further study.
A demand response model based on electricity price elasticity is established on the basis of peak-valley and time-of-use price to meet the needs of energy storage system with distributed generation and its operation program. An energy storage operation strategy that is based on maximum wind absorption is proposed while considering the dynamic characteristics of all-vanadium redox flow battery. The influence of demand side response on the operation of the microgrid energy storage system is studied taking the cost of BESS, direct economic benefit, and abandoned wind-photovoltaic loss of the all-vanadium redox flow battery energy storage system as the optimization goal. The dynamic programming algorithm was used to study the capacity optimization configuration and the dynamic characteristics of the optimal BESS.

2. User Response Model Based on Demand Price Elasticity

There are two main ways in which the users respond to prices [10,11]: user’s single-time response and multi-period user respond. The optimization configuration of energy storage system has low requirements on the real-time price of electricity, and the user’s multi-period response mode is more in line with the user’s common consumption behavior. Therefore, this paper will establish a multi-period response model of electricity price to deal with the planning of energy storage system, with access to distribution network. The elasticity of demand price reflects the ability of users to participate in market regulation. The electricity-price elasticity index can express the correlation between user’s electricity consumption and price. Article [12] pointed out that, based on the equilibrium relationship between market supply and elastic demand, in the vicinity of the equilibrium point of the electricity market, the electricity E and the electricity price e are approximately linear, and the expression is as follows:
E = a e + b
where a and b are the coefficients of the electricity price curve.
Electricity-price elasticity indicates the change in electricity consumption that is caused by the change in electricity price within a certain period of time, that is, the ratio of the rate of change of electricity to the rate of change of electricity consumption. The expression is:
m = Δ E E ( Δ e e ) 1
where m represents the electricity-price elasticity index, E and Δ E respectively represent the amount of electricity and change in electricity, and e and Δ e respectively represent the amount of electricity price and change in electricity price. In the time-sharing electricity price, the daily load is divided into three periods: peak, flat, and valley. It is assumed that power companies implement single price before the implementation of time-of-use prices, that is:
e f 0 = e p 0 = e g 0 = e 0
Electricity price elasticity matrix M based on peak-to-valley and time-sharing electricity:
M = [ m f f m f p m f g m p f m p p m p g m g f m g p m g g ]
According to the Formulas (1)–(4), the self-elastic coefficient and the cross-elastic coefficient of the peak, flat, and valley periods can be derived:
m f f = a f e p f a f e p f + b f
m f p = a f e p p a f e p f + b f
Similarly, the elastic coefficients of other time periods can be obtained. According to Formula (2), the change in the amount of electricity after the change in the price of electricity is obtained, which is:
Δ E = m E ( Δ e p / e p )
Combined with the Formulas (4) and (6), the expression of the electricity consumption in the three periods after the time-of-use price can be derived as
E T O U = E 0 + ( E f , 0 0 0 0 E p , 0 0 0 0 E g , 0 ) M ( Δ e p f / e 0 Δ e p p / e 0 Δ e p g / e 0 )
In the formula, E0, ETOU, respectively, indicate the amount of electricity before and after the implementation of electricity price; E T O U = [ E f , E p , E g ] , E 0 = [ E f , 0 , E p , 0 , E g , 0 ] , e 0 , and Δ e p f , Δ e p p , Δ e p g , respectively, indicate the electricity price before the implementation of the time-of-use electricity price and the electricity price difference between the time periods after implementation.

3. Battery Charging and Discharging Dynamic Model

The overall performance of VRB is optimal among the kinds of batteries. VRB has large capacity and power, and its rated capacity and power can be independently designed. It has extremely good application prospects in the fields of wind power and photovoltaic power generation for the advantages. So we will apply it to the energy storage optimization configuration. The state of charge (SOC) is the most important parameter for battery operation and represents the amount of electricity stored in the battery [13]. The need to consider the dynamic characteristics of the VRB in order to carry out detailed model of the charging and discharging of the energy storage system is prominent. In general, the SOC of VRB in the BESS can be calculated by Equation (9).
S O C t = { S O C t 1 P V R B , t T η V R B d E V R B r a t e d S O C t 1 P V R B , t η V R B c T E V R B r a t e d
where SOCt is the SOC value in time period t, T is the duration of each time period t, and E V R B r a t e d is the rated capacity of the battery. The symbol d stands for discharging, which means that the battery is discharging in this state, symbol c stands for charging, which means that the battery is charging in this state. η V R B d and η V R B c are, respectively, the efficiency values of charging and discharging, as calculated by Equations (10) and (11). PVRB,t is the output power of the energy storage system in time period t.
In the charging and discharging state of battery, the efficiency of VRB increases with the increase of charging and discharging power PVRB. The variation range is large, and the relationship between the charging and discharging efficiency of VRB and the state of charge SOC is also complicated. In [14,15,16,17], based on the relationship between VRB, SOC, charge, and discharge power, the charging and discharging efficiency of VRB is dynamically fitted. The fitting formulas are shown in (10) and (11). Table A1 of Appendix A shows the fitting results.
η c = ( a c S O C + b c ) P V R B ( p . u . ) + c c S O C + d c P V R B ( p . u . )
η d = P V R B ( p . u . ) a d P V R B ( p . u . ) + b d S O C ( S O C 1 ) + c d
where ηc, ηd are the charge and discharge efficiency values of VRB, respectively. ac, bc, cc, and dc are the coefficients of VRB charging efficiency, and ad, bd, and cd are the coefficients of VRB discharge efficiency.
The maximum absorbed power Pab of VRB is limited by parameters, such as SOC. Article [14] fits the relationship between the maximum absorbed power Pab and SOC, as shown in Equation (12).
P a b ( p . u . ) = { a a b c S O C 2 + b a b c S O C + c a b c a a b d S O C 2 + b a b d S O C + c a b d
where a a b c , b a b c , c a b c , a a b d , b a b d , c a b d are the fitting coefficients, the fitting results are shown in Table A2 of Appendix A. The symbol c stands for charging, and symbol d stands for discharging.

4. Energy Storage Optimization Configuration Taking Account of Battery Dynamics

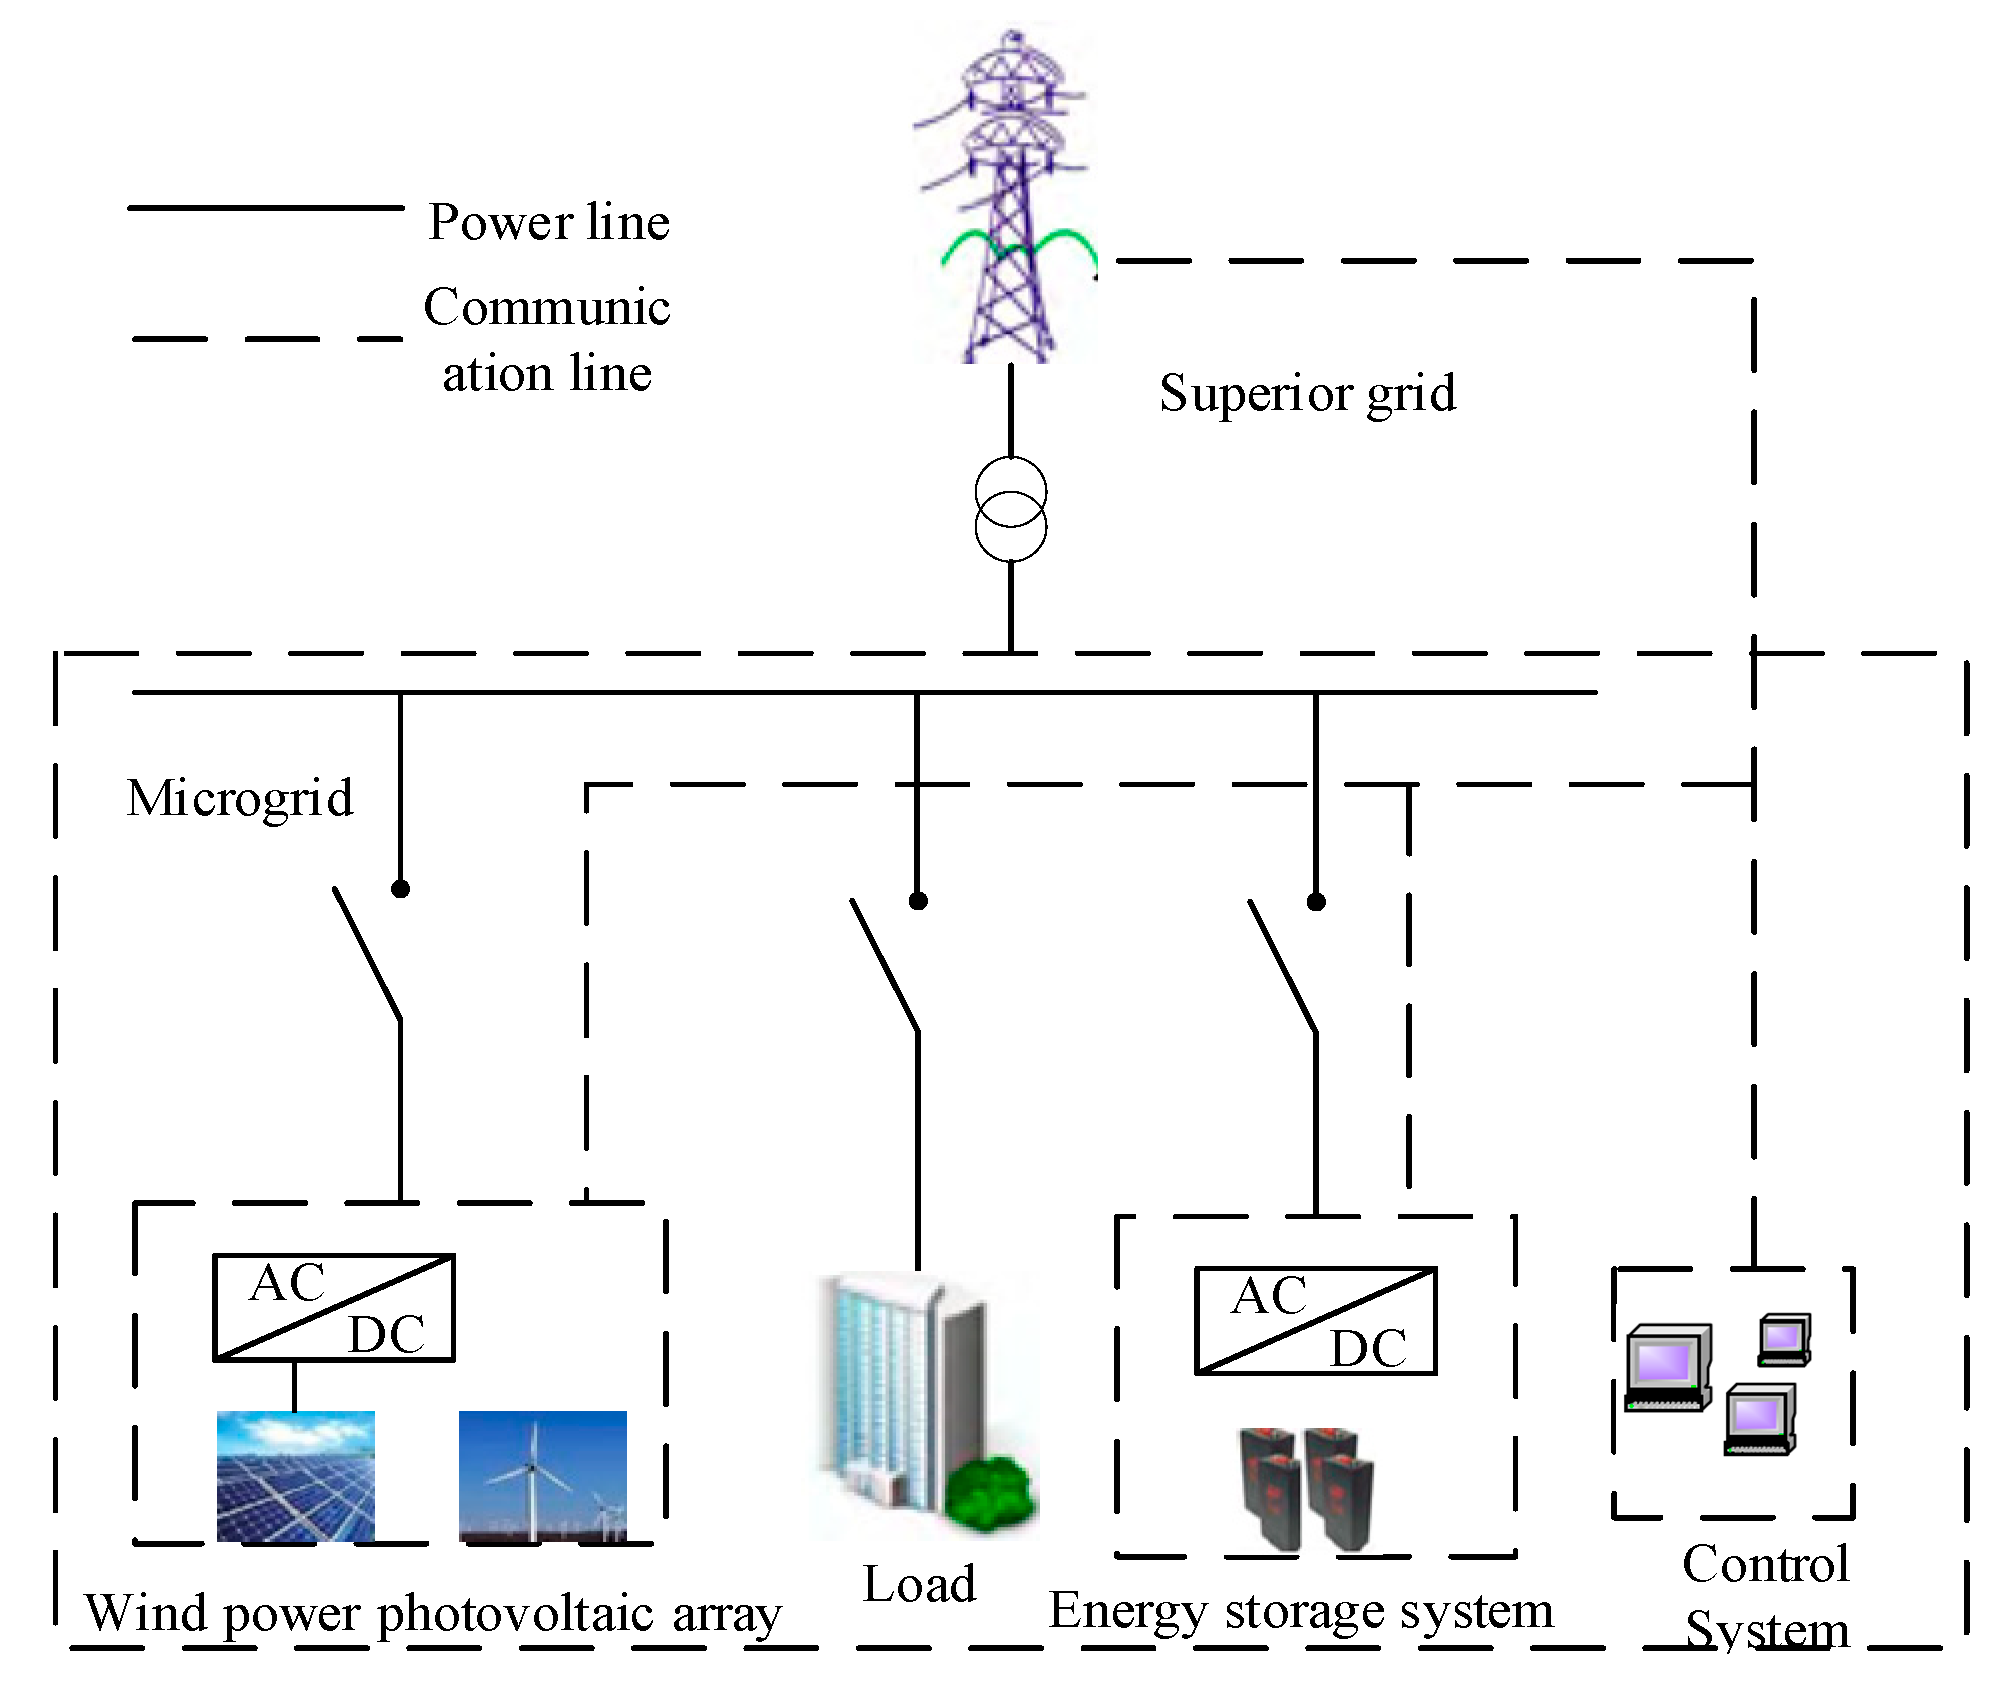
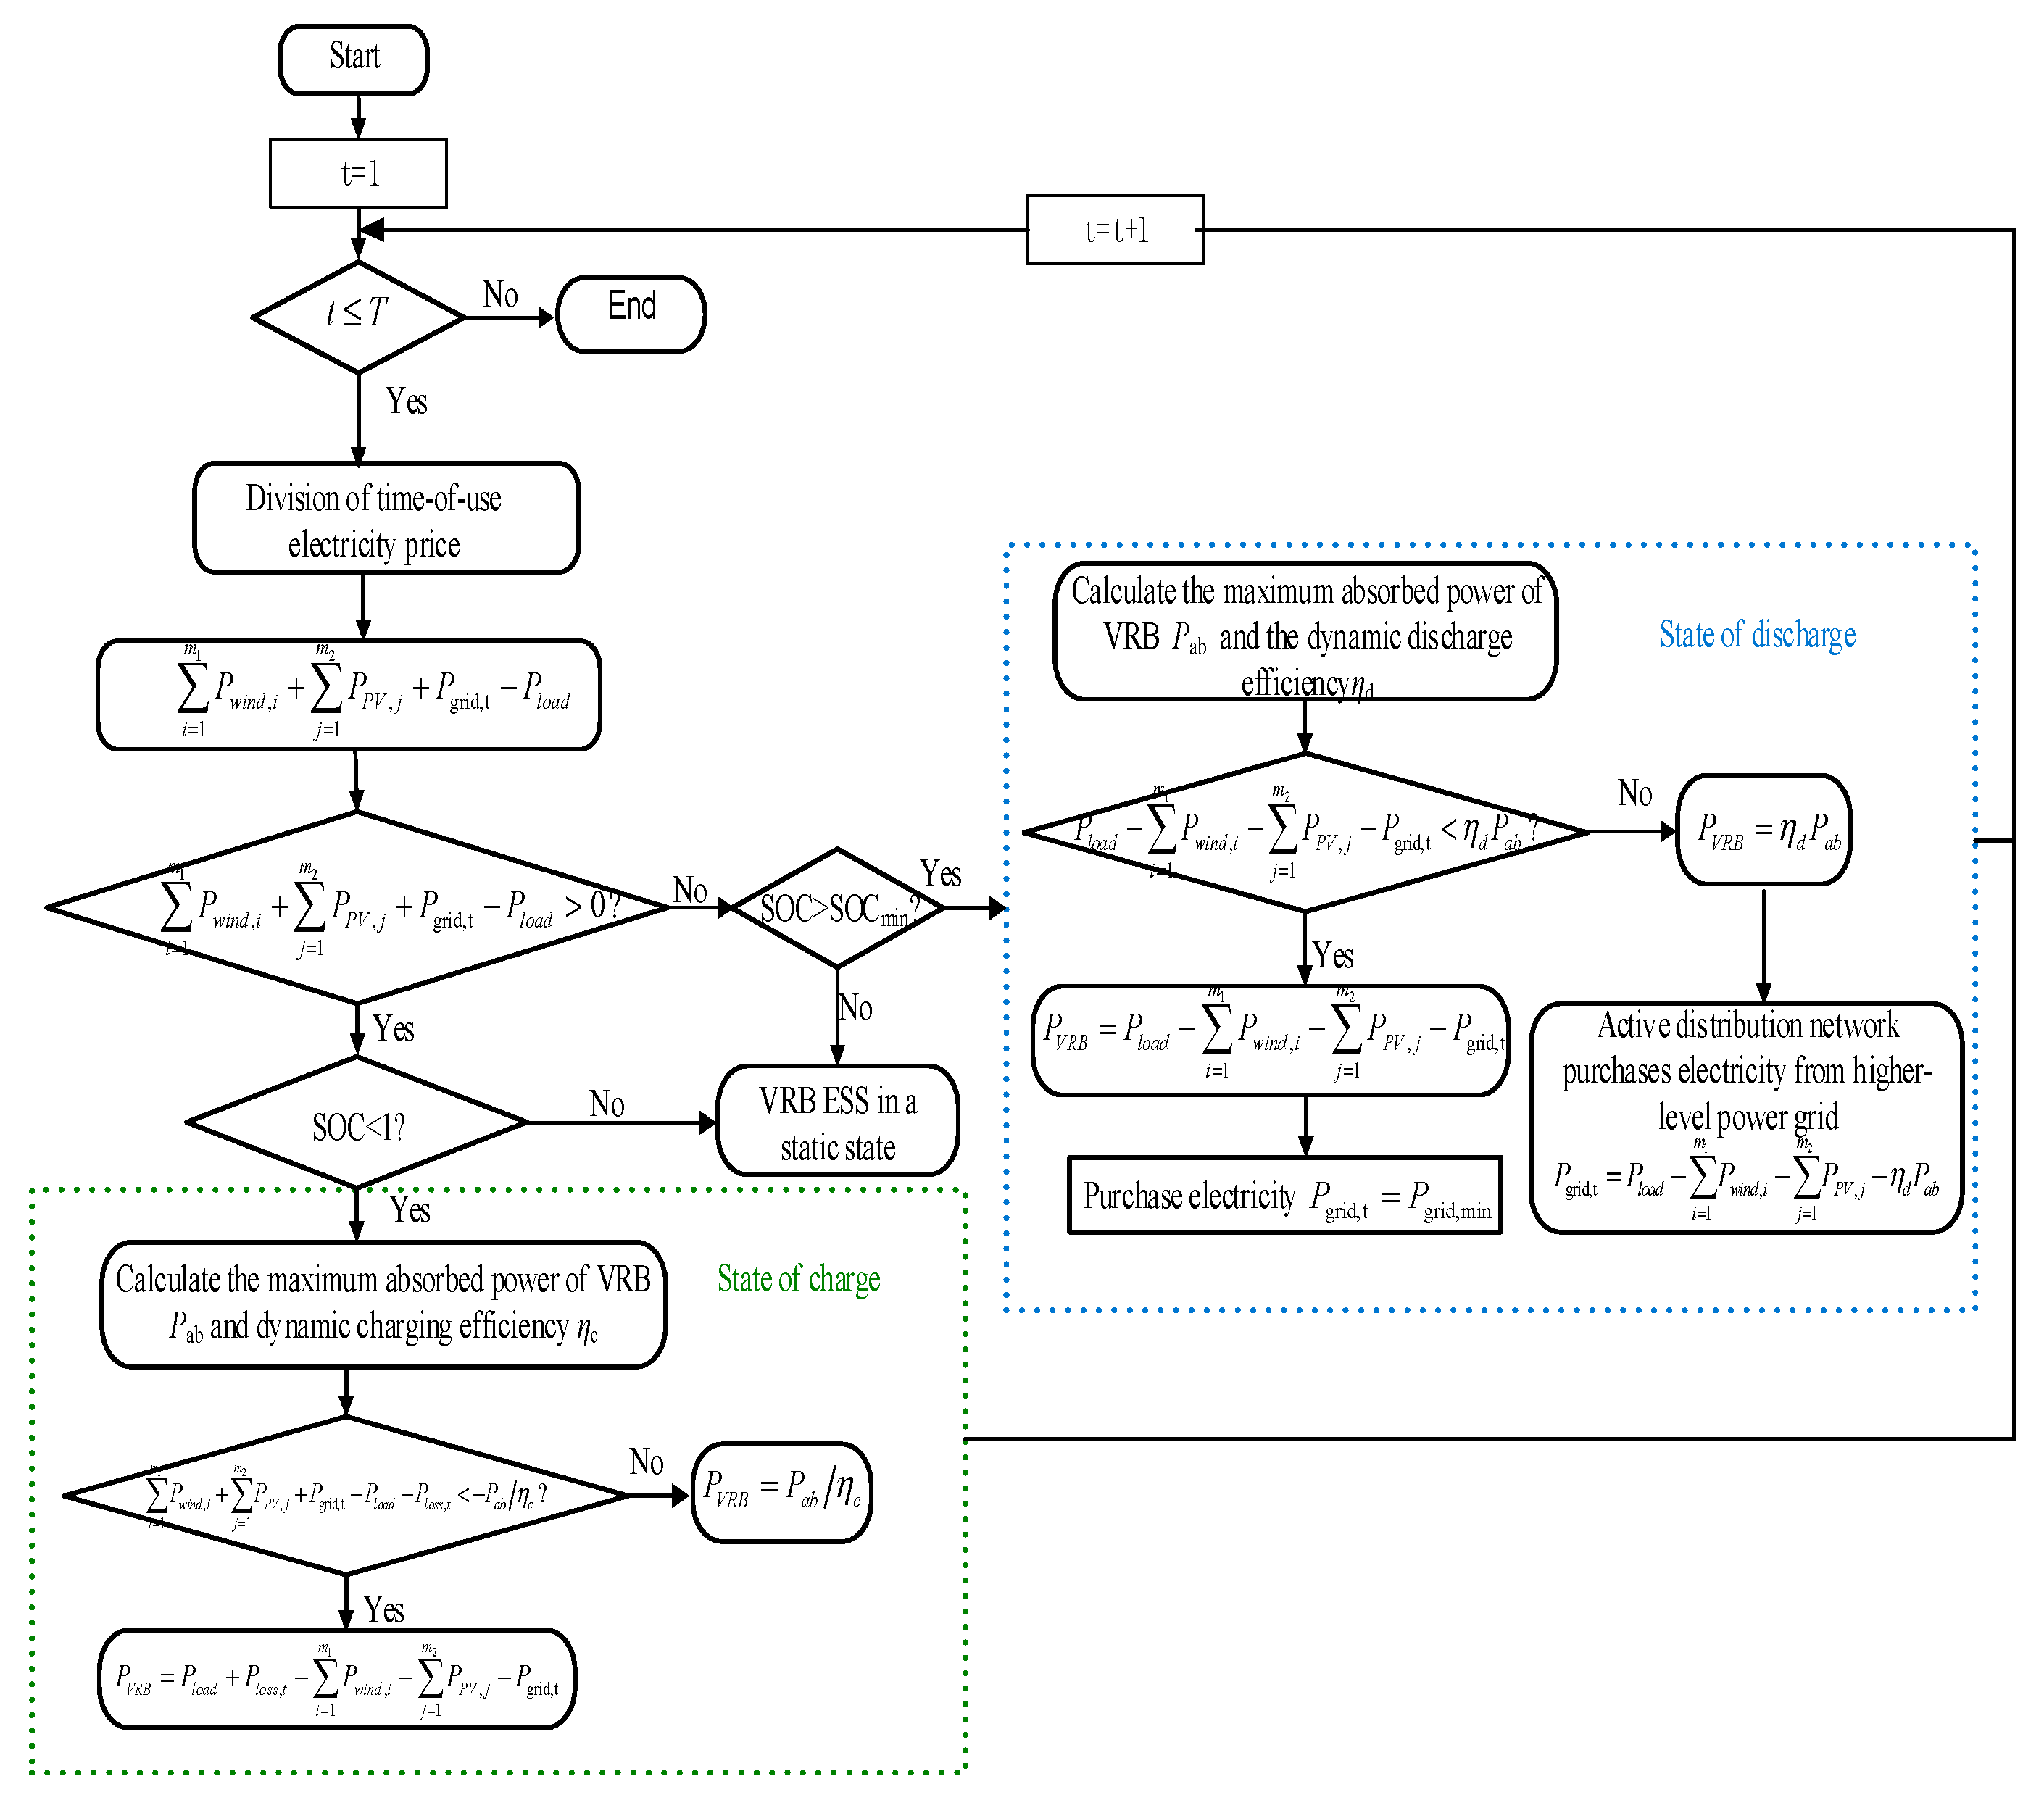
4.1. Energy Storage Operation Strategy

Comprehensive analysis of wind output characteristics, BESS characteristics, and time-sharing electricity price mechanism can be formulated with the largest wind and light consumption as the goal of the battery charging and discharging strategy, as shown in Figure 1.
(1) According to the demand response situation, the time-of-use electricity price period is divided. When the sum of photovoltaic, wind power output, and microgrid power supply to the upper-level power grid is greater than the load demand, the BESS is charged, and it needs to meet:
P V R B < 0 , i = 1 m 1 P w i n d , i + j = 1 m 2 P P V , j + P g r i d , t > P l o a d
where Pwind,I, Ppv,j are the wind power capacity of node i, the photovoltaic capacity of node j, and Pload,t is the load of t period, Pgrid,t is the power consumption of the upper-level grid, which depends on the planned output in t-time.
(2) The battery energy storage system preferentially discharges when compared to conventional energy sources when the sum of photovoltaic, wind power output, and microgrid network power supply to the upper power grid is less than the load demand, and it needs to meet:
P V R B > 0 , i = 1 m 1 P w i n d , i + j = 1 m 2 P P V , j + P g r i d , t < P l o a d
P V R B ( t ) = { η V R B P a b ( p . u . ) P V R B r a t e d , | P cx | > η V R B P a b ( p . u . ) P V R B r a t e d P cx , | P cx | η V R B P a b ( p . u . ) P V R B r a t e d
where Pab(p.u.) is the maximum absorbed power of VRB and Pcx is the power deviation between the system and the stored energy, which can theoretically charge or discharge to the BESS. ηVRB is the battery charging and discharging efficiency that is determined by the Formulas (10) and (11). P V R B r a t e d is the rated installation power of the BESS.
(3) The BESS of VRB must have a certain margin to ensure the supply of emergency load, which must meet:
S O C V R B E V R B r a t e d E r e s v
where, Eresv is the energy that is required to ensure the emergency load power supply. SOCVRB is the state of charge of the all-vanadium redox flow battery, which can be calculated by Formula (9). E V R B r a t e d is the rated capacity of VRB energy storage system.

4.2. Target Optimization Function

The objective function F of the optimal configuration of the battery energy storage system can be constructed according to the economic indicators of the battery energy storage system.
The objective function F that was constructed in this chapter consists of three parts: one is the fixed investment cost and operating cost Ctol of the VRB energy storage system, the other is the direct economic benefit of the energy storage system Bdir, and the third Cpv is the abandoned wind and photovoltaic power of the VRB energy storage system.
F ( P V R B r a t e d , E V R B r a t e d ) = C t o l B d i r + C p v
where P V R B r a t e d and E V R B r a t e d are the decision vectors for the installation power and installation capacity of the VRB energy storage system. The calculation formulas of Ctol, Bdir and Cpv must be separately constructed in order to calculate the objective function F.
(1) Calculation of the cost of total VRB energy storage system Ctol
The cost of the BESS Ctol consists of two parts, namely, one-time investment cost (Cfix) and operation and maintenance cost (Com). A large number of studies have shown that Cfix increases linearly with the increase of the capacity of the BESS during the day [18,19], and Com is mainly related to the rated power of the energy storage battery.
{ C t o l = C f i x + C o m C f i x = k 1 P V R B r a t e d + k 2 E V R B r a t e d C o m = k 1 P V R B r a t e d β
Among them, k1 and k2 are the coefficients of the cost of the battery energy storage system, which is related to the electrical material technology, and β is the conversion coefficient of the operation and maintenance cost, converted into the initial power cost.
(2) Calculation of economic benefits of the battery energy storage system Bdir
B d i r = i = 1 n t = t 1 t 2 P V R B , i η p e ( t ) d t
where n is the number of discharge periods of the energy storage system, i is the section of the battery energy storage system in the [t1, t2] interval, and PVRB is the output of the battery energy storage system. The dynamic efficiency characteristics of the flow battery. η is the efficiency of the converter, which is considered to be a fixed value of 95%. pe(t) is the price of real-time user electricity that was sold during the day.
(3) Calculation of abandoned wind and light loss Cpv in the battery energy storage system
C p v = t = 0 24 ( P w i n d + P P V + P g r i d , t + P V R B P l o a d ) d t

4.3. Energy Storage Operation Constraint

In this paper, the following constraints are established for the operation of the energy storage model while constructing the optimal configuration model of the BESS.
(1)
Equation (21) shows the upper and lower limits of the rated capacity of the battery energy storage system.
{ P V R B r a t e d , min P V R B r a t e d P V R B r a t e d , max E V R B r a t e d , min E V R B r a t e d E V R B r a t e d , max
The rated power and capacity constraints of the decision vector energy storage system are effectively reduced to solve the problem, and it is convenient to solve it.
(2)
The dynamic absorption power constraint of the BESS is that the charge and discharge power value is less than or equal to the maximum absorbed power value of the VRB;
(3)
The node voltage constraint is as shown in Equation (22).
U min U i U max
(4)
The battery energy storage system must have a certain margin to ensure the supply of emergency load, and Formula (23) must be satisfied.
S O C min S O C V R B S O C max

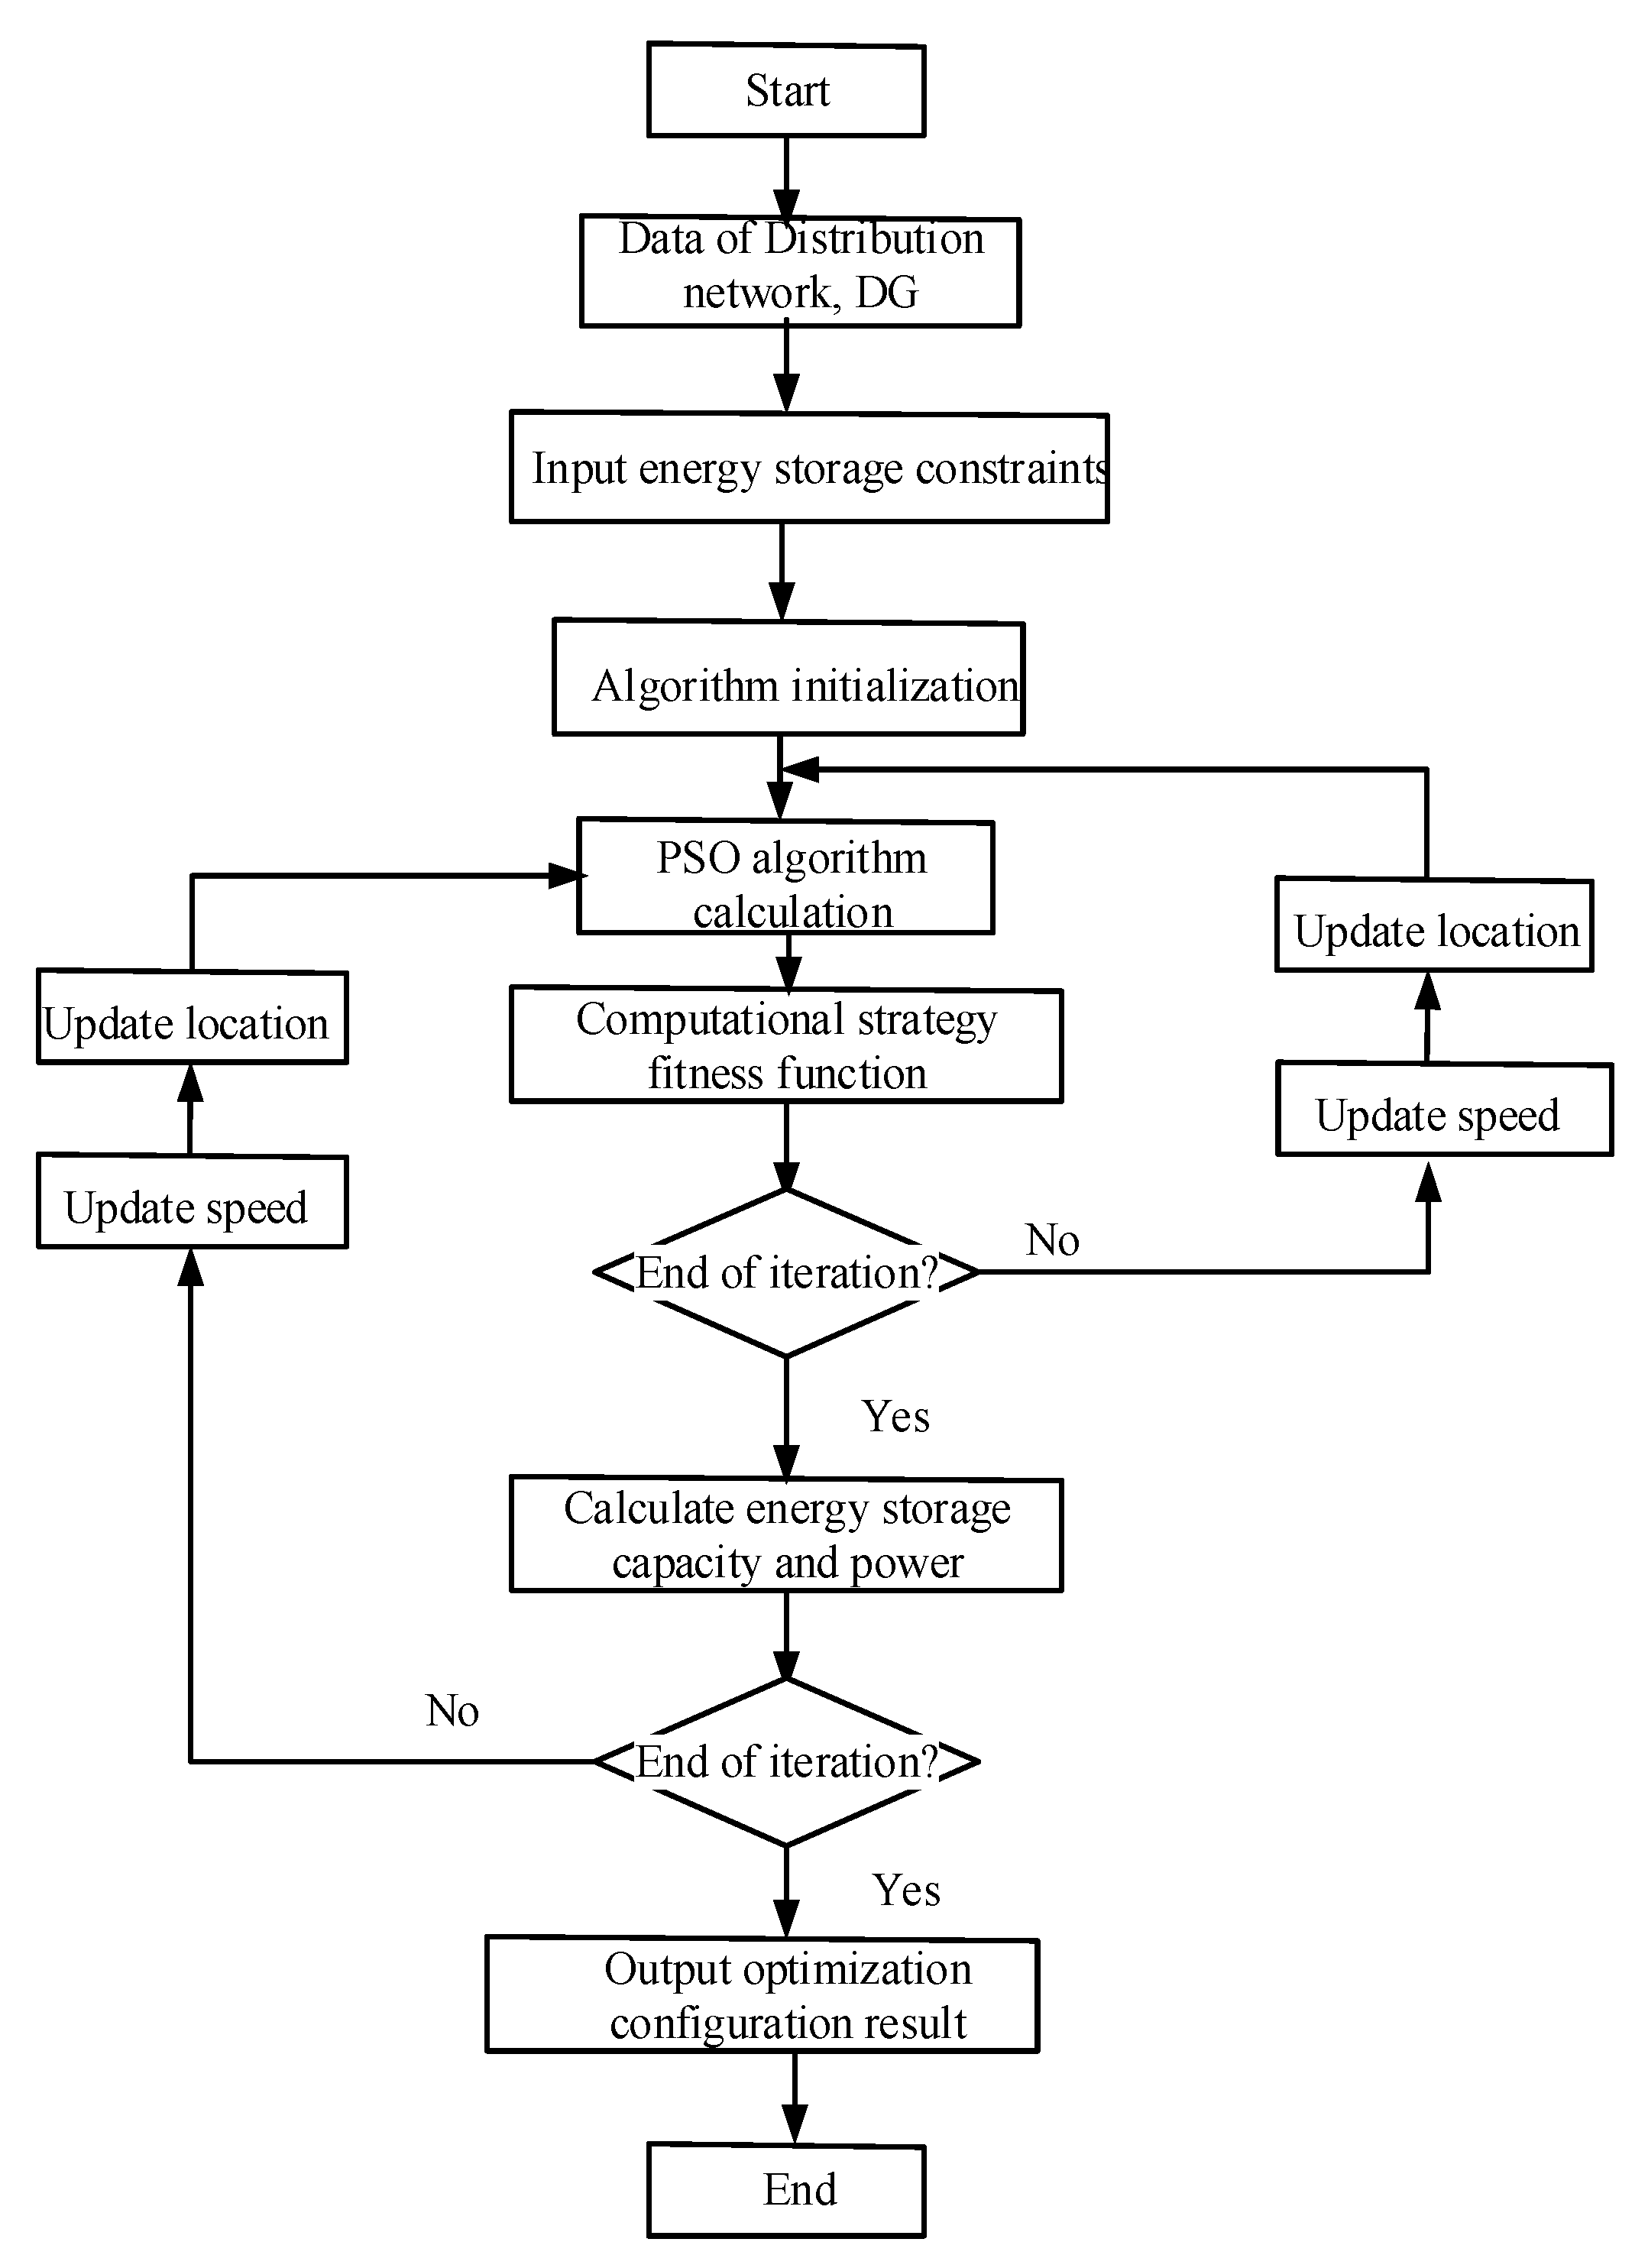
5. Optimization Configuration Method of Energy Storage Based on Improved Particle Swarm Optimization

There are many variables and many constraints, according to the optimal allocation model of battery energy storage system constructed in Section 3. This chapter intends to use the particle swarm optimization algorithm to optimize the model, instead of dynamic programming algorithm, for it can speed up the convergence of results with strong adaptability. In order to overcome the situation that the particle swarm optimization (PSO) algorithm is easy to fall into the local optimum, it is improved by being combined with the dynamic inertia weight and adaptive particle mutation method. The optimal configuration model of the microgrid energy storage system constructed in this paper is solved [17].

5.1. Dynamic Inertia Weight

The inertia weight w can adjust the ability of particle algorithm in local search and global search, which has great influence on the convergence of the algorithm. The difference between the particle position and the optimal solution of the population has a great relationship with the value of the inertia weight. The global search ability of the algorithm should be allowed to take a larger value when the difference between the particle position and the population optimal solution is large. When the difference between the particle position and the population optimal solution is small, the local search ability of the algorithm should be made to take a smaller value. It can be adjusted while using the dynamic inertia weighting method, namely:
w ( k ) = w min + w max w min T max ( T max k )

5.2. Adaptive Mutation Method
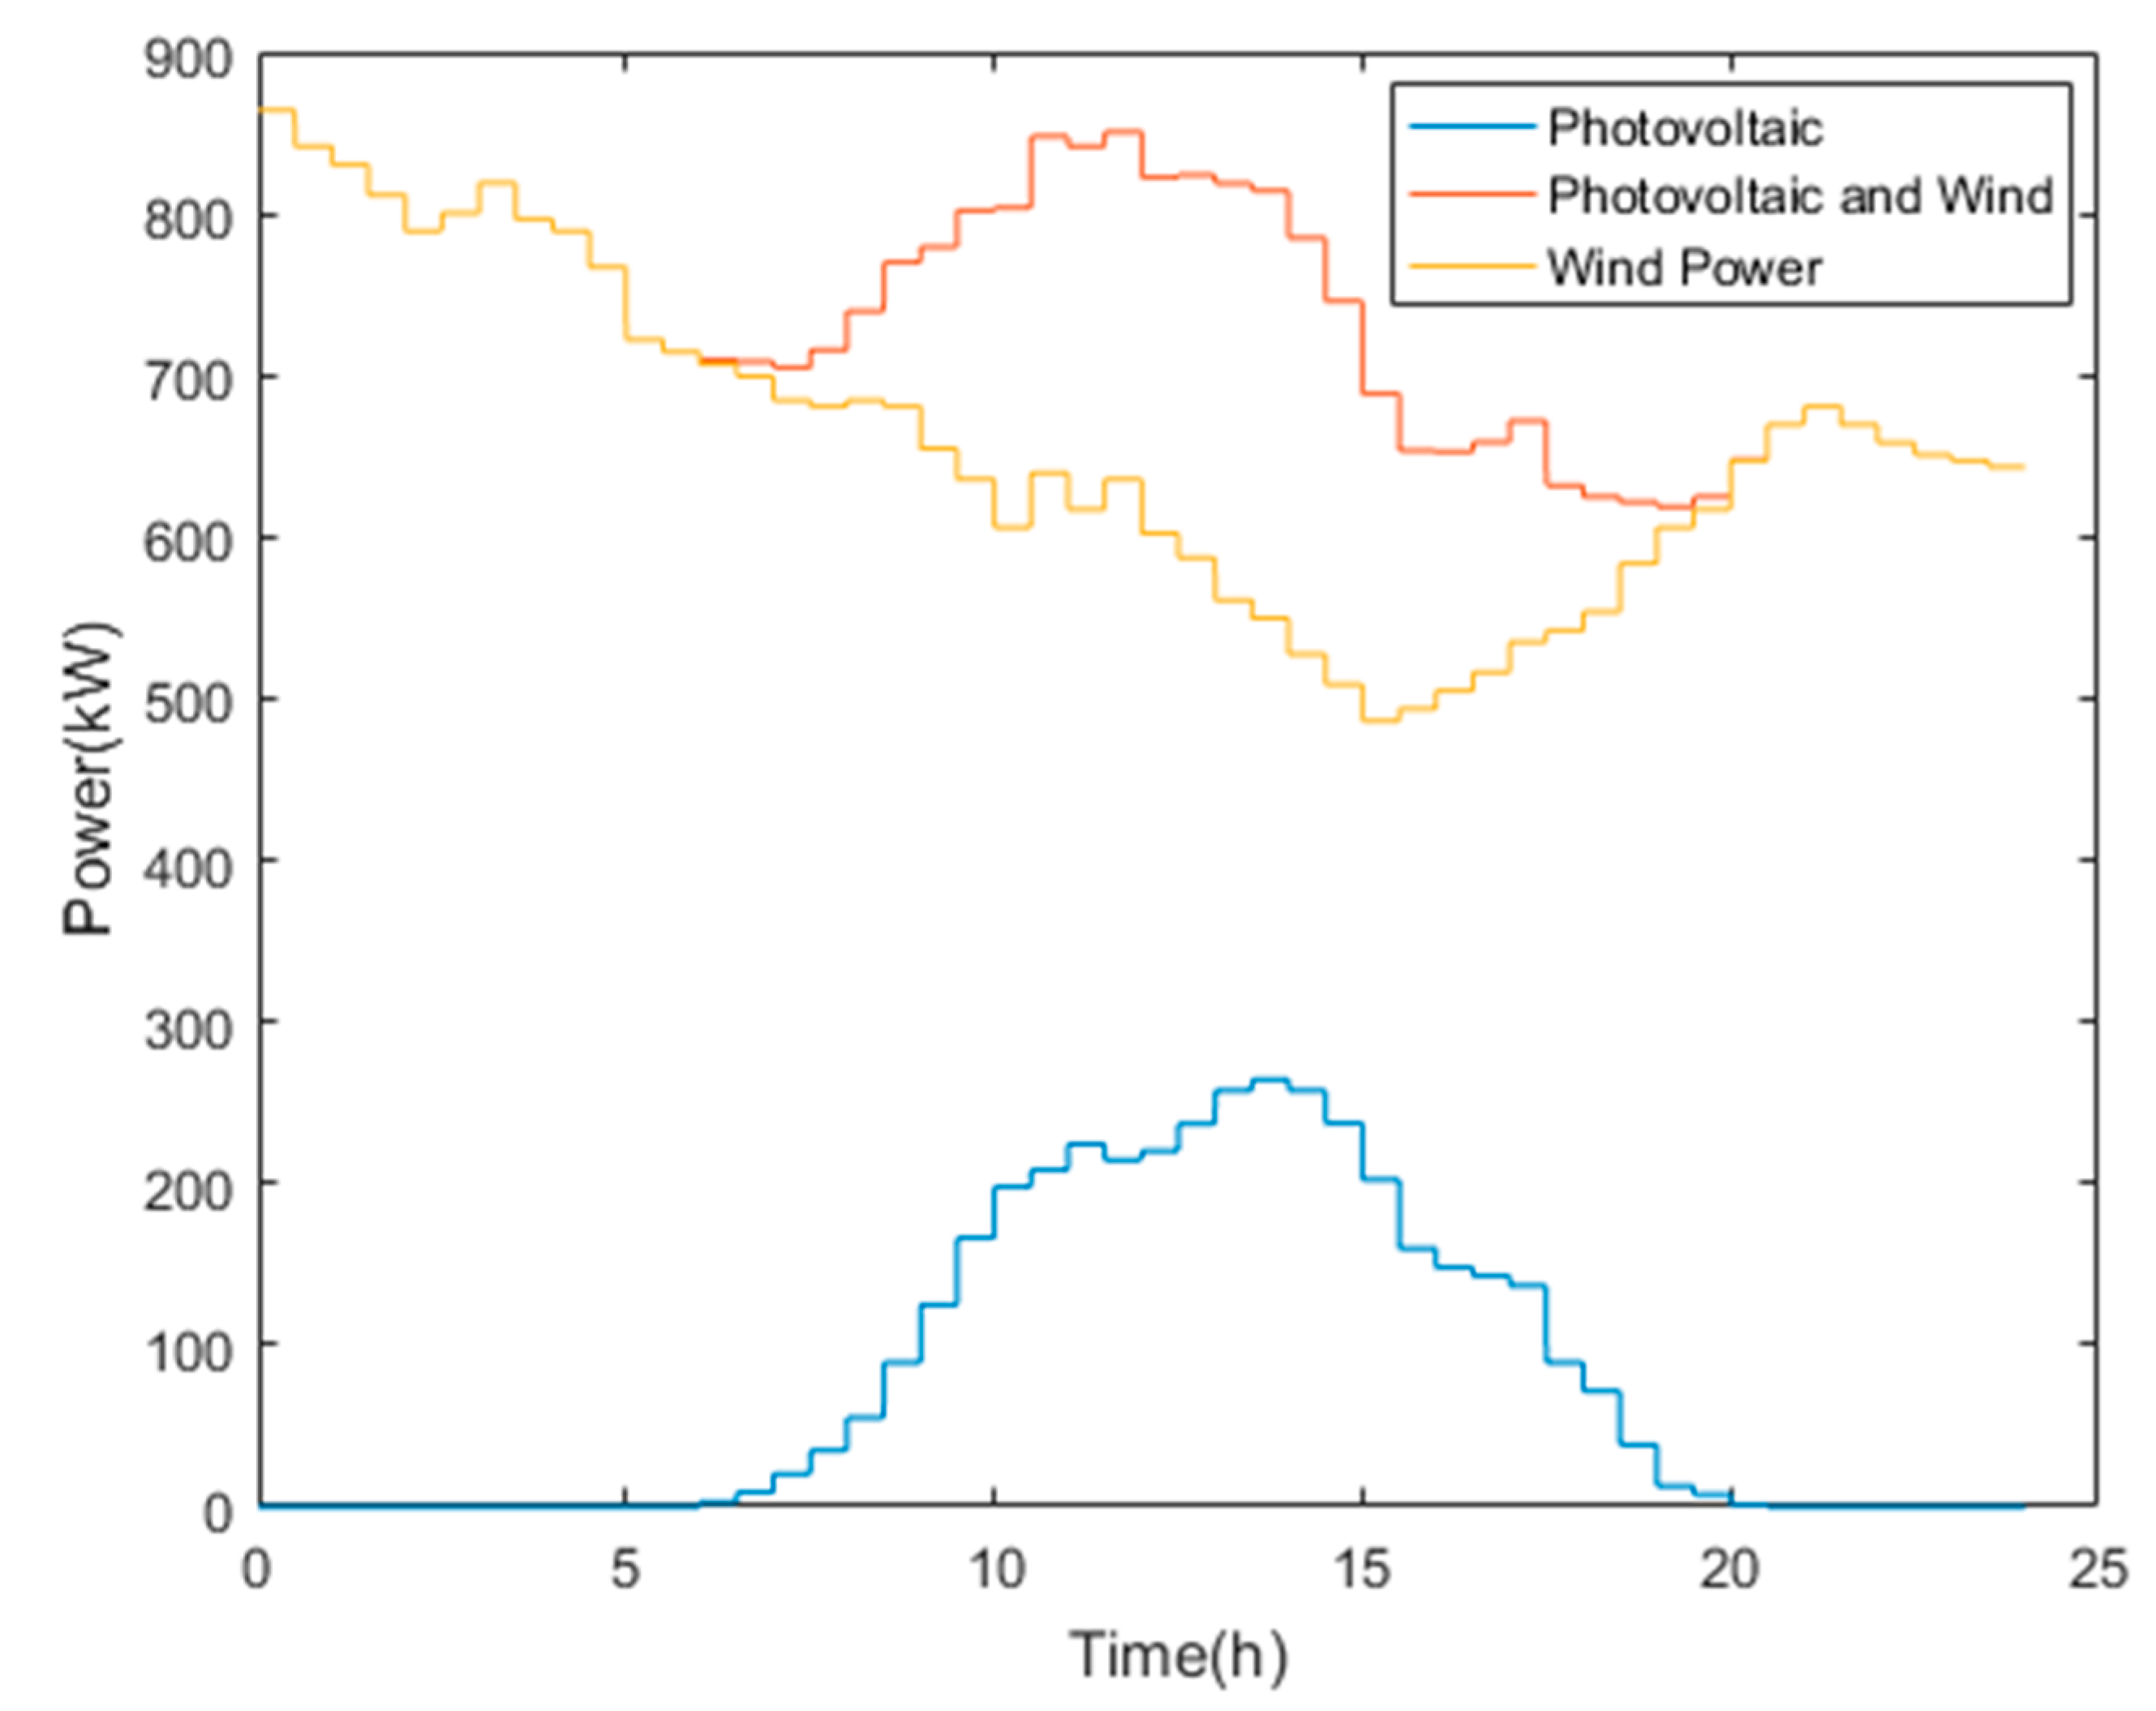
When the rate of change of the optimal fitness value is less than a certain threshold, the particle variation of the currently found global optimal solution gbest can be made to jump out of the local optimum in order to avoid the particle swarm falling into the local optimal solution in the solution space [18,19].
When considering that the particle may find a better position under the current gbest, the mutation operation introduces a random perturbation, that is, a certain probability Pm variation for the gbest satisfying the mutation condition. The mutation operation for gbest is as follows, let gbestk be the tk dimension of gbest and η is a random variable obeying the distribution of Gauss (0, l), then
gbest k = g best k 1 ( 1 + 0.5 η )
Figure 2 shows the flow of the mathematical model for optimal configuration of the BESS using the improved particle swarm optimization algorithm.

6. Case Analysis

Figure 3 shows a typical microgrid structure. In this paper, a case in a certain area of Northwest China is adopted for analysis, and the installation location of energy storage is not considered. It is assumed that the distribution is consistent with the photovoltaic-wind farm, and it meets the requirements of new energy consumption and energy storage operation strategy [20,21].
The electricity price elasticity matrix can be obtained based on the demand price elasticity coefficient and the electricity price curve in the article [22,23].
M = [ 0.0870 0.0502 0.0201 0.0912 0.0526 0.0211 0.0915 0.0528 0.0211 ]
Time-sharing electricity price segments are divided, electricity price is 0.077 $/(kW·h) in peak hours, like 10:00–14:00 and 19:00–22:00; trough in 0:00–7:00, electricity price is 0.023 $/(kW·h); and, the flat price for the rest of the period is 0.054 $/(kW·h). The life of the all-vanadium flow battery is 10 years and the discount rate is 10%. The conversion factor to the cost of battery storage system is k1 = 0.381 $/kW, k2 = 0.0233 $/kW h, β = 0.13 .
The load curve before and after the system response can be obtained according to the demand side response model combined with the original data, as shown in Figure 4. It can be seen from Figure 4 that after the load response, the load during the peak hour of the electricity price is reduced, and the other periods are improved in some degree. Thanks to the incentive of the demand response, the load fluctuation is reduced, and the peak-to-valley difference of load curve becomes smaller. The following is a study of the impact of demand response on the optimal configuration of microgrid energy storage. The capacity of the system to access wind power is 1 MW and the photovoltaic capacity is 300 kW. The typical daily output data of photovoltaic and wind power are obtained by reference to the operation of wind-solar in this area, as shown in Figure A1 of Appendix A.
The improved particle algorithm was used for analysis in MATLAB. The optimal capacity and rated power and various costs of the VRB before and after the response are obtained. As shown in Table 1 and Table 2, it shows that the total operating cost of BESS reduces after considering the demand response model. Moreover, the capacity and power of the energy storage are also reduced, which is mainly due to the change of the load characteristics after the demand response, the reduction of the power purchase from the upper power grid, and the reduction of the abandoned wind- solar power, so that the energy storage device with smaller capacity and power can be configured. After considering the demand response, the rated power PN of BESS is reduced by 16.7%, the rated capacity EN of BESS is reduced by 10.3%, and the total cost F of BESS is reduced by 20.5% than without considering the demand response.
The state of charge, output characteristics, and efficiency curve can be observed in order to reflect the dynamic characteristics of the battery energy storage system after considering the demand side response, as shown in Figure 5, Figure 6 and Figure 7.
In the Figure 5, Figure 6 and Figure 7, the time period that is marked by the red line segment indicates that the energy storage system is charging and the ‘output power of BESS’ is negative. The time period that is marked by the purple line segment indicates that the energy storage system is discharging, and the ‘output power of BESS’ is positive (the time interval in the simulation results is taken as 0.5 h).
There are a few special time slots here that are not marked on the way. The output power of BESS in the 12 h–12.5 h period is close to 0 and the efficiency is very low. The output power of BESS is positive during the 12.5 h–13 h period, which means that the energy storage system is charging. The output power of BESS in the 13 h–13.5 h period is close to 0 and the efficiency is very low. The output power of BESS is negative during the period of 13.5 h–14 h, which means that the energy storage system is discharging.
As can be seen from Figure 5, Figure 6 and Figure 7, the increase in SOC of the VRB is not linear, because the SOC is limited by charge and discharge power and dynamic efficiency. It can be seen from Figure 7 that the SOC of the BESS changes, and the charging and discharging power is related to the distributed power output and the system load. Meanwhile, SOC reaches the highest point at 0.7. This is because, although the noon load is at the peak, the wind-solar output is also in a peak state, and its increment is larger than the load. It shows that the SOC has not reached the maximum and the lowest point, and the BESS utilization rate has not reached the maximum. However, the energy storage utilization can be improved by changing the energy storage and discharge strategy or improving the wind-solar and load output curves.
The distributed generation (DG) permeability was changed by changing the size of the wind-solar output. The effects of different DG permeability on the energy storage configuration were studied. Table 3 shows the results of the algorithm (the original example DG penetration rate is 27.6%).
As the penetration rate of DG in the distribution network continues to increase, the optimal configuration of BESS capacity and power continues to increase, but there is no fixed pattern of the changes in economic income F. This is because the type of DG in this paper accounts for a large proportion of the wind power, and its output has a reverse load characteristic, that is, during the peak load period, its output is also the smallest, the load is low, and its output is large. In addition, due to the increase of DG output, the wind-solar fluctuations are large, which requires greater energy storage capacity and power balance output, resulting in an optimal configuration of BESS capacity and power as the permeability increases.

7. Conclusions

In this paper, the effects of demand response and energy storage dynamic characteristics on the configuration and operation of microgrid system are studied for the energy storage system with distributed generation and its operation status. The following conclusions are obtained through simulation analysis:
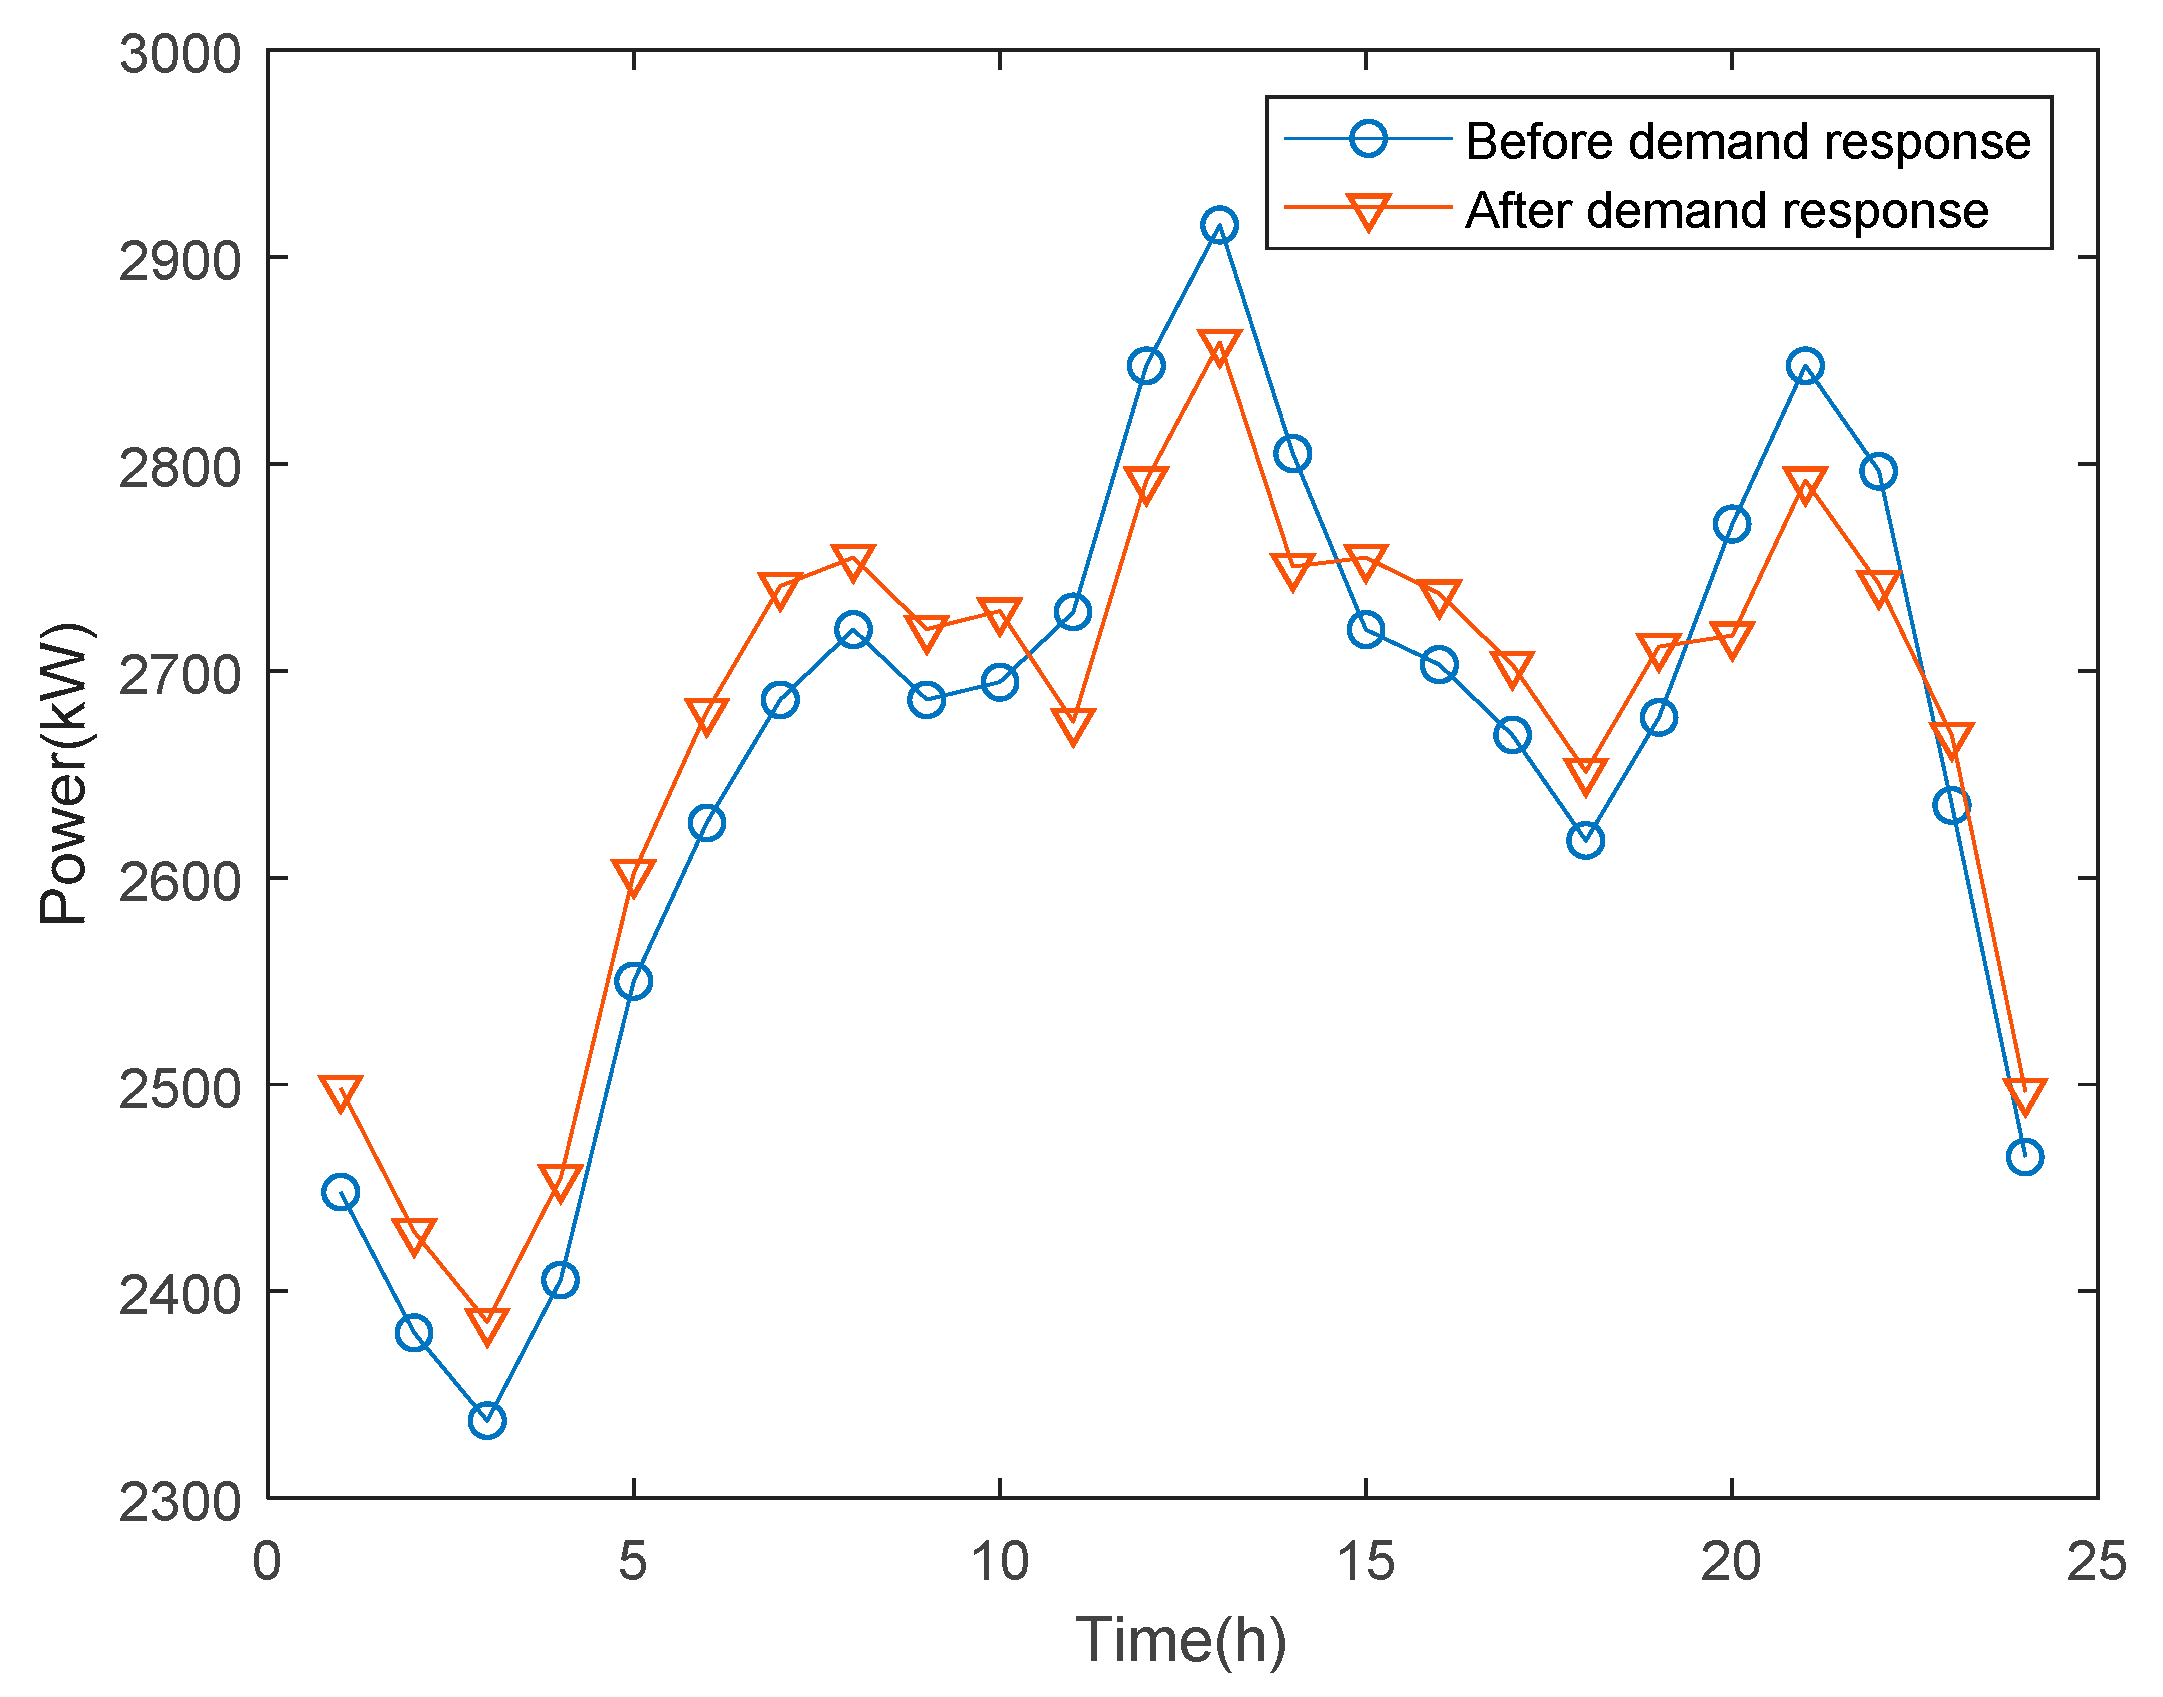
  • When researching the optimal configuration of microgrid energy storage, the optimal configuration of the BESS that considers the demand side response shows that the energy storage optimization configuration is better than the optimization configuration without demand response, and the energy storage power and capacity requirements are lower. After considering the demand response, the rated power PN of BESS is reduced by 16.7%, the rated capacity EN of BESS is reduced by 10.3%, and the total cost F of BESS is reduced by 20.5% than without considering the demand response.
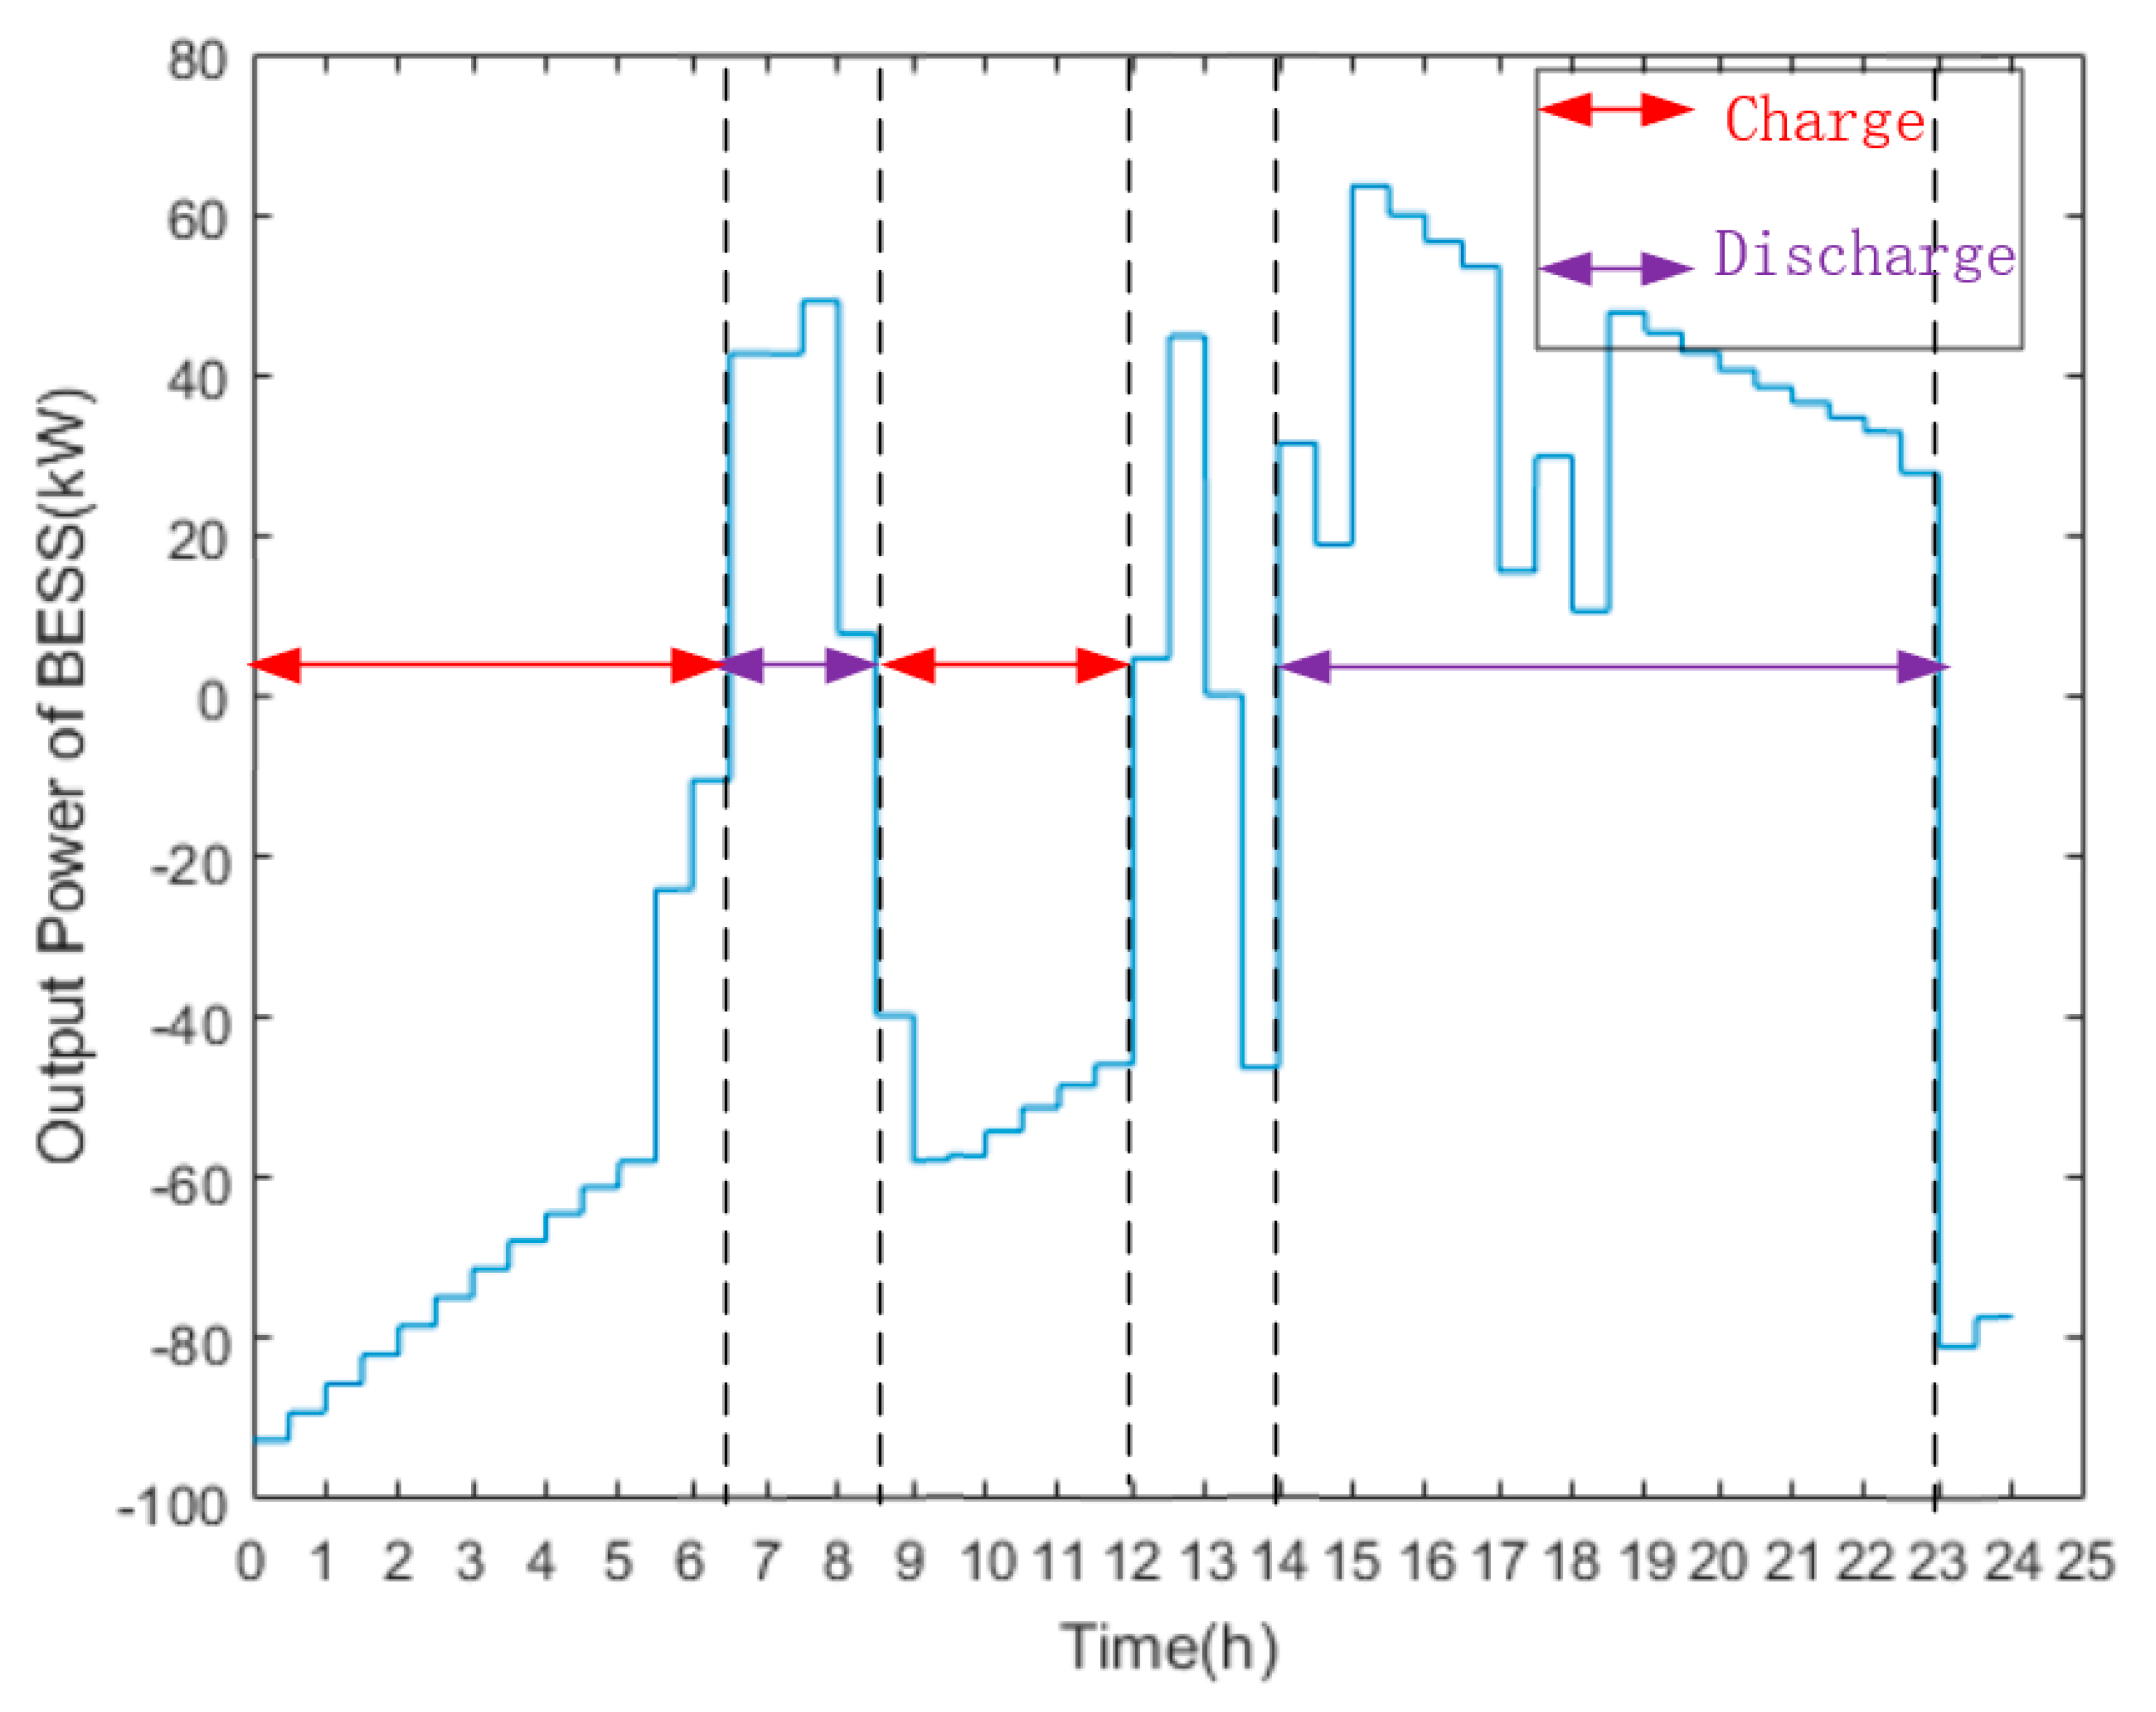
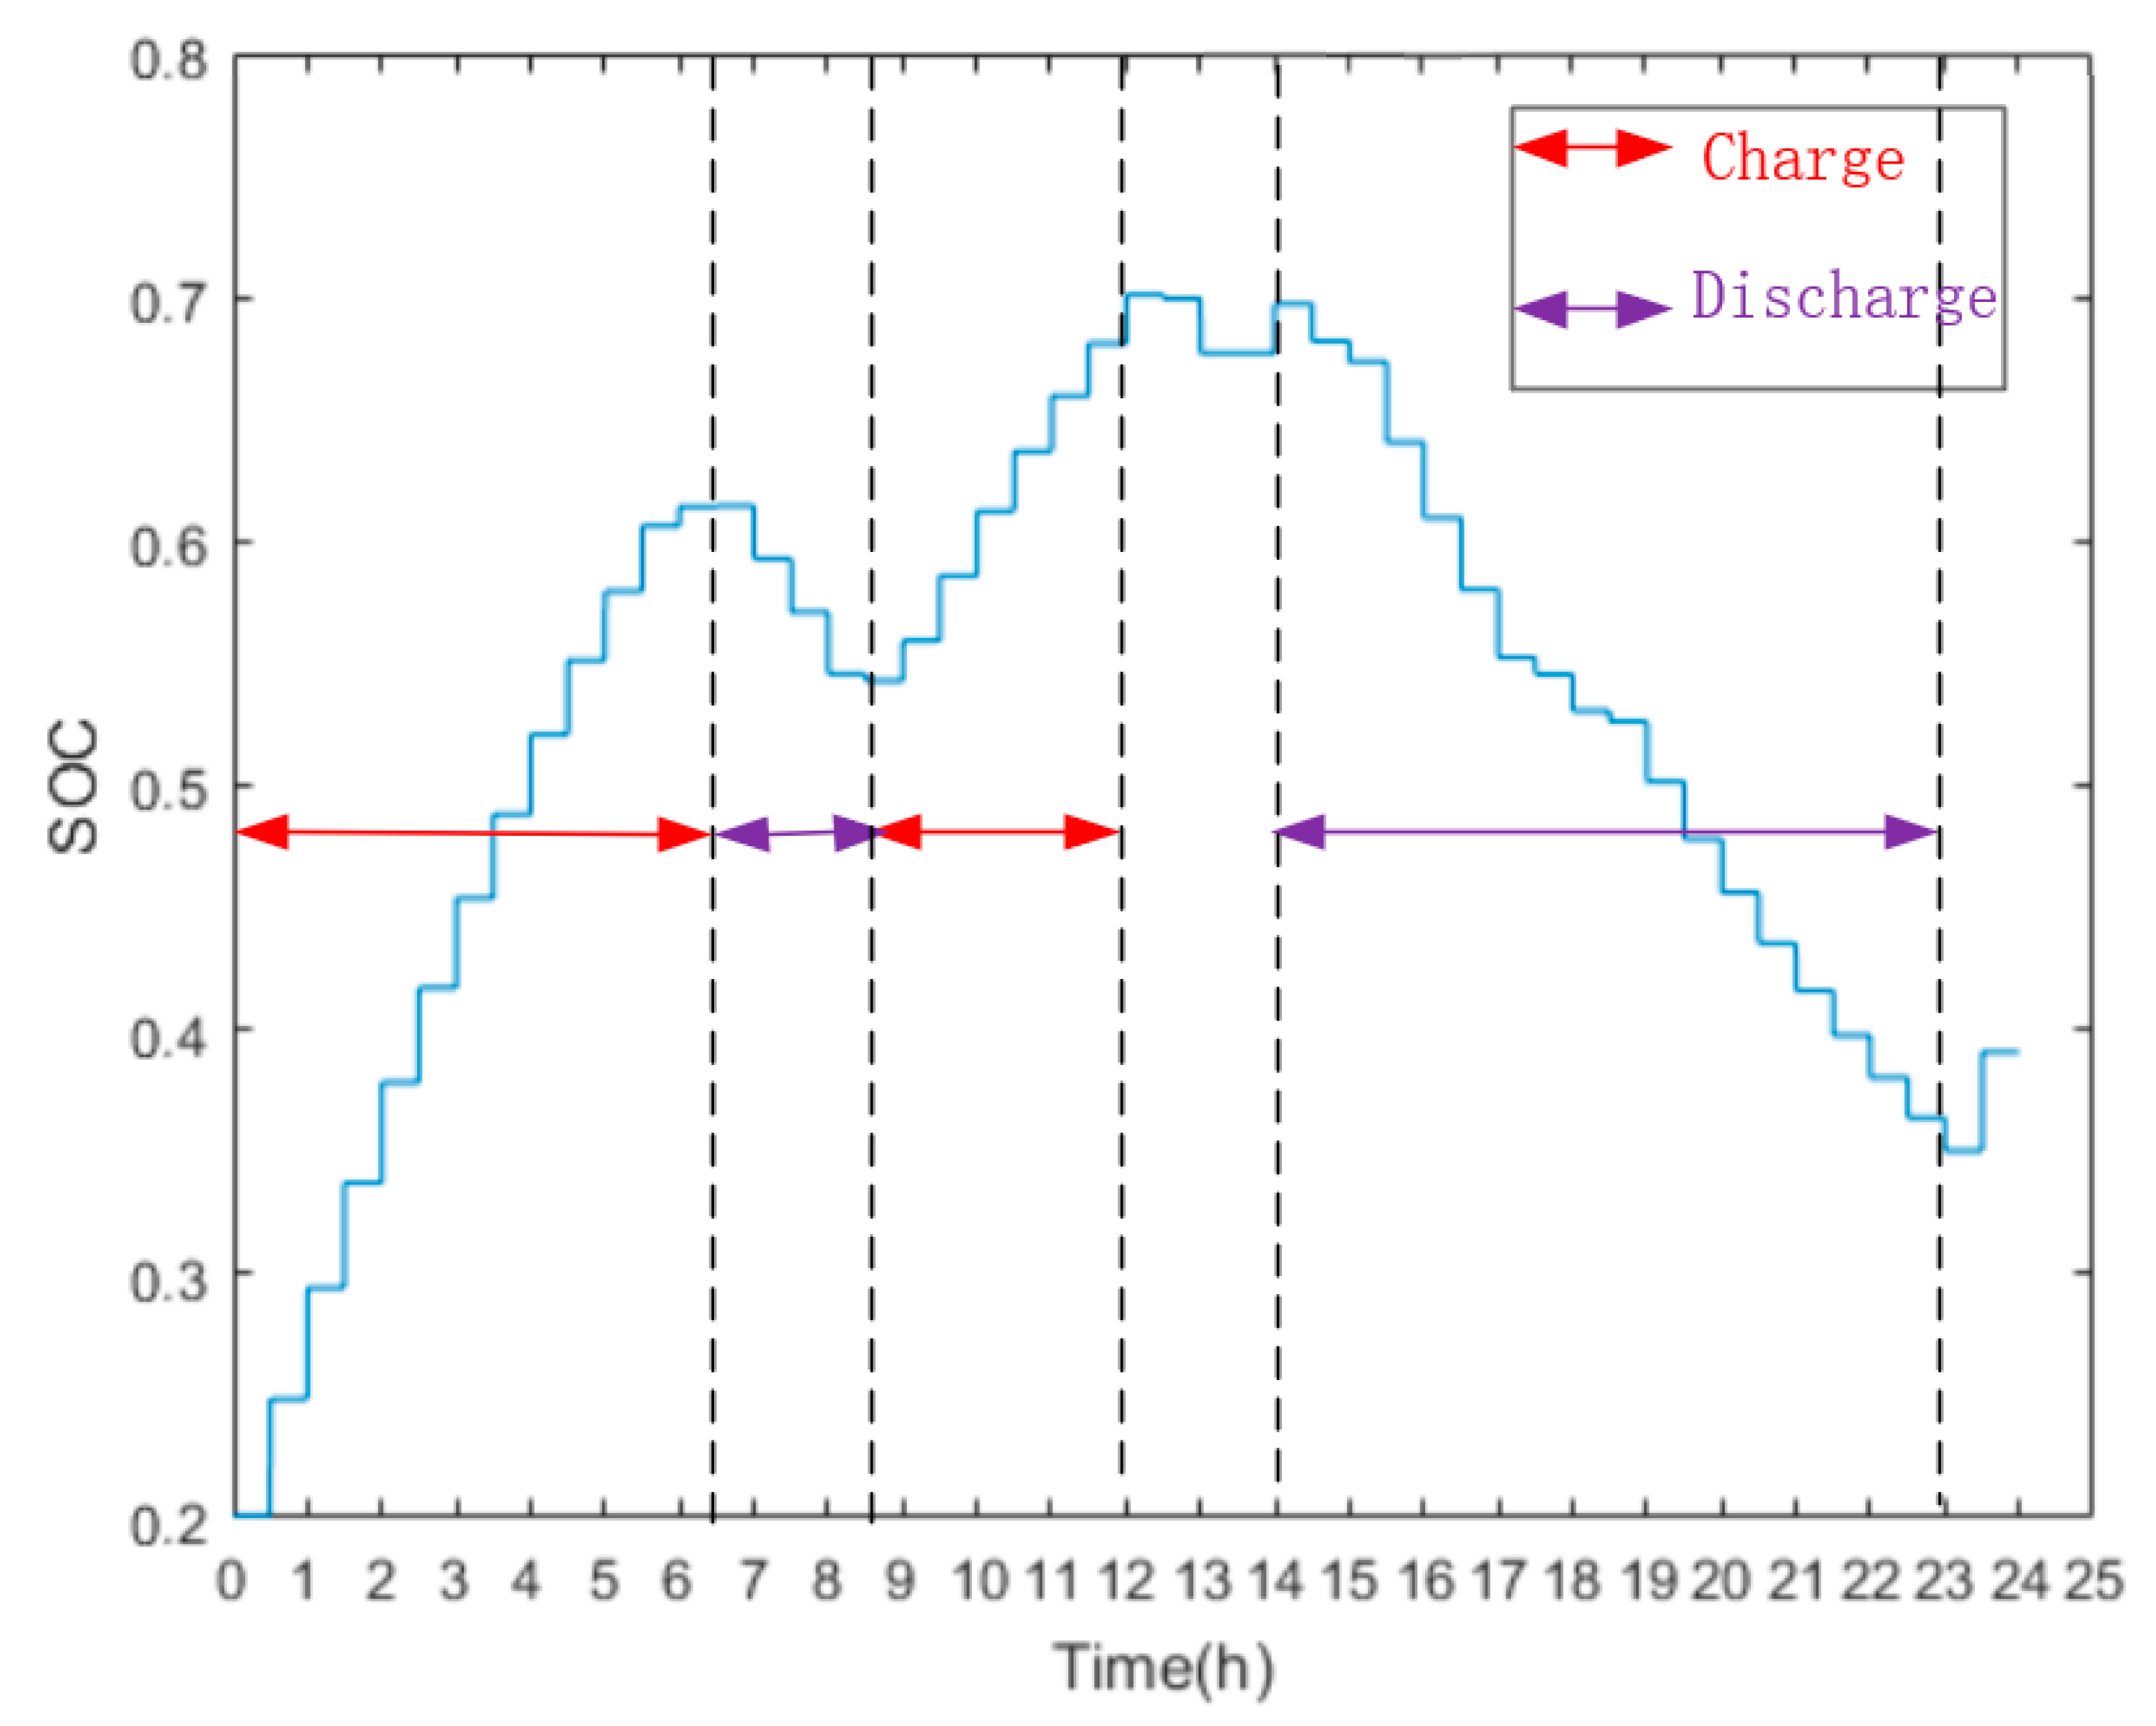
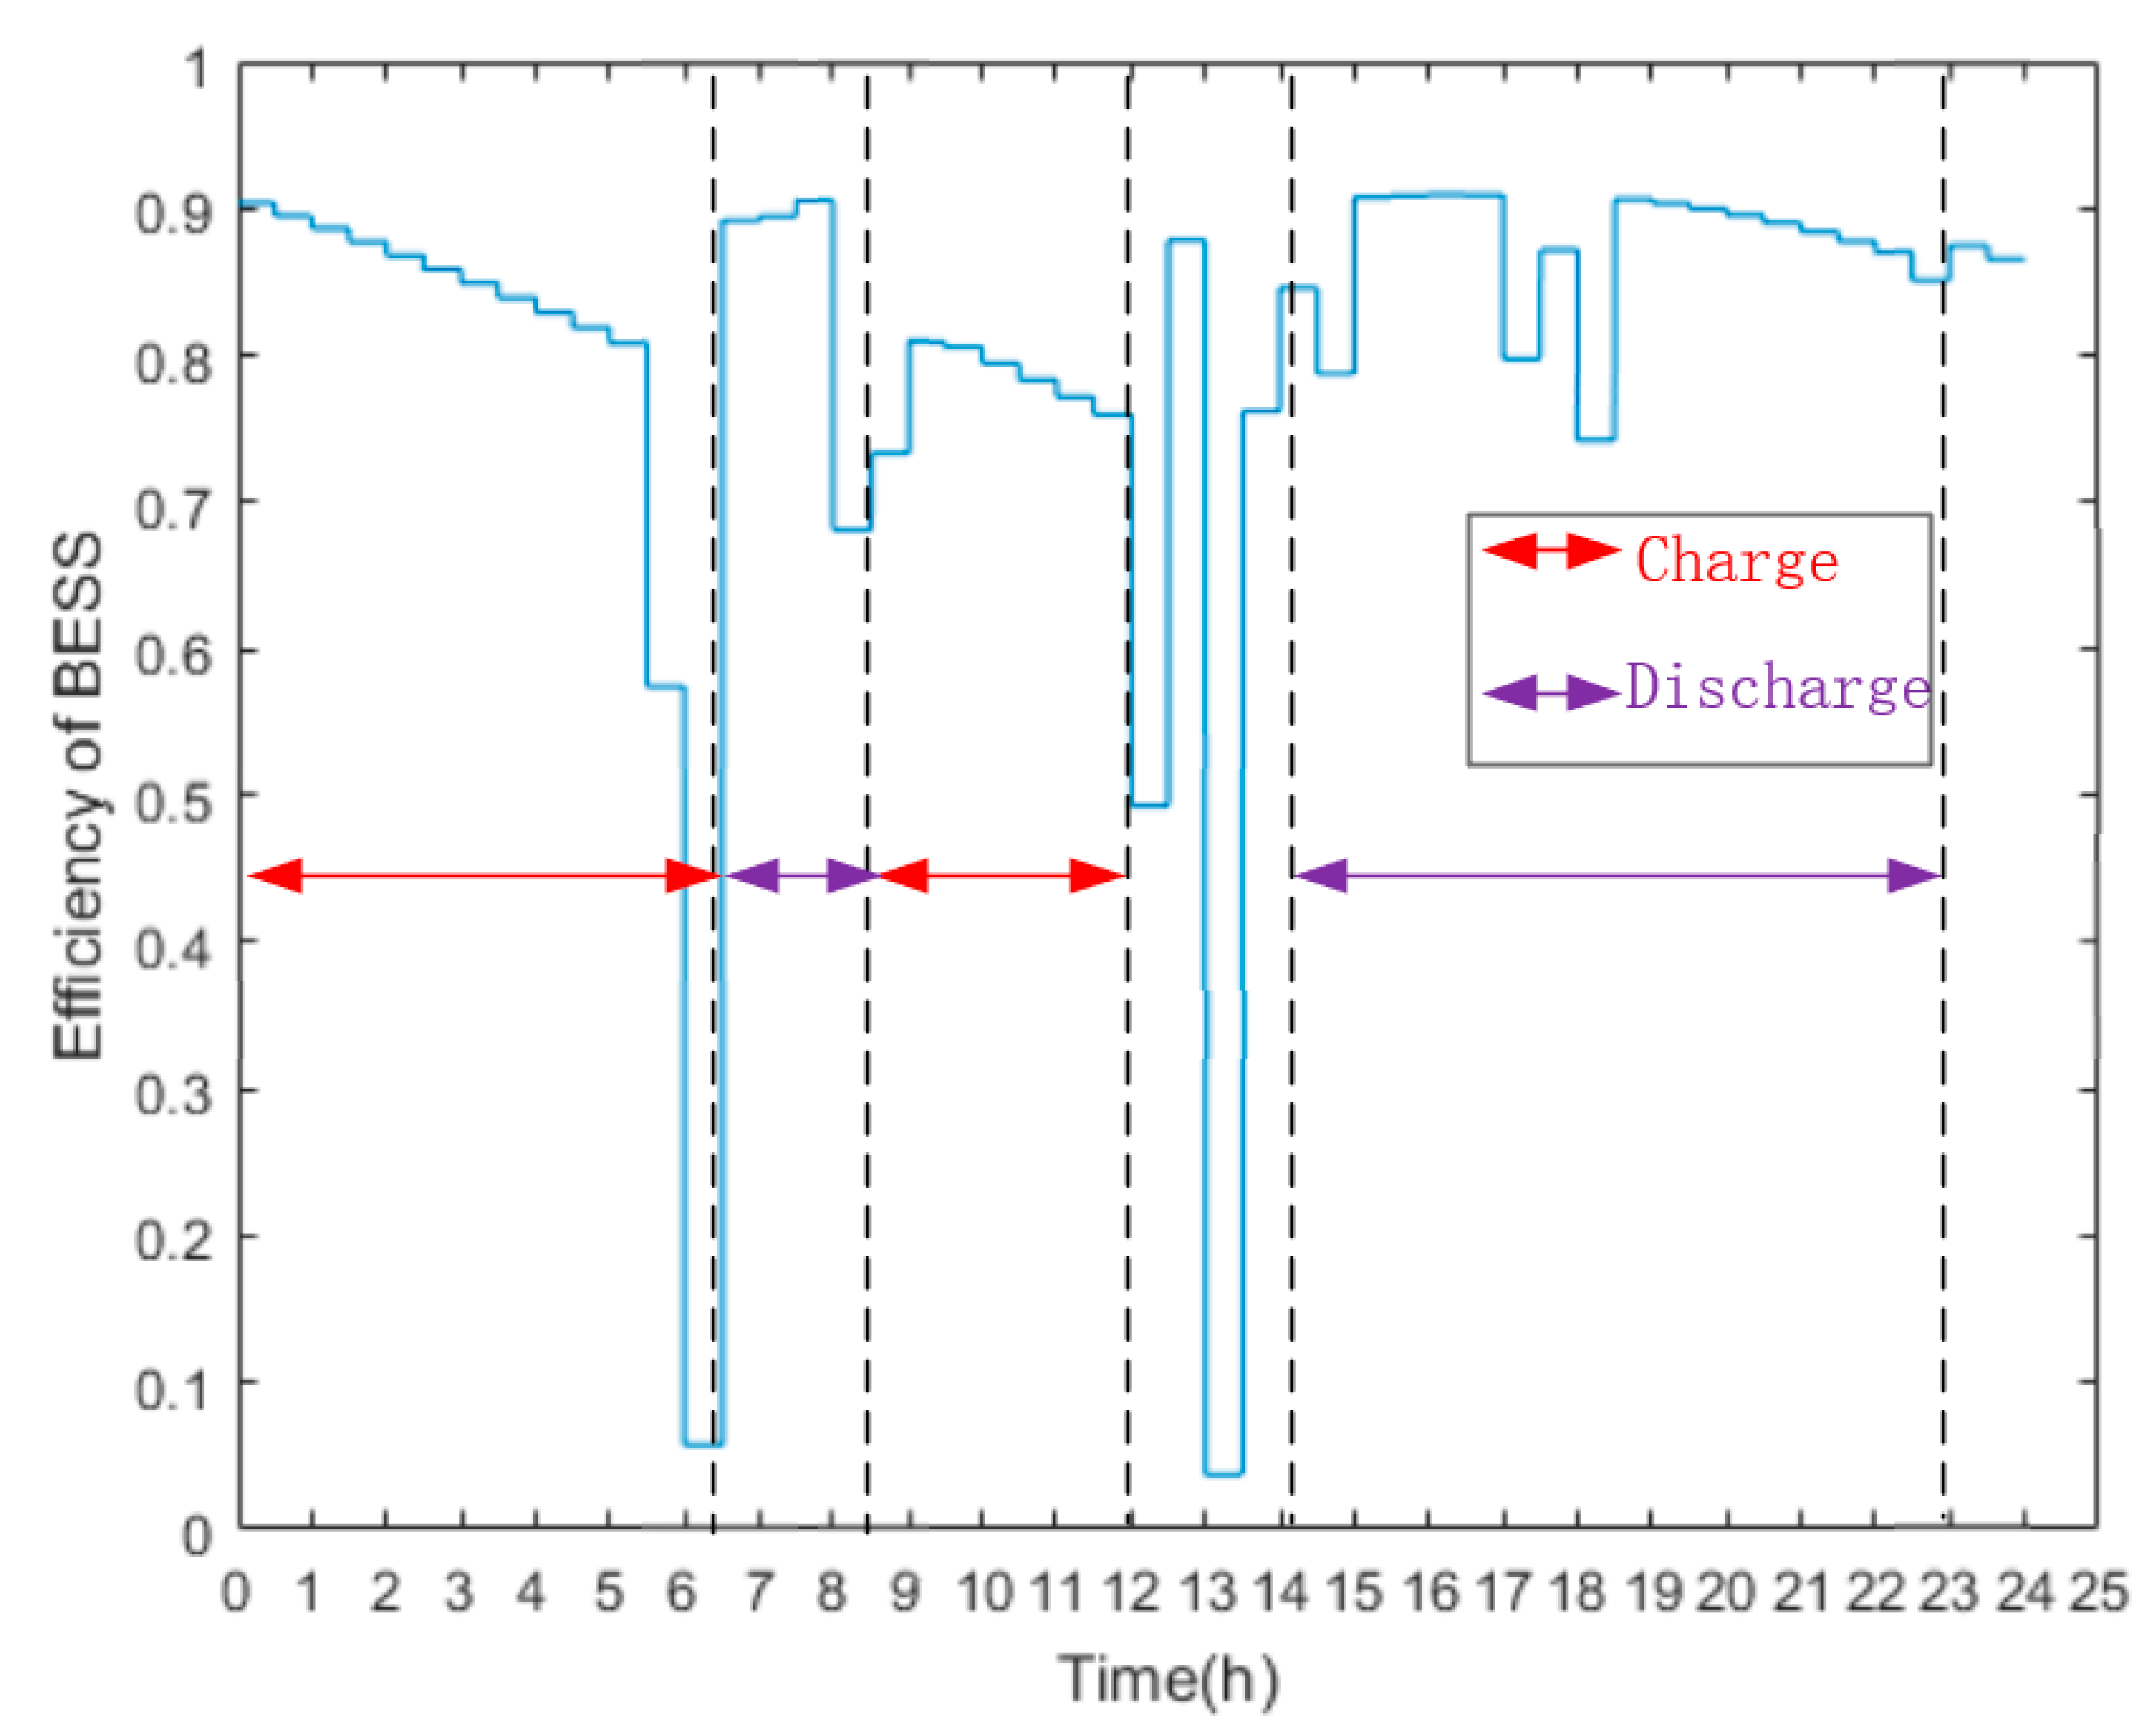
  • After considering the demand response, the operating efficiency of the energy storage system is basically maintained above 0.8, which indicates that the flow battery has higher energy storage operating efficiency. However, the energy storage system is underutilization. It can be improved by adjusting the load and the distributed generation output, so that the energy storage can be smoothly charged and discharged.
  • With the increase of DG permeability, the optimal configuration of BESS capacity and power is increasing, and the cost is continuously reduced. This is because DG has a reverse load characteristic and the output fluctuation increases with the permeability.

Author Contributions

Conceptualization, Q.G.; Data curation, J.F. and D.L.; Formal analysis, J.F.; Methodology, J.F.; Resources, H.Q.; Validation, J.F.; Writing-original draft, H.Z. and H.H.; Writing-review & editing, J.F. and S.T.

Funding

This work is supported by the National Key R & D Program of China (Technology and application of wind power/photovoltaic power prediction for promoting renewable energy consumption, 2018YFB0904200) and the eponymous Complement S & T Program of State Grid Corporation of China (SGLNDKOOKJJS1800266).

Conflicts of Interest

The authors declare no conflict of interest.

Appendix A

Table A1. Fitting parameters of charge-discharge efficiency η.
Parametersaibicidi
i
c−0.1281.050.0380.118
d1.03340.34540.1192
Table A2. Fitting parameters of charge-discharge absorption power Pab.
Parameters a a b i b a b i c a b i
i
c0.57150.4605−1.0321
d0.16860.8553−0.0238
Figure A1. Typical output curve of distributed power.
Processes 07 00483 g0a1

References

  1. Zhang, Q.; Wang, X.F.; Wang, J.X. Survey of demand response research in deregulated electricity markets. Autom. Electr. Power Syst. 2008, 32, 97–106. [Google Scholar]
  2. Zhai, L.W.; Qin, C.; Wu, H.L. Stochastic Optimal Scheduling Model for Wind Power Consumption with Multi-Type Demand Response. Power Syst. Technol. 2015, 39, 1846–1939. [Google Scholar]
  3. Aalami, H.A.; Moghaddam, M.P.; Yousefi, G.R. Modeling and prioritizing demand response programs in power markets. Electr. Power Syst. Res. 2010, 80, 426–435. [Google Scholar] [CrossRef]
  4. Li, L.Y.; Hu, B.; Xie, K.G. Optimal configuration of hybrid energy storage for island-type microgrid based on discrete Fourier transform. Autom. Electr. Power Syst. 2016, 40, 108–116. [Google Scholar]
  5. Wu, X.G.; Liu, Z.Q.; Tian, L.T. Study on Energy Storage Location and Fixed Volume of Distribution Network Based on Improved Multi-Objective Particle Swarm Optimization Algorithm. Power Syst. Technol. 2014, 38, 3408–3410. [Google Scholar]
  6. Jing, Z.X.; Hu, R.X.; Yuan, Z.X. Optimal configuration of island microgrid with wind/light/pumped energy storage and load response. Autom. Electr. Power Syst. 2017, 41, 65–72. [Google Scholar]
  7. Li, X.L.; Yan, G.F.; Ji, Y.Q. Joint Optimization Planning of Energy Storage and Demand Side Response in Active Distribution Network. Power Syst. Technol. 2016, 40, 199–206. [Google Scholar]
  8. Zhang, X.D.; Wang, W.; Wu, W. Robust optimization model for network loss cost of active distribution network considering uncertainty of electricity price. Electr. Power Autom. Equip. 2017, 37, 131–138. [Google Scholar]
  9. Alvaro, C.; Brito, F.P.; Martins, J. Assessment of the use of vanadium redox flow batteries for energy storage and fast charging of electric vehicles in gas stations. Energy 2016, 115, 1478–1494. [Google Scholar]
  10. Zhang, Y.B.; Ren, S.H.; Yang, X.D. Optimal configuration of independent microgrid considering price-type demand response. Electr. Power Autom. Equip. 2017, 37, 55–62. [Google Scholar]
  11. Li, C.Y.; Xu, Z.; Ma, Z.Y. Time-of-use electricity price optimization model considering demand response of user. Proc. CSU EPSA 2015, 27, 11–16. [Google Scholar]
  12. Chen, Y.Y.; Hu, B.; Xie, K.G. The peak-to-valley time-of-use price model for power system reliability and power purchase risk. Power Syst. Technol. 2014, 38, 141–2148. [Google Scholar]
  13. Zhang, Y.; Dong, Z.Y.; Luo, F.; Zheng, Y.; Meng, K.; Wong, K.P. Optimal allocation of battery energy storage systems in distribution networks with high wind power penetration. IET Renew. Power Gener. 2016, 10, 1105–1113. [Google Scholar] [CrossRef]
  14. Tu, A.N.; Crow, M.L.; Elmore, A.C. Optimal Sizing of a Vanadium Redox Battery System for Microgrid Systems. IEEE Trans. Sustain. Energy 2015, 6, 729–737. [Google Scholar]
  15. He, G.; Chen, Q.; LKang, C. Optimal operating strategy and revenue estimates for the arbitrage of a vanadium redox flow battery considering dynamic efficiencies and capacity loss. IET Gener. Transm. Distrib. 2016, 10, 1278–1285. [Google Scholar] [CrossRef]
  16. Tu, A.N.; Xin, Q. Performance Characterization for Photovoltaic-Vanadium Redox Battery Microgrid Systems. IEEE Trans. Sustain. Energy 2014, 5, 1379–1388. [Google Scholar]
  17. Wang, L.J.; Wang, W.; Chen CDong, X.J. Multi-objective Optimization Configuration of Distributed Power Supply Considering Operational Risk. Electr. Power Syst. Autom. 2015, 27, 22–24. [Google Scholar]
  18. Hu, X.T.; Liu, T.Q.; He, C. Multi-objective optimization operation of microgrid considering battery loss characteristics. Proc. CSEE 2016, 36, 2674–2681. [Google Scholar]
  19. Peng, G.B.; Zhan, H.X.; Huang, P.D. Optimization of static voltage stability improvement strategy for distribution network based on adaptive particle swarm optimization algorithm. Power Syst. Prot. Control 2017, 45, 100–106. [Google Scholar]
  20. Liu, W.; Niu, S.Y.; Shi, D.G. Optimal allocation of ADS battery energy storage considering operation strategy and investment subject benefit. Power Syst. Technol. 2015, 39, 2697–2704. [Google Scholar]
  21. Li, X.L. Integrated optimal planning of energy storage and demand side response in active power distribution network. Power Syst. Technol. 2016, 40, 3803–3810. [Google Scholar]
  22. Zhou, N. Battery storage multi-objective optimization for capacity configuration of PV-Based microgrid considering demand response. Power Syst. Technol. 2016, 40, 1709–1716. [Google Scholar]
  23. Qin, Y.F.; Yue, S.M.; Yu, X.X. Price elasticity matrix of demand in current retail power market. Autom. Electr. Power Syst. 2004, 28, 16–19. [Google Scholar]
Figure 1. Energy storage of vanadium redox flow battery battery system operation strategy.
Processes 07 00483 g001
Figure 2. Improved particle swarm optimization algorithm flow.
Processes 07 00483 g002
Figure 3. Typical structure diagram of PV and wind power-based microgrid.
Processes 07 00483 g003
Figure 4. Load curve before and after demand response.
Processes 07 00483 g004
Figure 5. State of the energy storage system.
Processes 07 00483 g005
Figure 6. Output characteristic curve of VRB.
Processes 07 00483 g006
Figure 7. Output efficiency curve of VRB.
Processes 07 00483 g007
Table 1. Optimal power, capacity, and total cost before and after demand response.
PN/kWEN/(kW·h)F/$
Before demand response198147330.18
After demand response165132123.98
Table 2. Costs before and after demand response.
Ctol/$Bdirl/$Cpvl/$
Before demand response273.66345.31101.83
After demand response260.12307.4371.29
Table 3. Influence of different permeability of DG on energy storage configuration.
DGEN/(kW·h)PN/kWF/$
0.1105612227.337
0.2120813925.766
0.276132116523.980
0.3146419921.670
0.4145021323.826
0.5164725022.585

