Article

PEM Fuel Cell Voltage Neural Control Based on Hydrogen Pressure Regulation

by
Andrés Morán-Durán
,
Albino Martínez-Sibaja
*,
José Pastor Rodríguez-Jarquin
,
Rubén Posada-Gómez
and
Oscar Sandoval González
Division of Postgraduate and Research studies, Tecnológico Nacional de México/Instituto Tecnológico de Orizaba, Orizaba, Veracruz 92670, México
*
Author to whom correspondence should be addressed.
Processes 2019, 7(7), 434; https://doi.org/10.3390/pr7070434
Submission received: 30 May 2019 / Revised: 23 June 2019 / Accepted: 24 June 2019 / Published: 10 July 2019
(This article belongs to the Special Issue Optimization for Control, Observation and Safety)

Abstract

:
Fuel cells are promising devices to transform chemical energy into electricity; their behavior is described by principles of electrochemistry and thermodynamics, which are often difficult to model mathematically. One alternative to overcome this issue is the use of modeling methods based on artificial intelligence techniques. In this paper is proposed a hybrid scheme to model and control fuel cell systems using neural networks. Several feature selection algorithms were tested for dimensionality reduction, aiming to eliminate non-significant variables with respect to the control objective. Principal component analysis (PCA) obtained better results than other algorithms. Based on these variables, an inverse neural network model was developed to emulate and control the fuel cell output voltage under transient conditions. The results showed that fuel cell performance does not only depend on the supply of the reactants. A single neuro-proportional–integral–derivative (neuro-PID) controller is not able to stabilize the output voltage without the support of an inverse model control that includes the impact of the other variables on the fuel cell performance. This practical data-driven approach is reliably able to reduce the cost of the control system by the elimination of non-significant measures.

1. Introduction

The constant increase in energy consumption, environmental issues, and the rapid exhaustion of fossil fuel reservoirs have motivated researchers around the world to design renewable solutions to this global challenge [1]. Hydrogen is a potential energy renewable source, and it could be the clean fuel of the future [2]; its main characteristics are as follows:
  • Hydrogen has the highest energy content per unit weight (142 kJ g−1) [3];
  • It is a carbon-free fuel due to its combustion product being water [4];
  • Hydrogen can be used as a direct fuel or as an energy carrier for a fuel cell [4].
“One of the most promising hydrogen energy conversion technologies is the fuel cell” [5]. However, fuel cells need an operational control strategy supported by a fault detection and isolation method which can reconfigure the energy system to overcome potential faults and increase both the reliability and useful life of the fuel cell [6].

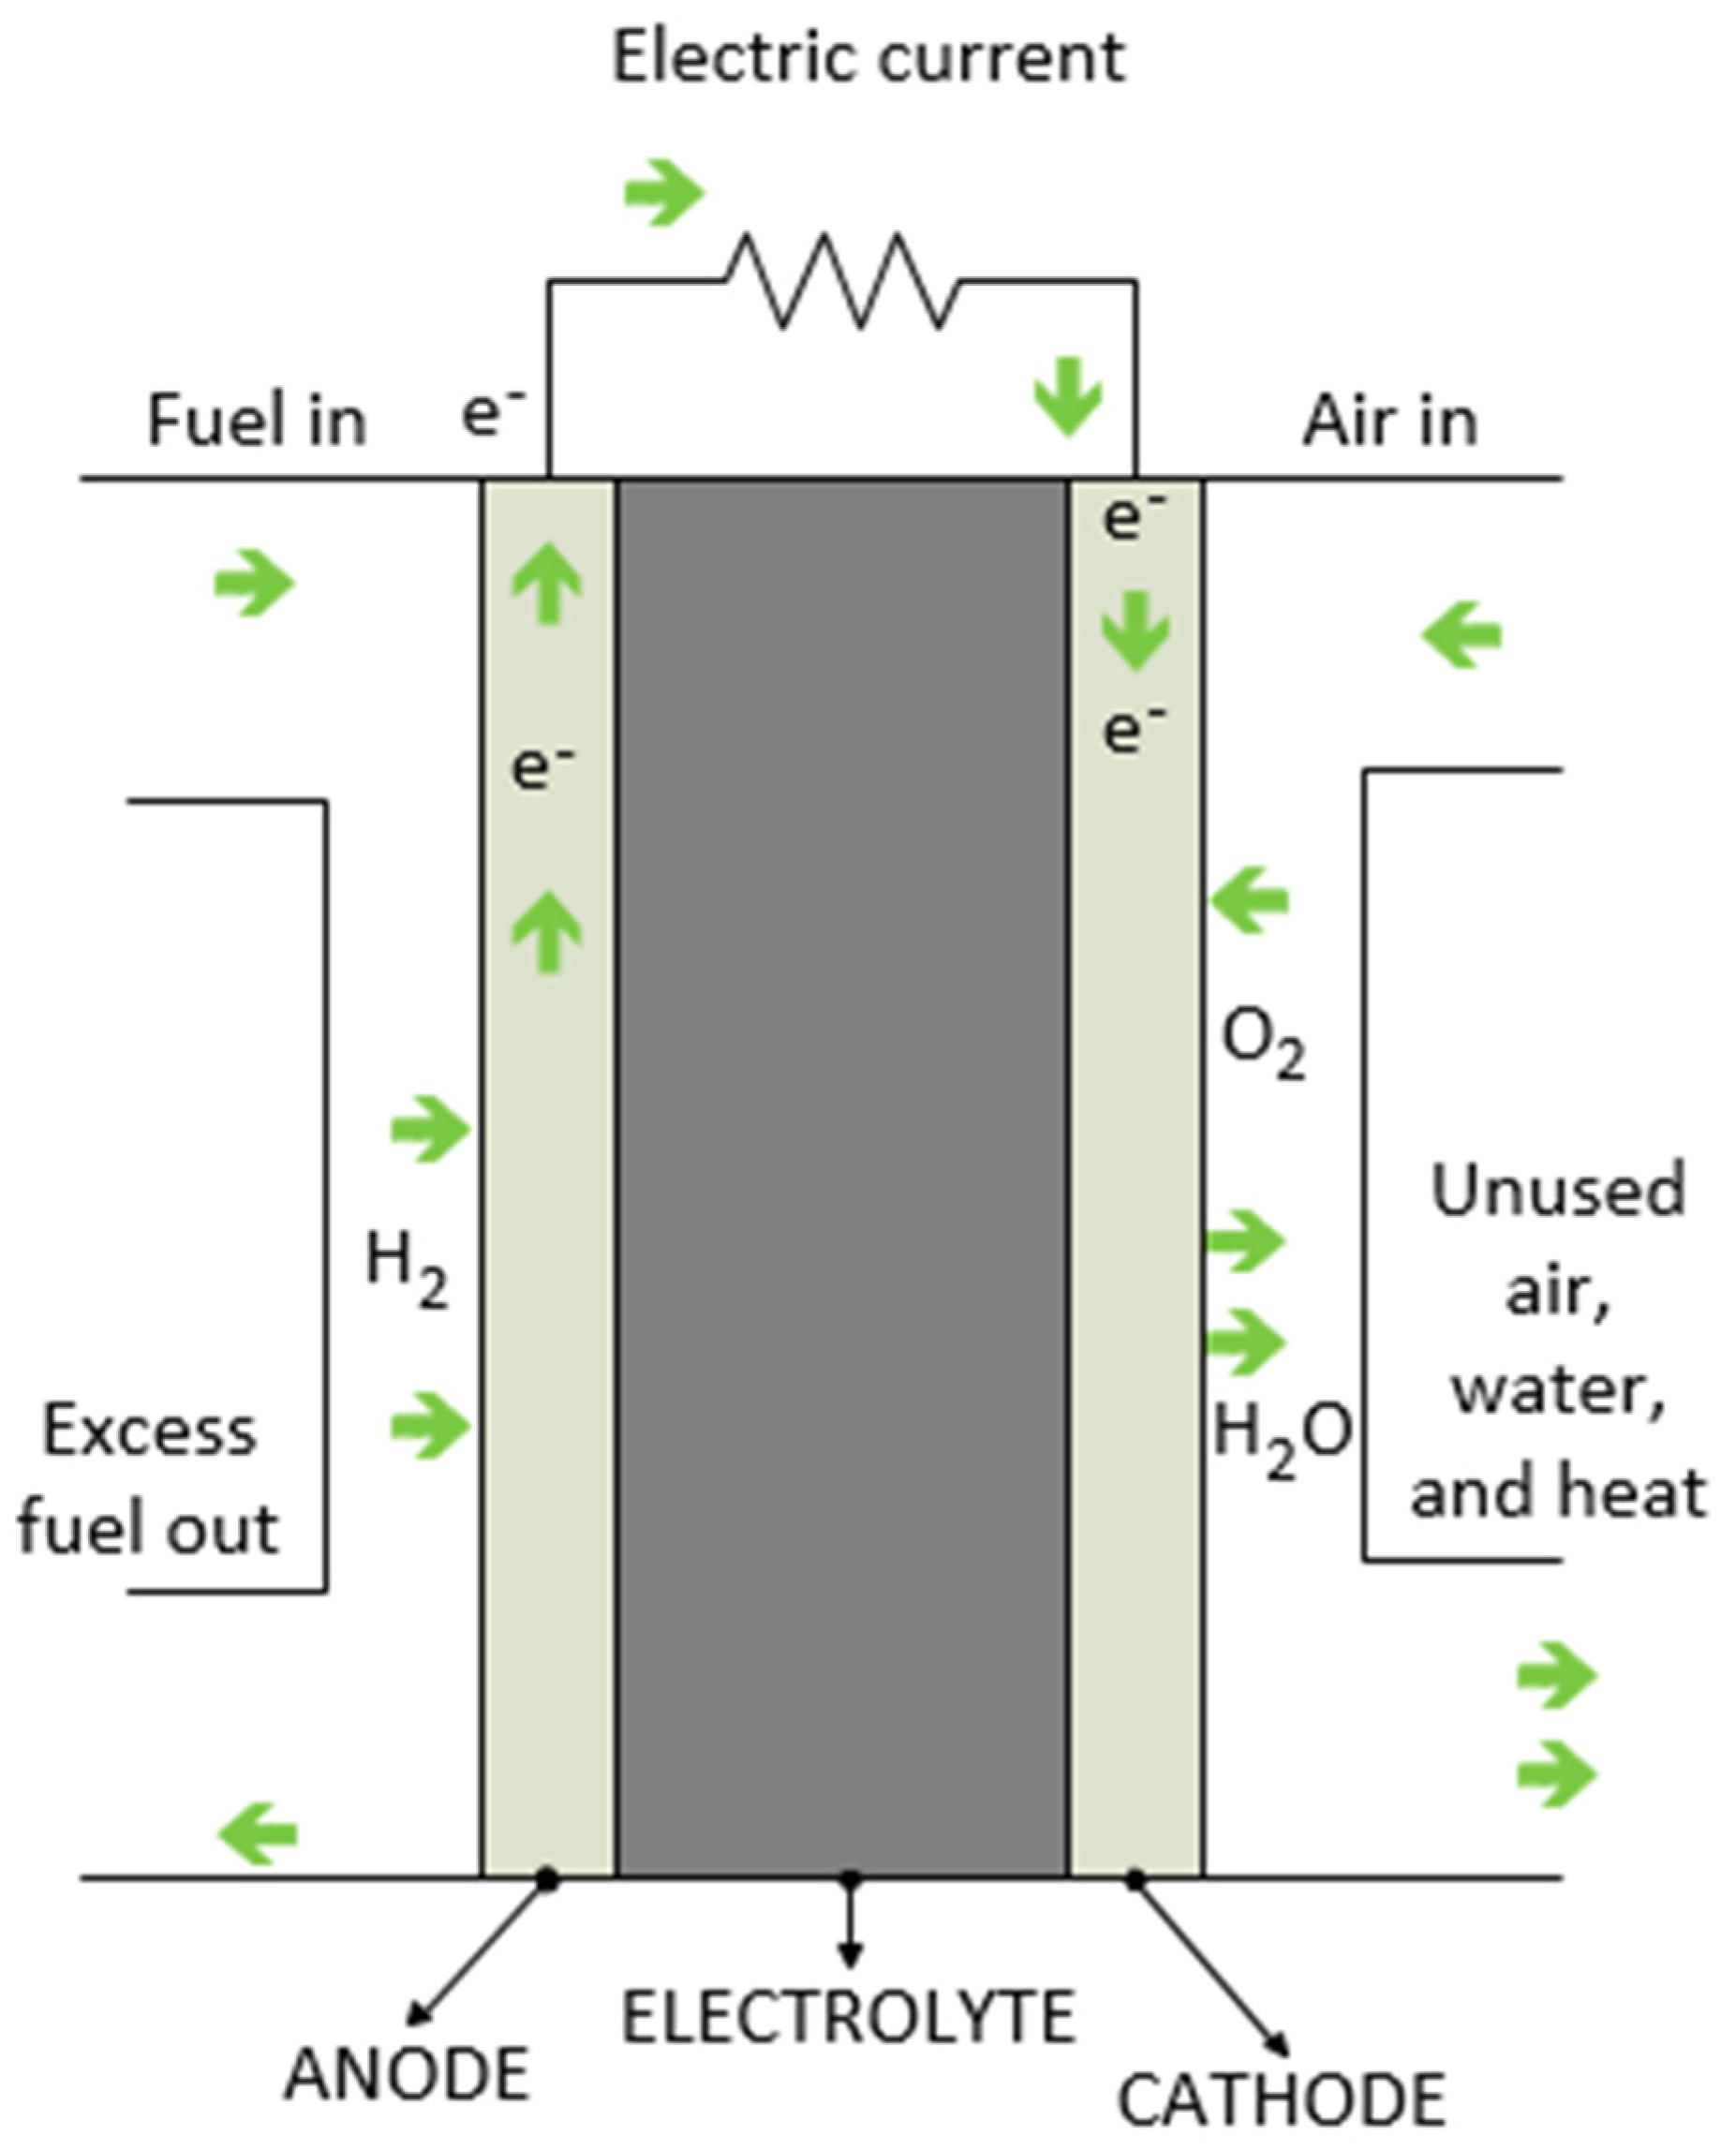
1.1. Fuel Cell Operation Principles

Fuel cells are devices that transform chemical energy into electricity. A fuel stack is made up of a group of single fuel cells placed in series. Each cell is formed by a proton exchange membrane (PEM) placed between two electrodes (anode and cathode) which are coated with a catalyst layer, usually platinum (see Figure 1).
The fuel (hydrogen) is supplied at the anode, and the oxidant (oxygen, generally taken from the air) is supplied at the cathode. At the anode, hydrogen in the presence of a platinum catalyst is ionized into positively charged hydrogen ions and negatively charged electrons. At the cathode, electrons which come from the anode and protons that have crossed the membrane combine with oxygen from the air to form water that flows out of the fuel cell [8,9].
The overall reaction is described as follows.
H y d r o g e n + O x y g e n E l e c t r i c i t y + W a t e r + H e a t

1.2. PEM Fuel Cell System Control

In [10] are mentioned the main components that form a PEM fuel cell system. Below, these four principal sub-systems are described:
  • Reactant Flow Subsystem
This subsystem consists of a hydrogen and air supply loop; its objective is to maintain an adequate stoichiometry of the reactants according to the operating conditions of the cell. The air supply loop in a high-pressure fuel cell system uses a compressor to feed the air, while in a low-pressure system, a low-speed blower is used to feed the air.
  • Temperature Subsystem
A low-power PEM fuel cell only needs a blower to regulate its operation temperature, which is around 80 °C. A high-power fuel cell cannot dissipate heat by air convection and radiation through the surface of the stack; it needs to be cooled down by the flow of deionized water.
  • Water Management Subsystem
The objective of this system is to maintain good hydration of the membrane while balancing the use/consumption of water in the cell. Dry membranes and flooded fuel cells cause high polarization losses.
  • Power Management Subsystem
This subsystem controls the power drawn from the fuel cell stack. The load current is considered as a disturbance that has a direct impact on other subsystems.
If the reactant flow system is controlled correctly, the main variables of the stack, such as the temperature and water concentration, will be indirectly controlled. This subsystem has a major impact on the other subsystems; because of this, its control is critical for the performance of the stack.
Polarization phenomena at the PEM fuel cell reduce the voltage that can be delivered by the system whenever more current is drawn by the load, which may affect the performance of equipment that requires a fixed voltage to work correctly. Therefore, the output voltage of the stack must be controlled by adjusting the flow rates of hydrogen and air. Another option to control the output voltage is by using outside means such as a battery or a supercapacitor or both [7].
The stack must operate with maximum efficiency most of the time to achieve profitable operation. Optimizing the hydrogen supply is a priority control objective to achieve cost-effective operation since, at this moment, the hydrogen production cost is still too high [11].
It is possible that a fixed-parameter electrochemical model does not offer a reliable prediction in transient conditions for a conventional controller. For this reason, systems identification techniques seem to be more appropriate to control complex nonlinear systems.
Following the above mentioned, this paper is focused on the control of the reactant system. It is organized as follows: Section 2 cites works related to the data-driven control of PEM fuel cells. Section 3 describes the dataset characteristics and briefly describes the types of feature selection algorithms and some regression algorithms used for systems modeling. Section 4 presents the results obtained by the application of the algorithms of feature selection and regression, and it also shows the control scheme proposed.

2. Related Works

This section presents papers related to the modeling and control of PEM fuel cells using artificial intelligence techniques. In [12], a methodology was presented for systems identification using NARX (nonlinear autoregressive network with exogenous inputs) and NOE (nonlinear output error) neural networks. The control-oriented black box model obtained was implemented in embedded hardware with limited capacity for memory and processing. In [13], the performance of classical neural network (NN) models and stacked models was compared. The stacking approach using partial least squares as a combining algorithm obtained the best prediction. In [14], the authors compared an NN model against a dynamic model using three statistical indices to validate their performance: the absolute mean error (AME), the root-mean-square error (RMSE), and the standard deviation error (SDE). The maximum value of the three indices indicated that the NN model is more precise and accurate but has bigger variation in predicting the outputs when compared with a dynamic model. Different methods have been tested to construct nonlinear empirical models. In [15], the performance of an artificial neural network (ANN) and a support vector machine (SVM) in predicting fuel cell output voltage was compared. The NN model presented excellent performance in predicting the polarization curves of the stack with R2 = 0.999; the SVM model exhibited a slightly inferior performance with R2 = 0.980. However, Kheirandish et al. [16] proposed a different approach for predicting the performance of an electric bicycle using SVM and ANN. Their results showed that SVM has better accuracy in predicting the power curve, approximately 99%, whereas ANN reached an accuracy of 97%. This difference is mainly due to the selection of the hyperparameters. Parametric neural network (PNN) and group method of data handling (GMDH) techniques were used to predict and control the output voltage of a PEM fuel cell of 25 W. The system inputs were gas pressure, fuel cell temperature, and input current. Both methods presented high accuracy in predicting the voltage. However, the GMDH model had less deviation [17]. Some parameters are difficult to measure, or it is very expensive to measure them, especially in fuel cell stacks. Chávez-Ramírez et al. [18] developed a simulator, based on ANN, to predict the stack voltage and cathode output temperature. They concluded that simulators based on ANN are reliably able to predict voltage and temperature behavior, saving time and resources. Recurrent neural networks were used to develop degradation prognostic models. In [19], a grid long short-term memory (G-LSTM) recurrent neural network (RNN) was used to predict the lifetime of fuel cells.
A detailed description of the neural control techniques applied to PEM fuel cells is provided in [20]. In Figure 2 are shown these different approaches. A feed-forward control system, including a neural network together with a proportional–integral–derivative controller, was presented in [21]. The control objective was maintaining a proper stack voltage using an inverse model of the plant to calculate the control signal (air pressure). In [22], a neural network adaptive control with feedback linearization was developed. The control variables were the pressure values of hydrogen and oxygen. The model presented excellent disturbance rejection, even under load variations.
However, other artificial intelligence techniques have been applied to fuel cell systems to control airflow rate, temperature, and mass flow, among others. In [23], an interval type-2 fuzzy proportional–integral–derivative (IT2FPID) controller was designed to regulate the air flow. The results were compared with those of conventional PID and type-1 fuzzy PID controllers. IT2FPID presented a better performance in terms of transient response. In [24], a fuzzy cognitive map (FCM) was used to model an electric bicycle powered by a fuel cell. The Hebbian algorithm was proposed for the FCM to self-learn from its own data.

3. Materials and Methods

The development stages of the proposed control scheme are described below.
  • Apply a feature selection algorithm to determine the variables needed to model and control the fuel cell voltage;
  • Define the system inputs from the subset formed by the feature selection algorithm and try different regression algorithms to predict the output variable;
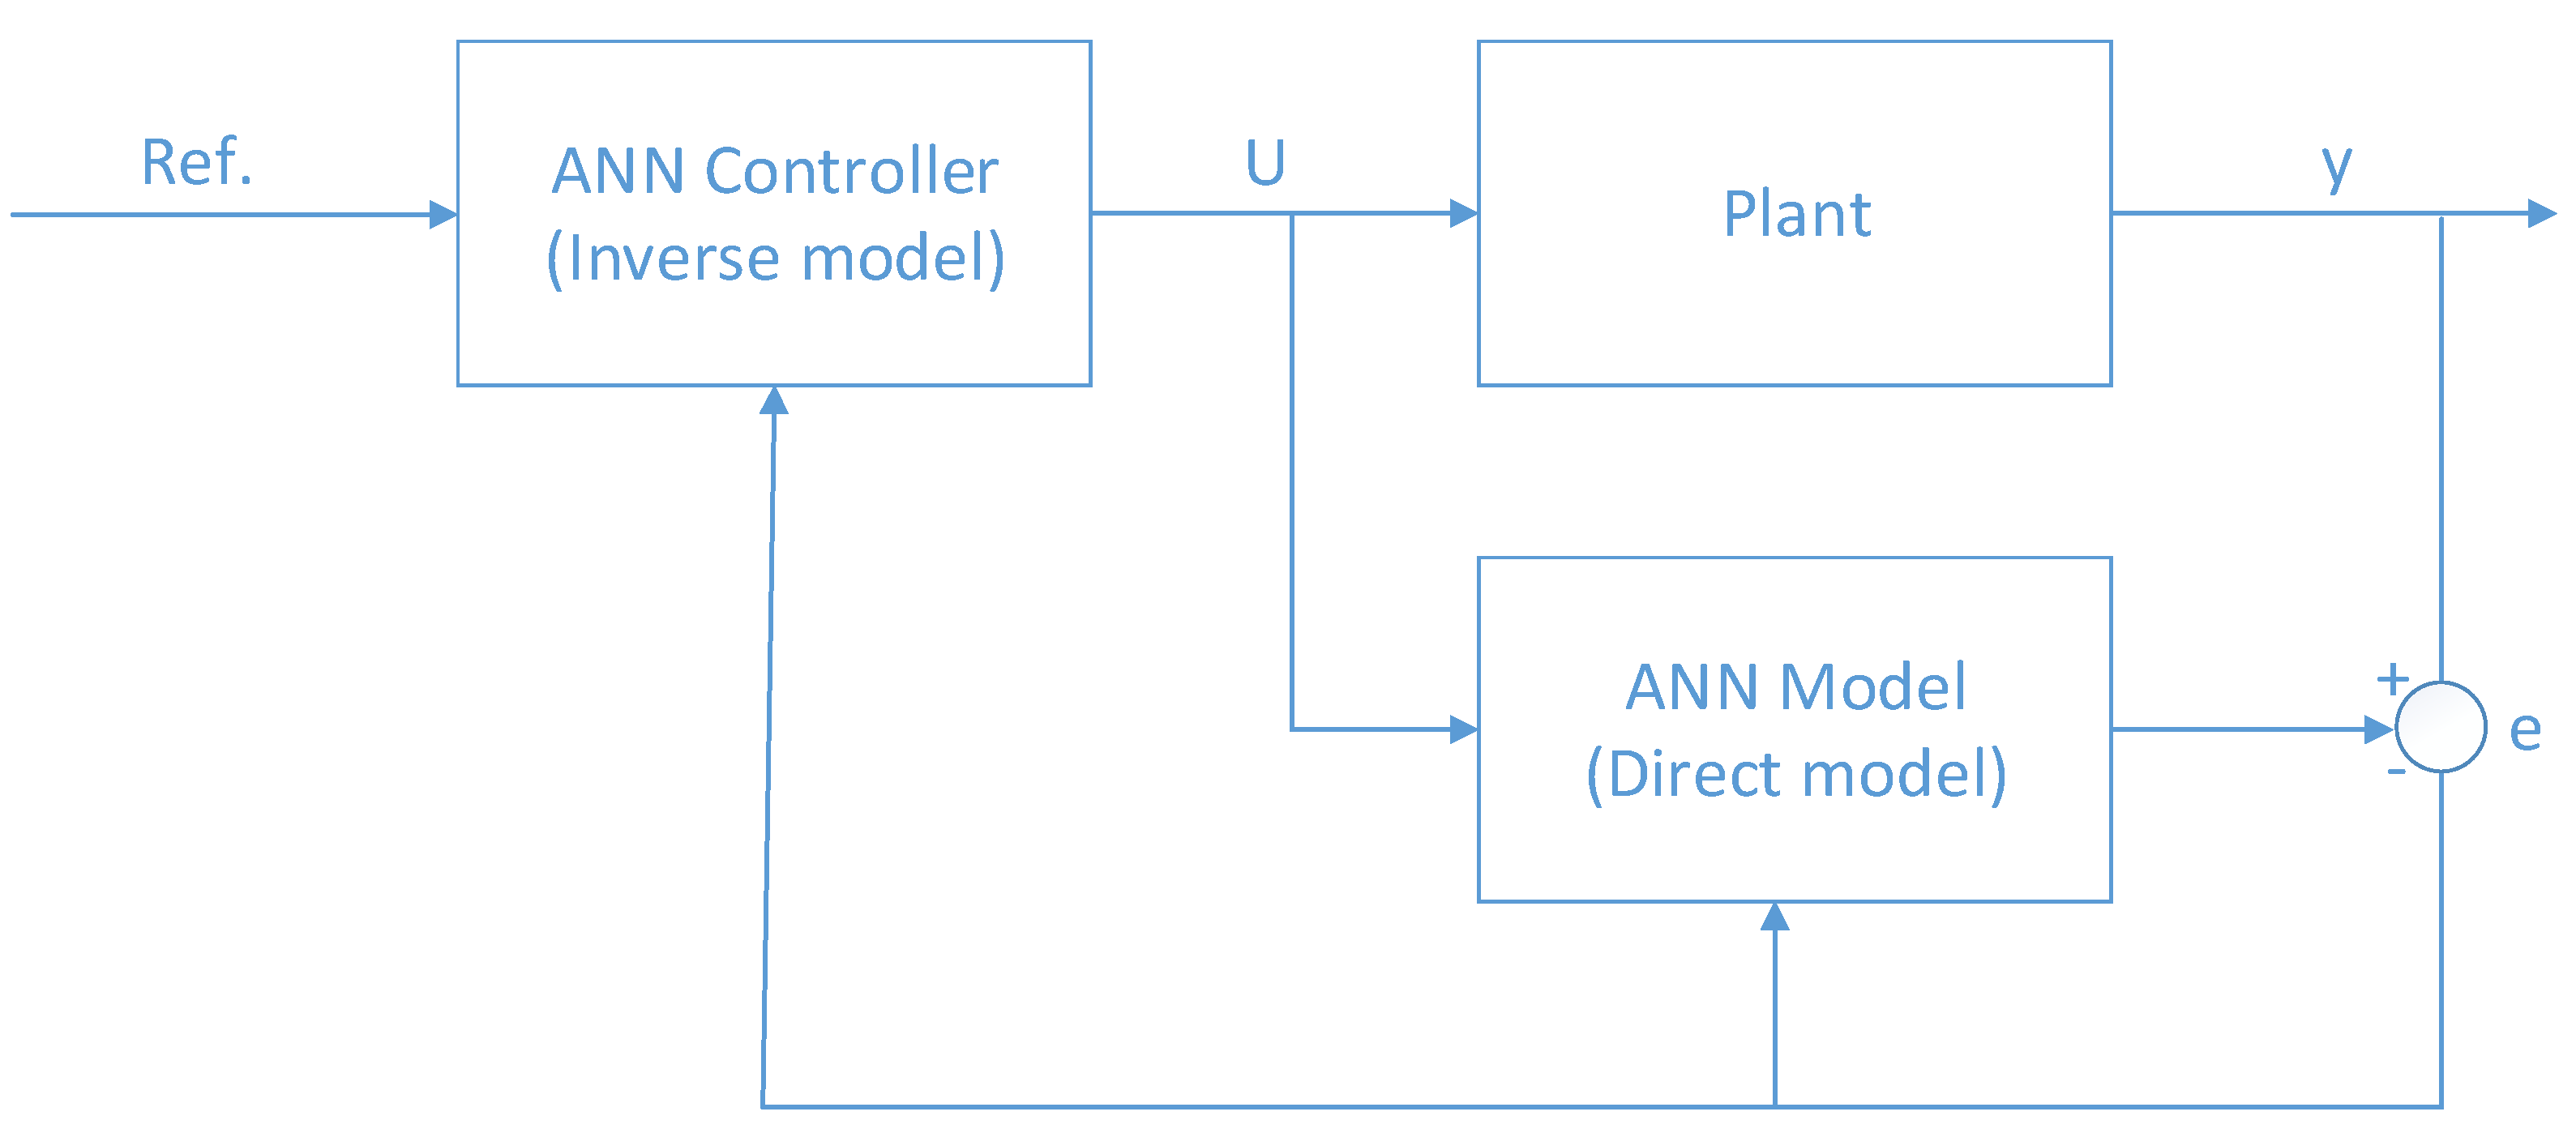
  • Develop the inverse model of the fuel cell, turning the system inputs into outputs. The output of the regression model will become a system input.
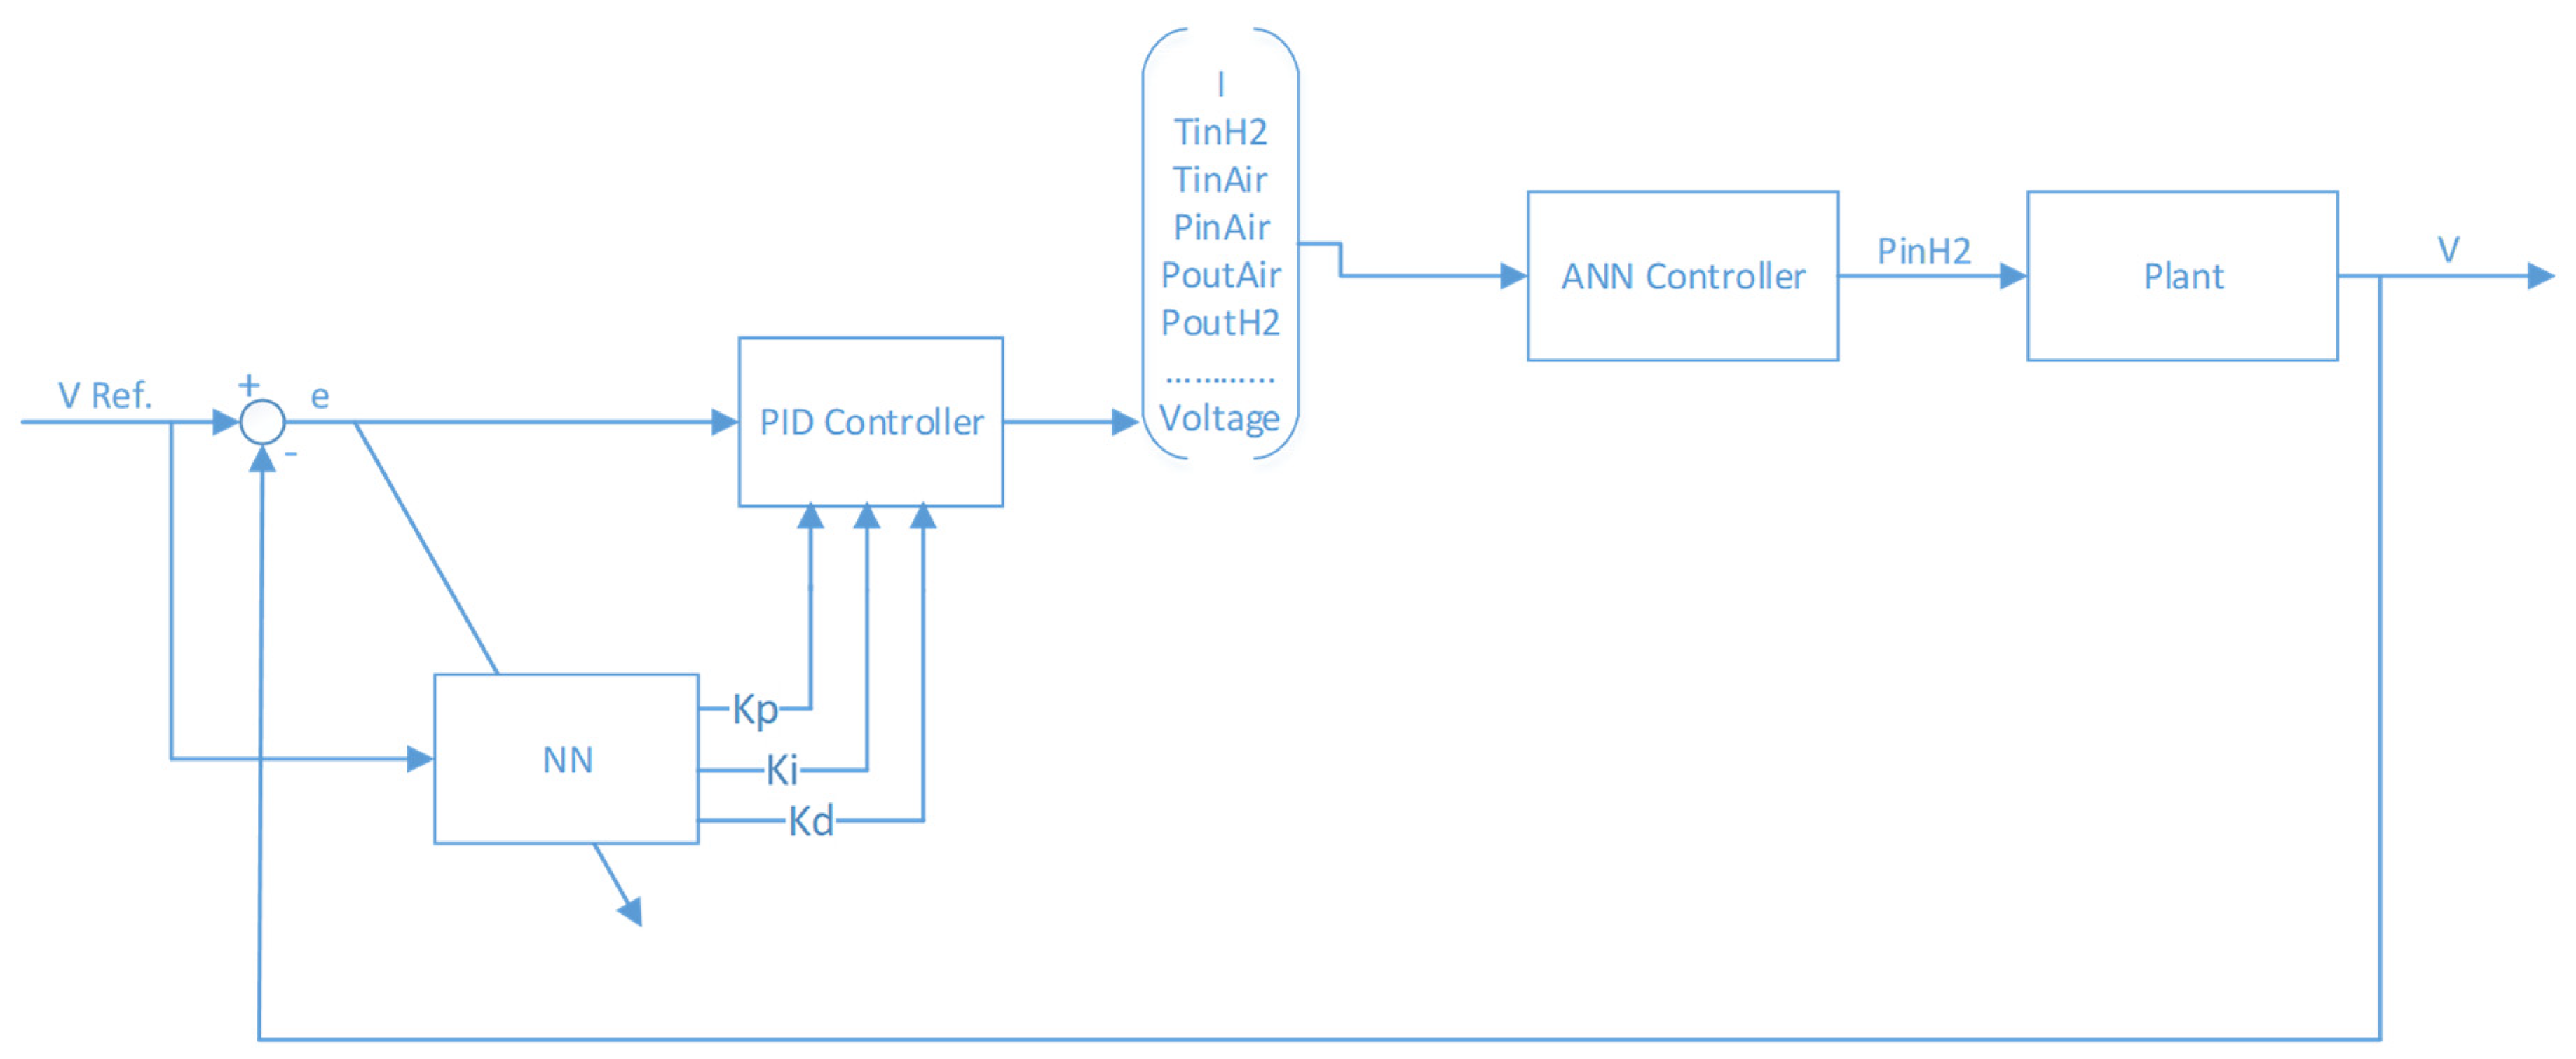
  • Integrate the inverse model with a PID neuro control to track the errors and tune the control signal to achieve the reference value of the system output. The reason why these two types of control are integrated is to modify the control signal by not only considering the error between the output variable and the reference value but also considering the state of the other variables in the transient state.

3.1. Experimental Setup

The proposed approach was applied to the test data from IEEE 2014 [25]. Experiments were carried out on a testbench that allows running the PEM stacks under constant or variable operating conditions while controlling and recording operation data like power loads, temperatures, and stoichiometry rates of hydrogen and air. The variables monitored are presented in Table 1.
The stack was formed by five cells. Each cell had an active area of 100 cm2. The nominal current density of the cells was 0.70 A/cm2, and their maximum current density was 1 A/cm2. The test was carried out under dynamic changes in the load current (around 1020 h). The load current connected was of 70 A with oscillations of 10% at a frequency of 5 kHz. The ranges of the operating parameters are shown in Table 2.

3.2. Feature Selection Algorithms and Data-Driven Models for Fuel Cells

Dimensionality reduction techniques can be classified into two groups: feature selection and feature extraction. Each one has its characteristics, and its accuracy depends on the characteristics of the database to be analyzed. Feature extraction techniques achieve dimensionality reduction by combining the variables. In this way, they can generate a set of new components, reducing the data dimensionality while maintaining enough information to describe the system. In some applications, such as image analysis, where model accuracy is more important than model interpretability, these techniques are very useful. Instead, feature selection reduces data dimensionality by removing irrelevant and redundant variables. Feature selection techniques aim to obtain a subset of variables that describes with accuracy the system characteristics with minimum performance degradation. Feature selection can be grouped into three main categories: Filters, Wrappers, and Embedded. A brief description of their main characteristics is given below:
  • Filter methods measure the relevance of the variables by their correlations with the output variable;
  • Wrapper methods create a subset of the original dataset using a training algorithm;
  • Filter methods are much faster than wrapper and embedded methods;
  • Wrapper methods can fall into overfitting;
  • Embedded and wrapper methods capture feature dependencies while filters methods do not.
The operating principles of PEM fuel cells include electrochemistry and thermodynamics principles that are frequently very hard to model mathematically. One alternative to overcome this issue is the use of modeling methods based on artificial intelligence techniques. In this work, neural networks were used to model and control PEM fuel cells because deep learning techniques, in general, present better performance in modeling highly nonlinear systems than do machine learning algorithms. Section 4.2 compares the performance of different algorithms against dynamic neural networks. These data-driven models can be used as an emulator to detect possible failures in fuel cell systems or to develop an inverse neural control system, as is shown in [26] (see Figure 3).

4. Results and Discussion

For research purposes, all the information collected during the test is useful to understand and improve the material quality and the design performance; these improvements can lead to increasing the lifetime and thus reducing the cost of operation, which at the moment is still too high. However, for control purposes, in real applications, it would be very expensive to install all of these sensors and actuators. The control objective is to identify the critical operating variables and reduce the cost of the control system using Feature Selection.

4.1. Fuel Cell Feature Selection

An attempt was made to train a regression algorithm without applying feature selection. The poor results obtained were due to the noise generated by the low correlation of some variables. This section presents the results of the application of various feature selection algorithms to the original dataset. The best results were obtained using a feature extraction algorithm: PCA analysis. For this reason, Section 4.1.4 was extended to describe how the variables were selected.

4.1.1. Filter Methods

The Pearson correlation method selected the next variables: current, current density, and the output flow rates of hydrogen and air. These variables were selected due to their correlation grades being superior to 0.5. However, although these variables could model the fuel cell voltage, none of them can be considered as a system input useful to controlling the fuel cell.

4.1.2. Wrapper Methods

Two wrapper methods were applied to perform feature selection: Recursive Feature Elimination (RFE) and Backward Elimination (BE).
RFE selected 16 variables with a model precision of 0.85. The removed variables were the current density and hydrogen output temperature. BE selected 17 variables according to a p value of 0.05 (statistically significant). The removed variable was the inlet hydrogen flow.
The dimensionality reduction achieved by both algorithms, RFE and BE, was nonsignificant.

4.1.3. Embedded Methods

The selection was made using lasso regularization. If the variable is irrelevant, lasso penalizes its coefficient by changing it to zero. The best score using built-in LassoCV was 0.8617. Lasso picked 11 variables and eliminated the other 7 variables. The reduction achieved by this algorithm was highly significant. However, the fit was barely acceptable.

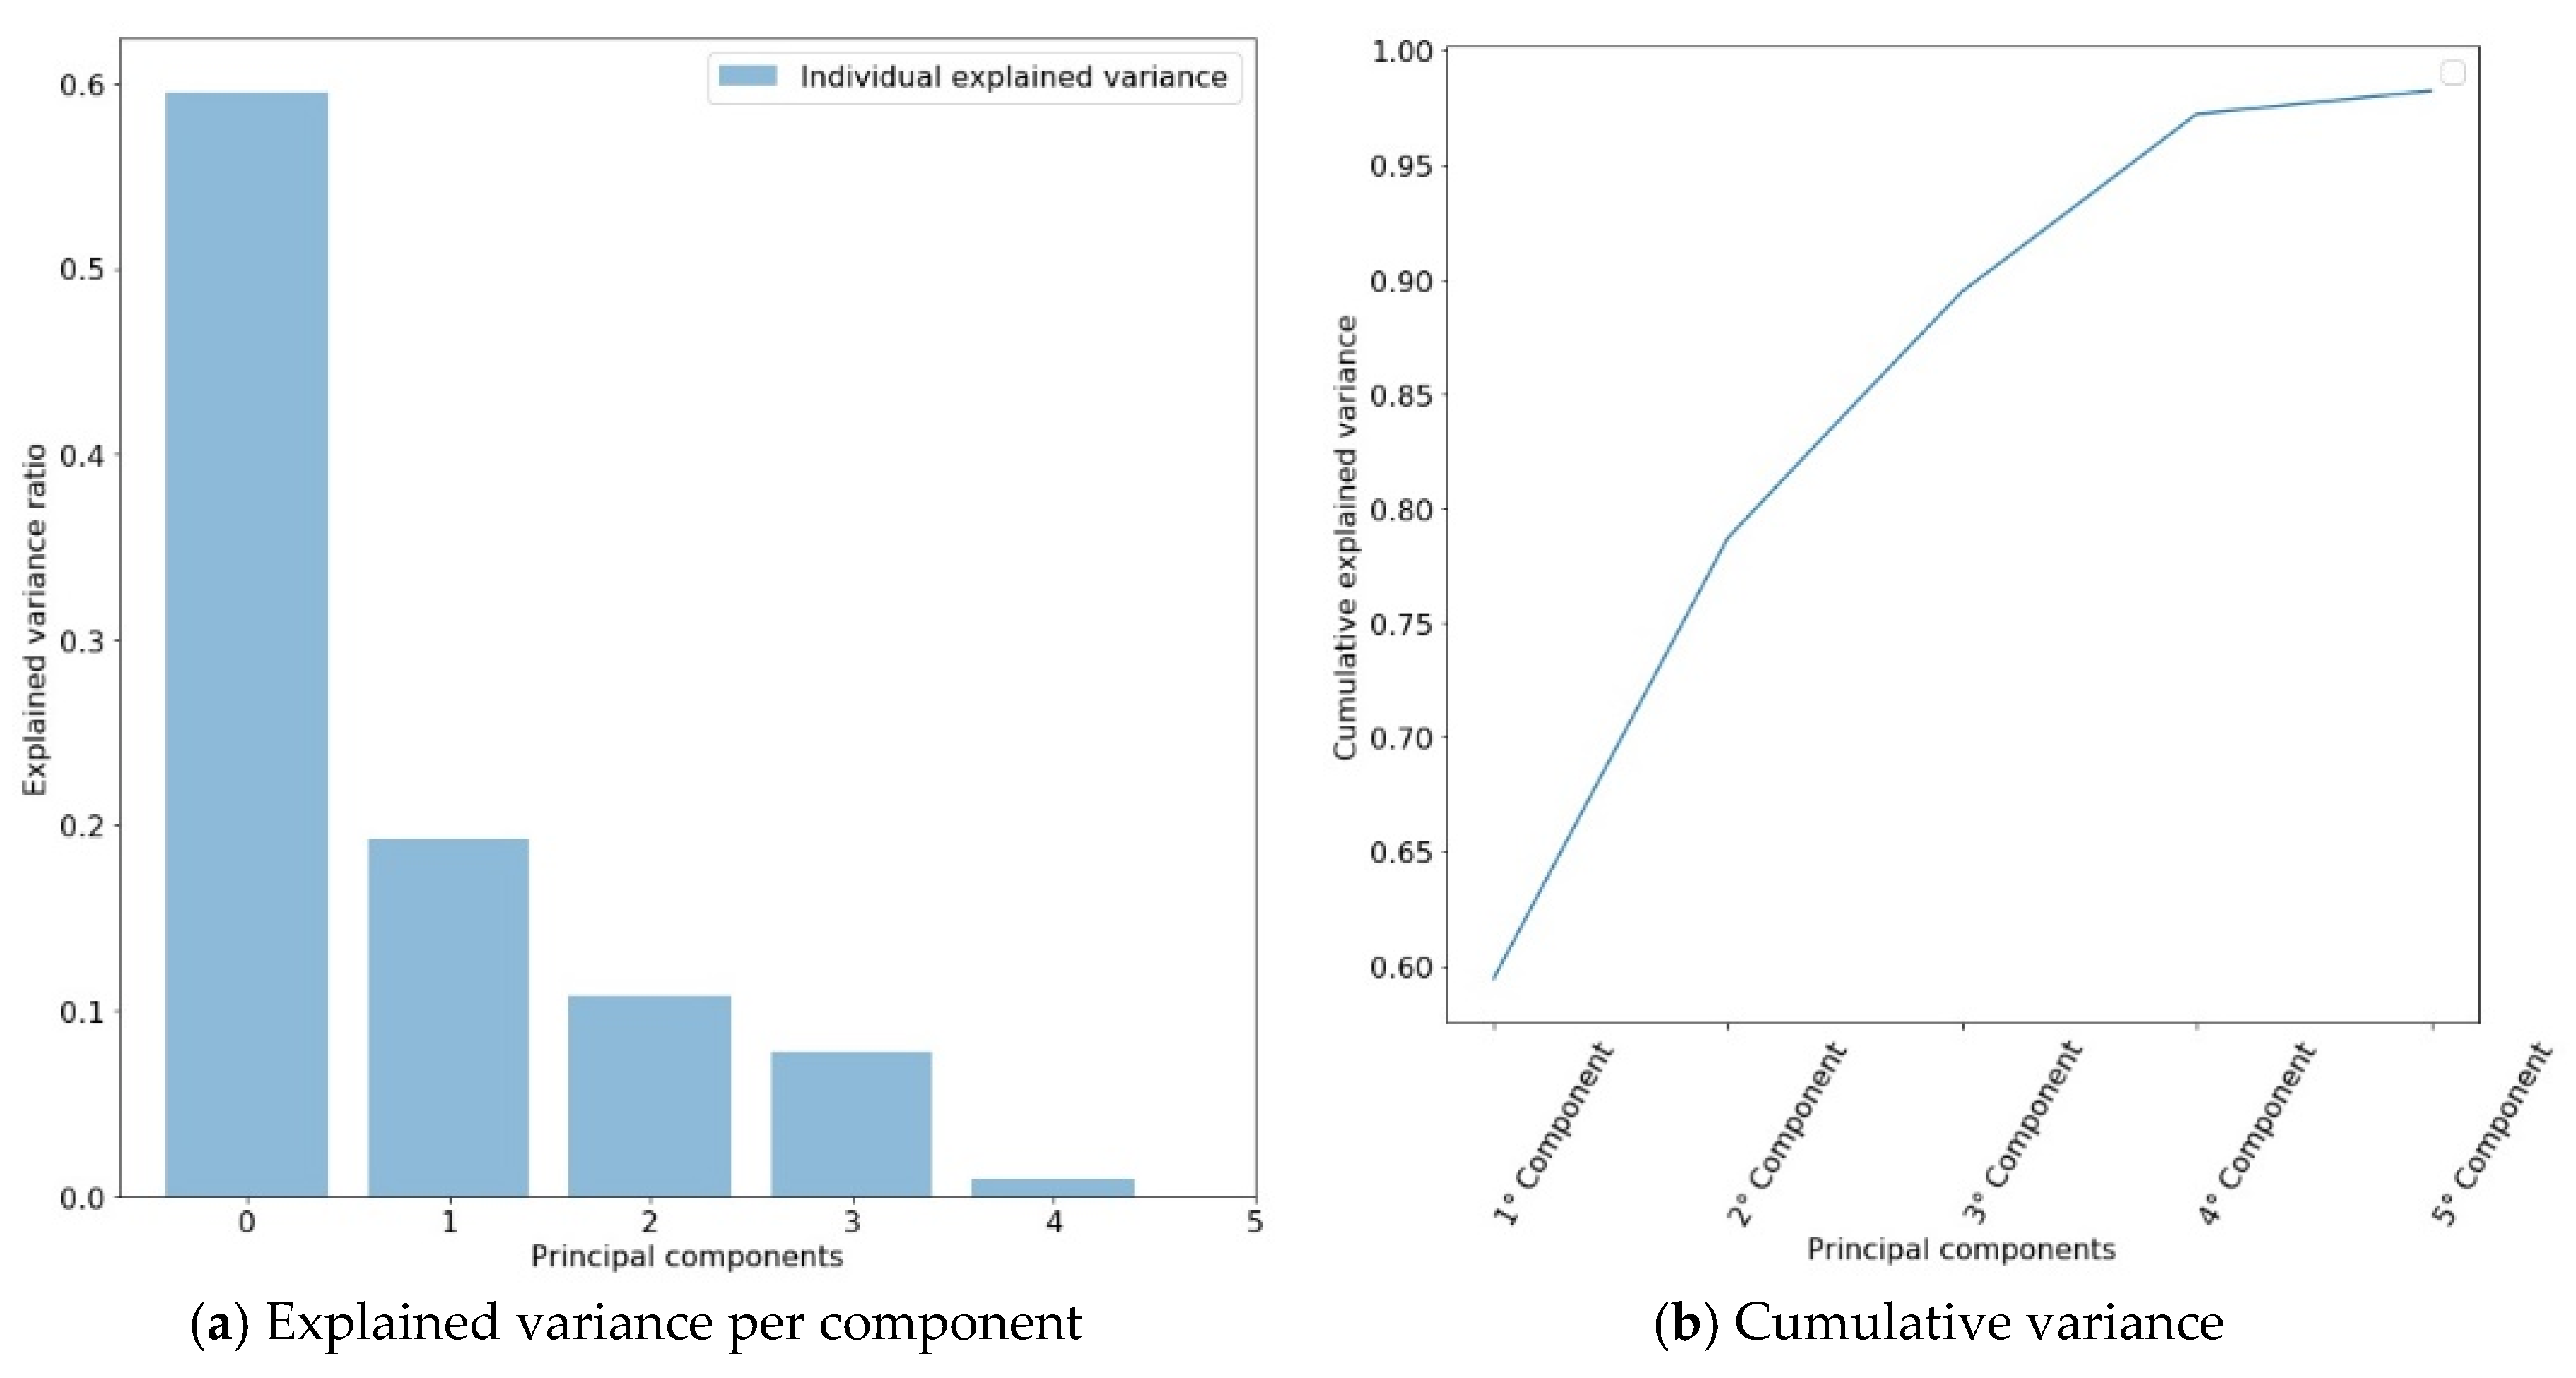
4.1.4. Principal Component Analysis (PCA)

PCA analysis is a statistical method used to reduce the dimensionality of a dataset while retaining as much as possible of the variation present in the data. For more details about this technique and its applications to fuel cells, refer to [27].
The first step to performing a PCA analysis is to make a descriptive statistic that summarizes the central tendency and dispersion of the values; the next step is to make a correlation matrix, which allows us to observe which variables have a solid relationship, as shown in Figure 4.
As can be seen, due to the low correlation between variables, it is very difficult to determine the parameters for operating a fuel cell system [17]. This low correlation is mainly due to PEM fuel cells having complex electrochemical reactions with multiple nonlinear input/output variables [28]. Systems with these characteristics are complicated to model accurately and, therefore, to optimize.
The main relationships are between the following:
  • The air inlet and outlet pressure;
  • The hydrogen inlet and outlet pressure; and
  • The air inlet flow rate and hydrogen inlet flow rate.
However, as can be seen in Figure 4, there is a negative correlation between time and current (−0.81), as well as between time and current density (−0.81); these relationships are not so significant because they only reflect the natural wear of the membrane. The time variable was not considered during the feature selection process.
After that, it is necessary to determine the number of components which explain the main variance of the data. This number is obtained by trial and error. In this case, five components describe the variance of the data correctly (see Figure 5).
However, four components explain more than 97% of the variance. The fifth component is not relevant, so it can be omitted. In Figure 6 can be seen which variables have a major impact on each one of the four components (see also Table 3).
However, during the regression process, it is necessary to add the time variable due to the natural wear of the membrane depending on the work hours, which reduce in an almost linear way the output voltage. Once the main variables of the fuel cell have been identified, it is possible to create a control-oriented model to track the output voltage.

4.2. Data-Driven Control-Oriented Models for PEM Fuel Cells

This section is divided into two parts. Section 4.2.1 describes the results obtained by some of the most robust regression algorithms used in machine learning. Section 4.2.2 is extended to show in more detail the neural network training process. Neural networks achieved better results than the algorithms tested in Section 4.2.1, mainly due to their ability to track nonlinear variables and system delays.

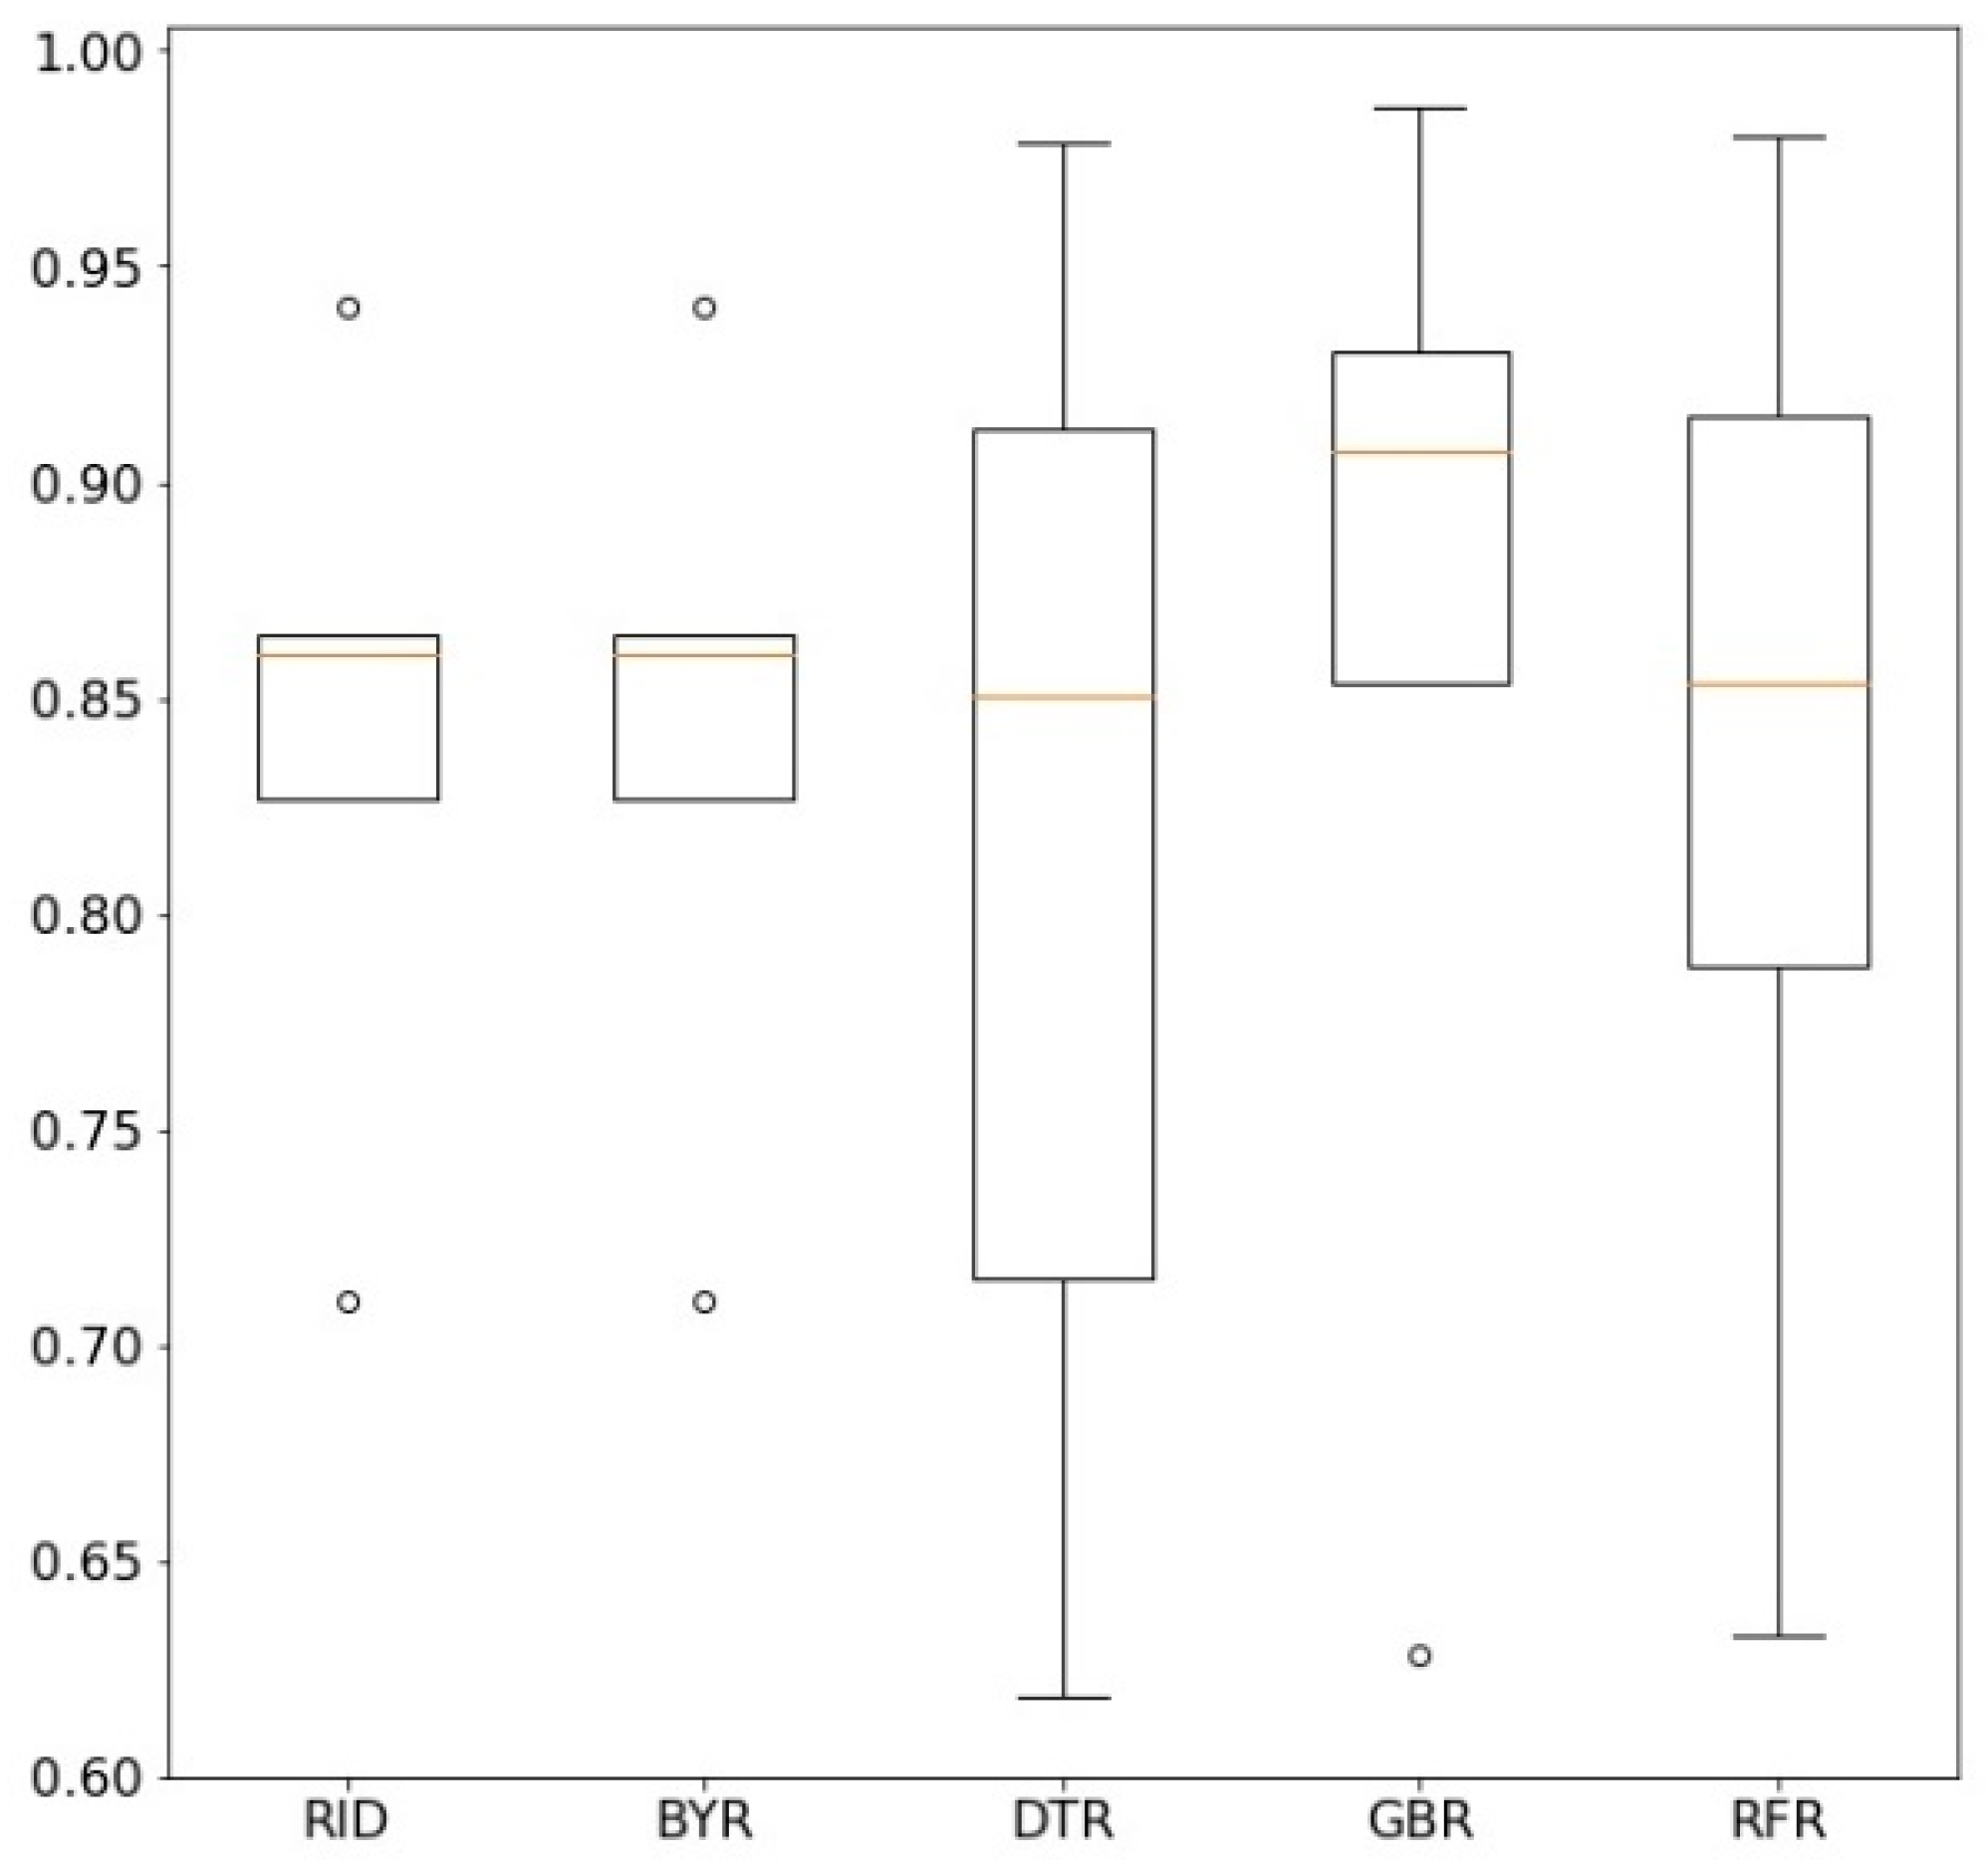
4.2.1. Fuel Cell Modeling Using Machine Learning Regression Algorithms

Different regression algorithms were tested to create a robust control-oriented model, and their performance was compared with the Explained Variance score ratio. The k-fold method was used for the cross-validation of the model using five folds, and a fixed seed was established to ensure reproducibility. The methods compared were ridge (RID), Bayesian ridge (BYR), decision tree regressor (DTR), gradient boosting regressor (GBR), and random forest regressor (RFR). The results show the averages and standard deviations of the Explained Variance.
  • RID: 0.840495 (0.075010)
  • BYR: 0.840494 (0.075011)
  • DTR: 0.815885 (0.131130)
  • GBR: 0.860727 (0.124138)
  • RFR: 0.830844 (0.120877)
Figure 7 compares via a box plot the performance of the algorithms tested. In the graph, it can be seen that gradient boosting regressor is the algorithm that presents less variation and better accuracy. However, the gradient boosting regressor only reaches a score of 0.86, which is slightly low for control purposes.

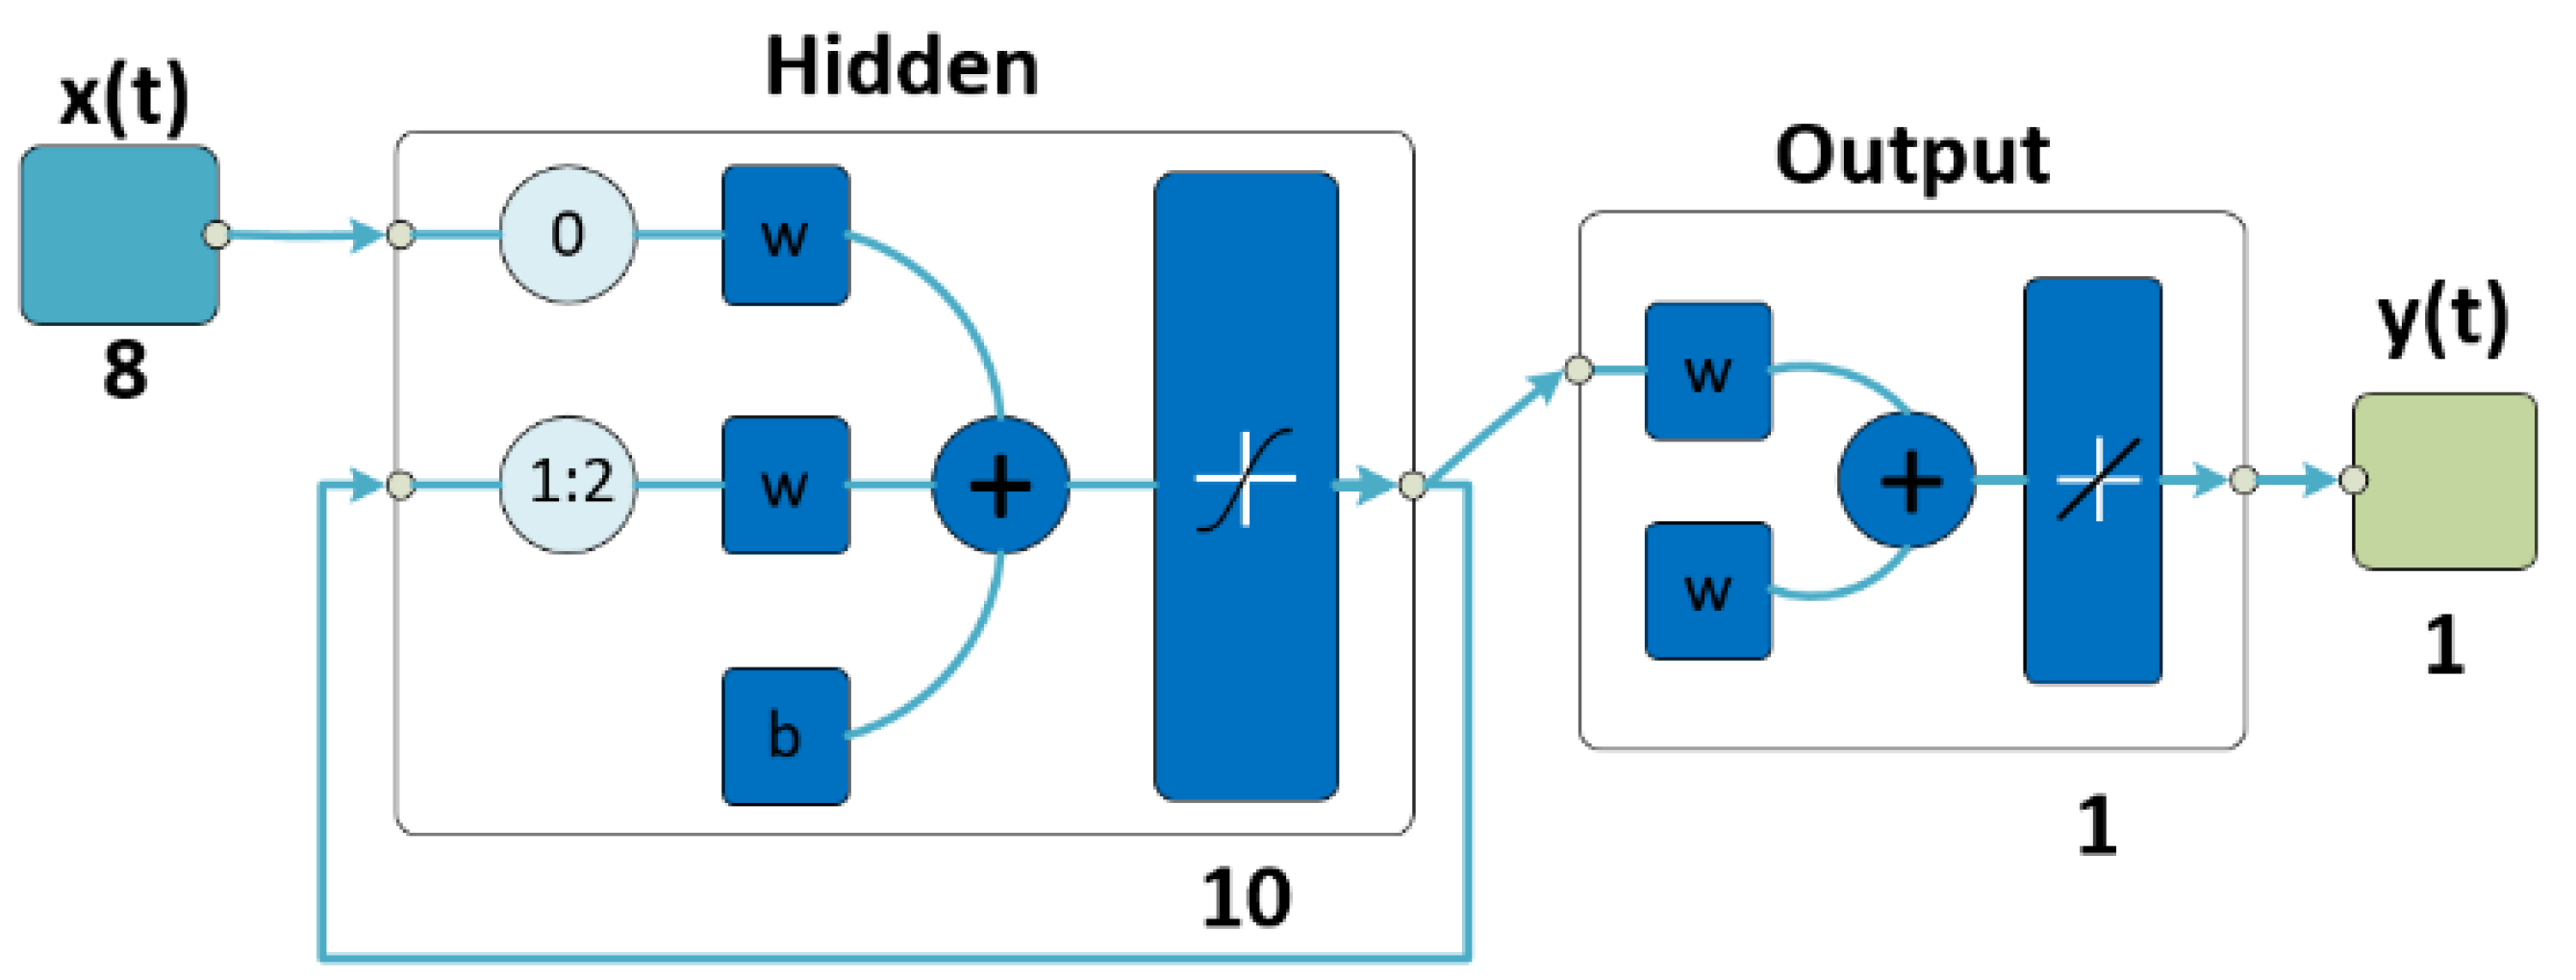
4.2.2. Fuel Cell Modeling Based on Neural Networks

Neural networks can be classified according to their behavior in time as either static or dynamic. A static neural network can model with high accuracy the performance of a PEM fuel cell. However, as can be seen in Figure 4, the time variable impacts negatively on the output voltage and current, even in steady-state conditions (see also Figure 8). A dynamic neural network takes into consideration the time variable, and its structure can be used as a generic model for system control [29].
A nonlinear autoregressive with external exogenous input (NARX) network was used to model the fuel cell. The validation process was done by a cross-validation technique (k-fold) with ten splits.
The dataset was divided into training and validation sets. The input layer consisted of eight inputs (the variables selected in the PCA analysis, see Table 3), the hidden layer had ten neurons with a log-sigmoid activation function with two delays (sampling time 30 seg.), and the output layer used the purelin activation function to calculate the voltage. The dynamic neural network (DNN) configuration is shown in Figure 9. The training algorithm selected was Levenberg–Marquardt because, in general, it has the fastest convergence and reduces the computational cost.
The high regression accuracy (R2 = 0.96) and the fast convergence are mainly due to the fact that in the PCA analysis, the irrelevant and redundant variables which have no impact on the output voltage were eliminated. The eliminated variables do not have value for control purposes. In Table 4 are presented the scores of each fold. In Figure 10, a comparison of the actual values against the predicted values is presented.

4.3. Hybrid Control Scheme

According to the eight main variables identified in the PCA analysis, only two can be considered as system inputs: the inlet pressures of hydrogen and oxygen. However, when analyzing Figure 6, it can be seen that hydrogen pressure is the variable that most affects the fuel cell performance. Variations in air inlet pressure can be considered non-representative for control purposes if they are kept within a specific range of operation.
Keeping constant or following a reference is not the objective of this control approach for the fuel cell output voltage; this is because the output voltage does not depend only on the supply of the reactants. The load has a delayed negative correlation on the voltage level and in transient-state conditions is the variable that impacts it the most. The load (current) can be considered as an external disturbance. For the abovementioned, a MISO (multiple inputs, single output) control is needed to supply the optimal hydrogen pressure to the cell according to the operating conditions, such as temperature, current, or air pressure.
The neuro-PID controller is an already proven control approach in cases of system fault recovery, such as flooding, drying out, and auxiliary failures, such as of a compressor [20]. A PID-series neuro control scheme (with an inverse model of the fuel cell) was proposed to supply the optimal hydrogen pressure by taking into account the values of the main variables under transient conditions (see Figure 11). The self-autotuning of the PID control was done according to the method proposed by Omatu et al. [30].
The ANN controller is the inverse model of the plant; this means that the output voltage of the plant was turned into input, and the hydrogen pressure became the system output. The nominal voltage is 3.3 volts in steady-state conditions; however, this nominal value depends on the changes in the load and its effect on the temperature. The ANN controller not only considers the error between the nominal voltage value and the actual value but also considers the values of the variables selected in the PCA analysis to estimate the control signal—in this case, the hydrogen pressure. The training was done following the same approach described in Section 4.2.2.
In Figure 12 are compared the voltage, current, and hydrogen pressure for both controllers, the conventional and neuro PID-series. Both controllers achieved similar performance in steady-state and transient conditions. The main difference is the reduction in the hydrogen pressure in the steady state. This reduction in pressure causes a decrease in the flow of hydrogen, which in turn decreases hydrogen consumption. It is necessary to recall that the difference is only about 45 mbar. In practical applications, a high-precision actuator (expensive) would be needed to control these small differences.
The training algorithm derives the error partially, so each neuron updates its weight according to its proportion in that error. If the neuro-PID controller only considers the gap between the desired voltage and the actual value without taking into account the changes in the variables selected in the PCA analysis, the control signal, the hydrogen inlet pressure, will not stabilize the fuel cell performance. PEM fuel cells must operate in steady-state conditions in order to avoid premature failure, such as starvation due to improper gas supply or an excessive transient load demand [31]. An energy management system is required to deliver a fixed voltage to equipment so it can work correctly. This paper proposes a practical approach to stabilize the fuel cell performance in transient conditions at minimum control cost, focusing attention on the variables that impact the most on the performance of the cell and eliminating unnecessary measurements. However, this control can be improved if the air inlet pressure is also regulated. An incorrect startup/shutdown process can cause accelerated or permanent damage to the catalyst layer. These considerations have to be included in the control process to improve the proposed control.

5. Conclusions

In this paper, we developed a data-driven control approach for PEM fuel cells to minimize the cost of control. Several feature selection algorithms were used for dimensionality reduction. Principal component analysis (PCA) obtained the best results by removing irrelevant and redundant variables. The selected variables (Table 3) can describe with high accuracy the PEM fuel cell performance. Some of the most powerful regression algorithms were compared to predict the output voltage of the cell. However, neural networks obtained the highest accuracy (R2 = 0.96) due to their capacity to map complex nonlinear relationships. With the selected variables, an inverse model of the fuel cell was developed using neural networks in order to develop a neuro-PID controller. A PID-series control was integrated with the inverse model to regulate the system input (hydrogen inlet pressure) by considering the values of the other variables. The fuel cell voltage level does not depend only on the supply of the reactants, and in transient conditions, the load is the variable that impacts the most on fuel cell performance. This method is a practical way to save mathematical modeling time and reduce the number of sensors in the control system.
In the future, this study will be improved via experimental tests in a real PEM fuel cell system which includes the measurements detected in the PCA analysis. Later, an intelligent fault diagnosis and isolation scheme will be developed to prevent permanent damage in the catalyst layer.

Author Contributions

Conceptualization, A.M.-S.; Data curation, O.S.G.; Formal analysis, A.M.-D. and A.M.-S.; Investigation, A.M.-D.; Methodology, J.P.R.-J.; Project administration, R.P.-G.; Supervision, J.P.R.-J.; Validation, O.S.G.; Visualization, R.P.-G.; Writing – original draft, A.M.-D.; Writing – review & editing, A.M.-S.

Funding

This research received no external funding.

Conflicts of Interest

The authors declare no conflicts of interest.

References

  1. Oncel, S.; Vardar-Sukan, F. Application of proton exchange membrane fuel cells for the monitoring and direct usage of biohydrogen produced by Chlamydomonas reinhardtii. J. Power Sources 2011, 196, 46–53. [Google Scholar] [CrossRef]
  2. Manish, S.; Banerjee, R. Comparison of biohydrogen production processes. Int. J. Hydrogen Energy 2008, 33, 279–286. [Google Scholar] [CrossRef]
  3. Rahman, S.N.A.; Masdar, M.S.; Rosli, M.I.; Majlan, E.H.; Husaini, T. Overview of Biohydrogen Production Technologies and Application in Fuel Cell. Am. J. Chem. 2015, 5, 13–23. [Google Scholar]
  4. Kotay, S.M.; Das, D. Biohydrogen as a renewable energy resource—Prospects and potentials. Int. J. Hydrogen Energy 2008, 33, 258–263. [Google Scholar]
  5. Lucia, U. Overview on fuel cells. Renew. Sustain. Energy Rev. 2014, 30, 164–169. [Google Scholar] [CrossRef]
  6. Gao, F.; Member, S.; Blunier, B.; Sim, M.G. PEM Fuel Cell Stack Modeling for Real-Time Emulation in Hardware-in-the-Loop Applications. IEEE Trans. Energy Convers. 2011, 26, 184–194. [Google Scholar]
  7. Daud, W.R.W.; Rosli, R.E.; Majlan, E.H.; Hamid, S.A.A.; Mohamed, R.; Husaini, T. PEM fuel cell system control: A review. Renew. Energy 2017, 113, 620–638. [Google Scholar] [CrossRef]
  8. Gao, F.; Blunier, B.; Miraoui, A. Proton Exchange Membrane Fuel Cells Modeling; Wiley: Hoboken, NJ, USA, 2012. [Google Scholar]
  9. Puranik, S.V.; Keyhani, A.; Khorrami, F. State-Space Modeling of proton exchange membrane fuel cell. IEEE Trans. Energy Convers. 2010, 25, 804–813. [Google Scholar] [CrossRef]
  10. Pukrushpan, J.T.; Stefanopoulu, A.G.; Peng, H. Control of Fuel Cell Power Systems, 2nd ed.; Springer-Verlag: London, UK, 2005. [Google Scholar]
  11. Ainscough, C.; Peterson, D.; Miller, E. Hydrogen Production Cost From PEM Electrolysis. DOE Hydrog. Fuel Cells Progr. Rec. 2014. Available online: https://www.hydrogen.energy.gov/pdfs/14004_h2_production_cost_pem_electrolysis.pdf (accessed on 30 May 2019).
  12. da Costa Lopes, F.; Watanabe, E.H.; Rolim, L.G.B. A Control-Oriented Model of a PEM Fuel Cell Stack Based on NARX and NOE Neural Networks. IEEE Trans. Ind. Electron. 2015, 62, 5155–5163. [Google Scholar] [CrossRef]
  13. Napoli, G.; Ferraro, M.; Sergi, F.; Brunaccini, G.; Antonucci, V. Data driven models for a PEM fuel cell stack performance prediction. Int. J. Hydrogen Energy 2013, 38, 11628–11638. [Google Scholar] [CrossRef]
  14. Sisworahardjo, N.S.; Yalcinoz, T.; El-Sharkh, M.Y.; Alam, M.S. Neural network model of 100 W portable PEM fuel cell and experimental verification. Int. J. Hydrogen Energy 2010, 35, 9104–9109. [Google Scholar] [CrossRef]
  15. Han, I.S.; Chung, C.B. Performance prediction and analysis of a PEM fuel cell operating on pure oxygen using data-driven models: A comparison of artificial neural network and support vector machine. Int. J. Hydrogen Energy 2016, 41, 10202–10211. [Google Scholar] [CrossRef]
  16. Kheirandish, A.; Shafiabady, N.; Dahari, M.; Kazemi, M.S.; Isa, D. Modeling of commercial proton exchange membrane fuel cell using support vector machine. Int. J. Hydrogen Energy 2016, 41, 11351–11358. [Google Scholar] [CrossRef]
  17. Pourkiaei, S.M.; Ahmadi, M.H.; Hasheminejad, S.M. Modeling and experimental verification of a 25W fabricated PEM fuel cell by parametric and GMDH-type neural network. Mech. Ind. 2015, 17, 105. [Google Scholar] [CrossRef]
  18. Chávez-Ramírez, A.U.; Muñoz-Guerrero, R.; Duron-Torres, S.M.; Ferraro, M.; Brunaccini, G.; Sergi, F.; Antonucci, V.; Arriaga, L.G. High power fuel cell simulator based on artificial neural network. Int. J. Hydrogen Energy 2010, 35, 12125–12133. [Google Scholar] [CrossRef]
  19. Ma, R.; Yang, T.; Breaz, E.; Li, Z.; Briois, P.; Gao, F. Data-driven proton exchange membrane fuel cell degradation predication through deep learning method. Appl. Energy 2018, 231, 102–115. [Google Scholar] [CrossRef]
  20. Lin-kwong-chon, C.; Grondin-pérez, B.; Kadjo, J.A.; Damour, C.; Benne, M. A review of adaptive neural control applied to proton exchange membrane fuel cell systems. Annu. Rev. Control 2019, 47, 133–154. [Google Scholar] [CrossRef]
  21. Rakhtala, S.M.; Ghaderi, R.; Noei, A.R. Proton exchange membrane fuel cell voltage-tracking using artificial neural networks. J. Zhejiang Univ. Sci. C 2011, 12, 338–344. [Google Scholar] [CrossRef]
  22. Abbaspour, A.; Khalilnejad, A.; Chen, Z. Robust adaptive neural network control for PEM fuel cell. Int. J. Hydrogen Energy 2016, 41, 20385–20395. [Google Scholar] [CrossRef] [Green Version]
  23. Aliasghary, M. Control of PEM Fuel Cell Systems Using Interval Type-2 Fuzzy PID Approach. Fuel Cells 2018, 18, 449–456. [Google Scholar] [CrossRef]
  24. Kheirandish, A.; Motlagh, F.; Shafiabady, N.; Dahari, M.; Wahab, A.K.A. Dynamic fuzzy cognitive network approach for modelling and control of PEM fuel cell for power electric bicycle system. Appl. Energy 2017, 202, 20–31. [Google Scholar] [CrossRef]
  25. IEEE PHM 2014 Data Challenge. 2014. Available online: http://eng.fclab.fr/ieee-phm-2014-data-challenge/ (accessed on 22 May 2019).
  26. Almeida, P.E.M.; Simões, M.G. Neural optimal control of PEM fuel cells with parametric CMAC networks. IEEE Trans. Ind. Appl. 2005, 41, 237–245. [Google Scholar] [CrossRef]
  27. Placca, L.; Kouta, R.; Candusso, D.; Blachot, J.F.; Charon, W. Analysis of PEM fuel cell experimental data using principal component analysis and multi linear regression. Int. J. Hydrogen Energy 2010, 35, 4582–4591. [Google Scholar] [CrossRef] [Green Version]
  28. Al-Othman, A.K.; Ahmed, N.A.; Al-Fares, F.S.; AlSharidah, M.E. Parameter Identification of PEM Fuel Cell Using Quantum-Based Optimization Method. Arab. J. Sci. Eng. 2015, 40, 2619–2628. [Google Scholar] [CrossRef]
  29. Hatti, M.; Tioursi, M. Dynamic neural network controller model of PEM fuel cell system. Int. J. Hydrogen Energy 2009, 34, 5015–5021. [Google Scholar] [CrossRef]
  30. Omatu, S.; Yoshioka, M.; Kosaka, T.; Yanagimoto, H. Neuro-PID Control of Speed and Torque of Electric Vehicle. Int. J. Adv. Syst. Meas. 2010, 3, 82–91. [Google Scholar]
  31. Rosli, R.E.; Sulong, A.B.; Daud, W.R.W.; Zulkifley, M.A.; Rosli, M.I.; Majlan, E.H.; Haque, M.A. Reactant Control System for Proton Exchange Membrane Fuel Cell. Procedia Eng. 2016, 148, 615–620. [Google Scholar] [CrossRef] [Green Version]
Figure 1. Proton exchange fuel cell diagram [7]. Reproduced with permission from Daud, W.R.W., Renew. Energy; published by Elsevier, 2007.
Processes 07 00434 g001
Figure 2. Neural control techniques applied to PEM fuel cells.
Processes 07 00434 g002
Figure 3. Direct inverse neural control.
Processes 07 00434 g003
Figure 4. Fuel cell correlation matrix.
Processes 07 00434 g004
Figure 5. Explained variance per component.
Processes 07 00434 g005
Figure 6. Fuel cell correlation matrix.
Processes 07 00434 g006
Figure 7. Algorithm comparison.
Processes 07 00434 g007
Figure 8. Fuel cell output voltage as a function of time.
Processes 07 00434 g008
Figure 9. Dynamic neural network structure.
Processes 07 00434 g009
Figure 10. Actual values and predicted values.
Processes 07 00434 g010
Figure 11. Proportional–integral–derivative (PID)-series neuro controller.
Processes 07 00434 g011
Figure 12. Performance analysis of PID-series and conventional control. (a) The same load was connected to both controllers. At time 35.42 h the load was changed to evaluate the effect on the output voltage and the supply hydrogen pressure; (b) The output voltage reached the same level in steady state in both cases practically. When the load connected was reduced (until open circuit) the output voltage increased; (c) Hydrogen pressure in the conventional control (left) oscillated (in the steady state) mainly between 1280 and 1295 mBar, whereas in the neuro-control (right), the hydrogen pressure remained practically constant at 1238 mBar in the steady state.
Processes 07 00434 g012
Table 1. Variables monitored.
VariableDescriptionUnit
TimeTime agingH
VoutStack output voltageV
ICurrentA
JCurrent densityA/cm2
Tin, Tout H2Inlet and outlet H2 temperature°C
Tin, Tout AirInlet and outlet air temperature°C
Pin, Pout H2Inlet and outlet H2 pressuremBar
Fin, Fout H2Inlet and outlet H2 flowL/min
Fin, Fout AirInlet and outlet air flowL/min
FwatFlow rate of cooling waterL/min
HrAIRInlet Hygrometry (Air)%
Table 2. Range of parameters controlled.
ParameterRange
Air flow0 to 100 L/min
H2 flow0 to 30 L/min
Gas pressure0 to 2 bars
Temperature20 to 80 °C
Cell current0 to 300 A
Table 3. Selected variables from PCA analysis.
VariablesType
CurrentState variable
Hydrogen inlet temp.State variable
Air inlet temp.State variable
Air inlet pressureInput system
Air outlet pressureState variable
Hydrogen inlet pressureInput system
Hydrogen outlet pressureState variable
Table 4. Regression score function of each fold.
FoldScore
10.955929840882997
20.953074662444409
30.959505398134269
40.957813889951952
50.958048357252375
60.958116362163286
70.959355574634461
80.960026345242201
90.966767102061810
100.971974506261939
Ave.0.960061203902970

