Article

Effects of Operating Parameters on the Cut Size of Turbo Air Classifier for Particle Size Classification of SAC305 Lead-Free Solder Powder

Department of Mining and Materials Engineering, Faculty of Engineering, Prince of Songkla University, Hat Yai 90112, Thailand
*
Author to whom correspondence should be addressed.
Processes 2019, 7(7), 427; https://doi.org/10.3390/pr7070427
Submission received: 21 May 2019 / Revised: 30 June 2019 / Accepted: 2 July 2019 / Published: 5 July 2019
(This article belongs to the Section Materials Processes)

Abstract

:
In the present study, the effects of operating parameters, namely, rotor speed, feed rate, and inlet air velocity, on the cut diameter of a cage-type separator were studied. The design of experiments (DOE) method was used to investigate the relationship between the operating parameters and the cut size. The experimental results were statistically analyzed using MINITAB 16 software. Both the rotor speed and air inlet velocity had significant main effects on the cut size. The feed rate was also significant but had a weak effect with respect to the rotor speed and inlet air velocity effects. The cut size decreased with an increase in rotor speed and increased with an increase in air inlet velocity. However, the cut size slightly decreased with an increase in feed rate. An empirical multiple-variable linear model for predicting the cut size of the classification was created and presented. The results derived from the statistical analysis were in good agreement with those from the experiments, additionally extended from the DOE. The optimal conditions for classification of SAC305 powder with size range 25–40 μm were obtained when the turbo air classifier was operated at rotor speed 406 RPM, the feed rate 4 kg/h, and the air velocity 5 m/s. The smallest cut size of the classifier was about 27.8 μm.

Graphical Abstract

1. Introduction

SAC305 is one member of SAC (tin-silver-cooper) alloy family which is considered a lead-free solder. It contains 96.5% Sn, 3% Ag, and 0.5% Cu. It has been accepted as the most promising due to its relatively low melting temperature, good mechanical properties, and solderabilities [1], as well as its superior creep properties [2]. In the reflow process of SAC alloys on Cu substrate, it leads to coarsening of grains and further exhibits poor mechanical properties. However, a recent study has found that the addition of the nanoparticle size of Fe and Al2O3 in SAC solder alloys can improve mechanical properties because of the formation of FeSn2 intermetallic compounds and Al2O3 nanoparticles serving as a grain refiner [3]. In the microelectronics packaging industry, SAC alloys are widely used as solder pastes in connecting chip parts and ball grid arrays (BGAs) [4]. Lead-free solder powders which are used in microelectronics applications strictly require high product qualities such as spherical shape, low oxygen content (~100 ppm), and narrow size distribution [5]. Moreover, the particle size must be suitable for the demand of the powder product. For instance, SAC305 powder (Type 3) with the particle size range of 25–40 μm is generally considered as an industrial standard grade for producing solder paste.
In the powder manufacturing industry, the classification process is regarded as one of the most crucial operations which make the particle size of powder products meet the requirements of customers. Air classification is one of these techniques, in which the materials are classified using an air stream. Recently, the dynamic-state air classifier has been developed to the third generation, i.e., the turbo air classifier. Due to its high precision and good classification performance compared to its predecessors, the turbo or cage-type separator has become one of the most popular kinds of equipment extensively used for the preparation of powder in various industries, such as chemicals and metallurgy [6]. In addition, for the previous study in the mineral separation industry, for example, coal, the compound dry separator was employed for removing mineral gangue from raw coal with +6 mm particle sizes. Recently, the compound dry separator has been improved and can be used to classify fine coal powder with −6 mm particle sizes [7]. Cut size (d50: average particle size at 50% cumulative volume percentage) of classification is an important factor with which to evaluate the performance of an air classifier. Thus, it is a considerable concern when choosing a proper classifier for powder particle classification. The cut size indicates the powder size at 50% of a partial separation efficiency curve; it mainly relies on the structures of the classifier, material properties and operating parameters [8]. Many studies to improve the structures of air classifiers, especially on the rotor cages, have been carried out. Wang et al. [9] found that smaller cut sizes were obtained by making the inclining angle of rotor blades decrease. Galk et al. [10] manufactured a new classifier rotor cage; higher sharpness of classification and an excellent quality product of less than a micron were achieved. It has been reported in [11] that a sharper classification was generally caused by higher air flow rates, together with a low feed rate. Recently, many theoretical models have been proposed for predicting cut size; most cut size models have been obtained using the fundamentals of aerodynamics, as reported by Wang et al. [12] and Lai et al. [13]. Under different assumptions for establishing a cut size formula, when the two forces (the drag force and centrifugal force) are applied on a particle reaching an equilibrium at the external rim of the rotor cage in the annular region, the cut size formula can be achieved [14]. Eswaraiah et al. [15] conducted a theoretical determination of the performance of a classifier and proposed models for predicting the sharpness and the cut size of classification. In addition, cut size may be calculated by using the computational fluid dynamics (CFD) method, as previously reported by Huang et al. [16] and Ren et al. [17].
During actual powder classification in the separation zone of an turbo air classifier, the motion of particles inside this zone causes particle collision and agglomeration which affect the cut size, leading to discrepancies between the calculated and experimental values. To predict the process parameters affecting the powder classification performance, a multiple-variable nonlinear regression technique is used for modelling an empirical formula to predict cut size. To obtain a reliable empirical formula, many experimental runs and samples are required [18]. Thus, a suitable experimental design is needed to evaluate the possible effects. A statistical design of experiments (DOE) technique can be applied to obtain the effects of each parameter and their relative importance in a process. In addition, the DOE provides the interaction effects of two or more variables as well [19]. To date, although many studies have been carried out to optimize operating parameters affecting the performance of powder classification by turbo air classifiers, most of these have been performed by using low-density powders as feed materials, such as mica powder, calcium carbonate, quartz sand, fly ash, and talcum powder. Few studies on turbo air classification using a high-density metal powder, such as SAC305 lead-free solder powder (which has a density 7390 kg/m3) for feed materials, have been reported.
This study aims to investigate the effects of operating parameters of a turbo air classifier (a cage-type air separator), namely, rotor speed, feed rate, and inlet air velocity, on the cut size (cut diameter) of classification of SAC305 lead-free solder power. A full 23-factorial design of experiments was employed in this study. The results of the experiments were statistically analyzed using MINITAB 16 software to identify the significant operating parameters affecting the cut size of classification. An empirical multiple-variable linear model for predicting the cut diameter is also proposed in the study.

2. Materials and Methods
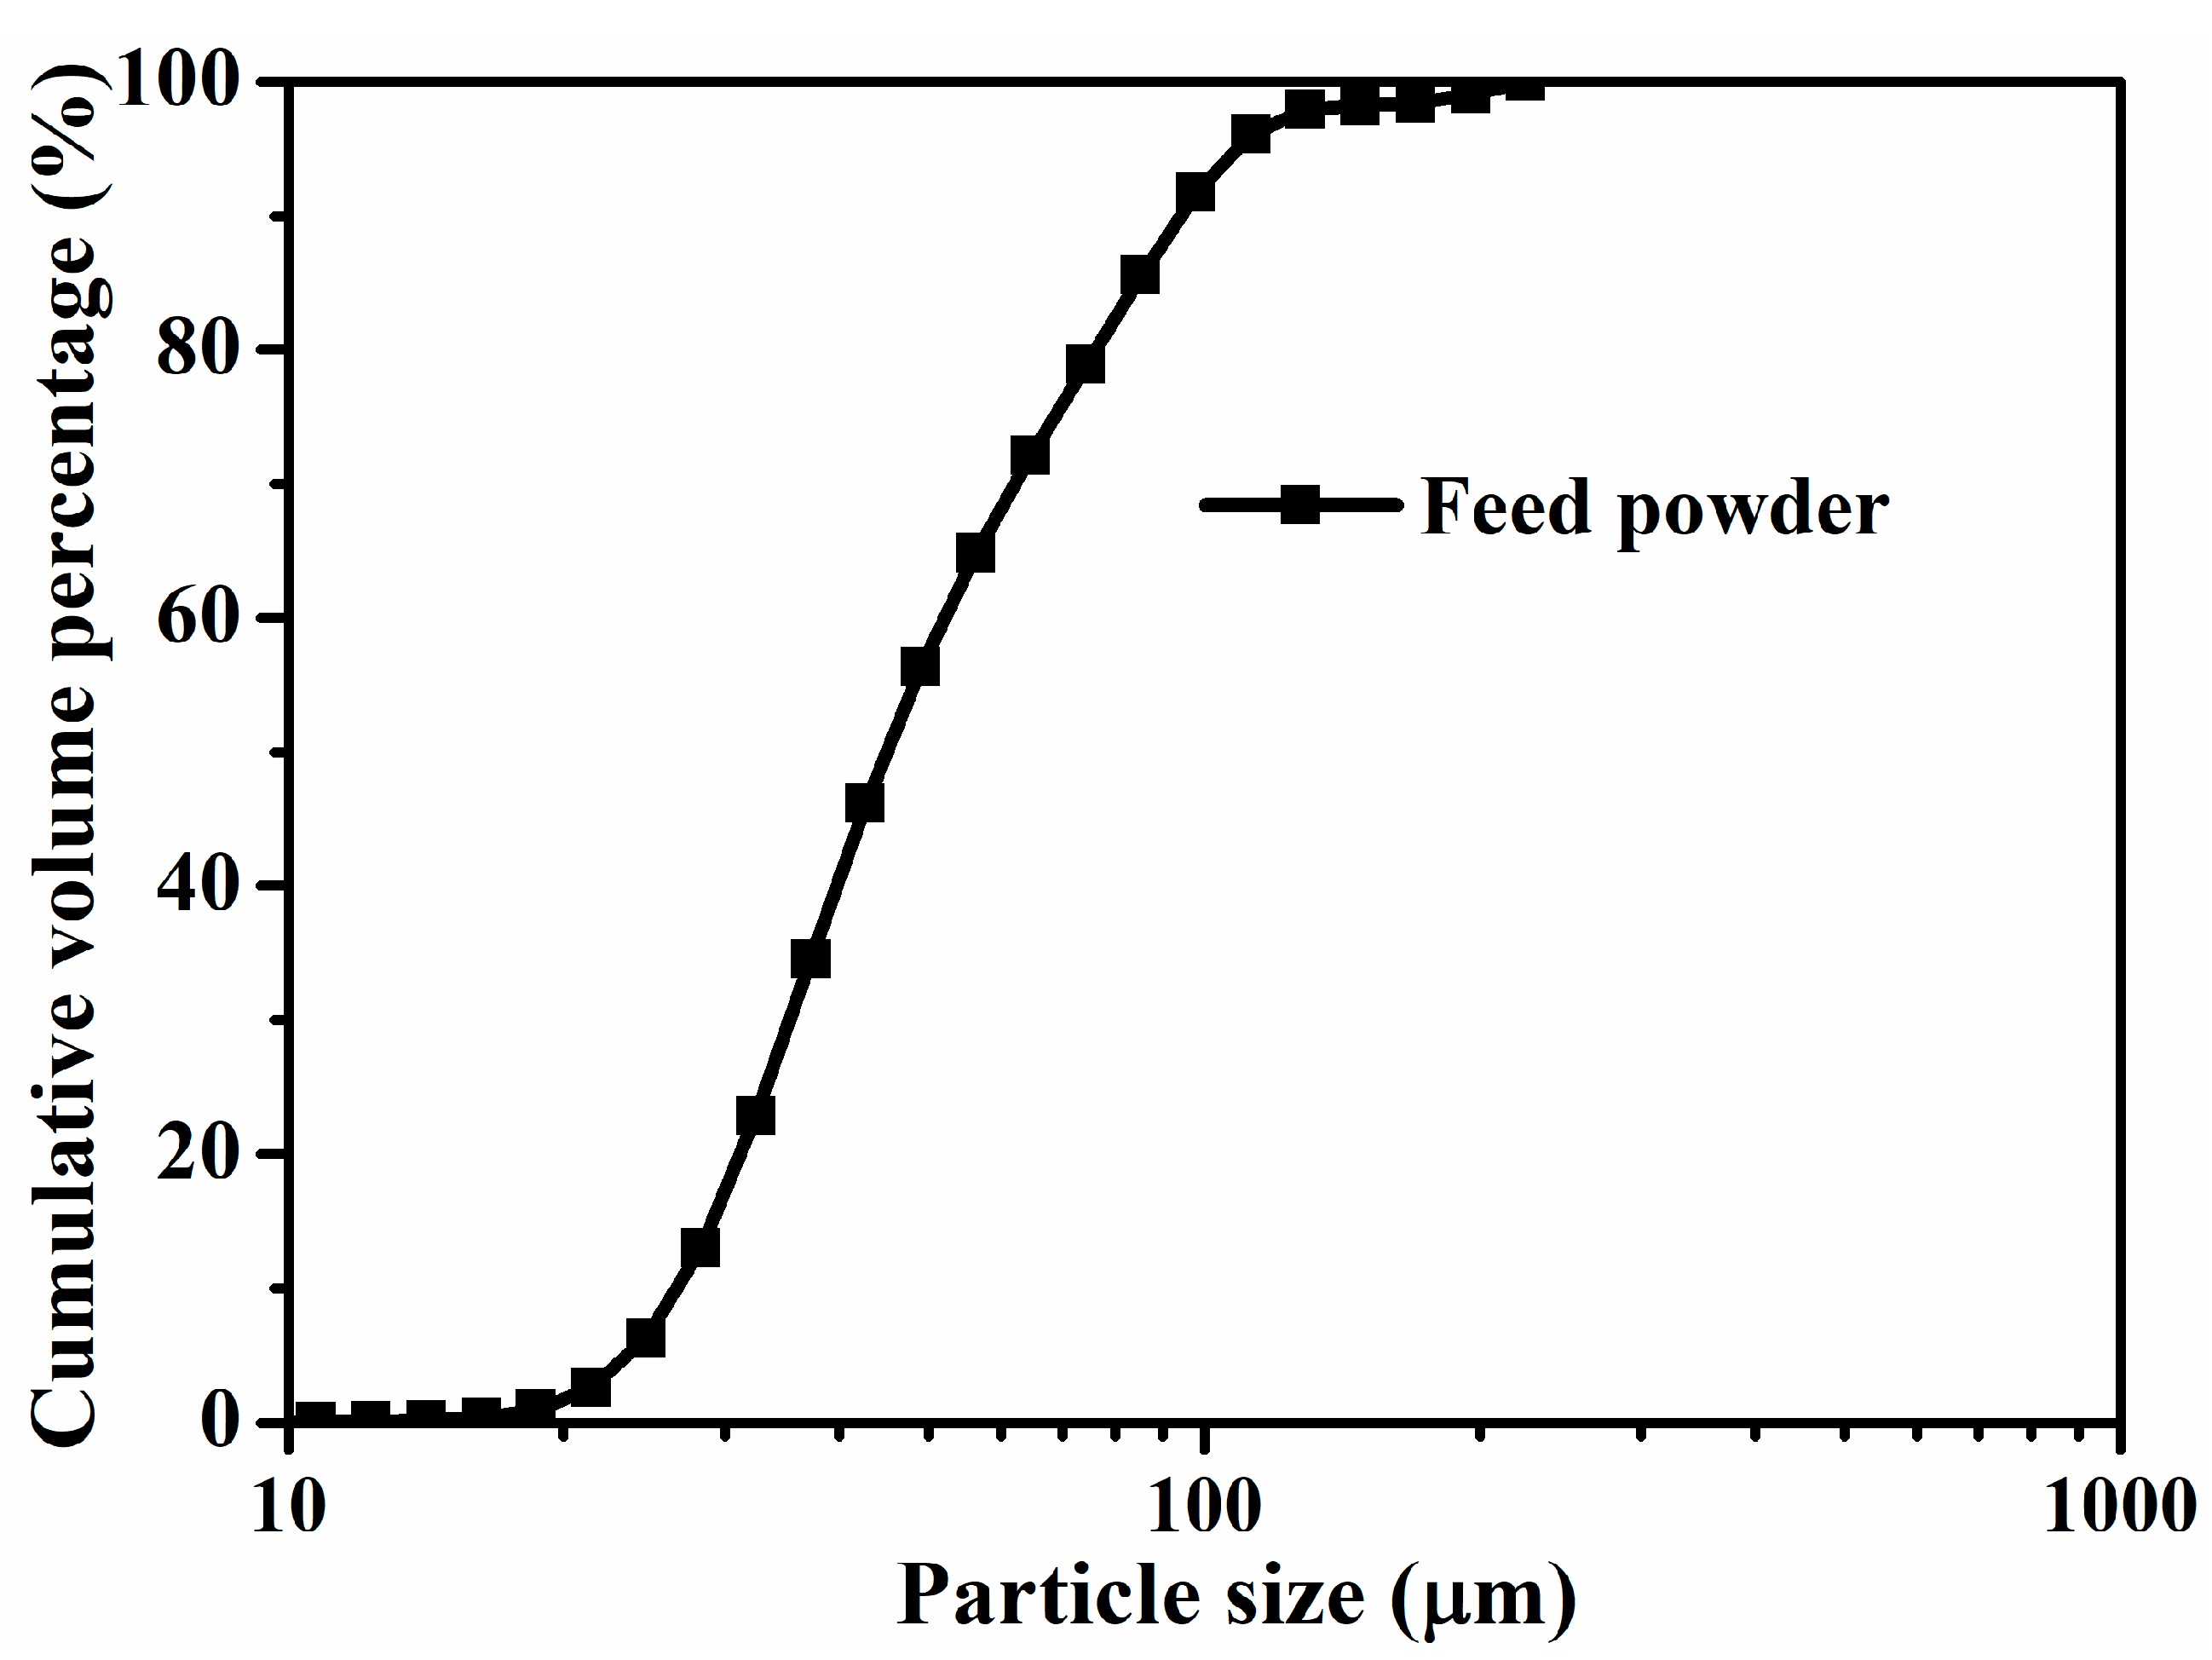
2.1. Materials

In this study, SAC305 powder was manufactured by rotating disk atomization in the laboratory. After the SAC305 powder obtained was first screened by a 100-mesh standard laboratory sieve, this powder was used as a feed material for turbo air classification experiments. Powder from the undersize portion of the sieve with particle sizes less than 150 μm was used for the experiments. The size distribution of the feed material, analyzed by a light scattering particle size analyzer, is shown in Figure 1. The particle size of the feed powder is shown to be approximately 50 μm. The SEM (JEOL model JSM-5800 LV, Tokyo, Japan) micrograph of the SAC305 feed powder is shown in Figure 2. The density of the SAC305 powder is 7390 kg/m3. For each experimental run, an approximate amount of 200 g of SAC305 powder was fed to the cage-type separator.

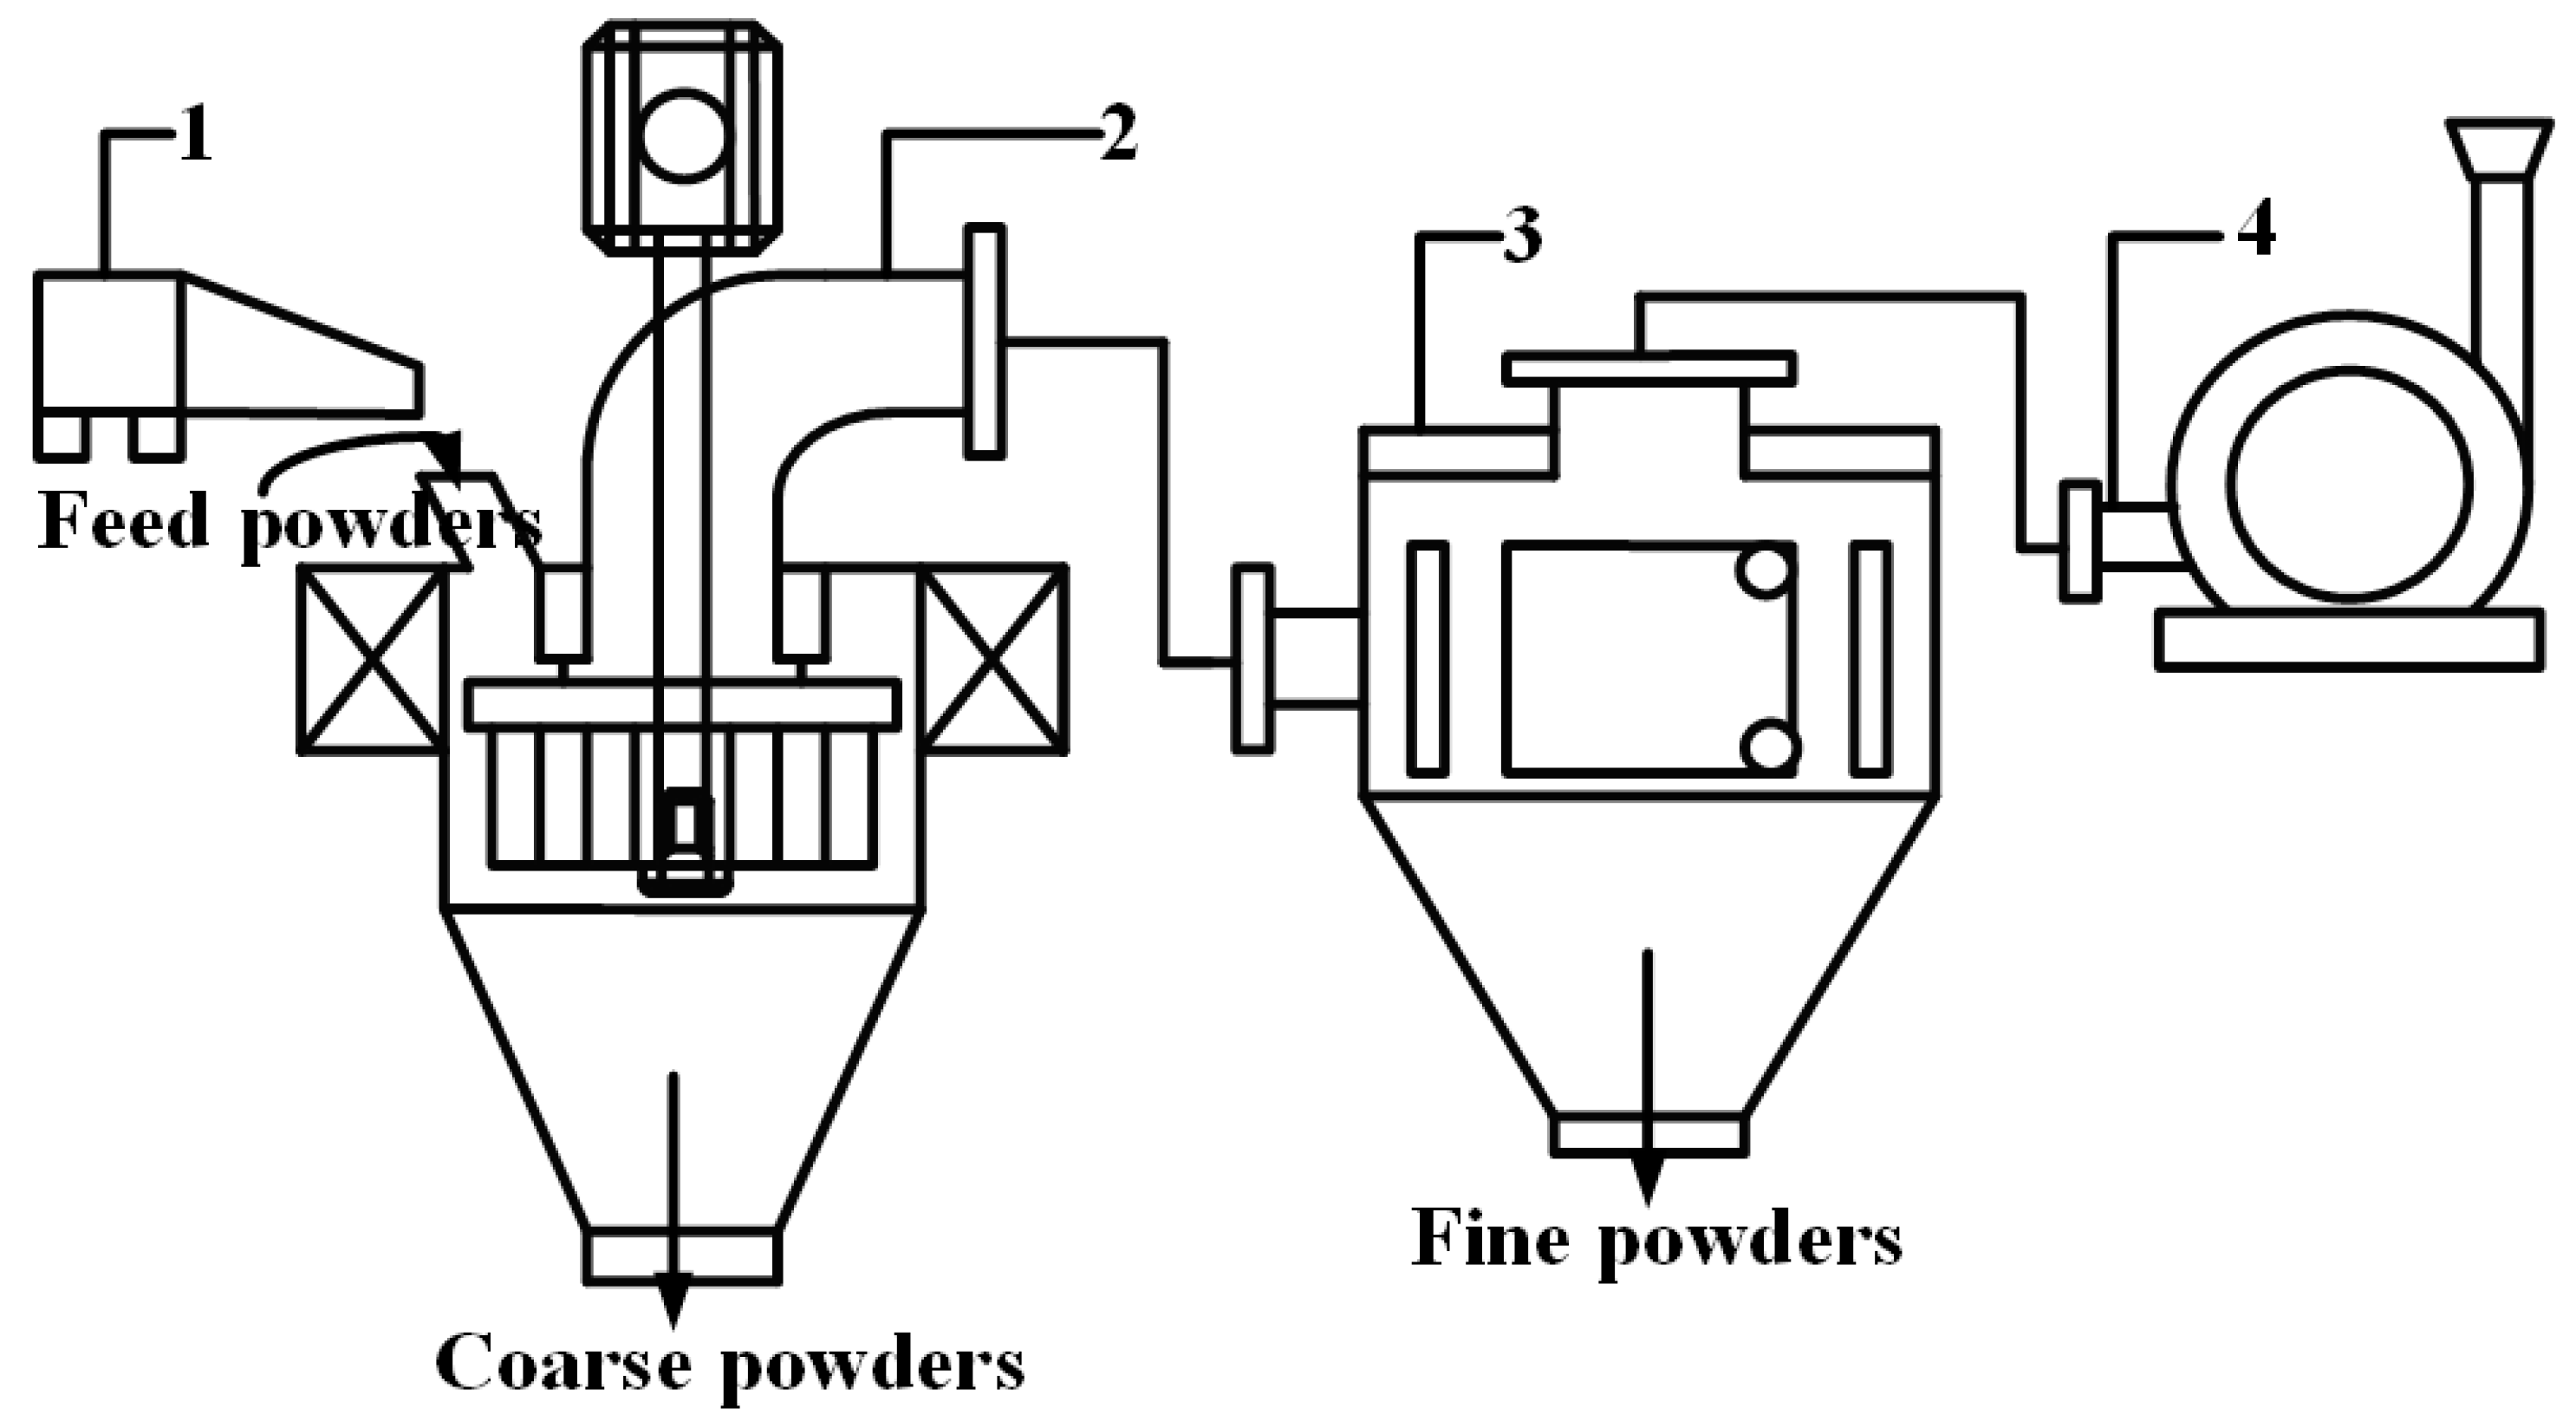
2.2. Experimental Procedure

In the present study, the air classifier used was fabricated in the laboratory of Prince of Songkla University, Hat Yai, Thailand to study cut size as affected by three operating parameters: rotor speed, feed rate, and air velocity. The schematic outline of the powder classification process is shown in Figure 3. The system consisted of four main parts, namely, the vibratory feeder, the turbo air classifier, the dust collector, and the centrifugal fan. The rotor speed of the classifier was measured by a tachometer. The powder feed rate was controlled by adjusting the magnitude of vibration of a vibratory feeder. The air inlet velocity was measured by a hot-wire anemometer. In the experiment, a SAC305 powder specimen was first fed by the vibratory feeder into the turbo air classifier via its feed inlet. Then, the feed powder gravitationally dropped onto the scatter plate of the cage rotor, rotating at a high speed. The feed powder was flung outward and sunk into the cylindrical gab called the annular area. The feed powder in this area was influenced by the centrifugal and drag forces. Under these different forces applied on the particle, if the centrifugal force is able to overcome the drag force, the powders are thrown outward to the wall of the classifier, after which they fall into the powder collector and are then collected as the coarse powder product. Otherwise, the particles are brought through the center of the cage rotor by the strong suction air stream created the centrifugal fan, carried to the dust collector, and then collected as the fine powder product. After many classification experiments, both coarse and fine powder products were weighted. The powder products were sampled for measuring particle size distribution by a light-scattered particle size analyzer. Using the particle size distributions (PSD) of feed, coarse, and fine products, a fractional recovery curve of the coarse product, a so-called Tromp curve was constructed using the equation proposed by Mejeoumov [20], i.e.,
T r o m p   C u r v e = ( f 2 i f 1 i ) × ( f 1 i f 3 i f 2 i f 3 i )
where f1i is the portion of the powders in the i-th fraction of the feed powder, f2i is the portion of the powders in the i-th fraction of the coarse powder, and f3i is the portion of the powders in the i-th fraction of the fine powder.
The cut size of classification was obtained from the Tromp curve. The relationship between the operating parameters and the cut sizes was further statistically examined using MINITAB 16.

2.3. Experimental Design

To reduce many experimental runs but still maintain accuracy of experimental results, a 23-factorial design was adopted for the present work. For a 2-level factorial design, the low and high levels are specified as −1 and +1, respectively. The operating parameters, i.e., rotor speed, feed rate, and air inlet velocity are coded A, B, and C at low and high levels, respectively, as shown in Table 1. These three operating parameters were selected for experiments according to the reviewed literature [18,21] since they are important process parameters which strongly affect the cut size of the cage-type air classifier and can be strictly controlled and varied to different levels. Other parameters such as the type of rotor and size of feed powder material were fixed. MINITAB (Version 16, Minitab Inc., State college, PA, USA, 2010) was used to create a randomized full 23-factorial design with two replications, without the center point and blocking setting. The total number of designed experiments was 16, as shown in Table 2. Column 1 of Table 2 is the randomized standard order of experiments. The experiments were performed according to the run order in Table 2. Cut size results of 16 experiments are shown in the last column of Table 2. These results were further used for statistical analysis, ANOVA, and linear regression analysis for obtaining the connection between the cut diameter and the three operating parameters.

3. Results and Discussion

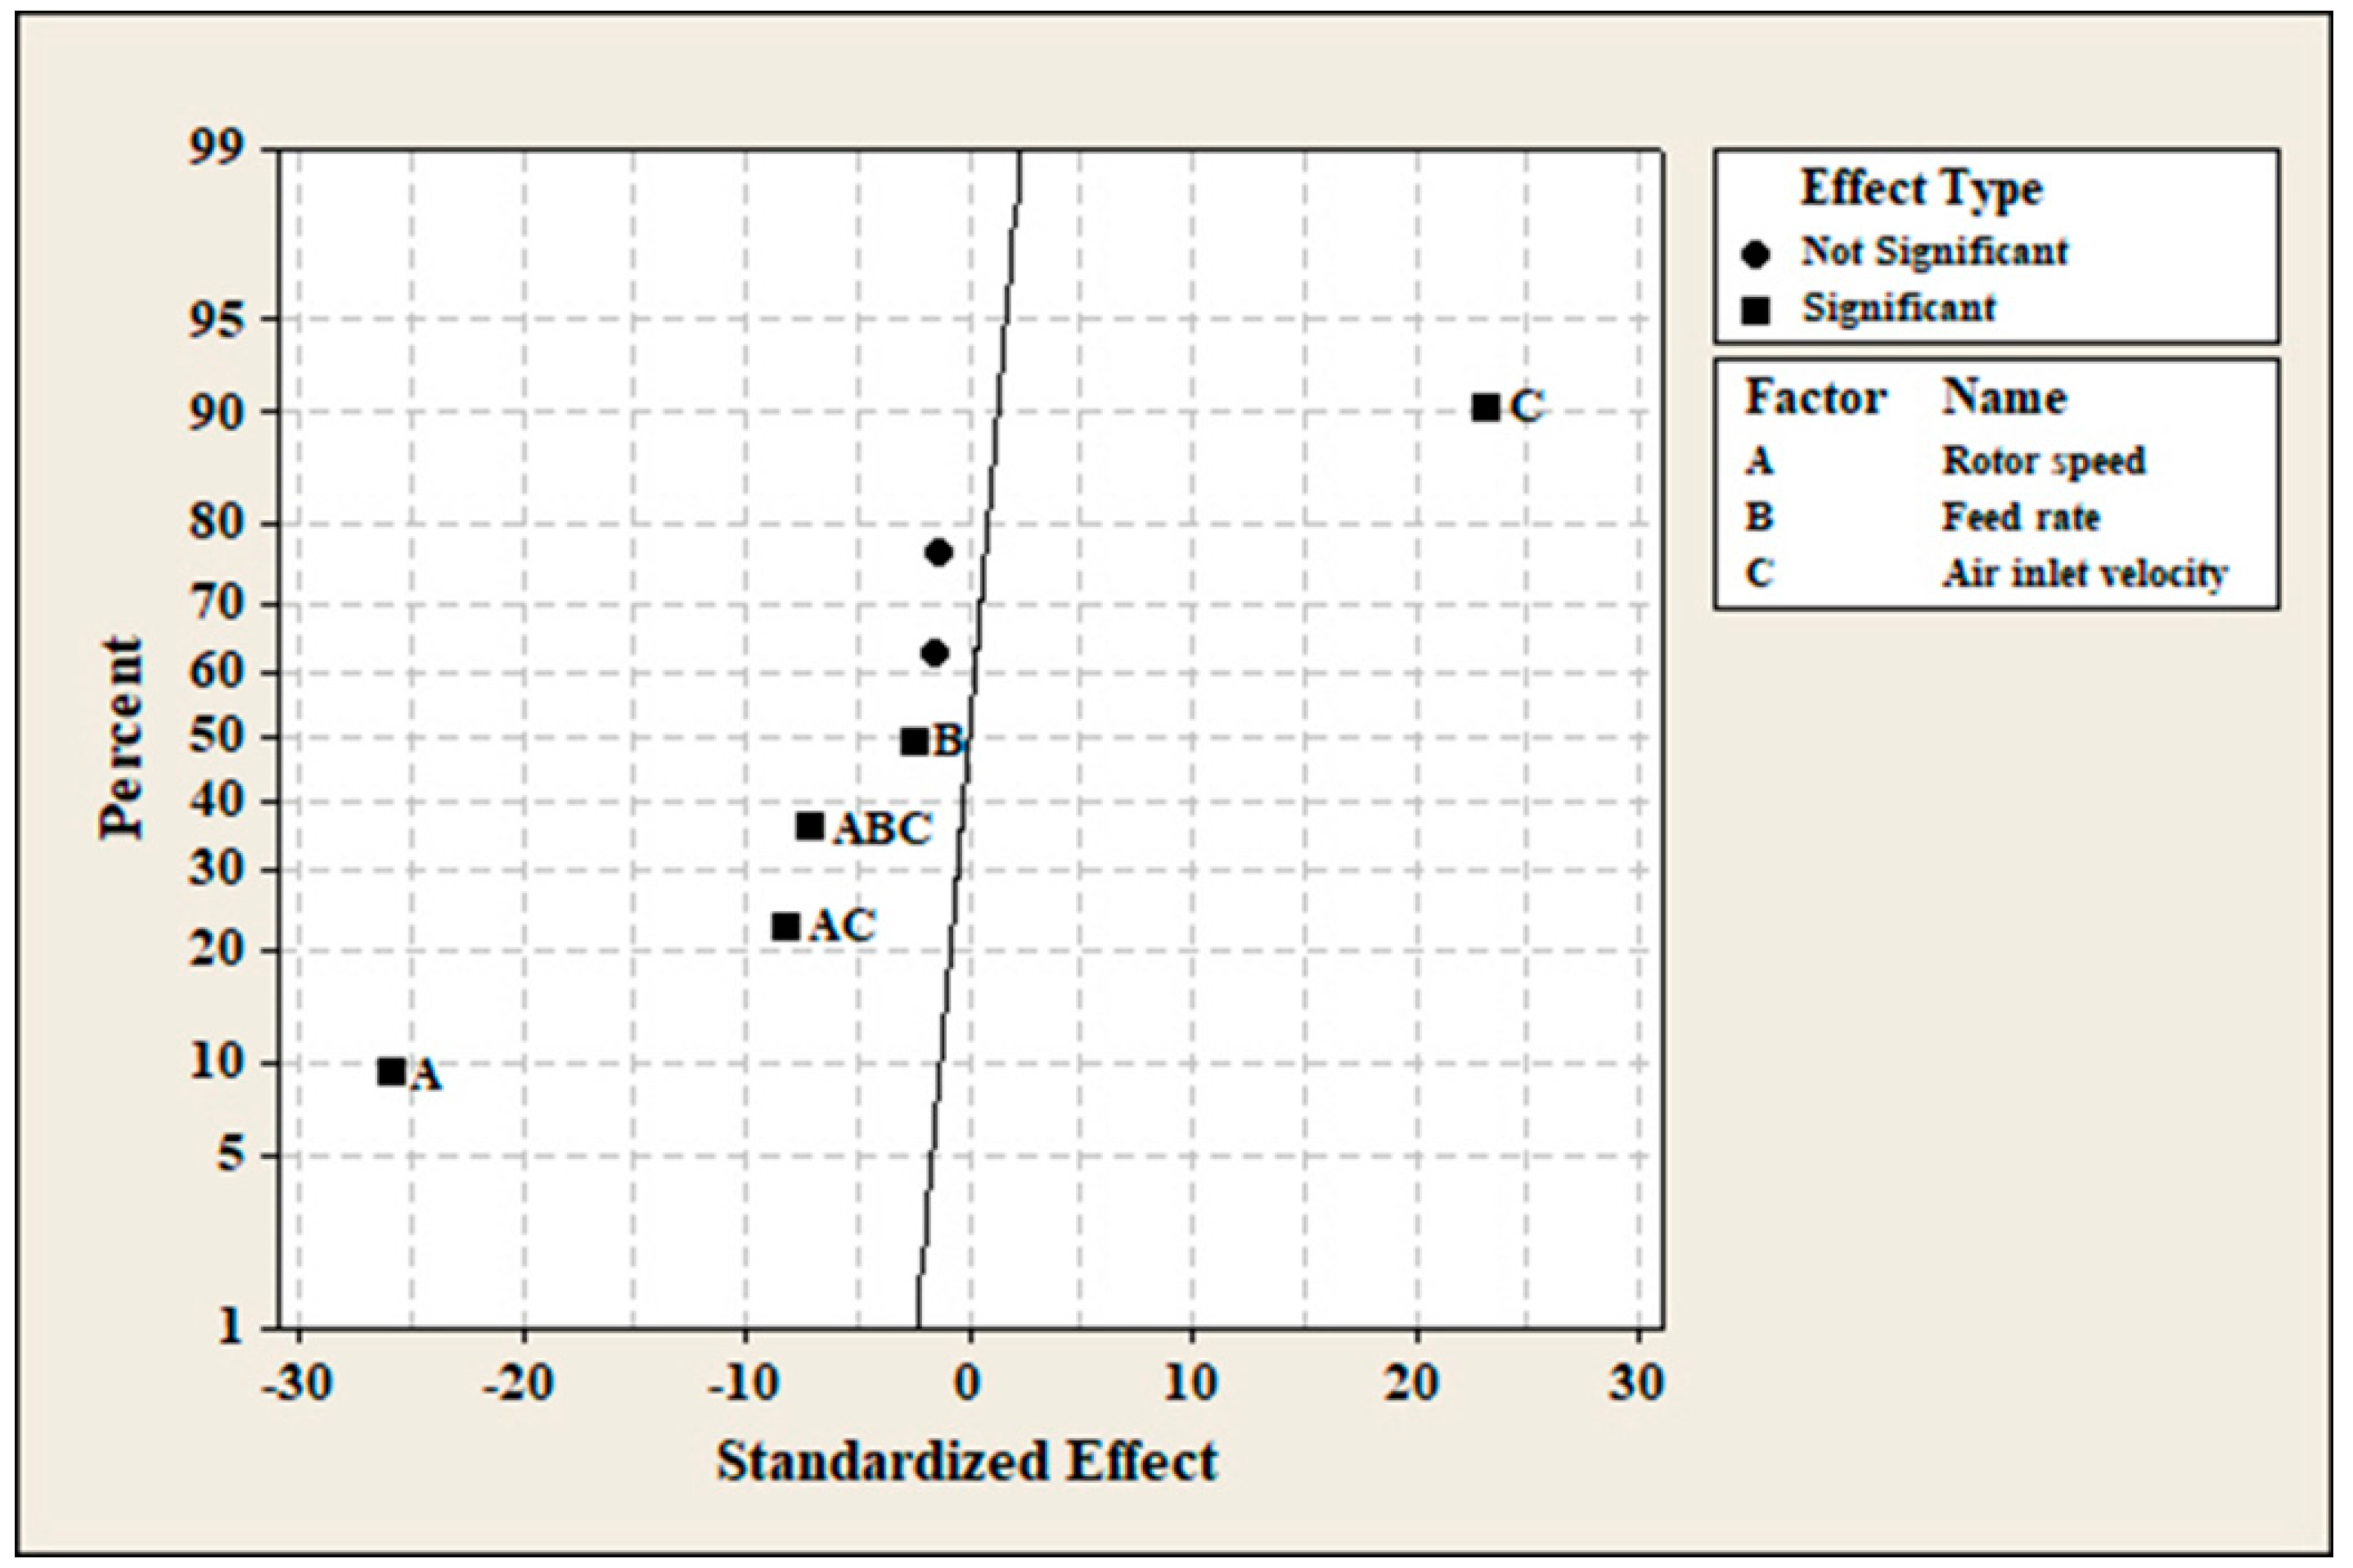
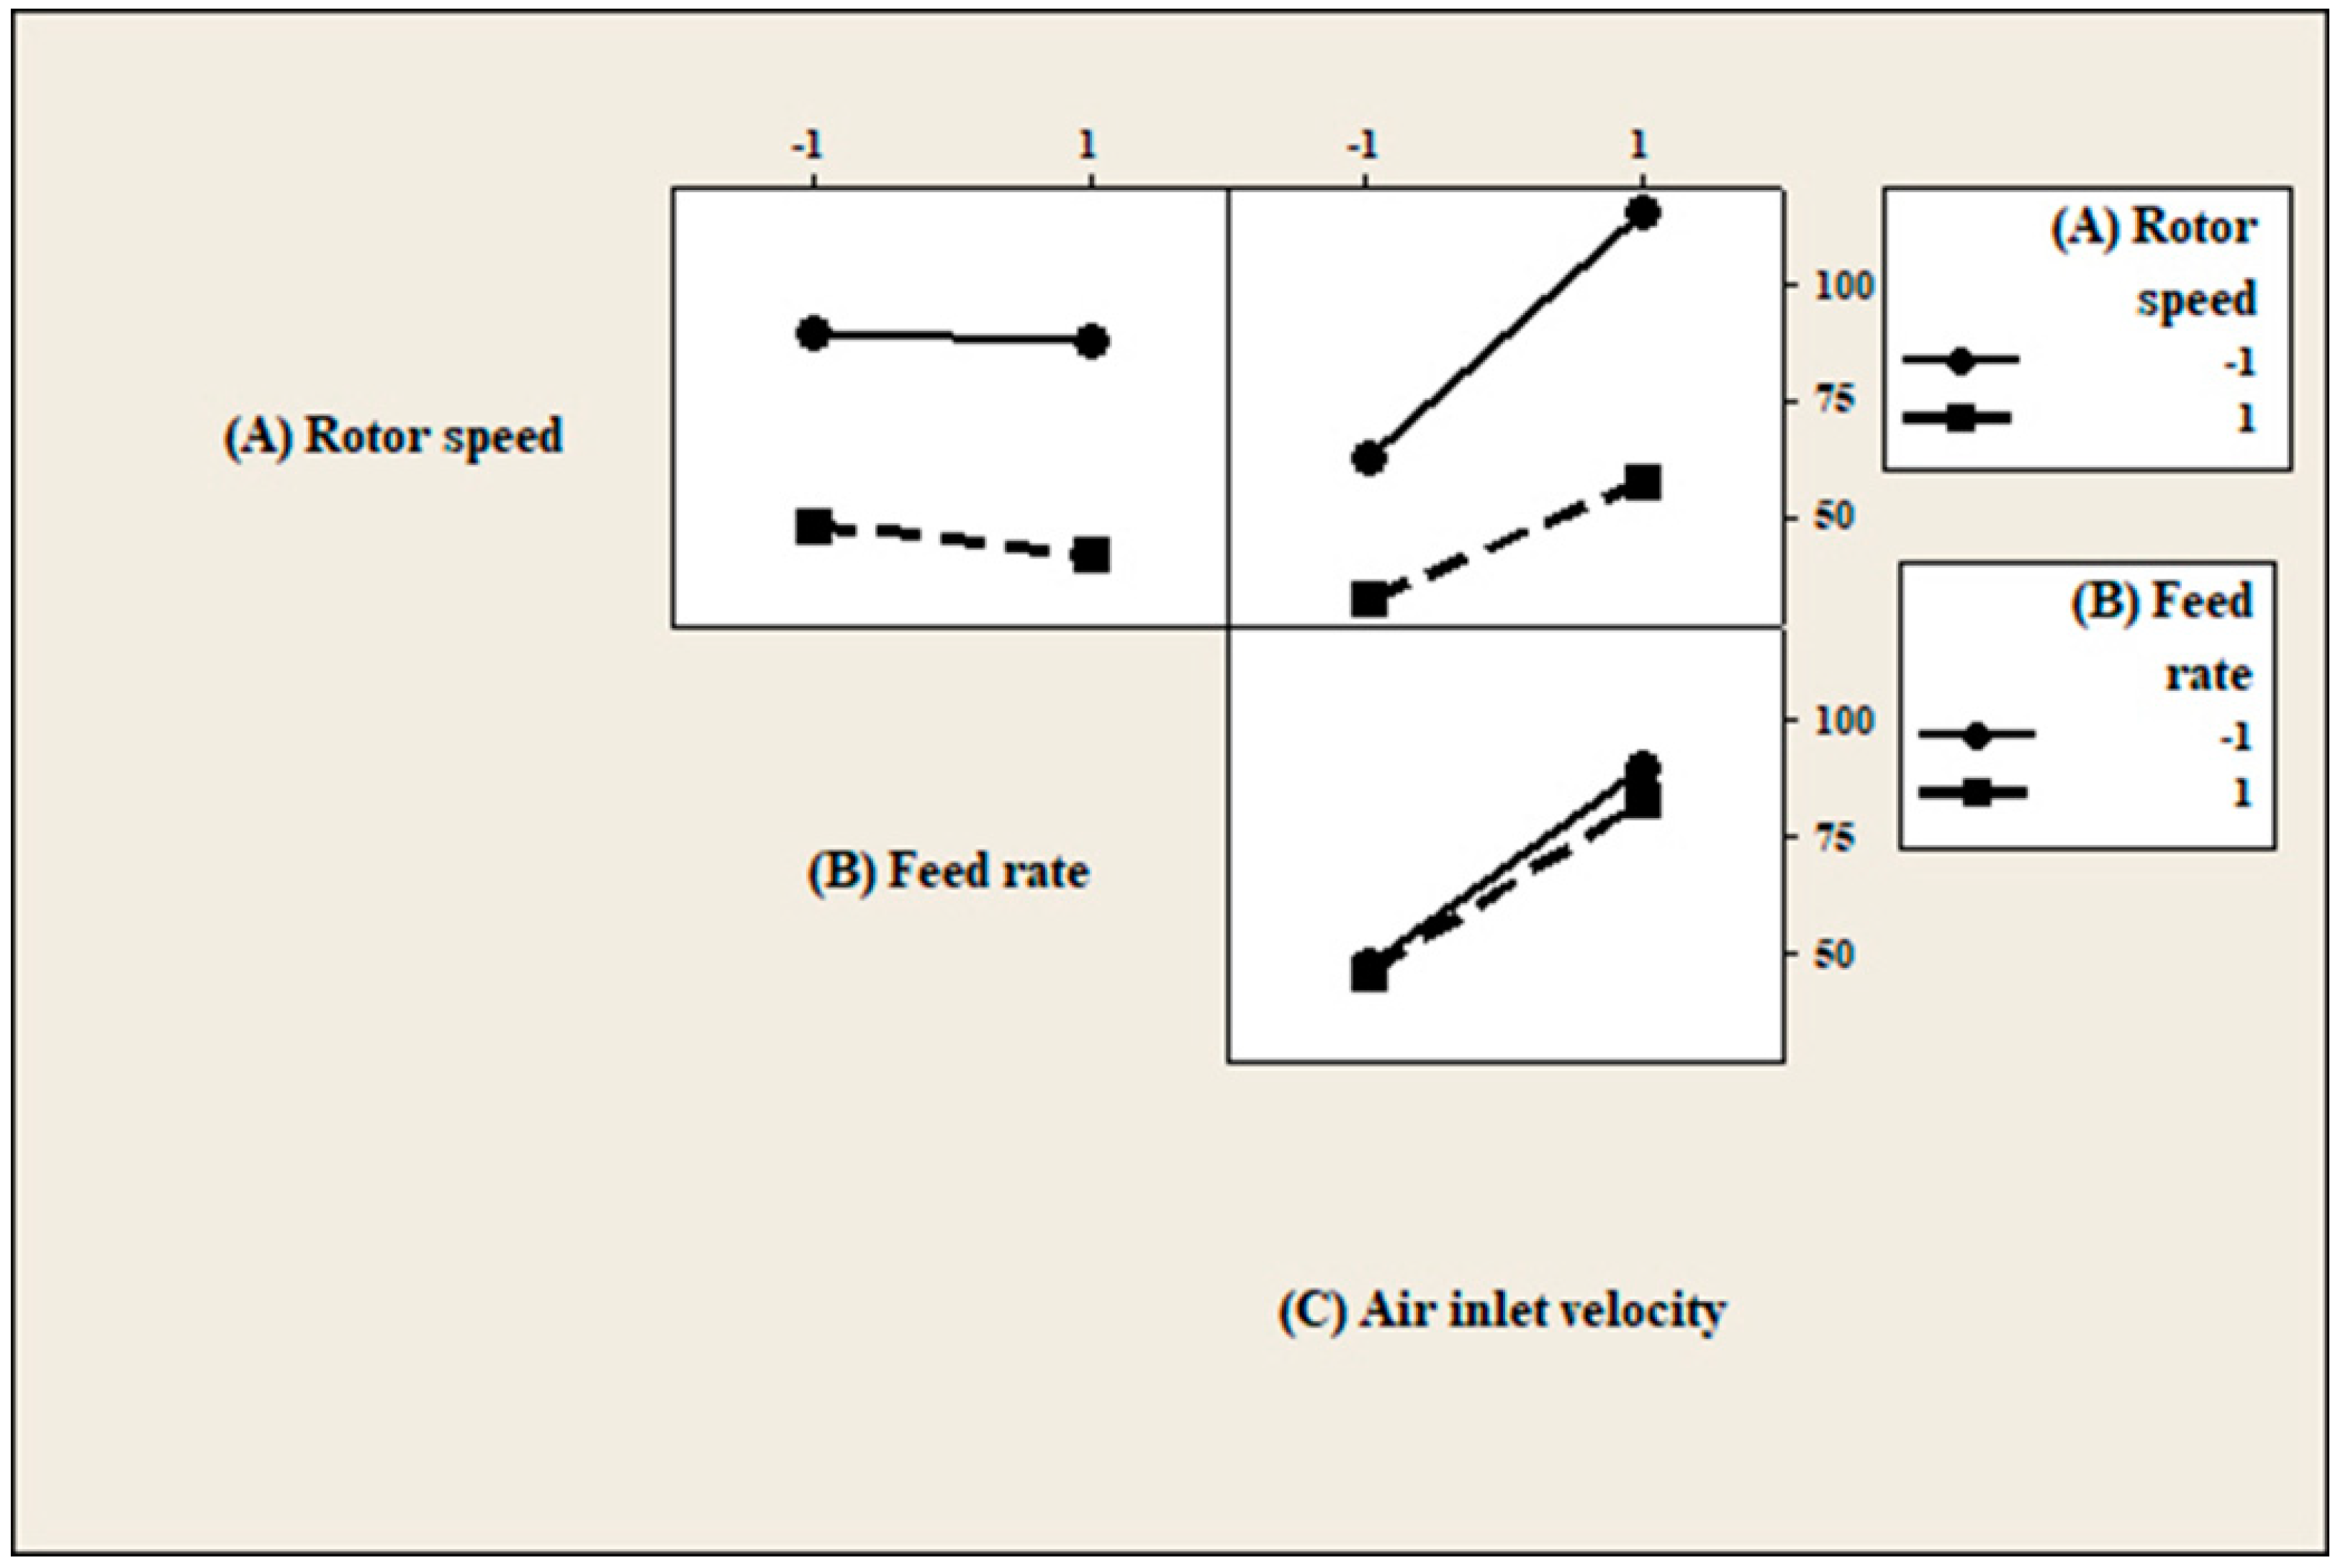
3.1. Statistical Analysis

The experimental results and cut sizes of classifications by turbo air classifier are shown in Table 2. The 16 data were statistically analyzed using MINITAB 16 to determine the individual and interaction effects between parameters, namely, rotor speed (A), feed rate (B), and air velocity (C). Because the effect of each parameter represents a change in the response (i.e., the cut size), the response is affected by changing each parameter from a low to high level. The codified mathematical model for the 2-level factorial design used in experiments is given by Equation (2) [22,23,24], i.e.,
d 50 = β 0 + β 1 A + β 2 B + β 3 C + β 12 A B + β 13 A C + β 23 B C + β 123 A B C
where d50 is the predicted response; A, B, and C represent the corresponding parameters in their coded forms; β0 is the mean; β1, β2, and β3 are the linear coefficients; and β12, β13, β23, and β123 are the interaction coefficients.

3.2. Analysis of Variance

The sum of squares was employed to evaluate the effects of factors. Furthermore, the F-ratios and the P-values from ANOVA are shown in Table 3. The statistically significant effects of the factors were examined using P-values. It was found that the main effects (A, B and C), two-way interaction (A × C) and three-way interaction (A × B × C) were statistically significant because the P-values from the ANOVA test were less than the confidence limit (α = 0.05) at which the null hypothesis could be rejected. However, the two-way interactions A × B and B × C were not significant.
Table 4 shows the effects, the linear coefficients, the standard errors, the T-values, and the P-value from the analysis of the 23-factorial design of experiments. The main effects indicate average values for each experimental run between a low level and high level. If the effect value of a parameter (in column 3 of Table 4) is positive, for example, the effect of air inlet velocity (C), it means that the cut size is increased with increasing the air inlet velocity from a low to a high level. Inversely, if the effect value is negative, for instance the effect of rotor speed (A), the cut size is decreased with increasing the rotator speed from a low level to a high one. By substituting the coefficients of A, B, C, AB, AC, BC, and ABC from Table 4 into Equation (2), we obtain a model equation for the cut size as follows:
d 50 = 66.66 22.15 A 2.13 B + 19.83 C 1.24 A B 6.97 A C 1.21 B C 6.03 A B C
When considering the p-values of the parameters shown in Table 4, the parameters are significant if their p-value is less than the confidence limit α = 0.05; if their p-values are greater than 0.05, they are not significant. It was found that the p-values of parameters AB and BC are greater than 0.05. The parameters AB and BC can be discarded due to their insignificance. Hence, the cut size model in Equation (3) can be reduced to Equation (4), as follows:
d 50 = 66.66 22.15 A 2.13 B + 19.83 C 6.97 A C 6.03 A B C
A normal probability plot of the standardized effects on cut size is shown in Figure 4. The graph is used to identify the effect of the operating parameter, that is, whether it is statistically significant or not significant. All calculated effects are plotted against a straight line which represents the normal distribution line. The results show that the main effects A, B, and C and the interaction effects AC and ABC stay away from the normal distribution line. Thus, the effects are considered statistically significant at the 5% significance level (α = 0.05). Factors A and C have a stronger effect on the cut size since they both lie farther from the straight line. The effects of factors B, AC, and ABC are slightly significant, since they are closer to the straight line. By contrast, factors AB and BC (the two solid circles shown in Figure 4) are not significant.
A Pareto chart of standardized effects on cut size is shown in Figure 5. The chart shows the relative importance of the effects. The t-value is equal to 2.31, based on the 95% confidence level and eight degrees of freedom. The vertical line on the chart represents the lowest statistical significance of the effect. The individual and interaction effects with a higher value than the reference line are considered potentially important. From the Pareto chart in Figure 5, it is seen that the effects of the factors A, C, AC, ABC, and B are significant, while the effects of AB and BC are not significant.
Figure 6 shows a main effect plot to indicate how the operating parameters of the separator affect the cut diameter of classification. It can be seen that each parameter influences the cut size in a different manner. With regard to the main effect of rotor speed (A), the cut size decreased with increasing speed of the cage rotor from 194 RPM to 406 RPM. The cut size increased with an increase in the air velocity (C) from 5.0 m/s to 8.5 m/s. These results are consistent with the work previously reported by Yu et al. [18]. However, the increase in feed rate (B) from 4 kg/h to 27 kg/h very slightly decreased the cut size. Changes in cut size with respect to changes in rotor speed, velocity inlet, and feed rate are the slopes of the line graphs shown in Figure 6. It can be observed that the effects of rotor speed and air inlet velocity on cut size are much stronger than that of the feeding rate, since the slopes of the speed of the cage rotor’s rotation and air velocity are steeper than that of the feeding rate [25].
The interaction effects of the operating parameters of the turbo air classifier on cut size are shown in Figure 7. The interaction plot represents the effect of one parameter, which is dependent on the level of another parameter. It is seen that there are interactions between rotor speed (A) and air inlet velocity (C). Because the lines of effects A and C are likely to cross each other (they are not parallel), these two factors are considered to interact with each other significantly [26]. This means that at the low air velocity of 5 m/s, the decrease in cut size was about 30 μm, from 62.0 to 31.7 μm, when the rotor speed was increased from 194 to 406 RPM. However, at the higher inlet air velocity of 8.5 m/s, the change in speed of the cage-type rotor from 194 to 406 RPM was able to decrease the cut size by 58 μm, from 115.6 to 57.4 μm. When the air velocity increased from 5 m/s to 8.5 m/s, the interactions between parameters A and B, as well as B and C, were not significant; the solid line and the dotted line are almost parallel [26]. In addition, the results of the interaction effects plot in Figure 7 are consistent with those results previously presented in Table 4 in which the interactions AB and BC had the p-values higher than 0.05 (>95% confidence limit).

3.3. Experimental Verification

In order to confirm the results from the DOE, additional turbo air classification experiments were carried out on the SAC305 powder at the high rotor speed of 619 RPM by varying the air inlet velocities to 5, 6.5, and 8.5 m/s. Figure 8 shows a comparison of cut size from experiments performed at rotor speeds 197, 408, and 619 RPM, and at air velocities 5, 6.5, and 8.5 m/s, using a fixed feed rate of 4 kg/h. It is seen that the cut size is obviously affected by the speed of the cage rotor and the inlet velocity. In other words, the cut size decreases with higher rotational speed; however, it increases with an increase in air inlet velocity, which is consistent with the results from the DOE analysis. Guo et al. [14] found that when the rotor speed increased, velocity in the separation zone would be affected because this factor caused a decrease in the radial velocity and an increase in the tangential velocity, contributing to the higher centrifugal force applied to the particles and consequently a decrease in the cut size. Theoretically, increasing the rotational velocity of the rotor cage causes a strong centrifugal force which is applied to the particles. The large particles are thrown outward by the centrifugal force and are moved downward and dropped into the collector tank at the bottom of the classifier as a coarse powder product, resulting in a decrease in cut size. With increasing inlet air velocity, the drag force of the air stream acting on the particles increases. Some large and small particles will be carried to the center of the cage-type rotor by the upward airflow and will be collected in the dust collector chamber as a fine powder product. This results in the increase of the cut diameter of classification of the cage-type air separator [21]. In the present work, it was noted that for the experiments performed at the rotational velocity of 619 RPM and at the air inlet velocities of 5 and 6.5 m/s, the Tromp curves of classification calculated using Equation (1) cannot be constructed to obtain the cut size since at too high an air inlet velocity the two forces acting on the particles are very different. Using the rotor speed 619 RPM, air inlet velocities 5 and 6.5 m/s can cause an excessive centrifugal force. In the turbo air classifier, the centrifugal force is required for powder size separation. The magnitude of centrifugal force depends on the rotor speed and the particle size of powder. The large particles are acted by the strong centrifugal force field. They are immediately thrown outside the annular gap of the air classifier and collected as the coarse product [14]. Under these experimental conditions in this study, most of the powder was collected as the coarse product. Very small amount of fine particles was collected by the dust collector as the fine product. Consequently, these two products were not effectively separated by the classifier.
Figure 9 shows the relationship between cut size and air inlet velocity for the experiments performed at two constant rotor speeds of 194 RPM and 406 RPM at a fixed feed rate of 4 kg/h. It can be clearly seen that with increasing inlet air velocity of the separator the cut size becomes coarser. Since at a higher air inlet velocity the air stream flowing upward will act on the particles more intensively, the coarse particles will be moved together with the fine particles and collected in the dust collector chamber as a fine powder product. This brings about increasing cut size. The results in Figure 9 also confirm that the cut sizes obtained from the experiments performed at high rotor speed (406 RPM) are smaller than those using the low rotor speed (194 RPM).
From the present experimental results it can be discerned that the rotor speed and air inlet velocity have a stronger impact on the cut diameter of the cage-type separator than the feeding rate. Additional experiments were performed by extending the rotor speed to the third level of 619 RPM at inlet air velocities of 8.0, 6.5, and 5.0 m/s, as presented in Figure 8. It was found that at a fixed feed rate of 4 kg/h and air velocity 8.5 m/s, a cut diameter of 42 μm was obtained. However, for the experiments at air velocities of 6.5 m/s and 5.0 m/s, the separations were not complete, and the cut size could not be determined from the Tromp curves. The cut size, at a fixed rotor speed of 406 RPM and air inlet velocity 6.5 m/s, was 41 μm, which was larger than the expected 30 μm cut size. The smallest cut size, 27.8 μm, was achieved from the experiment which used a rotor speed of 406 RPM and an inlet velocity of 5.0 m/s. Moreover, at air inlet velocities 6.5 m/s and 5.0 m/s the cut size tended to decrease with increasing rotor speed. If a target cut size ≤30 μm is expected for turbo air classification, the rotor speed should be increased to a level between 406 and 619 RPM. For further study, experiments should be focused on rotor speeds 500 and 550 RPM to achieve the target cut size.
Figure 10 displays the particle size distributions of the SAC305 powder for the experiments run at two different air inlet velocities, namely, 6.5 m/s and 8.5 m/s, using the same rotational speed of the cage type rotor 619 RPM and feed rate 4 kg/h. In Figure 10a the particle size distribution curves of the feed and fine powder products are similar (the curves almost overlap each other) but the particle size distribution of the coarse powder is different from these two. If we consider the d50 of the feed and fine powder products, they are almost equal. These results indicate that the separation of fine particles from the feed powder was not effectively performed. In addition, this condition might be caused by collision and agglomeration of powders during classification, leading to overlapping between the coarse and fine products. The phenomenon of particle agglomeration generally results from the van der Waals force acting on the fine particles [27]. By contrast, the particle size distributions in Figure 10b for the experiment run at air inlet velocity 8.5 m/s, the curves of feed, coarse, and fine powder products are clearly separated. This means that at the air inlet velocity 8.5 m/s, the feed powder was effectively separated into fine and coarse power products. In fact, increasing the magnitude of the air inlet velocity to a proper value causes not only the increasing of cut size but also the helping of the feed powders to be effectively classified owing to the higher drag force acting on the particles. However, increasing air inlet velocity over the optimum value is able to decrease the classification precision because of a large difference in the velocity distribution in the annular region [14]. This leads to air turbulence or collision of particles in the annular area.
SEM micrographs of coarse and fine powder products from the turbo air classification using an inlet air velocity of 8.5 m/s, rotor speed of 619 RPM, and feed rate of 4 kg/h, are shown in Figure 11. It can be seen that under this air classification condition, there are no agglomerations of particles observed in both products. However, it may be observed from Figure 11a that there are some small particles mixed within the coarse product and also from Figure 11b that there are some large particles mixed within the fine product. This might be the result of the fish-hook effect, which is the phenomenon that the fine particles are collected and mixed into the coarse product, usually found in particle size separation by hydrocyclone. The fish-hook effect is probably due to the feed material consisting of particles with a wide range of particle size distribution [28]. In the turbo air classifier, the fish-hook effect may be attributed to the increase in rotational speed and feed powder with smaller sizes. This results in a low efficiency of classification [27].
Figure 12 shows an elemental spectrum from EDS (Energy Dispersive Spectroscopy) analysis of the SAC305 lead-free solder fine powder product. EDS (Oxford Instruments, High Wycombe, UK) analysis was used to semi-quantitatively check the main chemical composition of the SAC powder with regard to Sn, Ag, and Cu and also prohibited elements Pb and Cd which must not be contained in a lead-free solder alloy. In the EDS analysis there were no elements subtracted from the analysis. The composition of the fine powder product mainly consisted of Sn, Ag, and Cu. The elements Pb and Cd were not detected. It may be noted that peaks of C and O were also detected from the powder sample. The small amount of carbon present is possibly from the carbon adhesive tape, which is used for adhering the powder sample onto the SEM specimen stub. The presence of oxygen is probably from the oxide on the surface of powder itself. The surface of the powder can be easily oxidized and form an oxide film is formed during powder production by the centrifugal atomization process [29]. It might be oxidized during the turbo air classification process as well since the process is performed in an ambient air atmosphere.

4. Conclusions

In this work, the effects of operating parameters, namely, rotor speed, feed rate, the air inlet velocity, of a turbo air classifier on its cut size were studied for particle size separation of a SAC305 lead-free solder powder. The variations in rotor speed and air inlet velocity strongly affected the cut size of classification, while the feed rate had a weaker effect. The smallest cut size of 27.8 μm was achieved when the turbo air classifier was operated at a rotor speed of 406 RPM, feed rate 4 kg/h, and air inlet velocity 5 m/s. Even though an increase in rotor speed tended to reduce the cut size, particle size separation did not completely take place at the too high rotor speed of 619 RPM. This limitation might be attributed to the turbulence air flow in the separation zone (annular area) of the cage-type separator. Rotor speed between 406 RPM and 619 RPM is an appropriate speed to operate the turbo air classifier in order to obtain the target cut sizes smaller than 27.8 μm. The present work focused only on cut size as a performance index of the turbo air classifier; however, there are other indices for evaluating the performance of powder classification, including the sharpness of classification and the powder separation yield. These two performance indices are challenges and are recommended for future study. It may be suggested that an appropriate design of the rotor cage is an important factor affecting the performance of the turbo air classifier since it can create a smooth velocity distribution of air flow in the classifier. Hence, the use of different types of rotor cage in the air turbo classifier for future study on the size separation of high-density powders is recommended.

Author Contributions

N.D., S.J. and K.B. carried out the experiment, analyzed the experimental results and wrote the original draft. T.P. and S.J. analyzed the results and wrote the manuscript.

Funding

This research was funded by the Graduate School at Prince of Songkla University (PSU Ph.D. Scholarship grant) and the Thailand Government Research grant ENG570120s.

Acknowledgments

The authors would like to thank the Department of Mining and Materials Engineering, within the Faculty of Engineering, Prince of Songkla University, for their laboratory facilities. Moreover, the authors are grateful for the PSU Ph.D. Scholarship grant of the Graduate School and the financial support provided through the Thailand Government Research grant ENG570120s.

Conflicts of Interest

The authors declare no conflicts of interest.

References

  1. Kim, K.; Huh, S.; Suganuma, K. Effects of intermetallic compounds on properties of Sn–Ag–Cu lead-free soldered joints. J. Alloy. Compd. 2003, 352, 226–236. [Google Scholar] [CrossRef]
  2. Park, Y.; Bang, J.H.; Oh, C.M.; Hong, W.S.; Kang, N. Effect of eutectic structure on creep properties of Sn-3.0Ag-0.5Cu and Sn-8.0Sb-3.0Ag solders. Metals 2017, 7, 540. [Google Scholar] [CrossRef]
  3. Basak, A.K.; Pramanik, A.; Rizzi, H.; Silakhori, M.; Netting, K.O. Development of Pb-free nanocomposite solder alloys. J. Compos. Sci. 2018, 2, 28. [Google Scholar] [CrossRef]
  4. Farooq, M.; Ray, S.; Sarkhel, A.; Goldsmith, C. Evaluation of lead (Pb)-free ceramic ball grid array (CBAG): Wettability, microstructure and reliability. In Proceedings of the 51st Electronic Components and Technology Conference, Orlando, FL, USA, 29 May–1 June 2001; pp. 978–986. [Google Scholar]
  5. Neikov, O.D. Atomization and Granulation. In Handbook of Non-Ferrous Metal Powders, 1st ed.; Neikov, O.D., Naboychenko, S.S., Dowson, G., Eds.; Elsevier: Oxford, UK, 2009; pp. 102–142. [Google Scholar]
  6. Shapiro, M.; Galperin, V. Air classification of solid particle: A review. Chem. Eng. Process. Intensif. 2005, 44, 279–285. [Google Scholar] [CrossRef]
  7. Chen, C.; Wang, L.; Luo, Z.; Zhao, Y.; Lv, B.; Fu, Y.; Xu, X. The effect of the characteristics of the partition plate unit on the separation process of -6 mm fine coal in the compound dry separator. Minerals 2019, 9, 215. [Google Scholar] [CrossRef]
  8. Wang, Q.; Melaaen, M.C.; Silva, S.R.D. Investigation and simulation of a cross-flow air classifier. Powder Technol. 2001, 120, 273–280. [Google Scholar] [CrossRef]
  9. Wang, X.; Ge, X.; Zhao, X.; Wang, Z. Study on horizontal turbine classification. Powder Technol. 1999, 102, 166–170. [Google Scholar] [CrossRef]
  10. Galk, J.; Peukert, W.; Krahnen, J. Industrial classification in a new impeller wheel classifier. Powder Technol. 1999, 105, 186–189. [Google Scholar] [CrossRef]
  11. Kolacz, J. Investigating flow conditions in dynamic air classification. Miner. Eng. 2002, 15, 131–138. [Google Scholar] [CrossRef]
  12. Wang, X.; Ge, X.; Zhao, X.; Wang, Z. A model for performance of the centrifugal countercurrent air classifier. Powder Technol. 1998, 98, 171–176. [Google Scholar] [CrossRef]
  13. Lai, W.H.; Lu, W.F.; Chen, C.C. The new expression of the effectiveness of powder classification. Adv. Powder Technol. 2005, 16, 611–620. [Google Scholar] [CrossRef]
  14. Guo, L.; Liu, J.; Liu, S.; Wang, J. Velocity measurements and flow field characteristic analyses in a turbo air classifier. Powder Technol. 2007, 178, 10–16. [Google Scholar] [CrossRef]
  15. Eswaraiah, C.; Angadi, S.I.; Mishra, B.K. Mechanism of particle separation and analysis of fish-hook phenomenon in a circulating air classifier. Powder Technol. 2012, 218, 57–63. [Google Scholar] [CrossRef]
  16. Huang, Q.; Liu, J.; Yu, Y. Turbo air classifier guide vane improvement and inner flow field numerical simulation. Powder Technol. 2012, 226, 10–15. [Google Scholar] [CrossRef]
  17. Ren, W.; Liu, J.; Yu, Y. Design of a rotor cage with non-radial arc blades for turbo air classifiers. Powder Technol. 2016, 292, 46–53. [Google Scholar] [CrossRef]
  18. Yu, Y.; Liu, J.; Zhang, K. Establishment of a prediction model for the cut size of turbo air classifiers. Powder Technol. 2014, 254, 274–280. [Google Scholar] [CrossRef]
  19. Box, G.E.P.; Hunter, W.G.; Hunter, J.S. Statistics for Experiments; Wiley: New York, NY, USA, 1978; pp. 313–316. [Google Scholar]
  20. Mejeoumov, G.G. Improved Cement Quality and Grinding Efficiency by Means of Closed Mill Circuit Modelling. Ph.D. Thesis, Texas A&M University, College Station, TX, USA, 2007. [Google Scholar]
  21. Yu, Y.; Ren, W.; Gao, L.; Liu, J. Analysis and optimization of process parameters affecting classification performances indices of the turbo air classifier. Materialwissenschaft und Werkstofftechnik 2015, 46, 970–977. [Google Scholar] [CrossRef]
  22. Singh, B.P.; Besra, L.; Bhattacharjee, S. Factorial design of experiments on the effect of surface charges on stability of aqueous colloidal ceramic suspension. Colloids Surf. A Physicochem. Eng. Asp. 2002, 204, 175–181. [Google Scholar] [CrossRef]
  23. Carmona, M.E.R.; da Silva, M.A.P.; Leite, S.G.F. Biosorption of chromium using factorial experimental design. Process Biochem. 2005, 40, 779–788. [Google Scholar] [CrossRef]
  24. Turan, N.G.; Elevli, S.; Messi, B. Adsorption of copper and zinc ions on illite: Determination of the optimal conditions by the statistical design of experiments. Appl. Clay Sci. 2011, 52, 392–399. [Google Scholar] [CrossRef]
  25. Meet Minitab Tutorial-SlideShare. Available online: https://www.slideshare.net/shanmu31/meet-minitab-tutorial (accessed on 20 May 2019).
  26. Montgomery, D.C. Design and Analysis of Experiments, 5th ed.; Wiley: New York, NY, USA, 2001; pp. 170–171. [Google Scholar]
  27. Dong, L.; Jin, Q.; Liu, X.; Ahangarkani, M.; Zheng, C.; Zhang, Y. Experimental and theoretical analysis of the classification of Sn0.3Ag0.7Cu lead-free solders powder. Vacuum 2018, 156, 277–282. [Google Scholar] [CrossRef]
  28. Neesse, T.; Dueck, J.; Minkov, L. Separation of finest in hydrocyclones. Miner. Eng. 2004, 17, 689–696. [Google Scholar] [CrossRef]
  29. Plookphol, T.; Wisutmethangoon, S.; Gonsrang, S. Influence of process parameters on SAC305 lead-free solder powder produced by centrifugal atomization. Powder Technol. 2011, 214, 506–512. [Google Scholar] [CrossRef]
Figure 1. Particle size distribution of the SAC305 feed powder.
Processes 07 00427 g001
Figure 2. SEM micrograph of SAC305 lead-free solder powder, which was used as feed material for turbo air classification experiments.
Processes 07 00427 g002
Figure 3. Schematic outline of classification process used in this study. 1: vibratory feeder, 2: turbo air classifier, 3: dust collector, and 4: centrifugal fan.
Processes 07 00427 g003
Figure 4. Normal probability plot of standardized effects for cut size (at α = 0.05).
Processes 07 00427 g004
Figure 5. Pareto chart of standardized effects for cut size (α = 0.05).
Processes 07 00427 g005
Figure 6. Main effects plot for cut size.
Processes 07 00427 g006
Figure 7. Interaction effects plot for cut size.
Processes 07 00427 g007
Figure 8. Plot of cut size against rotor speed for the experiments performed at air inlet velocities of 5, 6.5, and 8.5 m/s and a feed rate of 4 kg/h (of note is that for the results at rotor speed 619 RPM and air inlet velocities 5 and 6.5 m/s, the Tromp curves of classification used for evaluating cut size could not be constructed—see explanation in the text).
Processes 07 00427 g008
Figure 9. Plot cut size against air inlet velocity from the experiments performed at constant rotor speeds of 194 and 406 RPM and feed rate 4 kg/h.
Processes 07 00427 g009
Figure 10. Particle size distributions of SAC305 powder from turbo air classifications performed using inlet air velocities of (a) 6.5 and (b) 8.5 m/s at the same rotor speed of 619 RPM and feed rate 4 kg/h.
Processes 07 00427 g010
Figure 11. SEM micrographs of SAC305 lead-free solder powder products from turbo air classification experiments using an air inlet velocity of 8.5 m/s, rotor speed 619 RPM, and feed rate 4 kg/h; (a) coarse product and (b) fine product.
Processes 07 00427 g011
Figure 12. EDS (Energy Dispersive Spectroscopy) spectrum of SAC305 lead-free solder fine powder product.
Processes 07 00427 g012
Table 1. Operating parameters and their levels.
ParametersParameter Name (unit)Level
Low (−1)High (+1)
ARotor speed (RPM)194406
BFeed rate (kg/h)427
CAir inlet velocity (m/s)58.5
Table 2. The 23-factorial experimental design with duplication and the results of cut size (d50: average particle size at 50% cumulative volume percentage) from the experiments.
Std OrderRun OrderCenter PtBlocks(A) Rotor Speed (RPM)(B) Feed Rate (kg/h)(C) Air Inlet Velocity (m/s)Cut Size (μm)
13111−1−11112.1
821111146.9
11311−11−157.0
9411−1−1−166.7
451111−139.4
66111−1163.8
1271111−131.7
108111−1−130.8
5911−1−11111.2
16101111146.6
31111−11−155.5
71211−111117.9
11311−1−1−168.7
1414111−1172.2
151511−111121.1
216111−1−124.7
Table 3. ANOVA for the cut size (d50).
SourcesDegree of FreedomSum of SquaresMean SquaresFP
A: Rotor speed17847.77847.75674.860.000
B: Feed rate172.972.896.270.037
C: Air inlet velocity16292.96292.85541.150.000
A × B124.624.582.110.184
A × C1777.4777.4366.850.000
B × C123.423.352.010.194
A × B × C1581.9581.9050.040.000
Pure error893.011.63
Total1515,713.8
Table 4. Statistical parameters for 23-factorial design of experiments.
TermsEffectsCoefficientsStandard Error CoefficientsTP
Constant 66.660.852578.190.000
A−44.29−22.150.8525−25.980.000
B−4.27−2.130.8525−2.500.037
C39.6619.830.852523.260.000
AB−2.46−1.240.8525−1.450.184
AC−13.94−6.970.8525−8.180.000
BC−2.42−1.210.8525−1.420.194
ABC−12.06−6.030.8525−7.070.000
S3.41008
R-Sq0.9941
R-Sq (adj)0.9889

