A Computational Fluid Dynamics Approach for the Modeling of Gas Separation in Membrane Modules


Abstract
1. Introduction
2. Numerical Methods
2.1. Assumptions
- Steady-state and ideal gas conditions;
- Isothermal conditions;
- Solution–diffusion mechanism for permeation;
- Permeance not dependent on the concentration of gas or the feed pressure;
- No axial mixing of gaseous molecules;
- Constant pressure drop on the feed and permeate side.
2.2. Mathematical Modeling of Mass Transport
2.2.1. Convection and Diffusion Model
2.2.2. Diffusion Term
2.2.3. Membrane Model
2.2.4. Membrane Flux
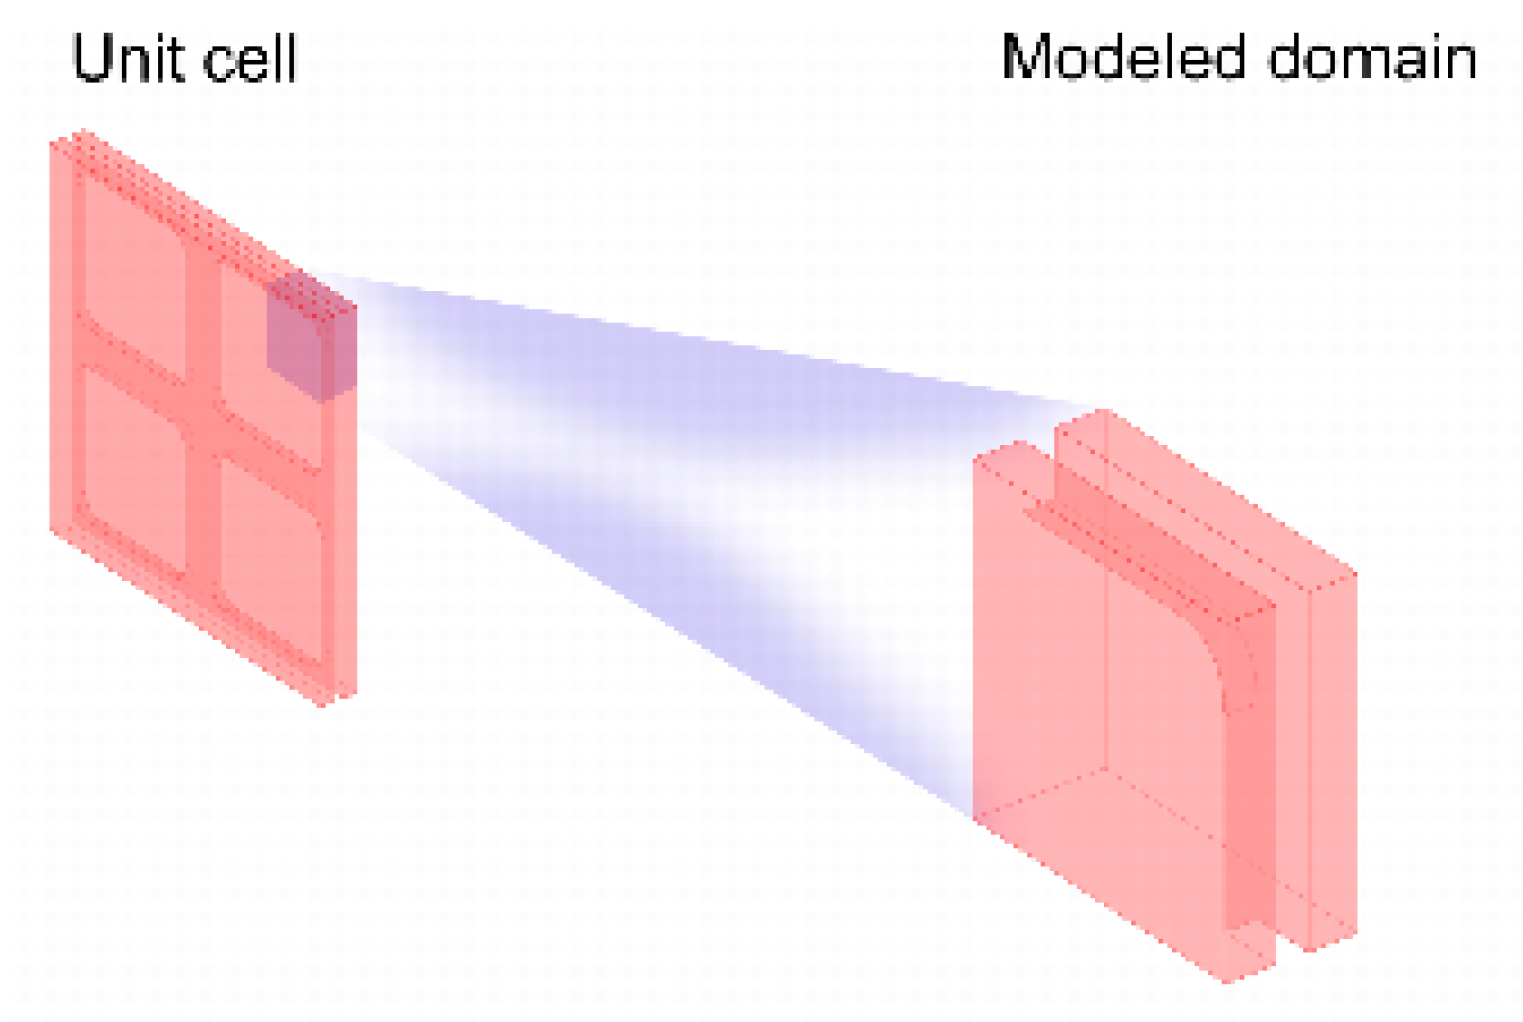
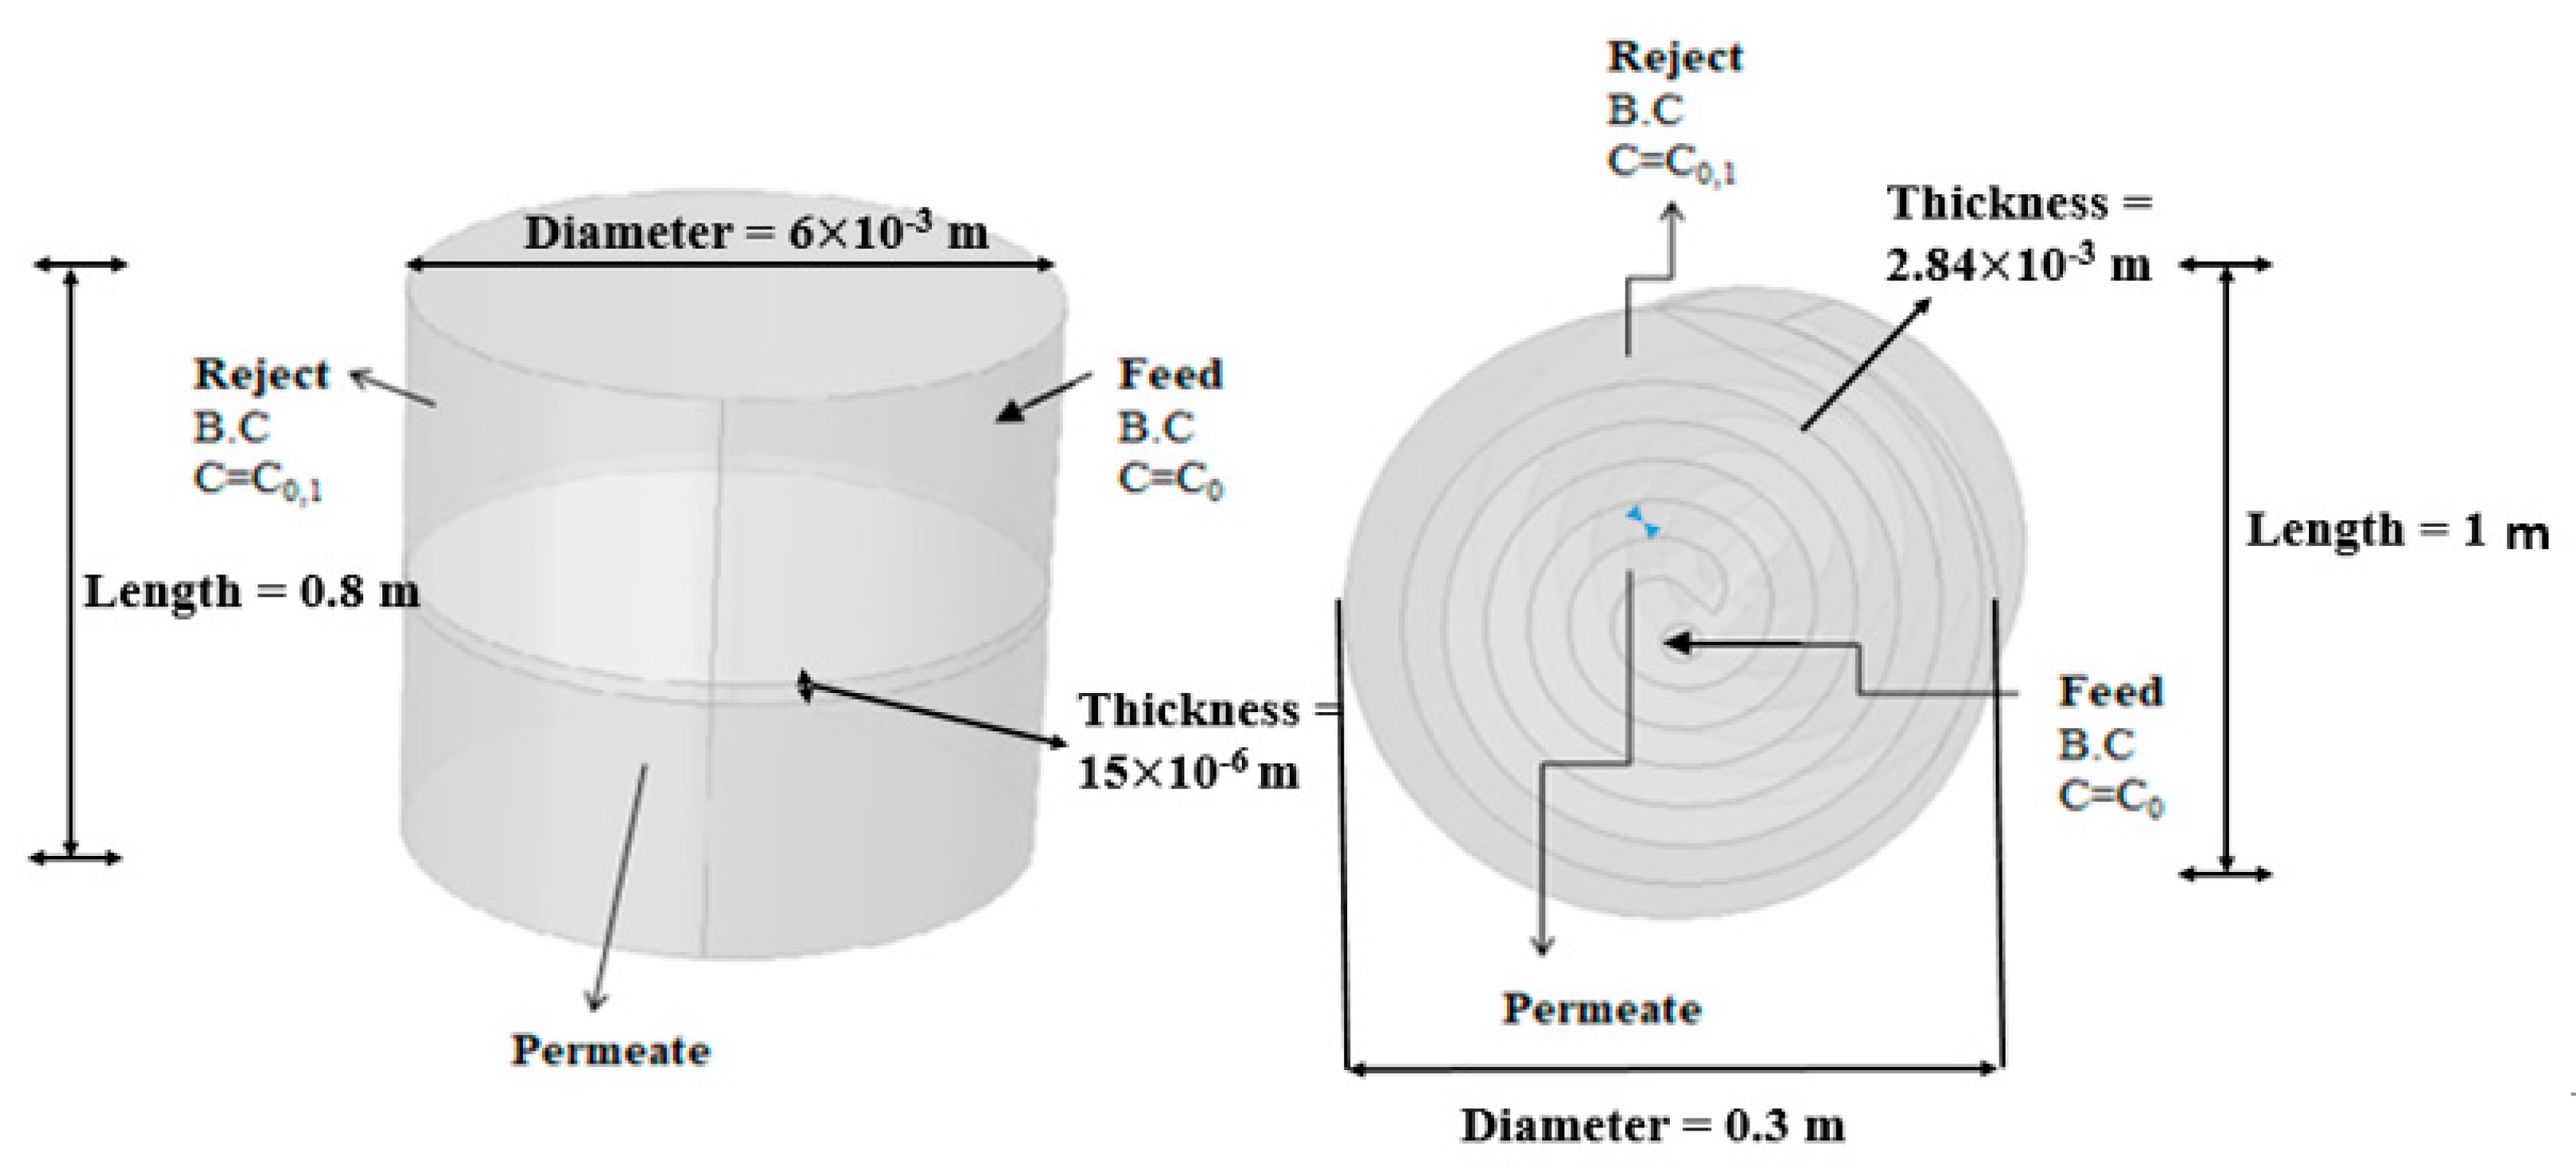
2.3. Geometry
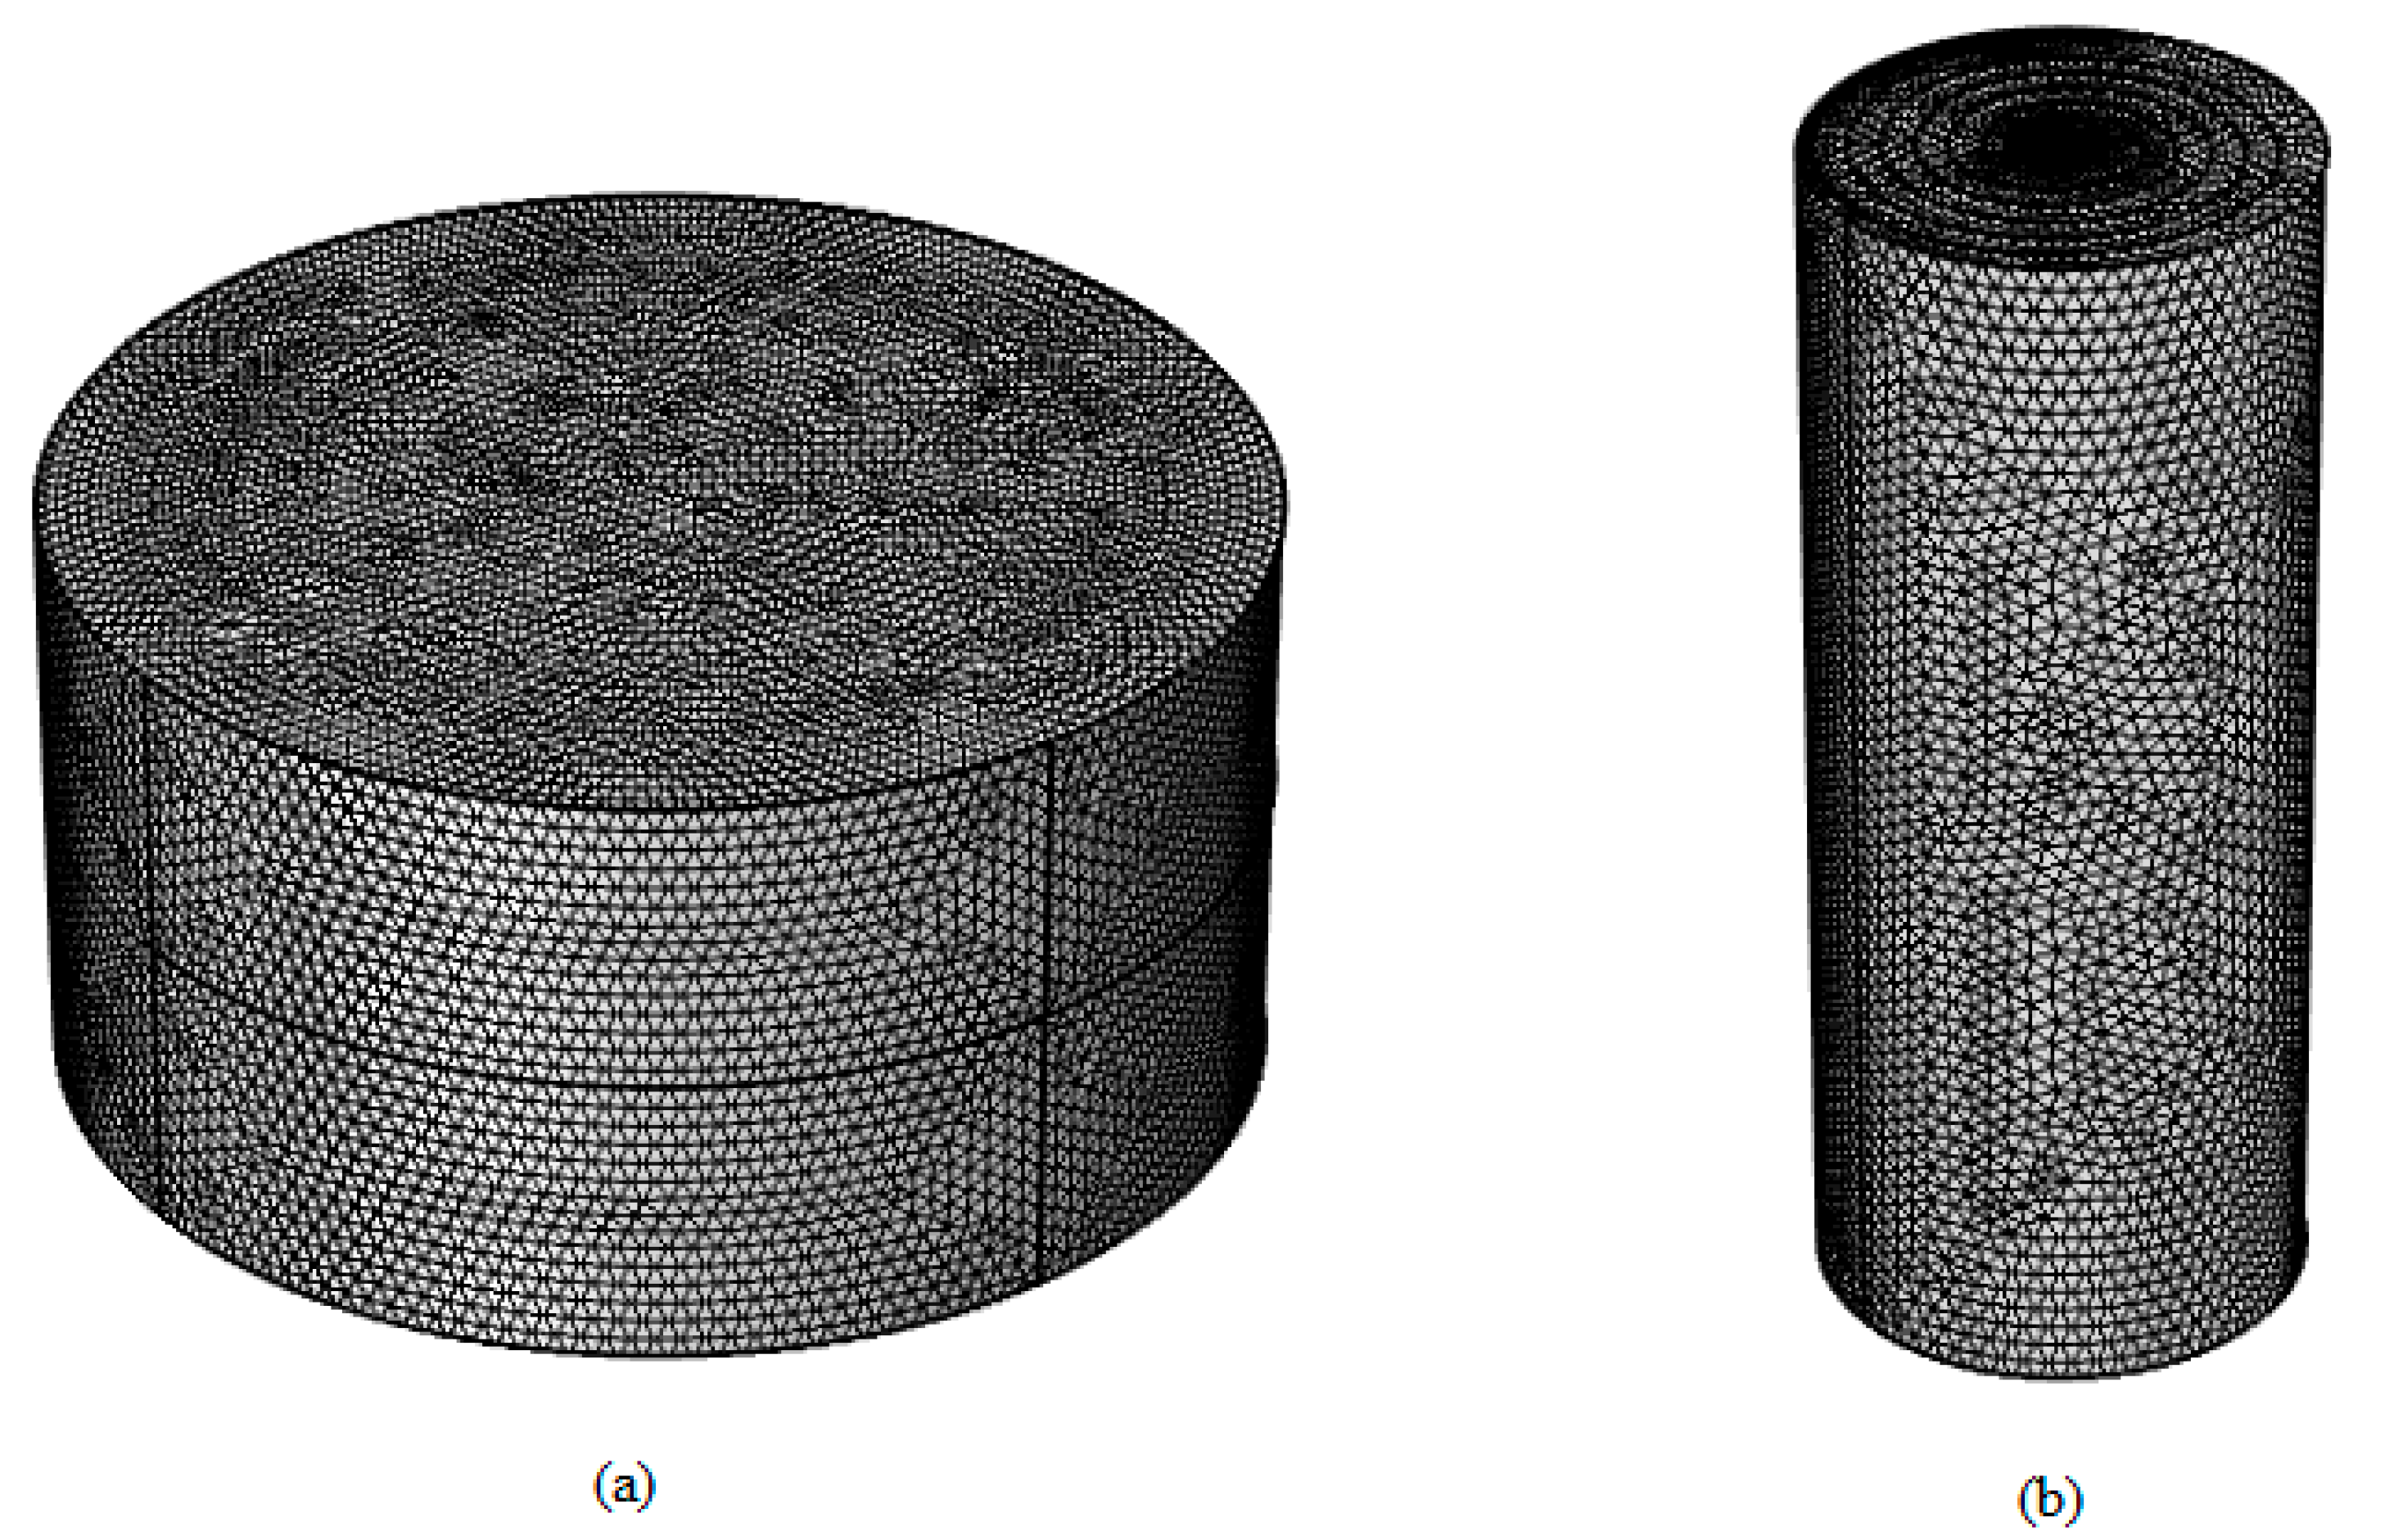
2.4. Meshing
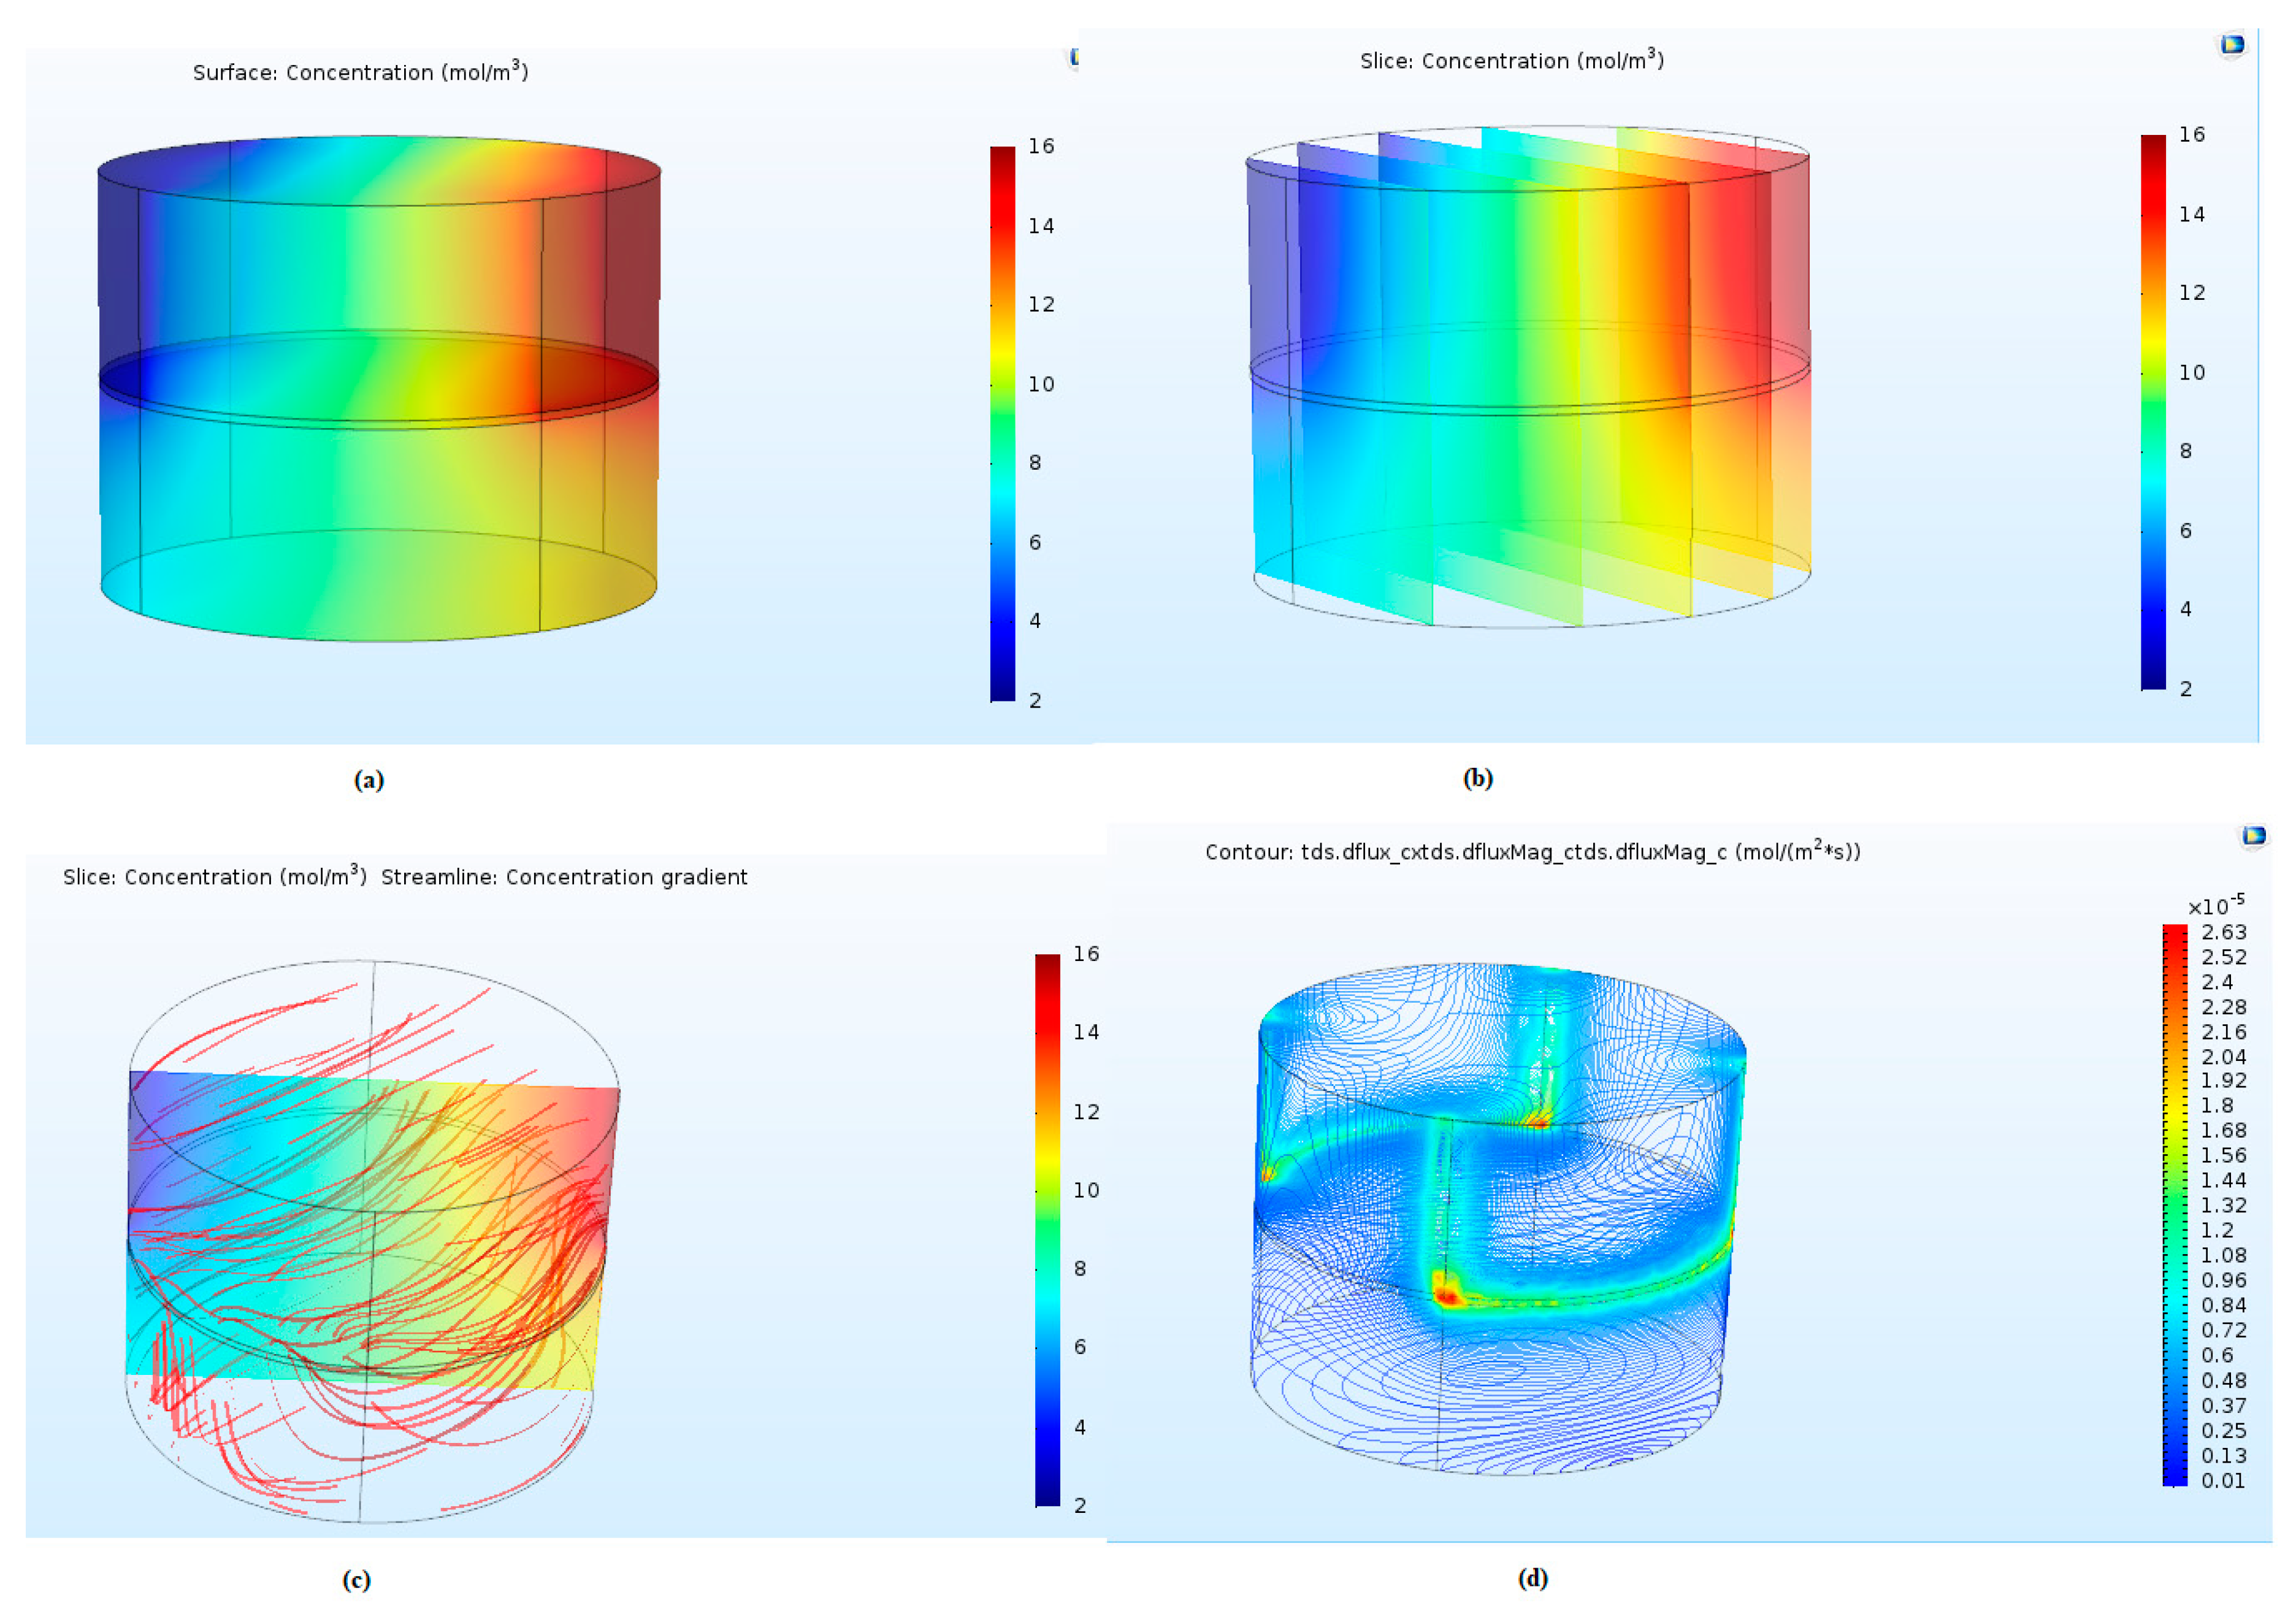
3. Results
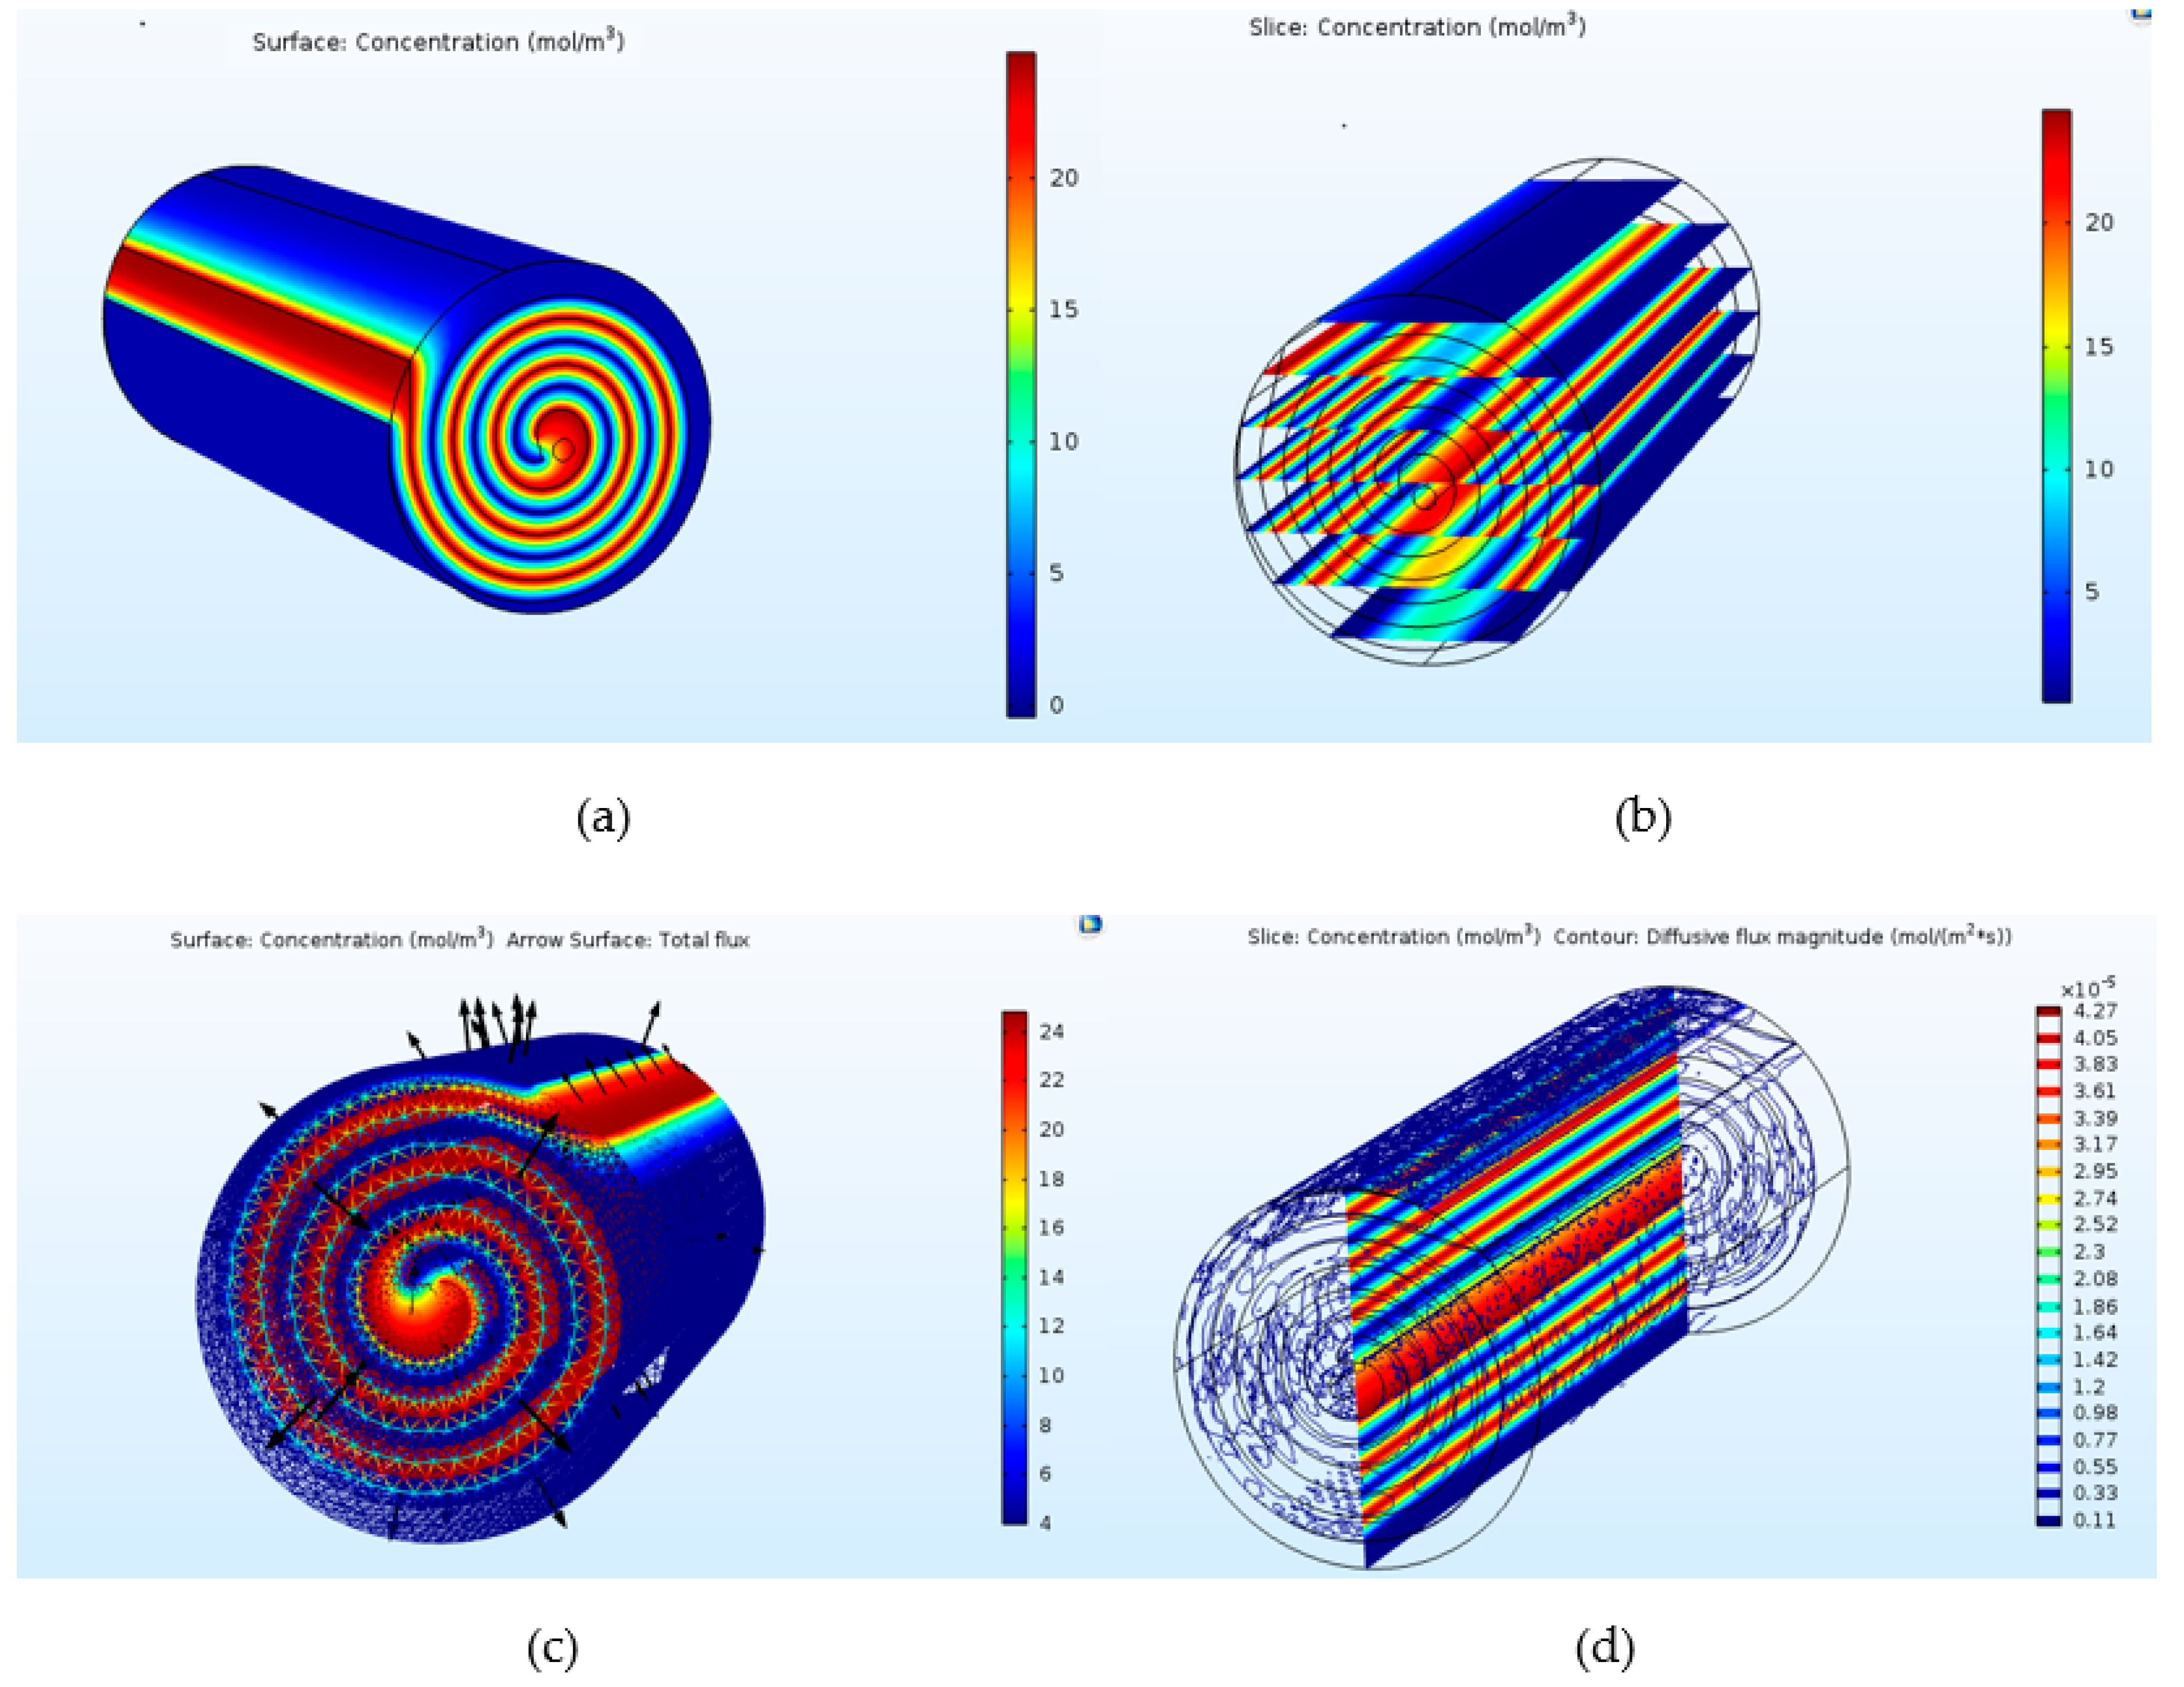
3.1. CH4/C2H6 Separation
3.2. CH4/CO2 Separation
3.3. Parametric Study of the Spiral Wound Membrane Module
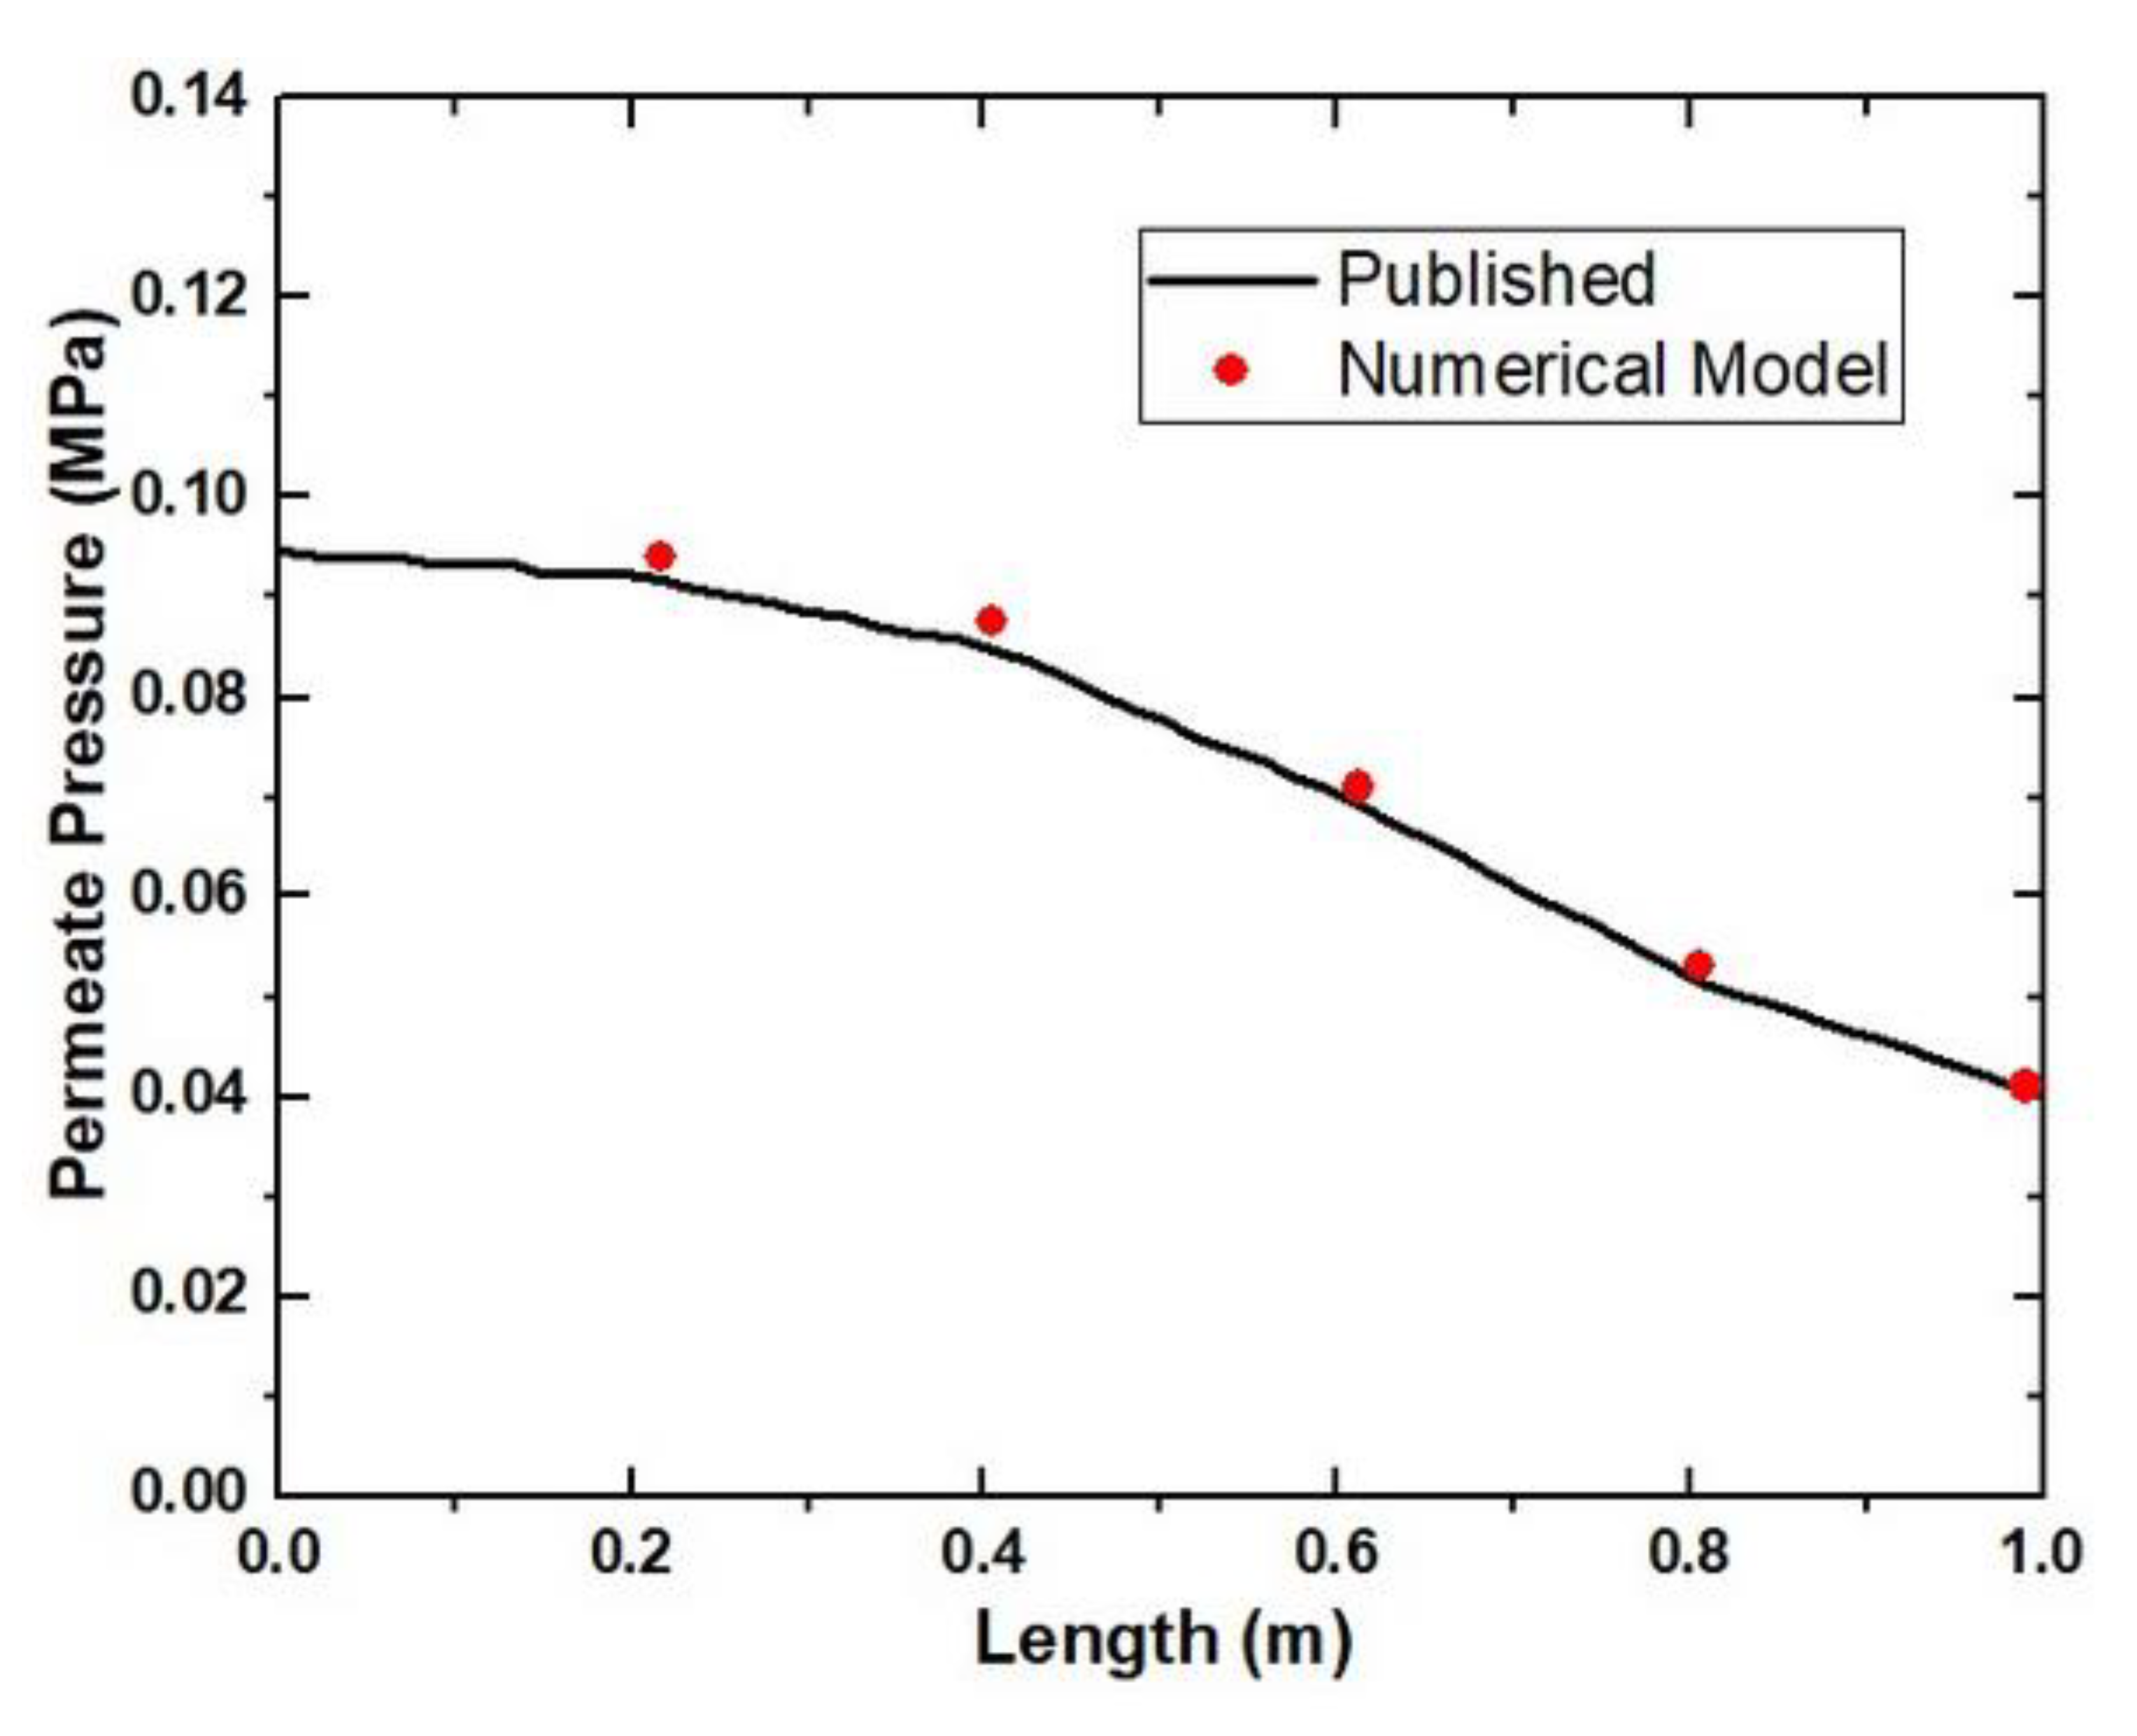
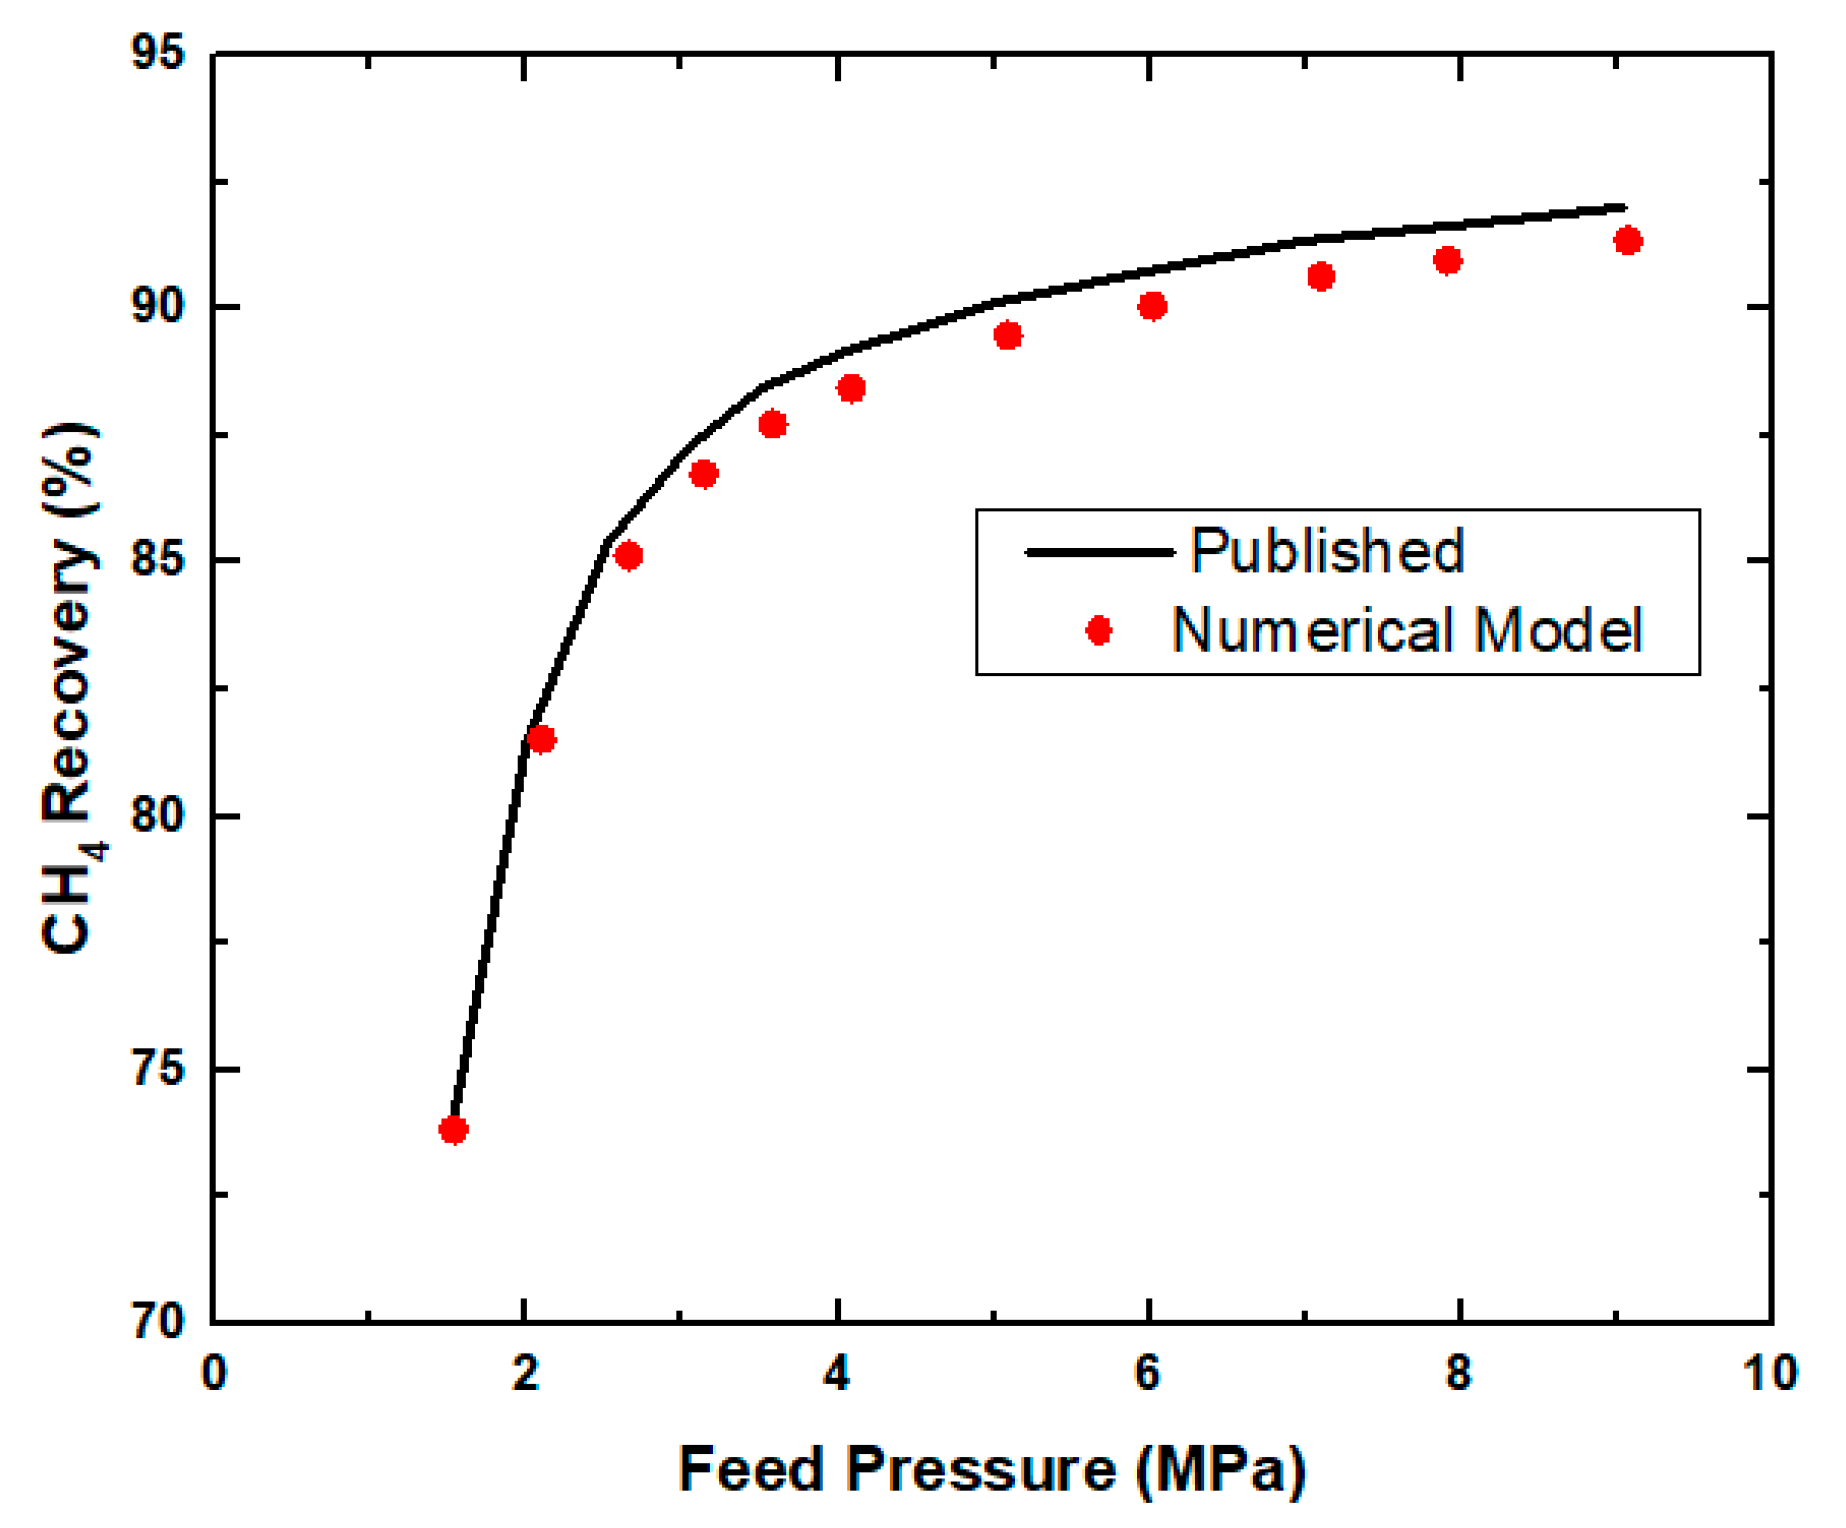
Feed Pressure and Permeate Pressure
3.4. Parametric Study for the Flat Sheet Membrane Module
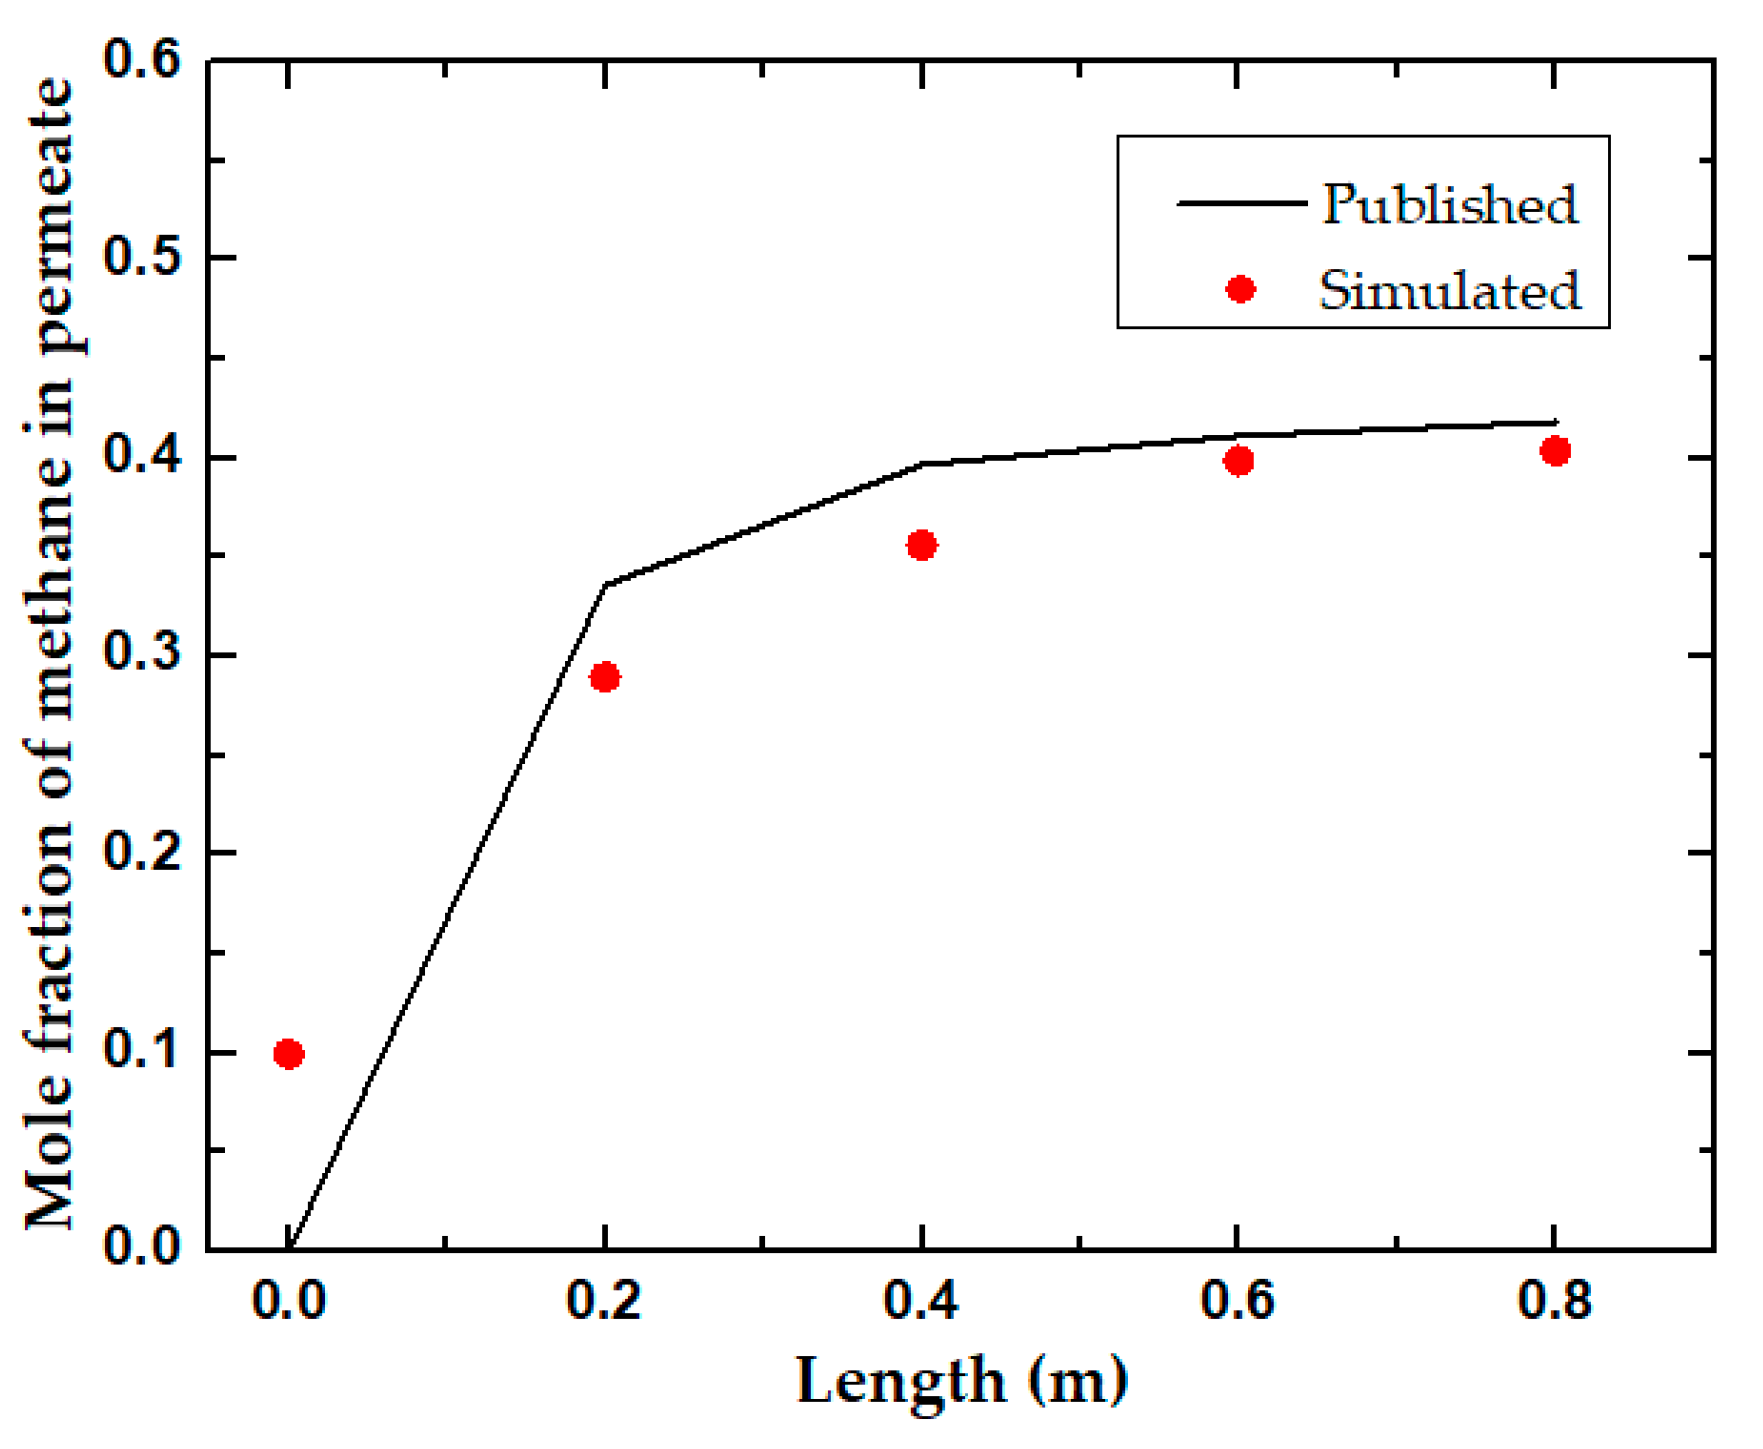
Feed Pressure and Length
4. Discussion
5. Conclusions
Author Contributions
Funding
Conflicts of Interest
List of symbols
| C | Concentration of a (mol/m3) |
| Diffusion coefficient (m2/s) | |
| Initial concentration (mol/m3) | |
| Final concentration (mol/m3) | |
| P | Permeance (mol/(m2·s·pa)) |
| S | Solubility in the membrane (mol/(m3·pa)) |
| Feed pressure (Pa) | |
| Permeate pressure (Pa) | |
| Membrane thickness (m) | |
| Difference in concentration (mol/m3) | |
| Gradient of the partial pressure of gases (Pa) | |
| Diffusive flux (mol/m2·s) |
References
- Alkhamis, N.; Anqi, A.E.; Oztekin, A. Computational study of gas separation using a hollow fiber membrane. Int. J. Heat Mass Transf. 2015, 89, 749–759. [Google Scholar] [CrossRef]
- Wetenhall, B.; Race, J.; Downie, M. The effect of CO2 purity on the development of pipeline networks for carbon capture and storage schemes. Int. J. Greenh. Gas Control 2014, 30, 197–211. [Google Scholar] [CrossRef]
- Conti, J.; Holtberg, P.; Diefenderfer, J.; LaRose, A.; Turnure, J.T.; Westfall, L. International Energy Outlook 2016 with Projections to 2040; USDOE Energy Information Administration (EIA): Washington, DC, USA, 2016. [Google Scholar]
- Hakim, A.K. Numerical Simulation of Gas Separation by Hollow Fiber Membrane. 2017. Theses and Dissertations. 2624. Available online: http://preserve.lehigh.edu/etd/2624 (accessed on 2 July 2018).
- Forward, Y. A carbon capture and storage network for Yorkshire and Humber. In An Introduction to Understanding the Transportation of CO2 from Yorkshire and Humber Emitters into Offshore Storage Sites; Yorkshire Forward Victoria House: Leeds, UK, 2008. [Google Scholar]
- Mechleri, E.; Brown, S.; Fennell, P.S.; Mac Dowell, N. CO2 capture and storage (CCS) cost reduction via infrastructure right-sizing. Chem. Eng. Res. Des. 2017, 119, 130–139. [Google Scholar] [CrossRef]
- Bernardo, P.; Drioli, E.; Golemme, G. Membrane gas separation: A review/state of the art. Ind. Eng. Chem. Res. 2009, 48, 4638–4663. [Google Scholar] [CrossRef]
- Bernardo, P.; Clarizia, G. 30 years of membrane technology for gas separation. Chem. Eng. 2013, 32, 1999–2004. [Google Scholar]
- Shamsabadi, A.A.; Kargari, A.; Farshadpour, F.; Laki, S. Mathematical modeling of CO2/CH4 separation by hollow fiber membrane module using finite difference method. J. Membr. Sep. Technol. 2012, 1, 19–29. [Google Scholar]
- Nunes, S.P.; Peinemann, K.-V. Membrane Technology; Wiley Online Library: Hoboken, NJ, USA, 2001. [Google Scholar]
- Chen, W.-H.; Lin, C.-H.; Lin, Y.-L. Flow-field design for improving hydrogen recovery in a palladium membrane tube. J. Membr. Sci. 2014, 472, 45–54. [Google Scholar] [CrossRef]
- Lock, S.; Lau, K.; Ahmad, F.; Shariff, A. Modeling, simulation and economic analysis of CO2 capture from natural gas using cocurrent, countercurrent and radial crossflow hollow fiber membrane. Int. J. Greenh. Gas Control 2015, 36, 114–134. [Google Scholar] [CrossRef]
- Katoh, T.; Tokumura, M.; Yoshikawa, H.; Kawase, Y. Dynamic simulation of multicomponent gas separation by hollow-fiber membrane module: Nonideal mixing flows in permeate and residue sides using the tanks-in-series model. Sep. Purif. Technol. 2011, 76, 362–372. [Google Scholar] [CrossRef]
- Geankoplis, C.J. Transport Processes and Separation Process Principles: (Includes Unit Operations); Prentice Hall Professional Technical Reference: Upper Saddle River, NJ, USA, 2003. [Google Scholar]
- Wankat, P.C. Separation Process Engineering; Pearson Education: London, UK, 2006. [Google Scholar]
- Marriott, J.; Sørensen, E.; Bogle, I. Detailed mathematical modelling of membrane modules. Comput. Chem. Eng. 2001, 25, 693–700. [Google Scholar] [CrossRef]
- Pan, C. Gas separation by permeators with high-flux asymmetric membranes. AIChE J. 1983, 29, 545–552. [Google Scholar] [CrossRef]
- Alrehili, M.; Usta, M.; Alkhamis, N.; Anqi, A.E.; Oztekin, A. Flows past arrays of hollow fiber membranes–Gas separation. Int. J. Heat Mass Transf. 2016, 97, 400–411. [Google Scholar] [CrossRef]
- Ahsan, M.; Hussain, A. A computational fluid dynamics (CFD) approach for the modeling of flux in a polymeric membrane using finite volume method. Mech. Ind. 2017, 18, 406. [Google Scholar] [CrossRef]
- Saeed, A.; Vuthaluru, R.; Yang, Y.; Vuthaluru, H.B. Effect of feed spacer arrangement on flow dynamics through spacer filled membranes. Desalination 2012, 285, 163–169. [Google Scholar] [CrossRef]
- Karode, S.K.; Kumar, A. Flow visualization through spacer filled channels by computational fluid dynamics I.: Pressure drop and shear rate calculations for flat sheet geometry. J. Membr. Sci. 2001, 193, 69–84. [Google Scholar] [CrossRef]
- Thundyil, M.J.; Koros, W.J. Mathematical modeling of gas separation permeators—For radial crossflow, countercurrent, and cocurrent hollow fiber membrane modules. J. Membr. Sci. 1997, 125, 275–291. [Google Scholar] [CrossRef]
- Alkhamis, N.; Oztekin, D.E.; Anqi, A.E.; Alsaiari, A.; Oztekin, A. Numerical study of gas separation using a membrane. Int. J. Heat Mass Transf. 2015, 80, 835–843. [Google Scholar] [CrossRef]
- Mourgues, A.; Sanchez, J. Theoretical analysis of concentration polarization in membrane modules for gas separation with feed inside the hollow-fibers. J. Membr. Sci. 2005, 252, 133–144. [Google Scholar] [CrossRef]
- Ahsan, M.; Hussain, A. Computational fluid dynamics (CFD) modeling of heat transfer in a polymeric membrane using finite volume method. J. Therm. Sci. 2016, 25, 564–570. [Google Scholar] [CrossRef]
- Coroneo, M.; Montante, G.; Baschetti, M.G.; Paglianti, A. CFD modelling of inorganic membrane modules for gas mixture separation. Chem. Eng. Sci. 2009, 64, 1085–1094. [Google Scholar] [CrossRef]
- Coroneo, M.; Montante, G.; Catalano, J.; Paglianti, A. Modelling the effect of operating conditions on hydrodynamics and mass transfer in a Pd–Ag membrane module for H2 purification. J. Membr. Sci. 2009, 343, 34–41. [Google Scholar] [CrossRef]
- Chen, W.-H.; Syu, W.-Z.; Hung, C.-I.; Lin, Y.-L.; Yang, C.-C. A numerical approach of conjugate hydrogen permeation and polarization in a Pd membrane tube. Int. J. Hydrog. Energy 2012, 37, 12666–12679. [Google Scholar] [CrossRef]
- Szwast, M. Modelling the gas flow in permeate channel in membrane gas separation process. Chem. Process Eng. 2018, 39, 271–280. [Google Scholar]
- Santafé-Moros, A.; Gozálvez-Zafrilla, J. Design of a Flat Membrane Module for Fouling and Permselectivity Studies. In Proceedings of the COMSOL Conference, Paris, France, 15–17 November 2010; pp. 1–7. [Google Scholar]
- Qi, R.; Henson, M. Optimization-based design of spiral-wound membrane systems for CO2/CH4 separations. Sep. Purif. Technol. 1998, 13, 209–225. [Google Scholar] [CrossRef]
- Gholami, G.; Soleimani, M.; Takht Ravanchi, M. Mathematical Modeling of Gas Separation Process with Flat Carbon Membrane. J. Membr. Sci. Res. 2015, 1, 90–95. [Google Scholar]


| Parameters | Spiral Wound Membrane Module [31] | Flat Sheet Membrane Module [32] | Units |
|---|---|---|---|
| Feed Pressure | 35105 | 106.7103 | Pa |
| Permeate Pressure | 1.05105 | 1.1103 | Pa |
| Feed gas | 0.20 CO2 | 0.395 CH4 | Mole fraction |
| Permeance | 1.4810−9 | 210−7 | mol/(m2·s·pa) |
| Selectivity | 20 | 2.73 | |
| Module Diameter | 0.3 | 610−3 | m |
| Module Length | 1 | 0.8 | m |
| Thickness | 2.8410−3 | 1510−6 | m |
| Spiral Wound Membrane Modules | Flat Sheet Membrane Module | ||||||
|---|---|---|---|---|---|---|---|
| Selectivity PA/PB | CH4 (Permeate) | Difference (%) | Selectivity PA/PB | CH4 (Permeate) | Difference (%) | ||
| Published [31] | This Model | Published [32] | This Model | ||||
| 20 | 0.881 | 0.786 | 10.8 | 2 | 0.457 | 0.417 | 8.7 |
| 40 | 0.936 | 0.903 | 3.5 | 4 | 0.672 | 0.635 | 5.5 |
| 60 | 0.952 | 0.913 | 4.1 | 6 | 0.749 | 0.718 | 4.2 |
| 80 | 0.967 | 0.929 | 3.9 | 8 | 0.891 | 0.829 | 6.9 |
© 2019 by the authors. Licensee MDPI, Basel, Switzerland. This article is an open access article distributed under the terms and conditions of the Creative Commons Attribution (CC BY) license (http://creativecommons.org/licenses/by/4.0/).
Share and Cite
Qadir, S.; Hussain, A.; Ahsan, M. A Computational Fluid Dynamics Approach for the Modeling of Gas Separation in Membrane Modules. Processes 2019, 7, 420. https://doi.org/10.3390/pr7070420
Qadir S, Hussain A, Ahsan M. A Computational Fluid Dynamics Approach for the Modeling of Gas Separation in Membrane Modules. Processes. 2019; 7(7):420. https://doi.org/10.3390/pr7070420
Chicago/Turabian StyleQadir, Salman, Arshad Hussain, and Muhammad Ahsan. 2019. "A Computational Fluid Dynamics Approach for the Modeling of Gas Separation in Membrane Modules" Processes 7, no. 7: 420. https://doi.org/10.3390/pr7070420
APA StyleQadir, S., Hussain, A., & Ahsan, M. (2019). A Computational Fluid Dynamics Approach for the Modeling of Gas Separation in Membrane Modules. Processes, 7(7), 420. https://doi.org/10.3390/pr7070420