Article

Process Simulation of the Separation of Aqueous Acetonitrile Solution by Pressure Swing Distillation

1
College of Chemistry and Materials Engineering, Liupanshui Normal University, Liupanshui 553004, China
2
North China Company, China Petroleum Engineering Co., LTD., Renqiu 052100, China
*
Authors to whom correspondence should be addressed.
Processes 2019, 7(7), 409; https://doi.org/10.3390/pr7070409
Submission received: 24 May 2019 / Revised: 14 June 2019 / Accepted: 27 June 2019 / Published: 1 July 2019

Abstract

:
The separation of aqueous acetonitrile solution by pressure swing distillation (PSD) was simulated and optimized through Aspen Plus software. The distillation sequence of the low pressure column (LPC) and high pressure column (HPC) was determined with a phase diagram. The pressures of the two columns were set to 1 and 4 atm, respectively. Total annual cost (TAC) was considered as the objective function, and design variables, such as the tray number, the reflux ratio, and the feeding position, were optimized. The optimum process parameters were obtained. For the reduction of energy consumption, the PSD with full-heat integration was designed. The TAC of this method is lower by 32.39% of that of the PSD without heat integration. Therefore, it is more economical to separate acetonitrile and water mixture by PSD with full-heat integration, which provides technical support for the separation design of such azeotropes.

1. Introduction

Acetonitrile is an organic solvent often used to purify butadiene and fatty acids. Given its high chemical activity, acetonitrile is also used as a raw material and synthetic intermediate for pharmaceutical chemicals [1,2,3]. A considerable amount of acetonitrile–water mixture is produced during the chemical production process. Acetonitrile is toxic and expensive, so its recovery from chemical production waste liquid is beneficial from environmental and economic points of view. However, owing to the azeotropic phenomenon, acetonitrile cannot be separated from its aqueous solution by a conventional rectification method. Thus, techniques, such as extractive distillation (ED) and pressure swing distillation (PSD), are often used in the industry [4,5,6].
ED involves the addition of an extractant to the azeotrope to increase the relative volatility of light and heavy components and achieve the purpose of separation [7,8,9]. Rodriguez-Donis et al. [10] used butyl acetate as extractant to separate acetonitrile and water mixture and analyzed the feasibility of seven configurations. Raeva et al. [11] proposed that the selection of extractants should not be limited to the relative volatility, but selective analysis is also an effective method. Sazonova et al. [12] found that when ED was used to separate acetonitrile and water mixture, the energy consumption of glycerol as an extractant was lower than that of dimethylsulfoxide and 1,2-ethandiol. You et al. [13] used a multi-objective genetic algorithm to simulate and optimize the separation process of acetonitrile and water mixture by ED with ethylene glycol as an entrainer. For multi-component mixtures, many scholars adopt the technology of the dividing wall column to reduce energy consumption and equipment investment [14,15].
The advantage of PSD over ED is that PSD does not introduce a third component and can efficiently separate pressure-sensitive azeotropes [16,17,18]. The separation of acetonitrile and water mixture by PSD has already been studied by some scholars [19,20]. Repke et al. [21] studied the separation of acetonitrile and water mixture by PSD and carried out dynamic control. It was found that when the feed concentration fluctuated greatly, it could also maintain stability. Kim and Huang [22,23] optimized the process variables by taking the reboiler heat duty and total energy consumption as objective functions, respectively. Huang and Matsuda [24,25] studied the rectifying/stripping section heat integration to reduce the energy consumption in PSD, i.e., heat transfer between the rectifying section of the high pressure column (HPC) and the stripping section of the low pressure column (LPC), with a remarkable energy-saving effect. However, there is another way of heat integration, that is, heat transfer between the condenser of the HPC and the reboiler of the LPC.
For increasingly complex industrial technologies, Gao and Dai [26,27,28] proposed the fault detection and diagnosis (FDD) and data-driven approaches in the modeling, control, and optimization of complex industrial systems. Many design variables are involved in the chemical distillation industry, so commercial software, such as Aspen Plus, can better design, optimize, and control the distillation process [29,30]. Aspen Plus (Aspen Tech, Bedford, MA, USA) is a large-scale general process simulation system for plant design, steady-state design, and dynamic simulation. It is recognized as a large scale process simulation software in the chemical industry, which has been widely used in industrial design and academic research [31,32]. In this study, the conceptual design and optimization of PSD for the separation of acetonitrile and water mixture was carried out, so Aspen Plus was selected for steady-state simulation and optimization design.
This work aims to compare PSD with full heat integration and traditional PSD for the separation of acetonitrile and water mixture. At present, there is no comparison between the two methods in the literature. Therefore, in this work, Aspen Plus software was used to simulate and optimize the PSD process. The entire optimization process uses the total annual cost (TAC) as the objective function to find the optimal values of the design variables through the sequential iteration method. At the same time, full-heat integration process design for PSD was optimized and compared with PSD without heat integration from an economic point of view. The results from this work can provide some technical support for such azeotrope separation designs.

2. Design of Separation Scheme for PSD

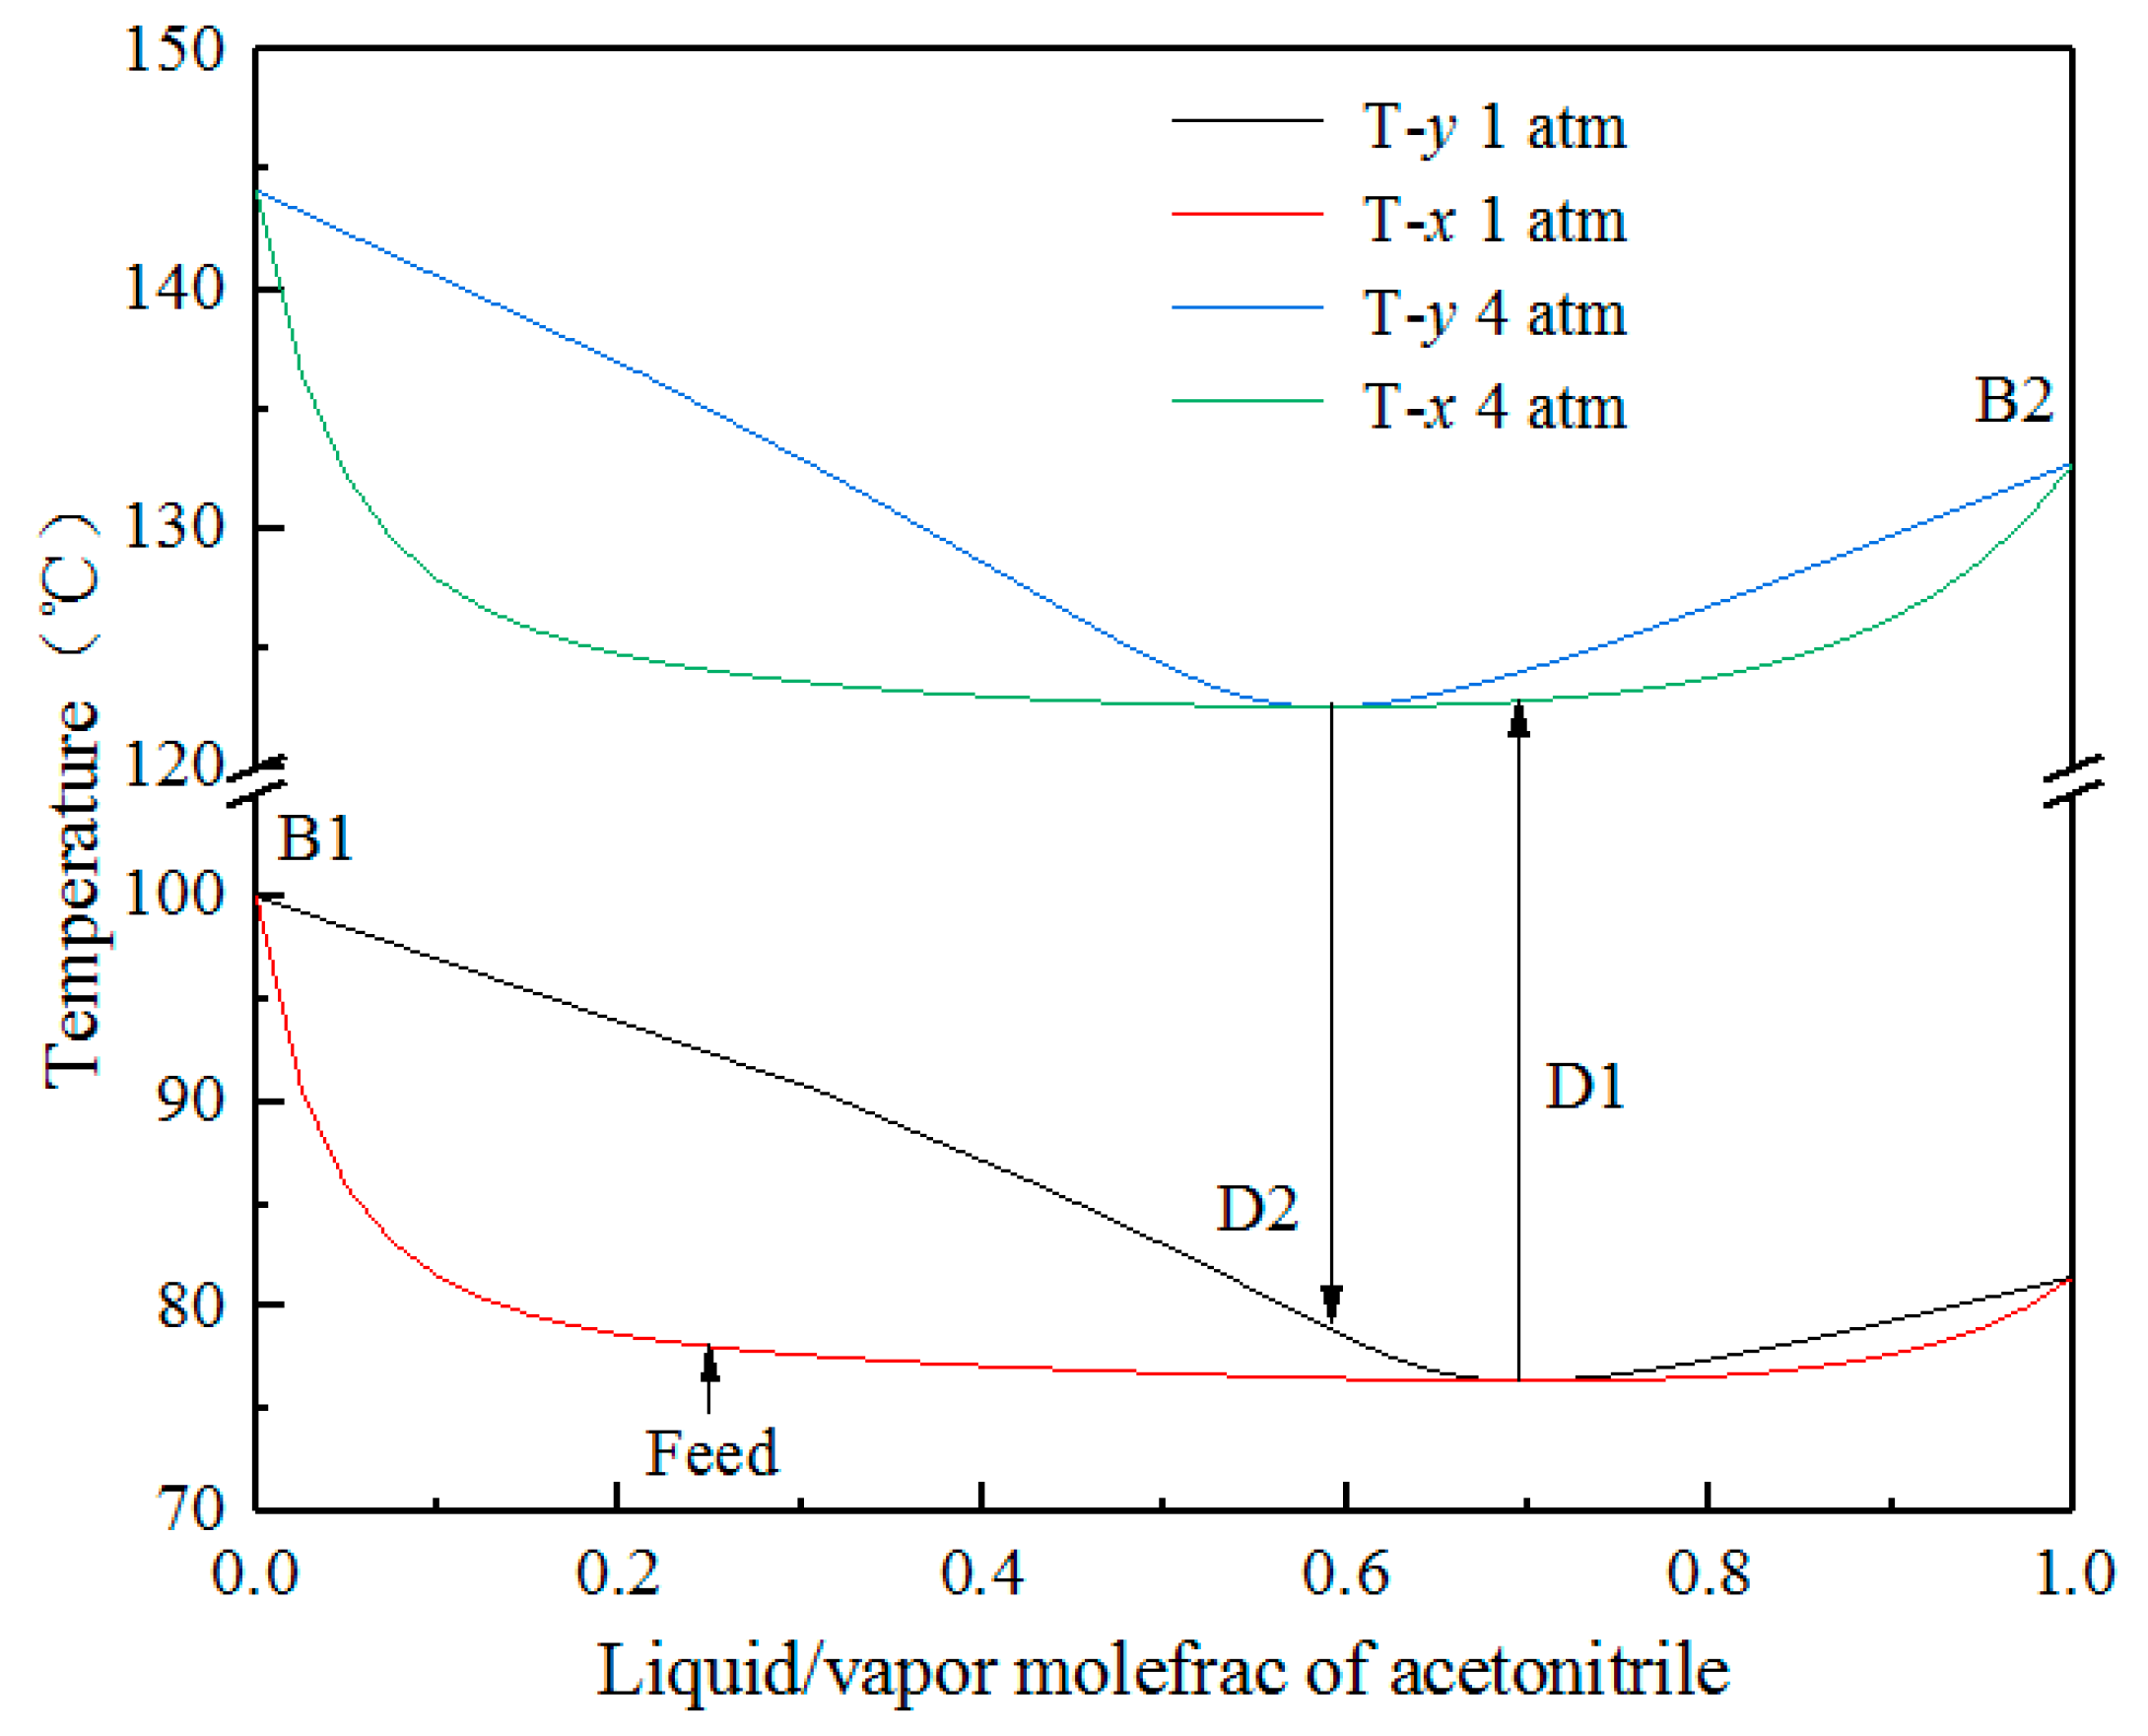
2.1. Feasibility Analysis

The calculation accuracy of the process simulation depends on the selection of the thermodynamic equation. Since the azeotropic concentration under different pressures predicted by the Wilson equation agrees well with the experimental data published in Azeotropic Data [33], the Wilson equation was used in the simulation process, and the binary interaction parameters involved in Wilson equation can be obtained in Aspen Plus software. Table 1 lists the variation of acetonitrile–water azeotrope with the pressure. The acetonitrile–water azeotrope composition is sensitive to the pressure changes. As the pressure increases from 1 to 4 atm, the mole concentration of acetonitrile decreases from 0.6971 to 0.5886, indicating that PSD is feasible for separating acetonitrile–water azeotrope.

2.2. Pressure Selection of Two Columns

Given the convenience of operation and the low cost of utility engineering, the pressure of the low pressure column (LPC) is selected to be 1 atm. In the pressure selection of the high pressure column (HPC), the cost of the heating medium used in the column reboiler should be considered. The bottom product of the HPC is acetonitrile, so the bottom temperature corresponds to the boiling point temperature of acetonitrile under this pressure. From Table 1, it can be seen that if the pressure of the HPC is 5 atm, the bottom temperature is 142.52 °C, and the low pressure (LP) steam of 160 °C cannot be used as the heating medium. Reduce the pressure of the HPC to 4 atm, there is no such situation. Here the bottom temperature is 132.79 °C, and the LP steam can meet the use requirements. In this way, the pressures for the LPC and HPC are 1 and 4 atm, respectively.

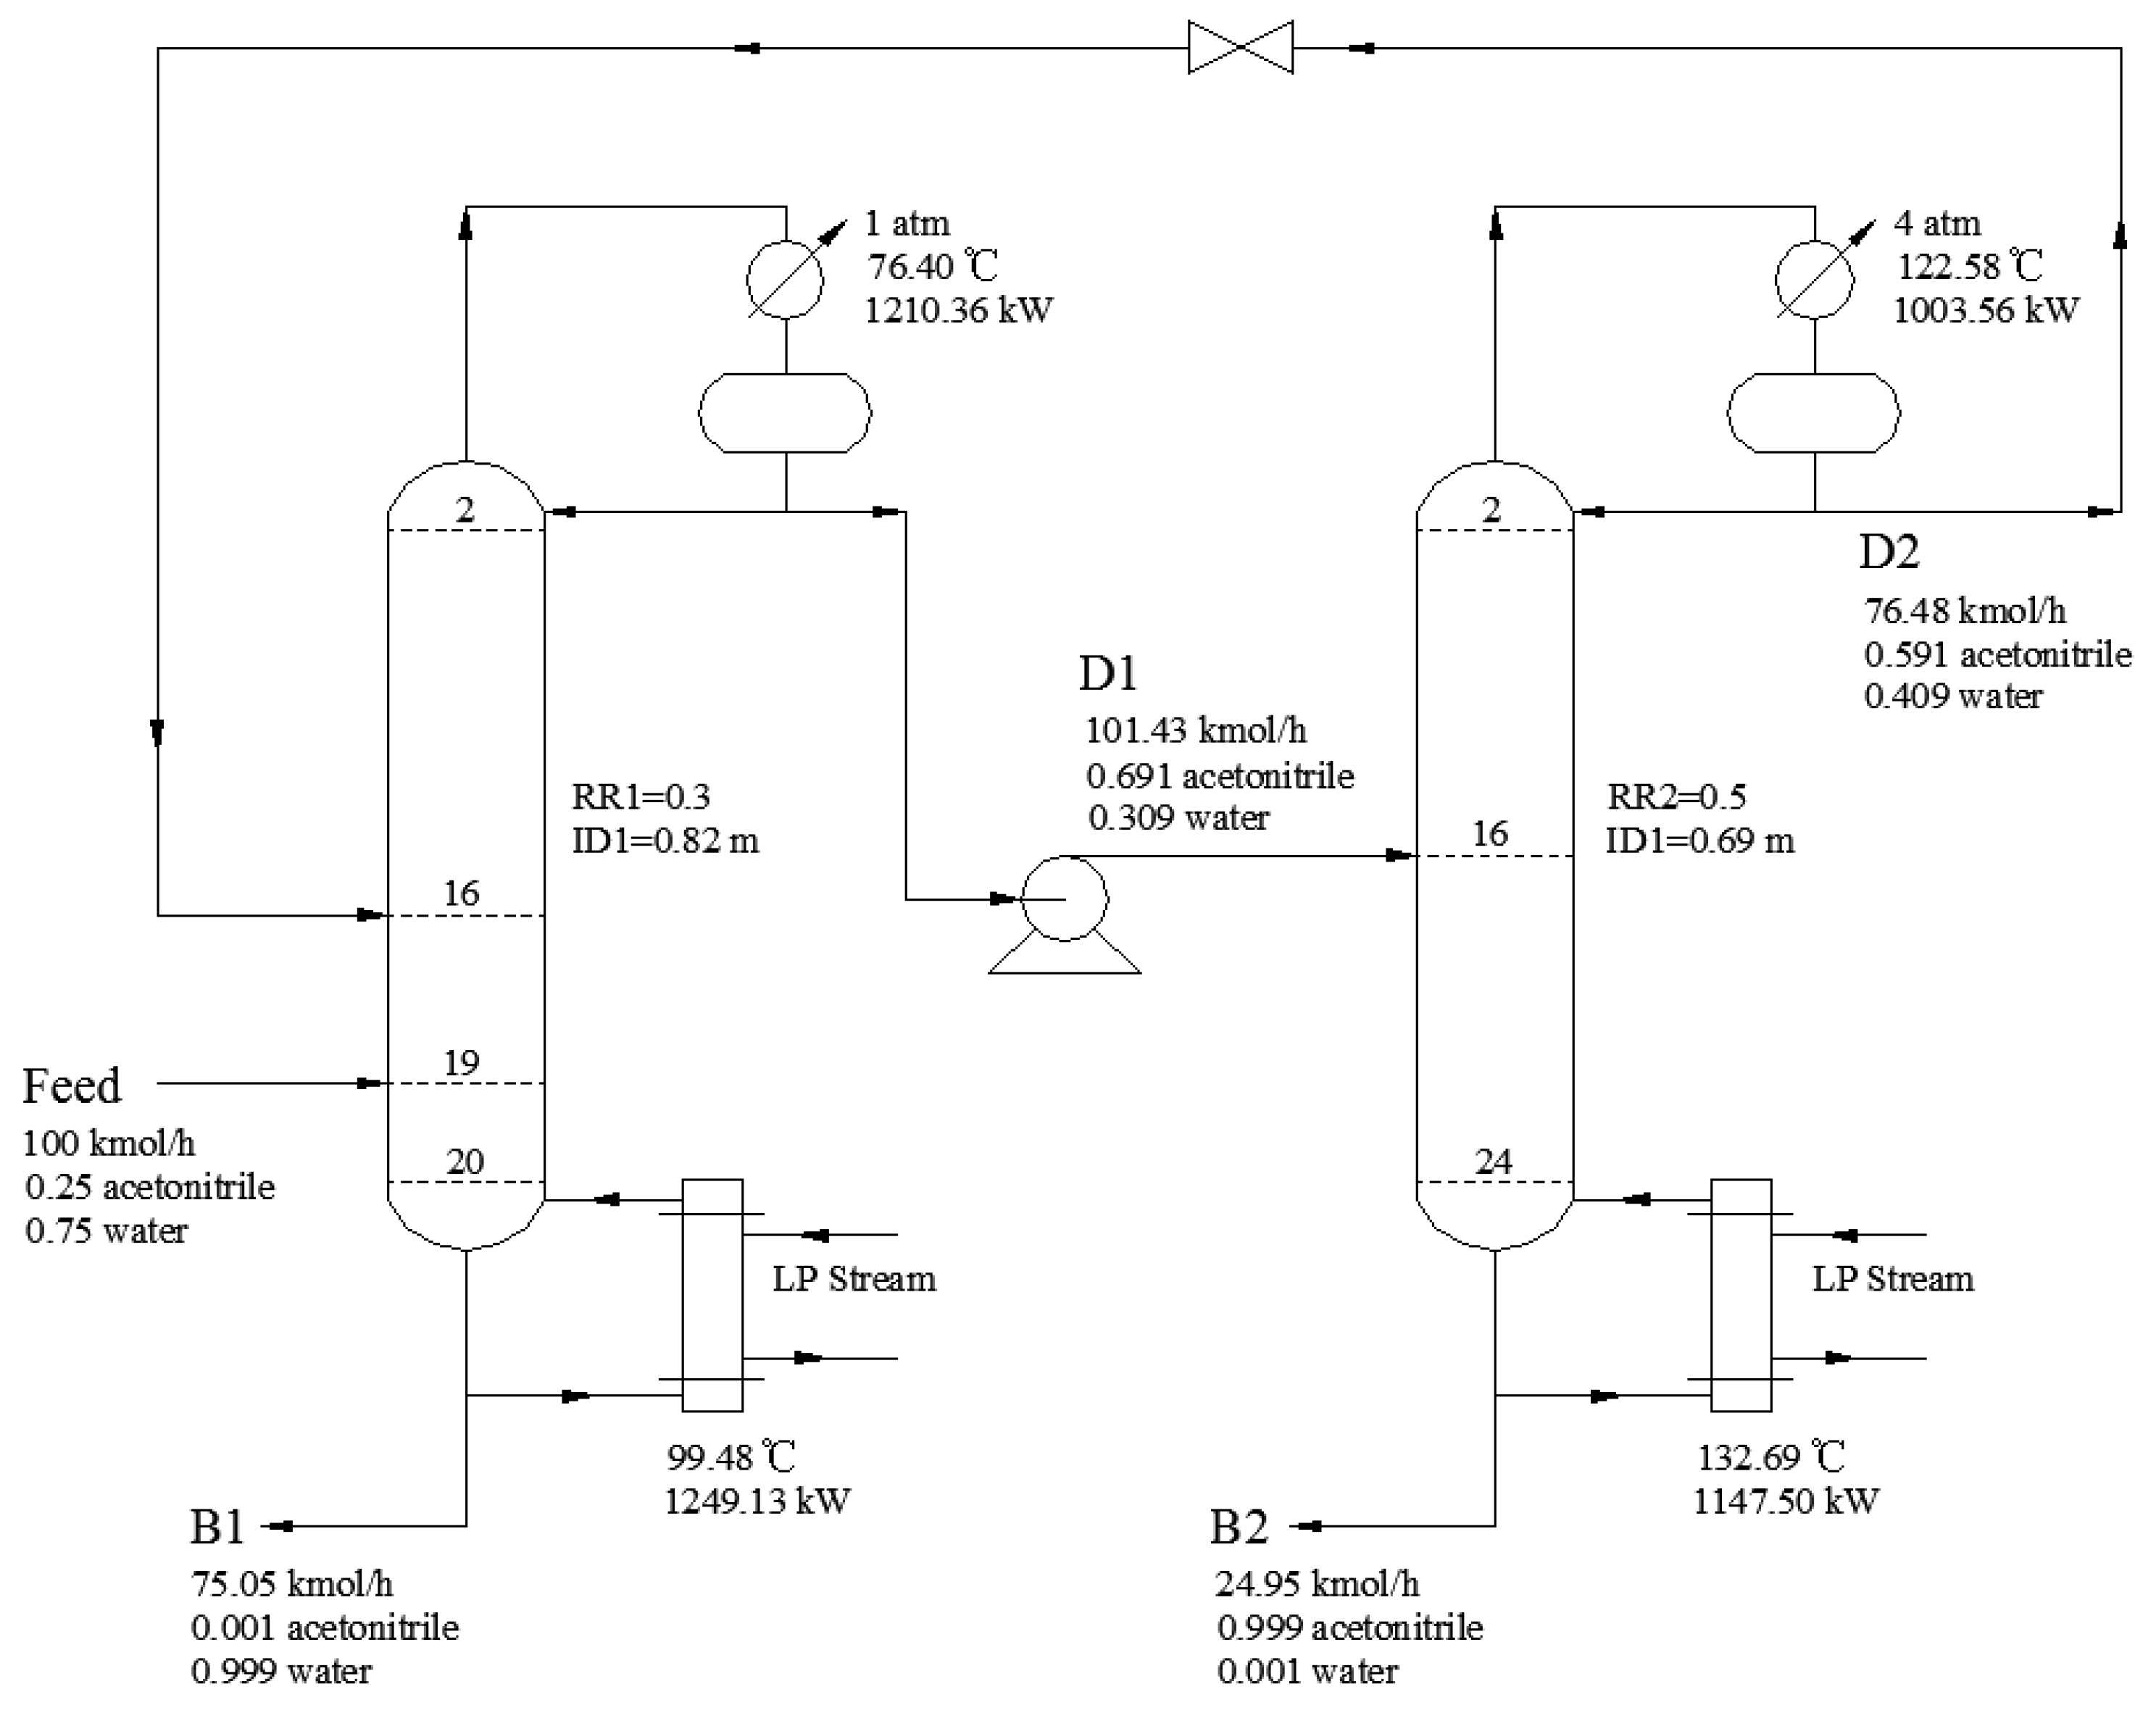
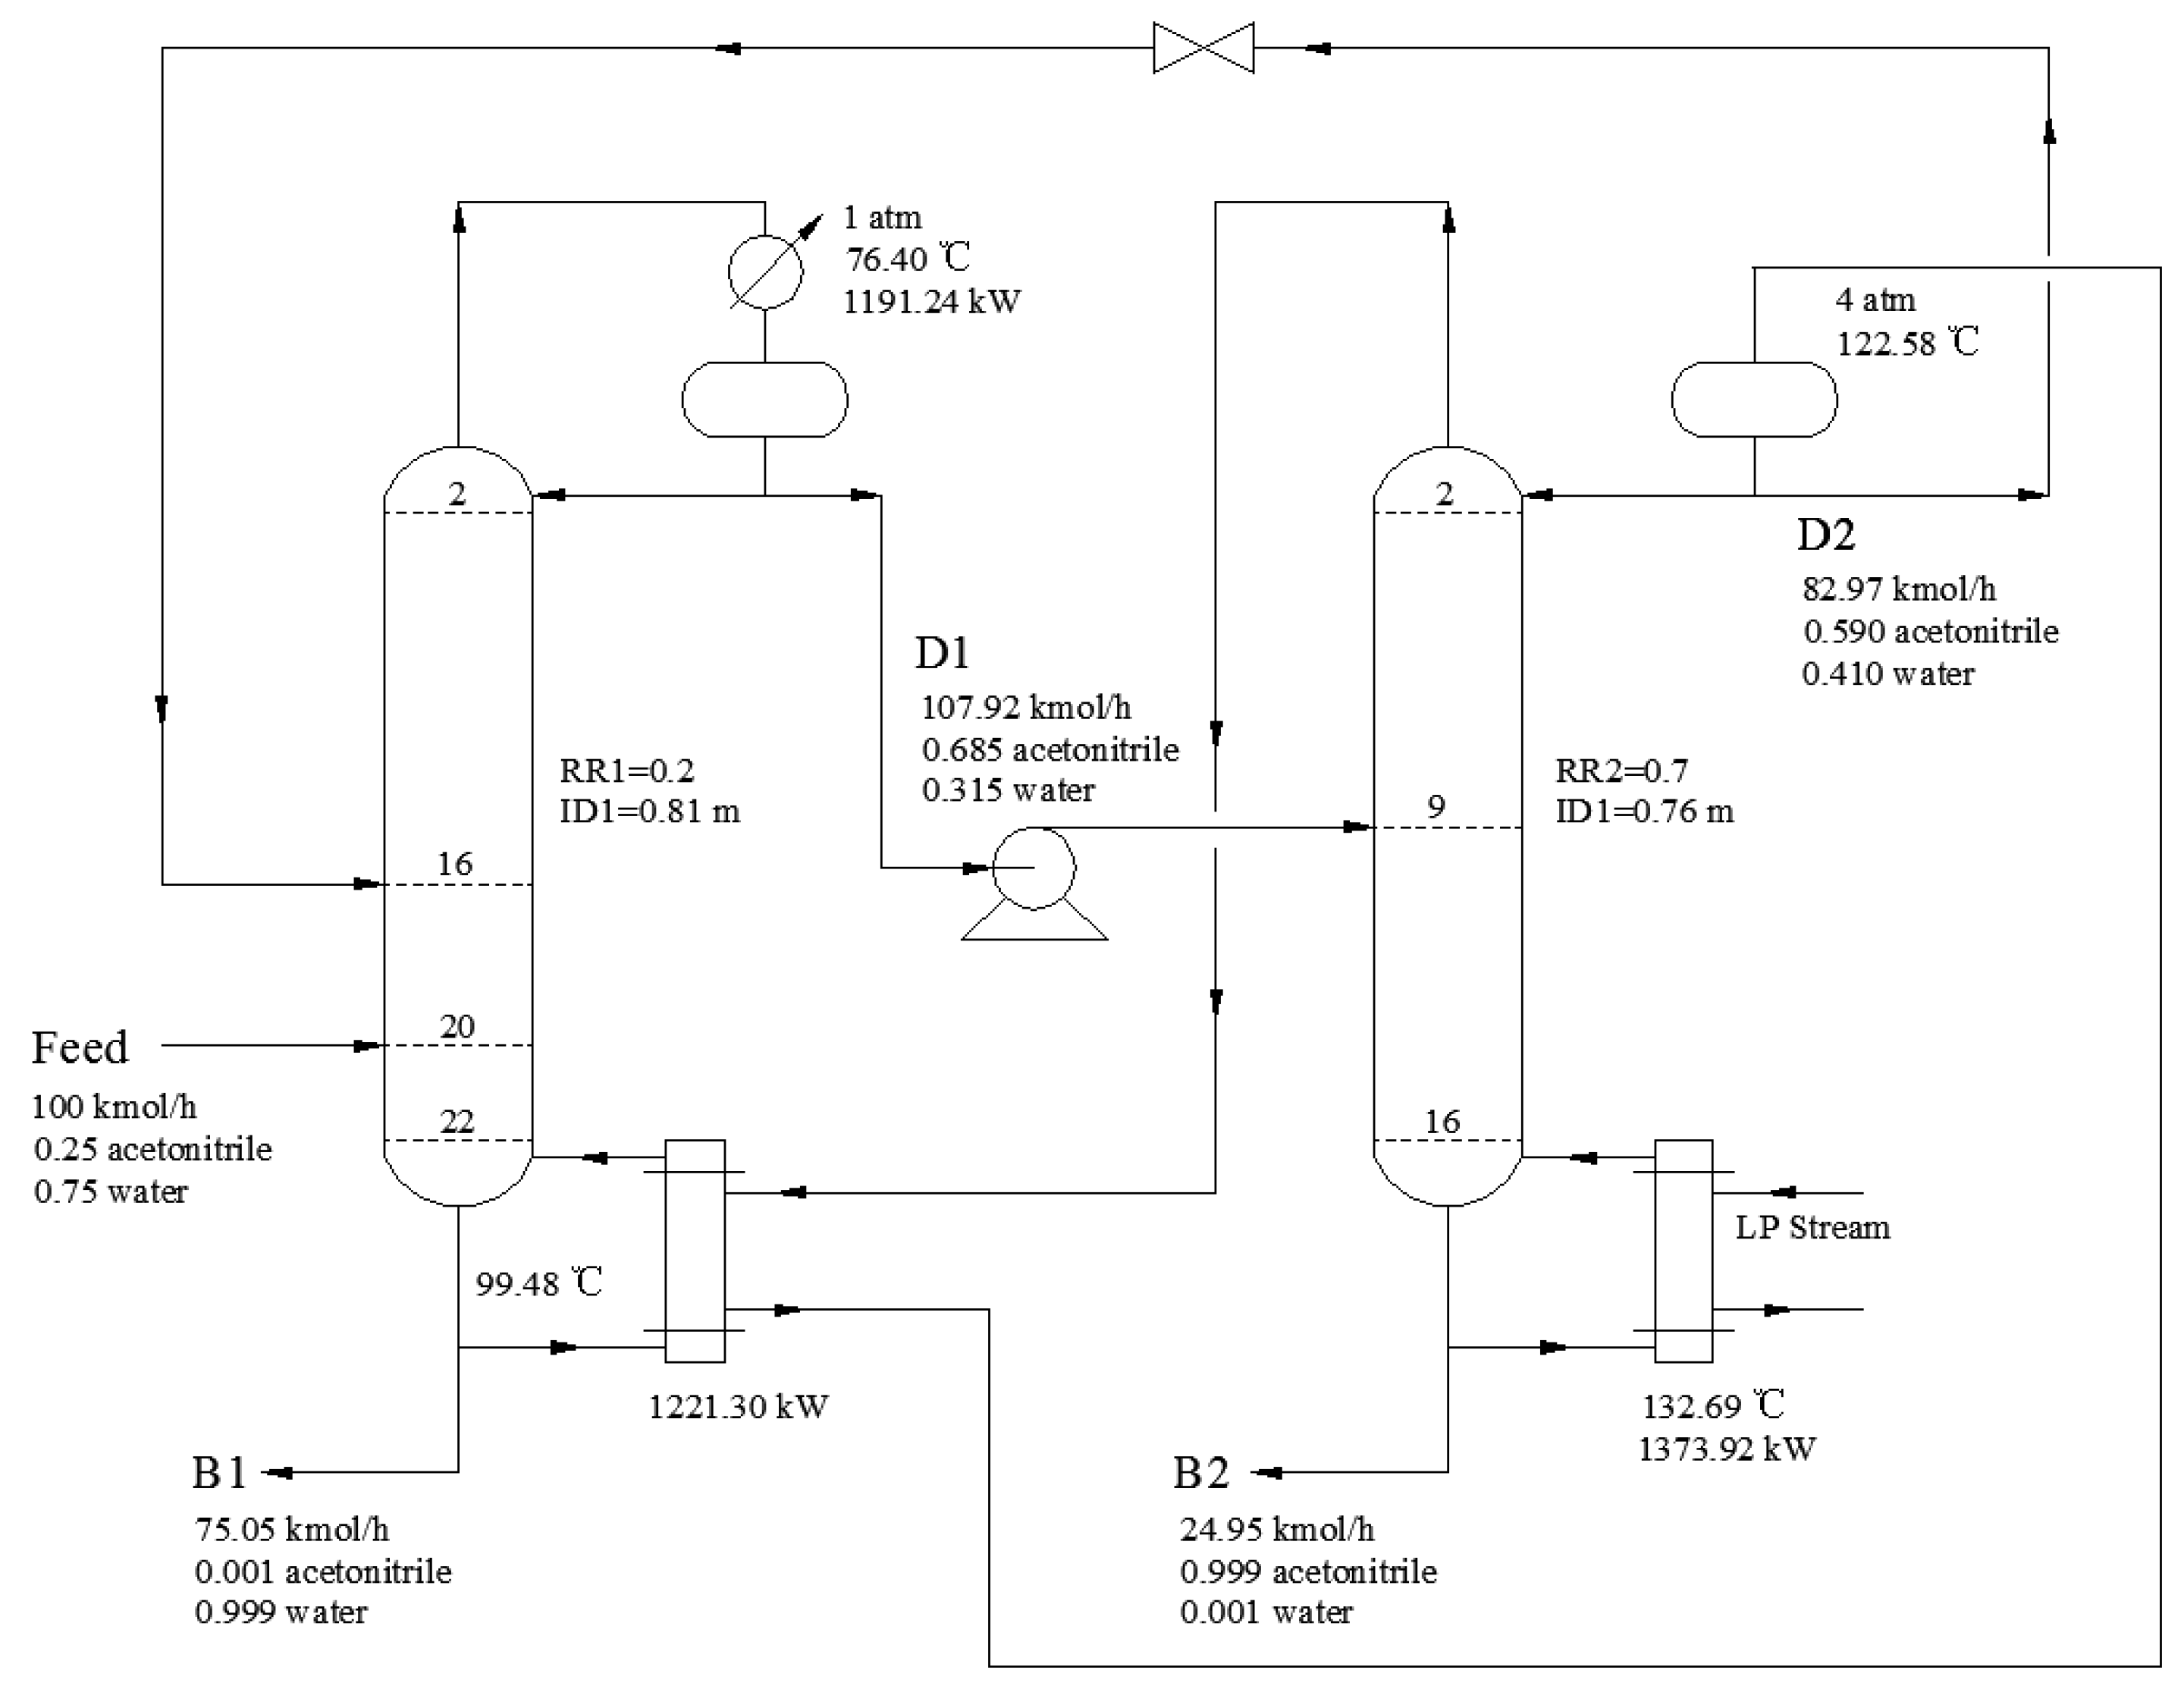
2.3. PSD Process Descripition

The acetonitrile aqueous mixture has 100 kmol/h flow rate at room temperature, 25 mol% acetonitrile, and 75 mol% water content. The final acetonitrile product has 99.9% mole purity, and the acetonitrile content of the wastewater does not exceed 0.1%. The Txy phase diagram for the acetonitrile–water mixture is plotted in Figure 1. The mixture is fed into the LPC, and the bottom stream B1 of the LPC is water with a very low acetonitrile content. The overhead azeotrope D1 is pressurized into the HPC, the bottom stream B2 of the HPC is high purity acetonitrile, and the top stream D2 of the HPC is the azeotrope. Through changing the pressure of the double columns, the azeotropic concentration under the corresponding pressure is crossed for the effective separation.

2.4. The Objective Function of the Process Optimization

In the process of separating acetonitrile and water mixture by PSD, not only the separation requirements of product purity should be satisfied but also the economy of the process should be considered. TAC is a commonly used economic cost index for chemical process simulation and optimization, which is used in the evaluation of the economic rationality and feasibility of the process. The calculation of TAC is based on the following equations, which is taken from Luben and Chien [34]. Design variables, such as the tray numbers, the reflux ratios, and the feeding positions of the two columns, are optimized through the equations below, in which the minimum TAC and purity of acetonitrile are considered as the objective function and constraint condition, respectively.
Objective function:
min TAC = Coperation + Ccapital/3,
TAC = f(x),
Ccapital = Cexchanger + Ccolumn,
Cexchanger = 7296A0.65,
Ccolumn = 17640D1.066L0.802,
Coperation = Csteam + Ccooling water,
L = 1.2 × 0.61 × (NT−2),
A = Q/(K × ΔTm).
Constraints:
wB1 < 0.001,
wB2 > 0.999.
where TAC is the total annual cost, Coperation is the annual operation cost, and the annual operation time is 8000 h; Ccapital is the equipment investment cost, and the payback period is 3 years; x is the whole process operation variable, including the feeding positions of the LPC and HPC (NF1, NFR, and NF2), reflux ratios (RR1 and RR2), and tray numbers (NT1 and NT2); Cexchanger and Ccolumn represent the heat exchanger (including condenser and reboiler) and the column equipment costs, respectively; A is the heat exchange area (m2); L and D represent the height and diameter of the column (m), respectively; The diameter of the column is calculated by the tool of “Tray Sizing” in Aspen Plus software; 0.61 m is the typical distance between the trays; Q and ΔTm are the heat duty (kW) and heat transfer temperature difference (K), respectively; K is the heat transfer coefficient, 0.852 kW/(K·m2) for the condenser and 0.568 kW/(K·m2) for the reboiler; Csteam and Ccooling water represent the cost of heating medium and cooling water, respectively; The LP steam is used in this work with the price of $7.78 /GJ, and the price of the cooling water is $4.43/GJ. Additionally, wB1 and wB2 are the purity of acetonitrile at the bottom streams of the LPC and HPC, respectively.

3. Optimization of PSD

3.1. Optimization of PSD without Heat Integration

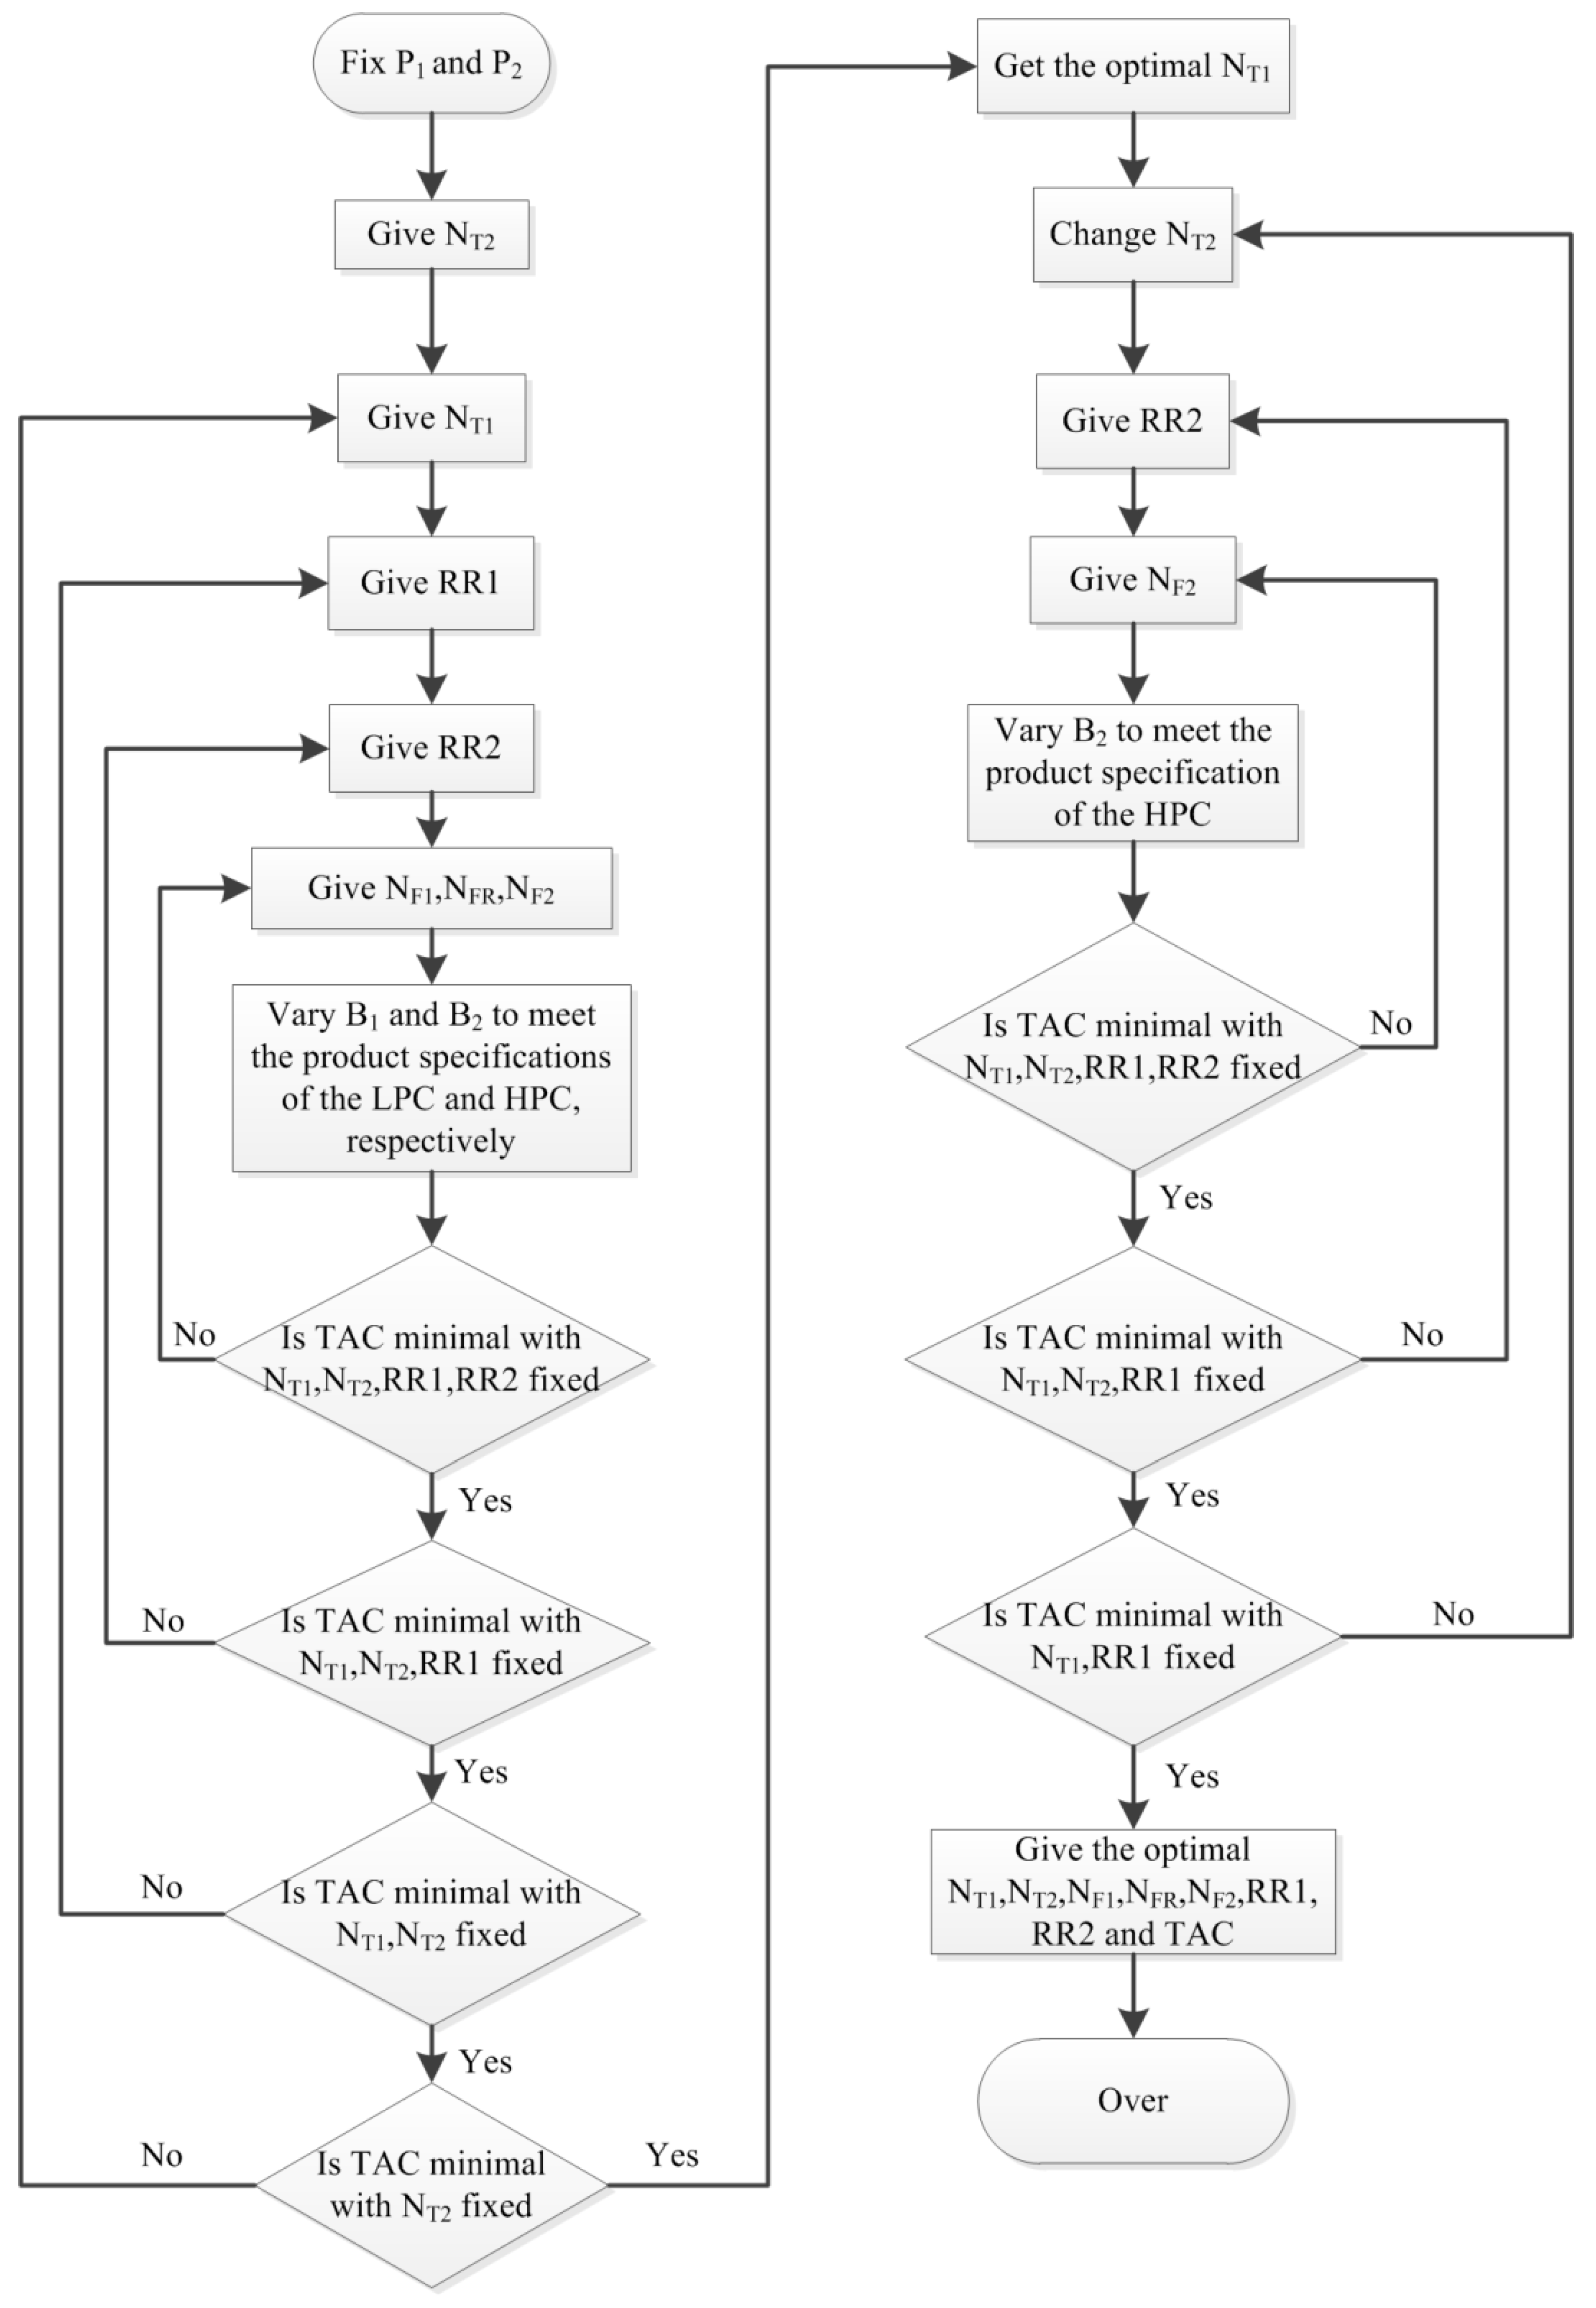
3.1.1. Process Optimization Sequence

The design variables of the PSD process include three feeding positions (NF1, NFR, and NF2), the reflux ratios (RR1 and RR2), and the tray numbers (NT1 and NT2) of the LPC and HPC. The variables are optimized through the sequential iteration method, which was commonly used to optimize the PSD process in the published literatures [17,35]. By editing the calculating formulas in Fortran, Aspen Plus software can automatically call the values of the corresponding variables to calculate TAC. The optimization sequence is illustrated in Figure 3. First, the feeding position is optimized as the innermost iteration, followed by the reflux ratio, and finally, the tray number is optimized. The objective function of the whole optimization process is to minimize TAC.

3.1.2. The Optimization Results of PSD

According to the optimization sequence in Figure 2, three feeding positions (NF1, NFR, and NF2), the reflux ratios (RR1 and RR2), and the tray numbers (NT1 and NT2) of the LPC and HPC were optimized iteratively, and the optimum process parameters were obtained. The results can be seen in Table 4. That is, NT1 of the LPC is 21, NF1 and NFR are 19 and 16, respectively, and RR1 is 0.3; NT2 of the HPC is 25, NF2 is 16th, and RR2 is 0.5. The optimized flow diagram of PSD without heat integration for separating acetonitrile–water azeotrope is shown in Figure 3.

3.2. Optimization of PSD with Full-Heat Integration

PSD with full-heat integration is carried out by the huge temperature difference between the top stream of the HPC and the bottom stream of the LPC. That is, the top stream of the HPC can be used as the heating medium of the reboiler of the LPC. Full-heat integration can be carried out by adjusting the reflux ratios of the LPC and HPC.

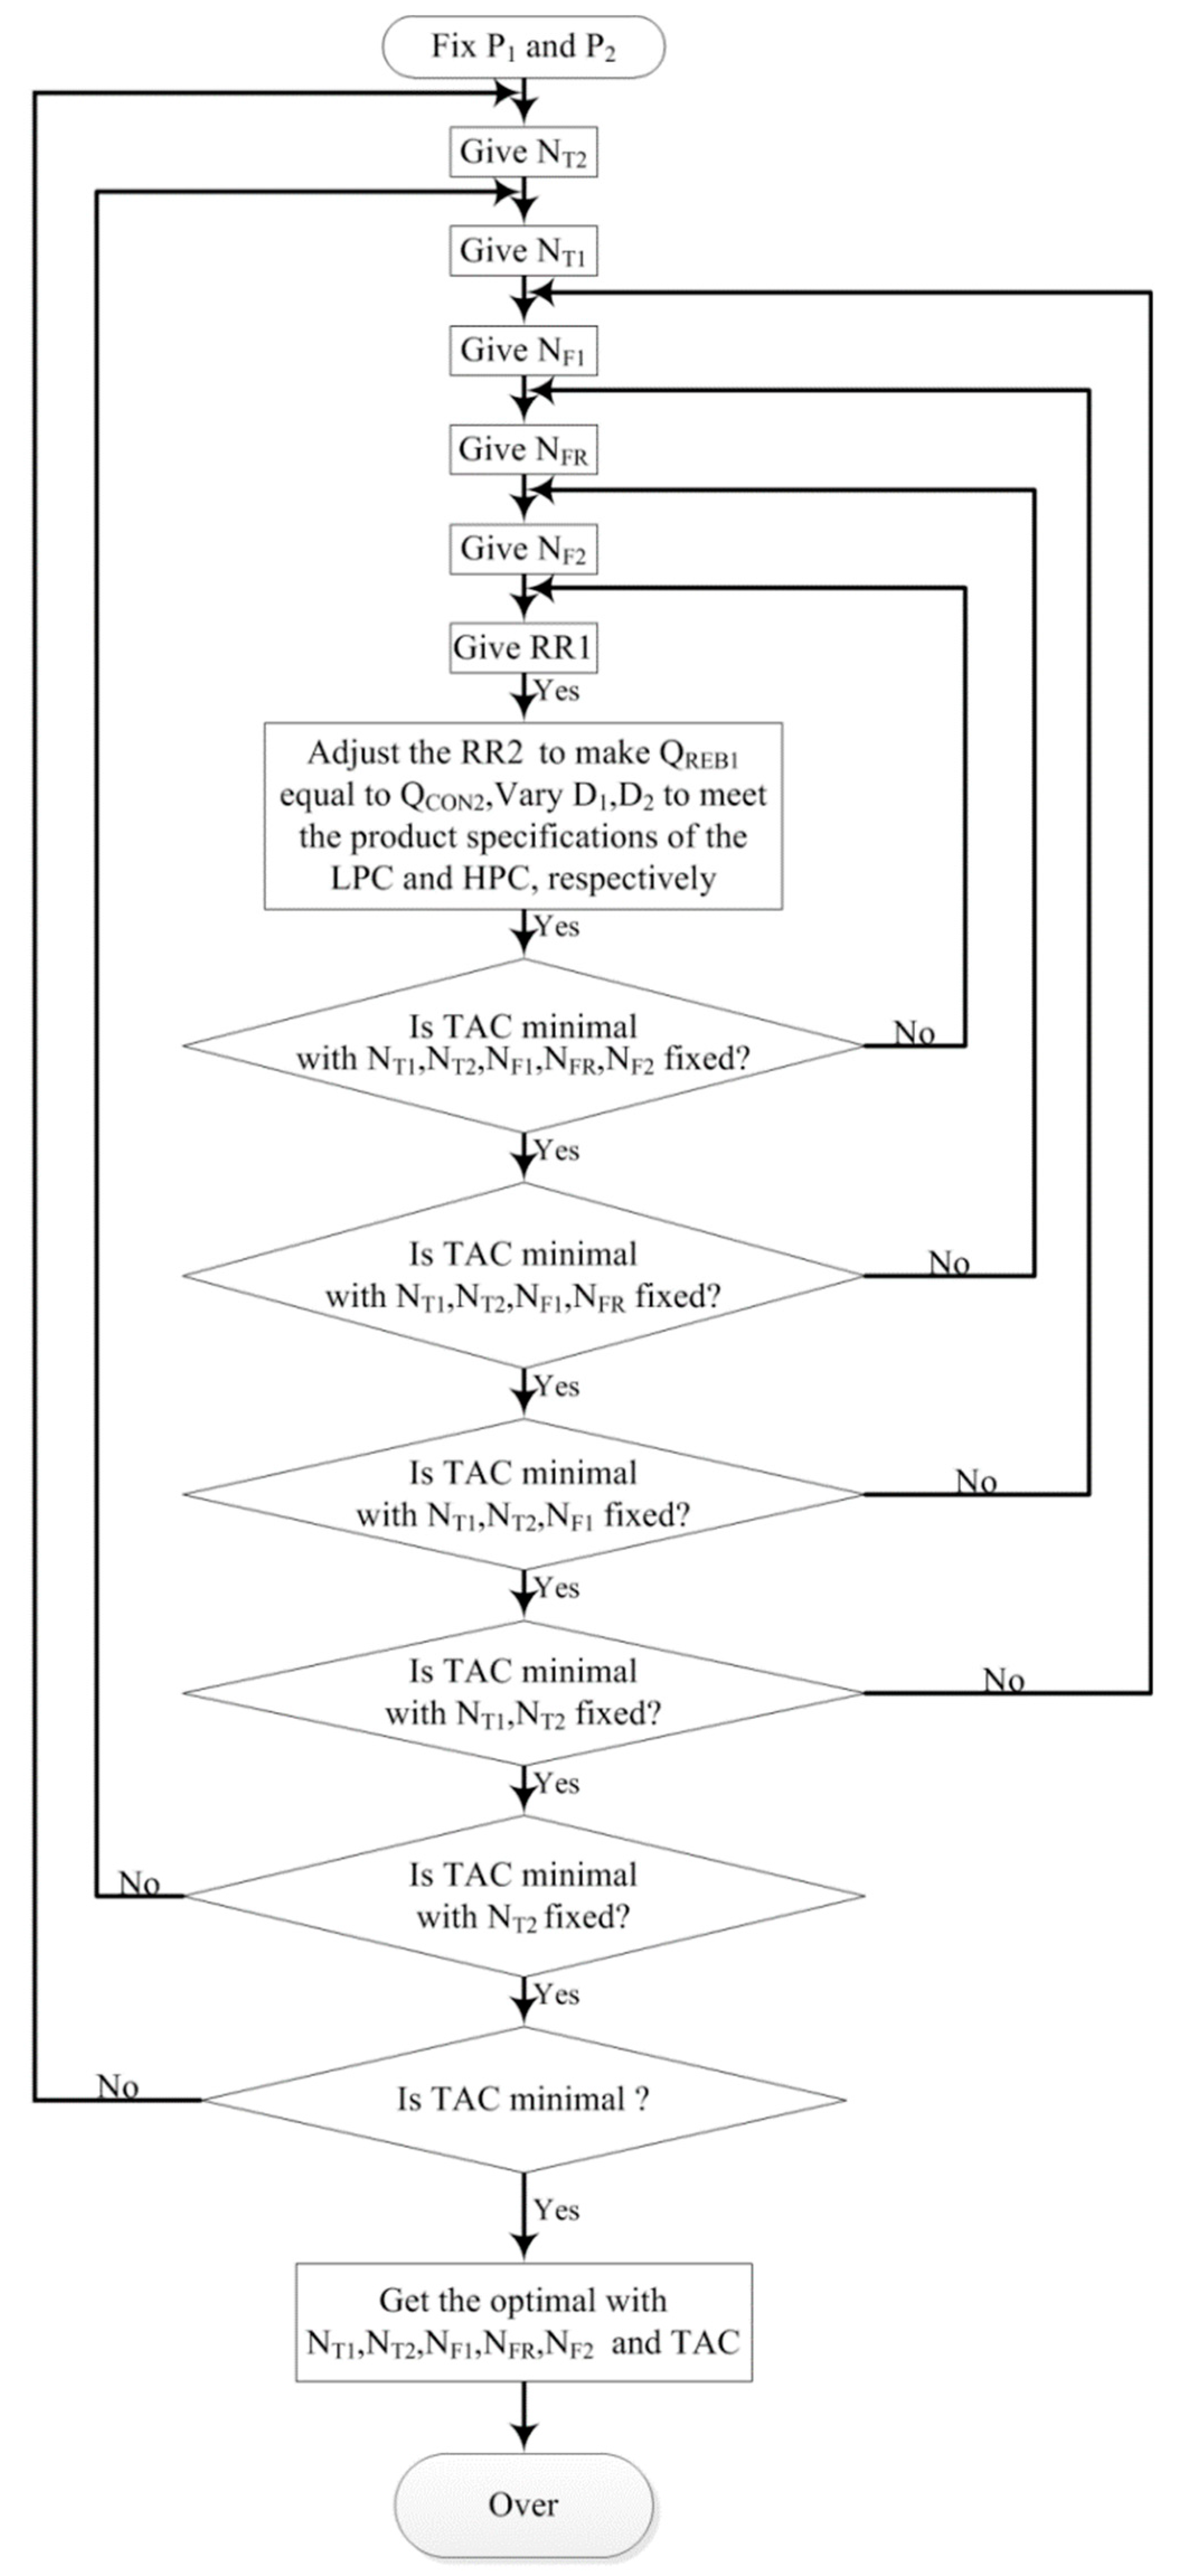
3.2.1. Process Optimization Sequence of PSD with Full-Heat Integration

The design variables are optimized according to the sequential iteration method. The optimization process is shown in Figure 4. First, the reflux ratio is optimized as the innermost iteration, then the feeding position, and finally, the tray number is optimized. The objective function of the whole optimization process is to minimize TAC.

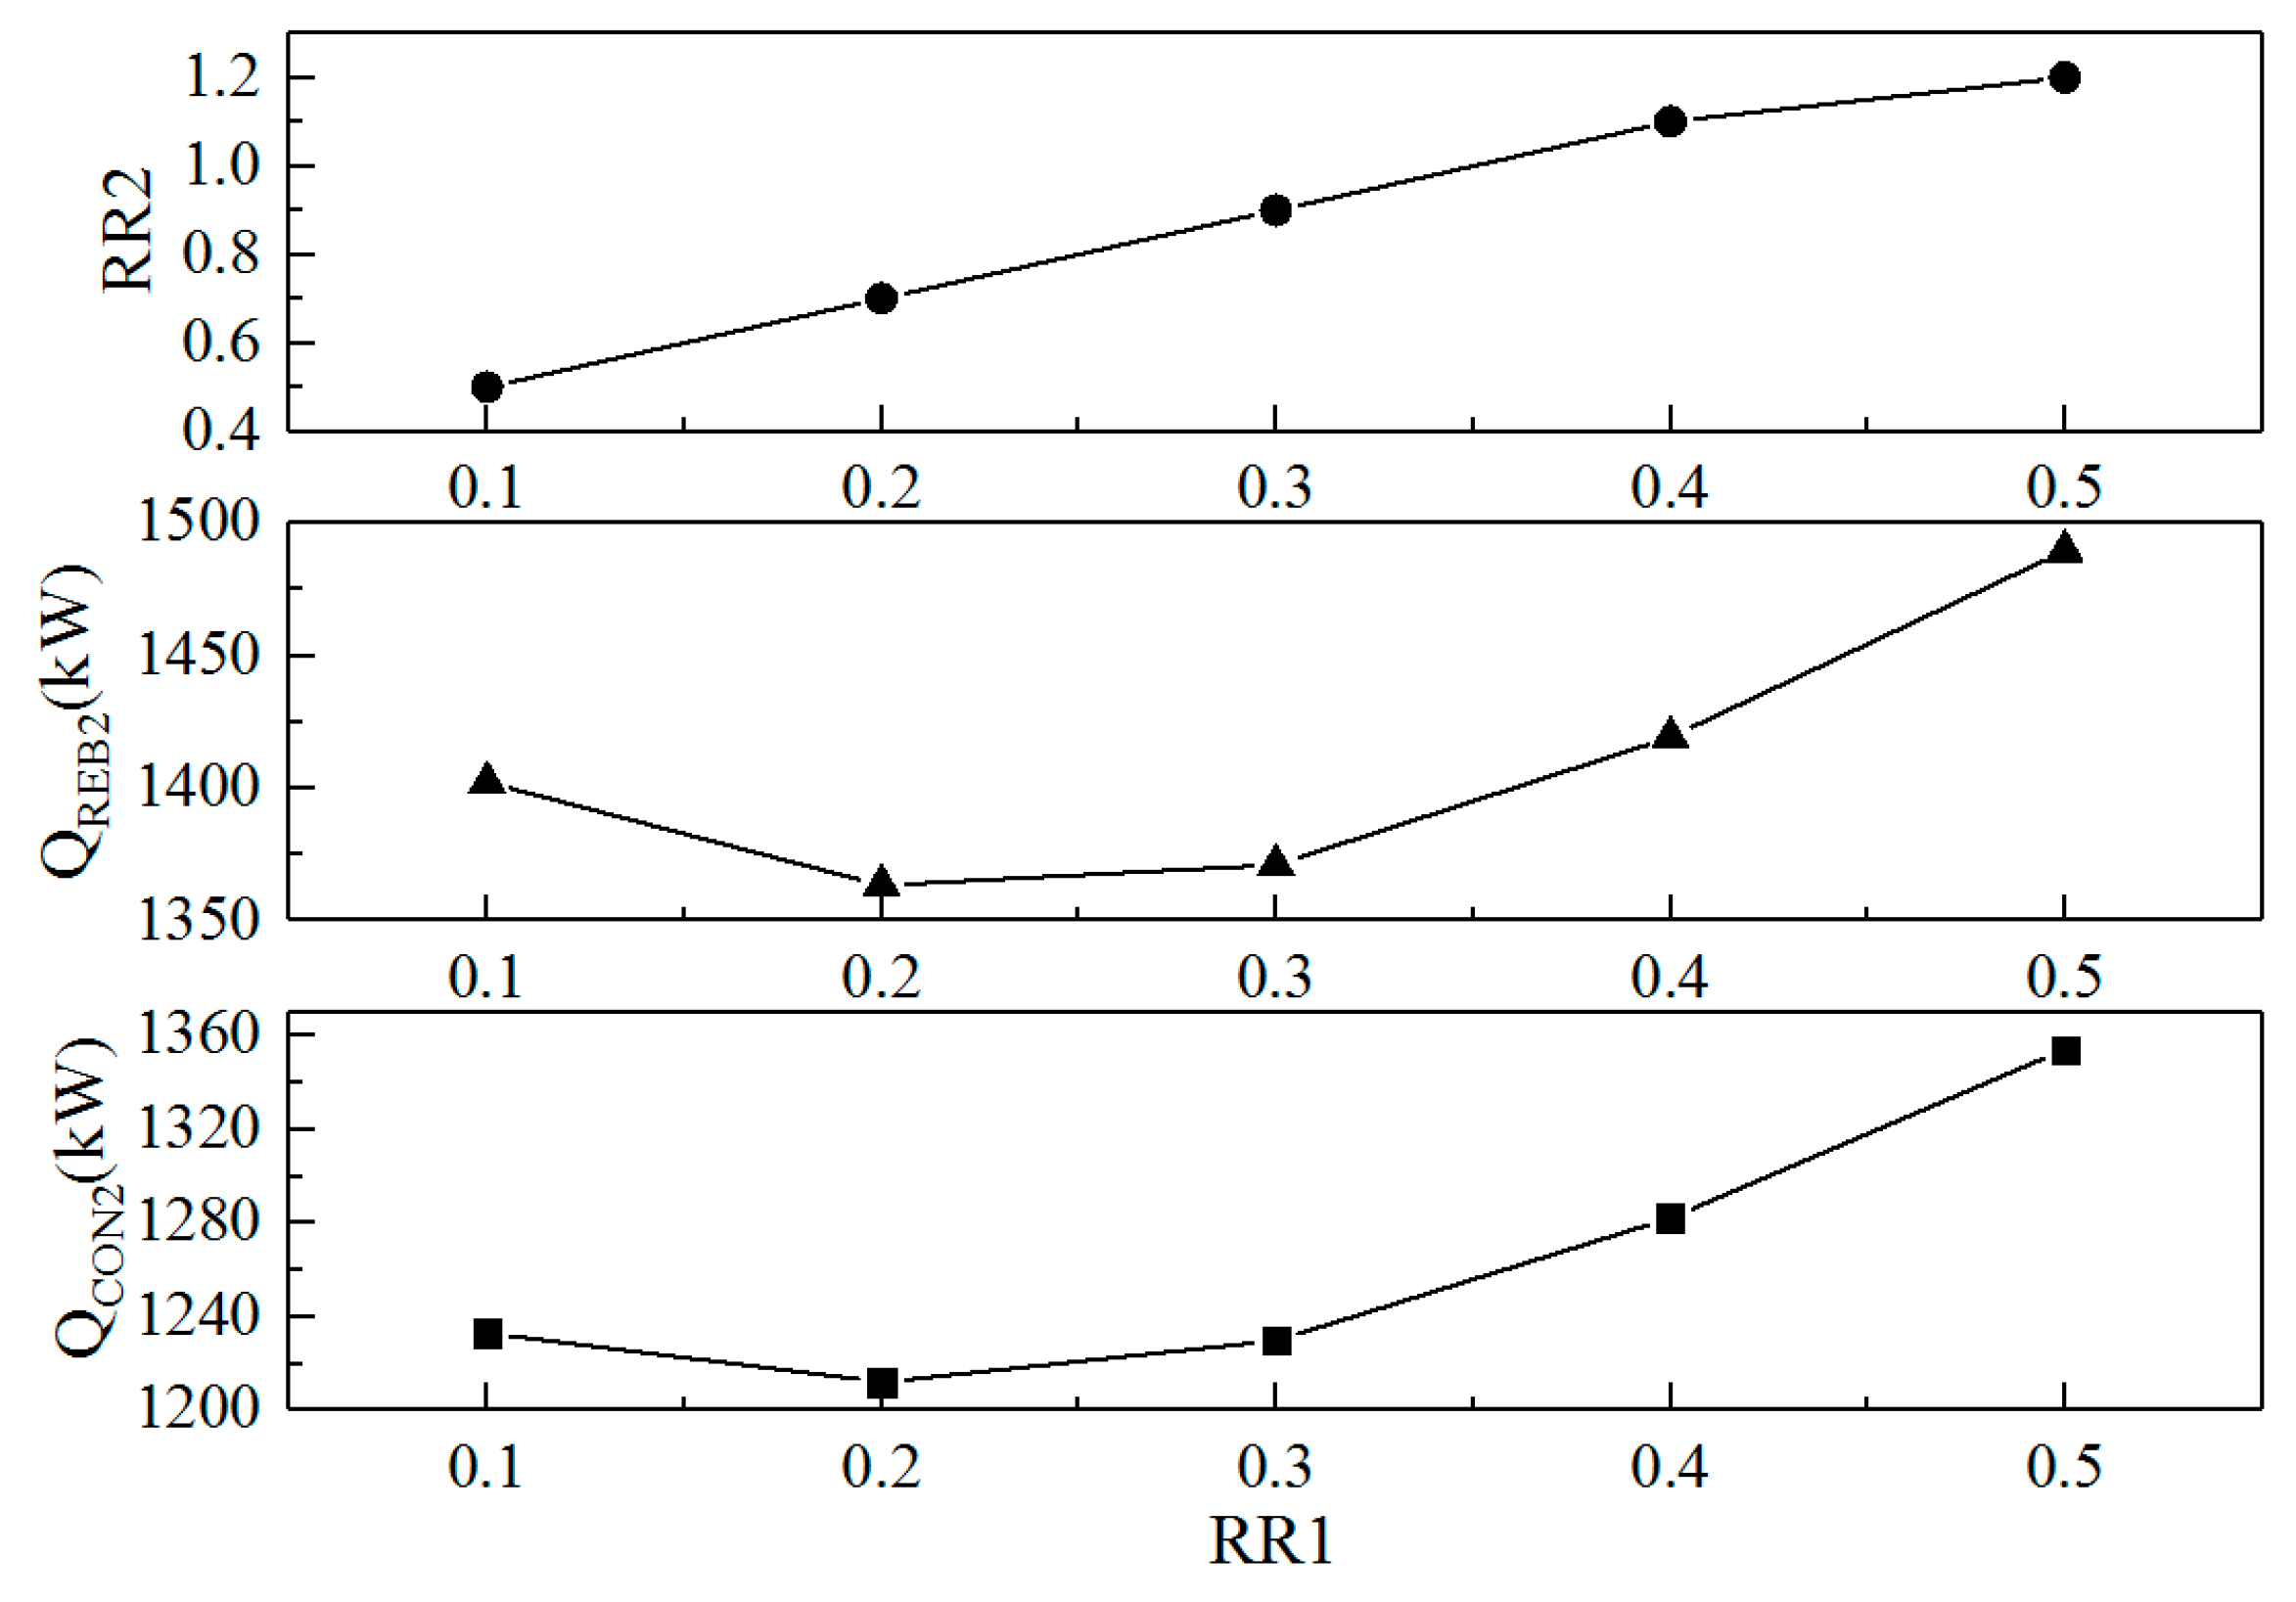
3.2.2. Optimization of the Reflux Ratios

In the whole process optimization, the reflux ratios of the two columns are used as the design variables, and the heat duty of the condenser of the HPC is equal to that of the reboiler of the LPC as the objective variable to achieve the full-heat integration design.
Figure 5 investigates the effect of RR1 in the LPC on RR2 in the HPC and heat duties of the condenser and reboiler (QCON2 and QREB2) in HPC. It can be seen that with the increase of RR1, RR2 increases gradually, but QCON2 and QREB2 of the HPC appear to have a minimum. When RR1 is 0.2 and RR2 is 0.7, the values of QREB2 and QCON2 are minimum.
The effect of the reflux ratios of the two columns on the TAC for the whole process is shown in Figure 6. It can also be seen that TAC is the smallest when RR1 is 0.2 and RR2 is 0.7. This finding is consistent with the conclusion in Figure 5. The optimum reflux ratios of the LPC and HPC are 0.2 and 0.7, respectively.

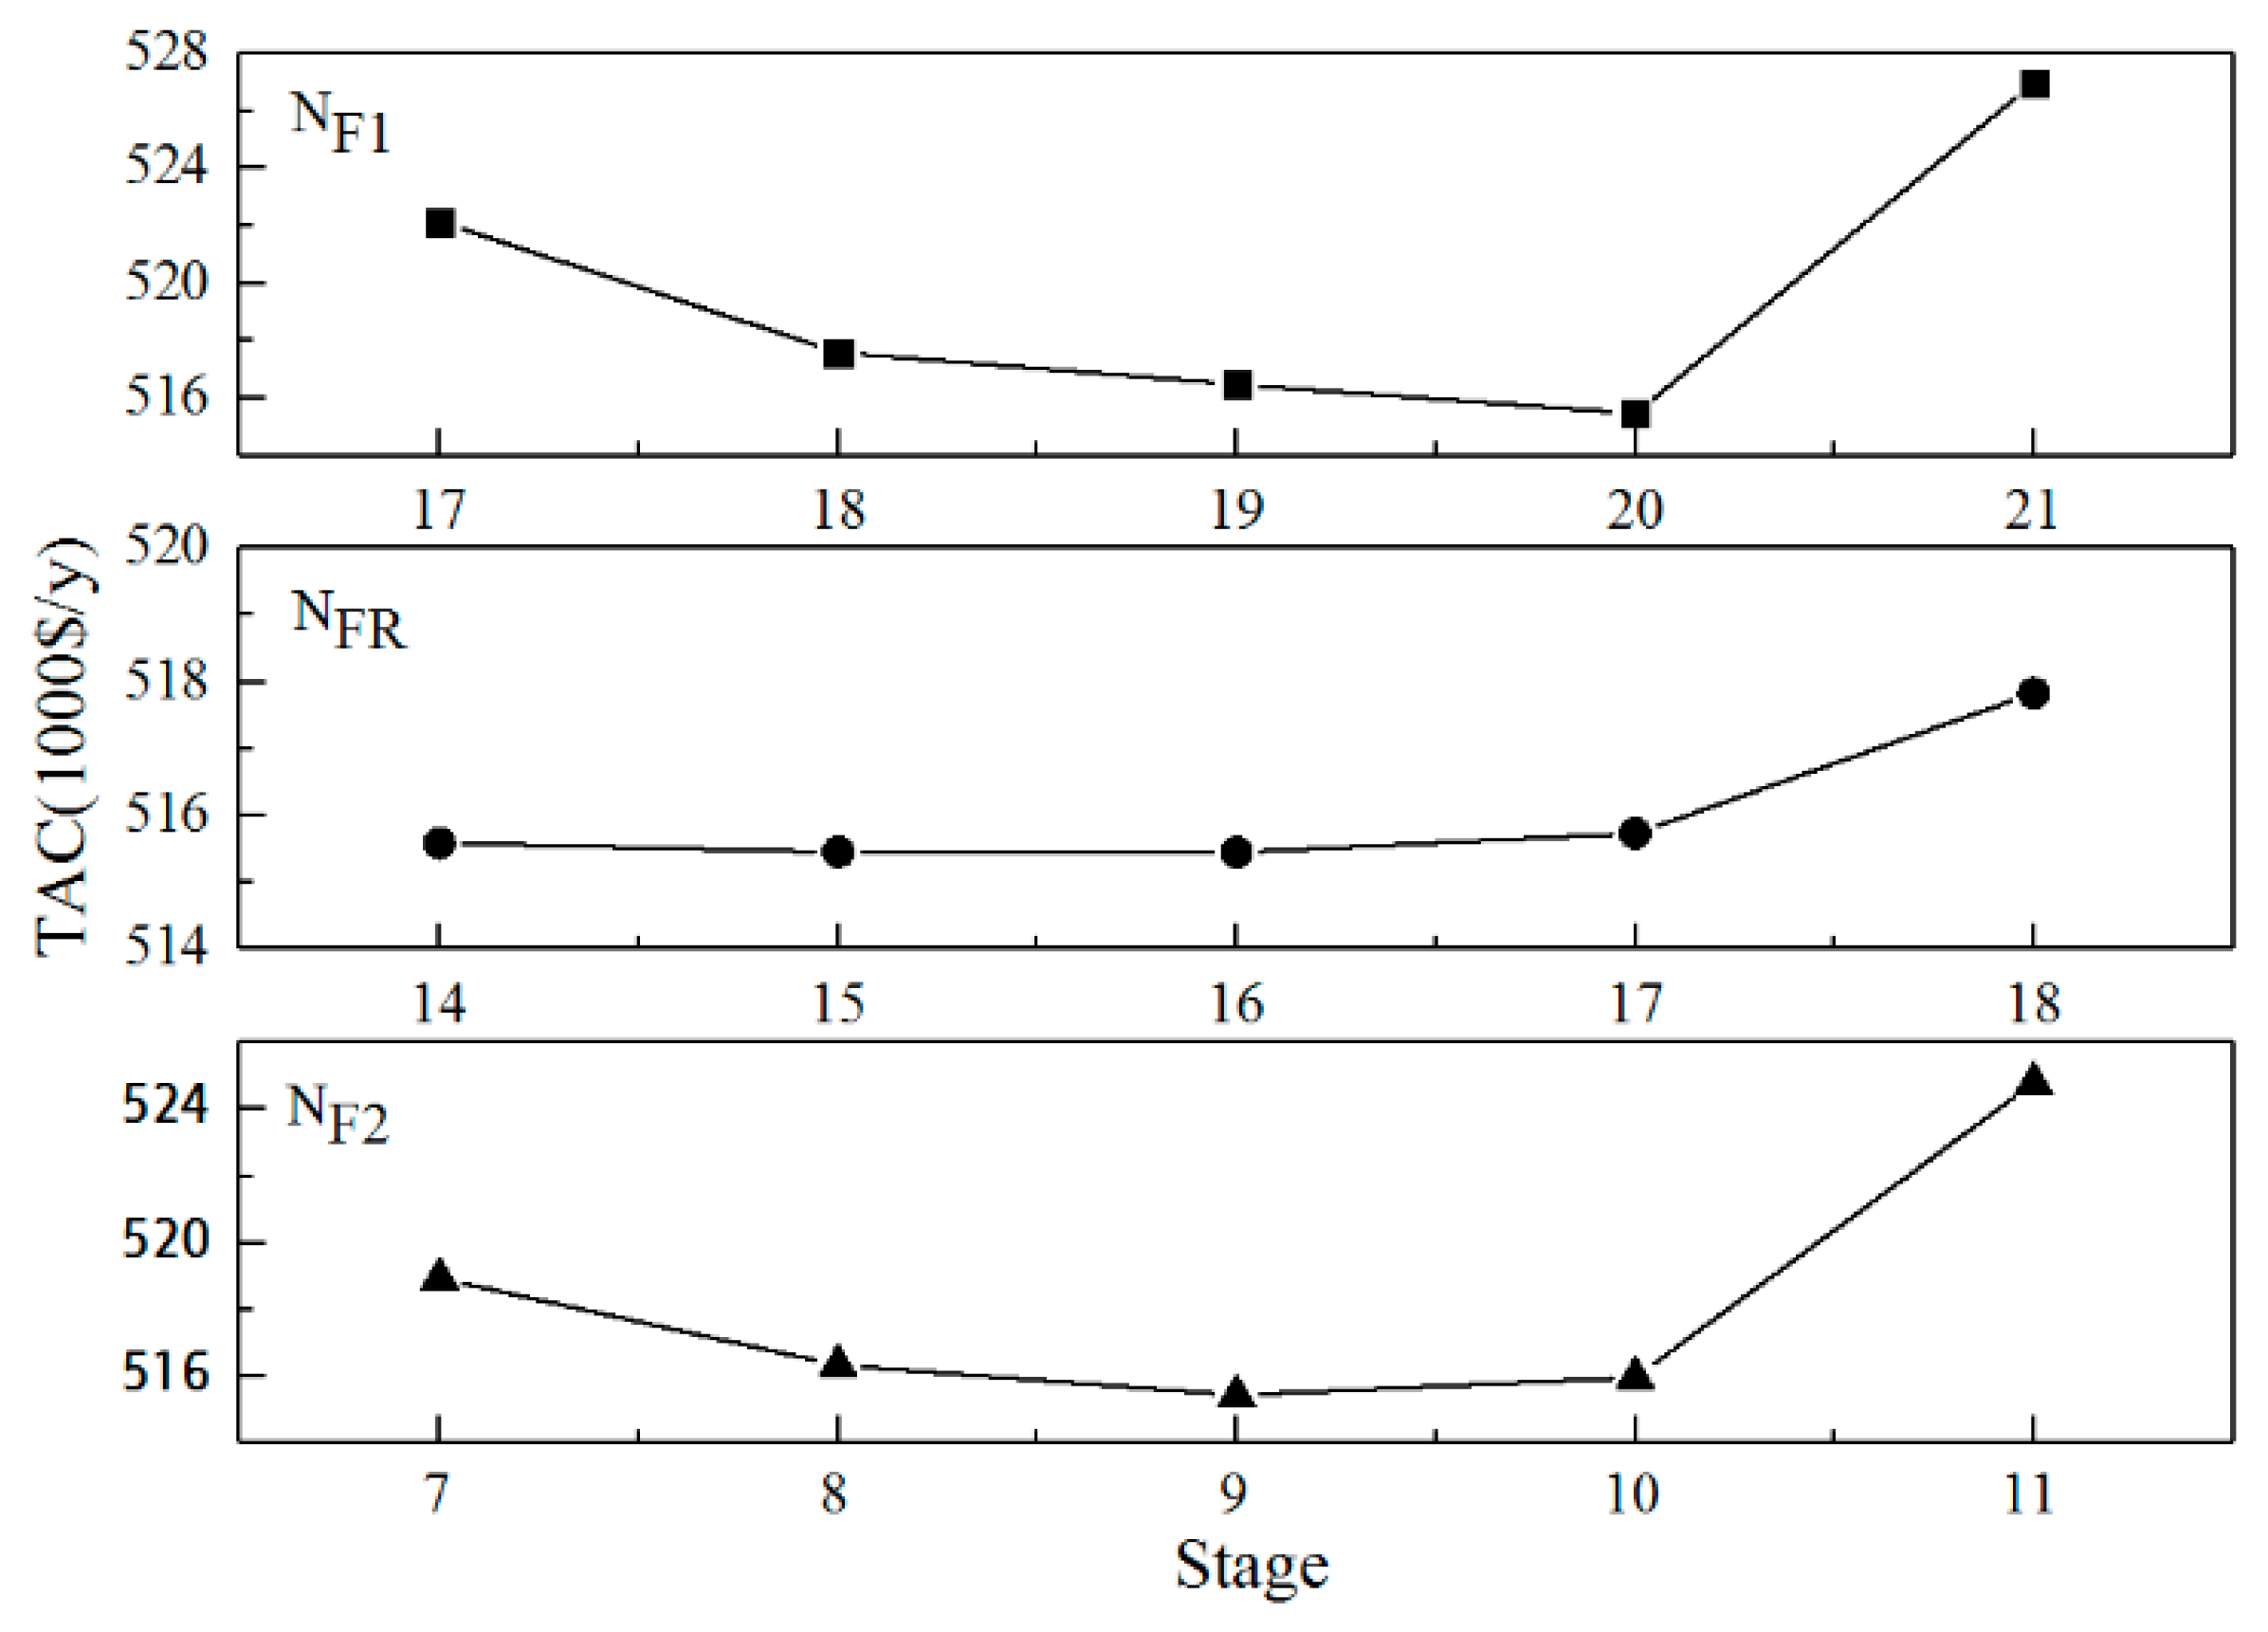
3.2.3. Optimization of the Feeding Positions

The feeding position of the acetonitrile–water mixture (NF1), the feeding position of the recycle stream (NFR), and the feeding position of the HPC (NF2) affect the TAC to varying degrees, as shown in Figure 7. Taking the feeding position NF1 of acetonitrile–water mixture as an example, as the feeding position moves down, the TAC tends to decrease initially and then increase. The TAC is the smallest when feeding on the 20th tray. Similarly, the optimum feeding positions of NFR and NF2 are determined to be the 16th and 9th trays, respectively.

3.2.4. Optimization of the Tray Numbers

The tray numbers directly affect the equipment investment cost and energy consumption, so a reasonable number of trays must be used for the minimization of the TAC. First, the number of the HPC trays is fixed, and that of the LPC trays is gradually changed. The corresponding TAC is calculated, and the specific results for each case are listed in Table 2. The flow rate of the recycle stream gradually decreases as the number of trays increases, and the smallest TAC is obtained when the number of the LPC trays is 23.
The number of the LPC trays is fixed 23, the number of the HPC trays is changed, and the corresponding TAC is calculated. The specific results for each case can be seen in Table 3. The smallest TAC is obtained when the number of the HPC trays is 17.

3.2.5. Process Optimization Results

The optimization results of the whole process are shown in Figure 8. The number of the LPC trays is 23, and the acetonitrile–water mixture and the recycle stream are fed at 20th and 16th, respectively, with a reflux ratio of 0.2. The number of the HPC trays is 17, the feeding position is 9th, and the reflux ratio is 0.7. Finally, the acetonitrile content in the wastewater at the bottom of the LPC is less than 0.1%, and the purity of acetonitrile product at the top of the HPC is 99.9%, which meets the separation requirements.

3.3. Comparison of Two Technological Processes

After the optimization of the whole process, the two processes are compared. The results in Table 4 show that the TAC of the PSD without heat integration process is higher than that of the full-heat integration process. The latter can effectively reduce equipment investment and operation cost, thereby reducing the TAC to 515.45 × 10³ $/y. Thirty-two point three nine percent of the TAC of the PSD with full-heat integration is saved compared with that of the process without heat integration.

4. Conclusions

PSD was used to separate acetonitrile and water mixture. The sensitivity of the acetonitrile–water azeotrope concentration to the pressure changes indicates the feasibility of PSD. The distillation sequence of the LPC and HPC was determined through a phase diagram. The pressures of the LPC and HPC were set to 1 and 4 atm, respectively. The final purity of the acetonitrile product reached 99.9%, and the content of acetonitrile in wastewater was less than 0.1%, which met the separation requirements.
Based on the principle of the minimum TAC, the design variables of the PSD without heat integration were optimized, and the optimum process parameters were obtained. Then, PSD with full-heat integration was optimized. The two processes were compared, and the results showed that 32.39% of the TAC of the PSD with full-heat integration is saved compared with that of the process without heat integration. Therefore, it is more economical to separate acetonitrile and water mixture by PSD with full-heat integration. This study provides technical support for the separation design of such azeotropes.

Author Contributions

J.L. and K.W. conceived and designed this case-study as well as wrote the paper; M.L. and Z.L. reviewed the paper; All authors interpreted the data; T.D. substantively revised the work and contributed the process simulation.

Funding

This work is financially supported by Guizhou Province United Fund (Qiankehe J zi LKLS[2013]27), Excellent engineers education training plan (LPSSY zyjypyjh201702), Guizhou Solid Waste Recycling Laboratory of Coal Utilization ([2011]278), Guizhou Province United Fund (Qiankehe LH zi [2015]7608) and Academician Workstation of Liupanshui Normal University (qiankehepingtairencai [2019]5604).

Conflicts of Interest

The authors declare no conflict of interest.

References

  1. Wang, Y.L.; Bu, G.L.; Geng, X.L.; Zhu, Z.Y.; Cui, P.Z.; Liao, Z.W. Design optimization and operating pressure effects in the separation of acetonitrile/methanol/water mixture by ternary extractive distillation. J. Clean. Prod. 2019, 218, 212–224. [Google Scholar] [CrossRef]
  2. Jhoany, A.E.; Ivonne, R.D.; Ulises, J.H.; Lauro, N.P.; Eladio, P.F. Recovery of acetonitrile from aqueous waste by a combined process: Solvent extraction and batch distillation. Sep. Purif. Technol. 2006, 52, 95–101. [Google Scholar]
  3. Liang, K.; Li, W.S.; Luo, H.T.; Xia, M.; Xu, C.J. Energy-efficient extractive distillation process by combining preconcentration column and entrainer recovery column. Ind. Eng. Chem. Res. 2014, 53, 7121–7131. [Google Scholar] [CrossRef]
  4. Luyben, W.L. Comparison of extractive distillation and pressure-swing distillation for acetone/chloroform separation. Comp. Chem. Eng. 2013, 50, 1–7. [Google Scholar] [CrossRef]
  5. Liang, S.S.; Cao, Y.J.; Liu, X.Z.; Li, X.; Zhao, Y.T.; Wang, Y.K.; Wang, Y.L. Insight into pressure-swing distillation from azeotropic phenomenon to dynamic control. Chem. Eng. Res. Des. 2017, 117, 318–335. [Google Scholar] [CrossRef]
  6. Yang, A.; Shen, W.F.; Wei, S.A.; Dong, L.C.; Li, J.; Gerbaud, V. Design and control of pressure-swing distillation for separating ternary systems with three binary minimum azeotropes. AIChE J. 2019, 65, 1281–1293. [Google Scholar] [CrossRef] [Green Version]
  7. Shen, W.F.; Dong, L.C.; Wei, S.A.; Li, J.; Benyounes, H.; You, X.Q.; Gerbaud, V. Systematic design of extractive distillation for maximum-boiling azeotropes with heavy entrainers. AIChE J. 2015, 61, 3898–3910. [Google Scholar] [CrossRef]
  8. Zhao, Y.T.; Ma, K.; Bai, W.T.; Du, D.Q.; Zhu, Z.Y.; Wang, Y.L.; Gao, J. Energy-saving thermally coupled ternary extractive distillation process by combining with mixed entrainer for separating ternary mixture containing bioethanol. Energy 2018, 148, 296–308. [Google Scholar] [CrossRef]
  9. Rodriguez-Donis, I.; Acosta-Esquijarosa, J.; Gerbaud, V.; Joulia, X. Heterogeneous batch-extractive distillation of minimum boiling azeotropic mixtures. AIChE J. 2003, 49, 3074–3083. [Google Scholar] [CrossRef]
  10. Rodriguez-Donis, I.; Papp, K.; Rev, E.; Lelkes, Z.; Gerbaud, V.; Joulia, X. Column configurations of continuous heterogeneous extractive distillation. AIChE J. 2007, 53, 1982–1993. [Google Scholar] [CrossRef]
  11. Raeva, V.M.; Sazonova, A.Y. Separation of ternary mixtures by extractive distillation with 1, 2-ethandiol and glycerol. Chem. Eng. Res. Des. 2015, 99, 125–131. [Google Scholar] [CrossRef]
  12. Sazonova, A.Y.; Raeva, V.M. Recovery of acetonitrile from aqueous solutions by extractive distillation–effect of entrainer. Int. J. Chem. Mol. Nucl. Mater. Metall. Eng. 2015, 9, 288–291. [Google Scholar]
  13. You, X.; Gu, J.; Gerbaud, V.; Peng, C.; Liu, H. Optimization of pre-concentration, entrainer recycle and pressure selection for the extractive distillation of acetonitrile-water with ethylene glycol. Chem. Eng. Sci. 2018, 177, 354–368. [Google Scholar] [CrossRef] [Green Version]
  14. Wang, X.; Du, Z.; Zhang, Y.; Wang, J.; Wang, J.; Sun, W. Optimization of distillation sequences with nonsharp separation columns. Processes 2019, 7, 323. [Google Scholar] [CrossRef]
  15. Salvador, T.A.; Arturo, J.G.; Juergen, H. Analysis of multi-loop control structures of dividing-wall distillation columns using a fundamental model. Processes 2014, 2, 180–199. [Google Scholar]
  16. Li, X.; Geng, X.L.; Cui, P.Z.; Yang, J.W.; Zhu, Z.Y.; Wang, Y.L.; Xu, D.M. Thermodynamic efficiency enhancement of pressure-swing distillation process via heat integration and heat pump technology. Appl. Therm. Eng. 2019, 154, 519–529. [Google Scholar] [CrossRef]
  17. Wang, Y.L.; Ma, K.; Yu, M.X.; Dai, Y.; Yuan, R.J.; Zhu, Z.Y.; Gao, J. An improvement scheme for pressure-swing distillation with and without heat integration through an intermediate connection to achieve energy savings. Comp. Chem. Eng. 2018, 119, 439–449. [Google Scholar] [CrossRef]
  18. Wang, K.L.; Li, J.; Liu, P.; Lian, M.L.; Du, T.Z. Pressure swing distillation for the separation of methyl acetate-methanol azeotrope. Asia-Pac J. Chem. Eng. 2019, 14, e2319. [Google Scholar] [CrossRef]
  19. Varbanov, P.; Klein, A.; Repke, J.U.; Wozny, G. Minimising the startup duration for mass- and heat-integrated two-column distillation systems: A conceptual approach. Chem. Eng. Process. 2008, 47, 1456–1469. [Google Scholar] [CrossRef]
  20. Rahman, I.; Sagar, S.A. Optimization of pressure-swing distillation by evolutionary techniques: Separation of ethanol-water and acetonitrile-water mixtures. Chem. Prod. Process. Model. 2018, 13, 20170007. [Google Scholar]
  21. Repke, J.U.; Forner, F.; Klein, A. Separation of homogeneous azeotropic mixtures by pressure swing distillation-analysis of the operation performance. Chem. Eng. Technol. 2005, 28, 1151–1157. [Google Scholar] [CrossRef]
  22. Kim, K.W.; Shin, J.S.; Kim, S.H.; Hong, S.K.; Cho, J.H.; Park, S.J. A computational study on the separation of acetonitrile and water azeotropic mixture using pressure swing distillation. J. Chem. Eng. Jpn. 2013, 46, 347–352. [Google Scholar] [CrossRef]
  23. Huang, F.; Zheng, S.; Chen, Y.; Zhou, M.; Sun, X. Simulation and optimization of pressure-swing distillation system for high purity acetonitrile. In ACSR-Advances in Computer Science Research, Proceedings of the 2016 International Conference on Modeling, Simulation and Optimization Technologies and Applications (MSOTA), Xiamen, China, 18–19 December 2016; Atlantis Press: Paris, France, 2016; Volume 58, pp. 96–100. [Google Scholar]
  24. Huang, K.; Shan, L.; Zhu, Q.; Qian, J. Adding rectifying/stripping section type heat integration to a pressure-swing distillation (PSD) process. Appl. Therm. Eng. 2008, 28, 923–932. [Google Scholar] [CrossRef]
  25. Matsuda, K.; Huang, K.; Iwakabe, K.; Nakaiwa, M. Separation of binary azeotrope mixture via pressure-swing distillation with heat integration. J. Chem. Eng. Jpn. 2011, 44, 969–975. [Google Scholar] [CrossRef]
  26. Gao, Z.; Saxen, H.; Gao, C. Guest editorial: Special section on data-driven approaches for complex industrial systems. IEEE Trans. Ind. Informat. 2013, 9, 2210–2212. [Google Scholar] [CrossRef]
  27. Gao, Z.; Nguang, S.K.; Kong, D.X. Advances in modelling, monitoring, and control for complex industrial systems. Complexity 2019, 2019, 2975083. [Google Scholar] [CrossRef]
  28. Dai, X.; Gao, Z. From model, signal to knowledge: A data-driven perspective of fault detection and diagnosis. IEEE Trans. Ind. Informat. 2013, 9, 2226–2238. [Google Scholar] [CrossRef]
  29. Zhai, C.; Liu, Q.; Romagnoli, J.A.; Sun, W. Modeling/simulation of the dividing wall column by using the rigorous model. Processes 2019, 7, 26. [Google Scholar] [CrossRef]
  30. Liang, T.; Guo, X.; Giwa, A.S.; Shi, J.; Li, Y.; Wei, Y.; Du, J. Design and optimization of a process for the production of methyl methacrylate via direct methylation. Processes 2019, 7, 377. [Google Scholar] [CrossRef]
  31. Petrovic, B.A.; Masoudi, S.M. Optimization of post combustion CO2 capture from a combined-cycle gas turbine power plant via taguchi design of experiment. Processes 2019, 7, 364. [Google Scholar] [CrossRef]
  32. Sarda, P.; Hedrick, E.; Reynolds, K.; Bhattacharyya, D.; Zitney, S.E.; Omell, B. Development of a dynamic model and control system for load-following studies of supercritical pulverized coal power plants. Processes 2018, 6, 226. [Google Scholar] [CrossRef]
  33. Gmehling, J.; Menke, J.; Fischer, K.; Krafczyk, J. Azeotropic Data; Wiley-VCH: Weinheim, Germany, 2004. [Google Scholar]
  34. Luyben, W.L.; Chien, I.L. Design and Control of Distillation Systems for Separating Azeotropes; John Wiley & Sons: Hoboken, NJ, USA, 2011. [Google Scholar]
  35. Luo, H.; Liang, K.; Li, W.; Li, Y.; Xia, M.; Xu, C. Comparison of pressure-swing distillation and extractive distillation methods for isopropyl alcohol/diisopropyl ether separation. Ind. Eng. Chem. Res. 2014, 53, 15167–15182. [Google Scholar] [CrossRef]
Figure 1. Txy phase diagram for the acetonitrile–water mixture.
Processes 07 00409 g001
Figure 2. Optimization sequence of acetonitrile–water separation process by pressure swing distillation (PSD).
Processes 07 00409 g002
Figure 3. Optimized flow diagram of pressure swing distillation (PSD) without heat integration.
Processes 07 00409 g003
Figure 4. Optimization sequence of acetonitrile–water separation process by pressure swing distillation (PSD) with full-heat integration.
Processes 07 00409 g004
Figure 5. Effect of the reflux ratio RR1 in the low pressure column (LPC).
Processes 07 00409 g005
Figure 6. Effect of the reflux ratios of two columns on the total annual cost (TAC).
Processes 07 00409 g006
Figure 7. Effect of three feeding positions on the total annual cost (TAC).
Processes 07 00409 g007
Figure 8. Optimized flow diagram of the pressure swing distillation (PSD) with full-heat integration.
Processes 07 00409 g008
Table 1. Effect of the pressure on acetonitrile–water azeotrope.
Operating Pressure/AtmBoiling Point of Acetonitrile/°CBoiling Point of Water/°CBoiling Point of Azeotrope/°CAzeotropic Concentration (Mole)
AcetonitrileWater
181.48100.0276.400.69710.3029
2105.33120.6998.060.64380.3562
3120.91134.05112.010.61160.3884
4132.79144.16122.580.58860.4114
5142.52152.41131.180.57070.4293
Table 2. Specific results for the tray number of the low pressure column (LPC).
Design VariablesCase 1 Case 2Case 3Case 4Case 5
NT12122232425
NT21717171717
RR10.20.20.20.20.2
RR20.70.70.70.70.7
ID1/m0.920.810.810.820.82
ID2/m0.860.760.760.760.76
RREC/kmol/h116.2783.0582.9782.9682.96
Equipment investment cost/103 $738.52625.32622.82631.88640.12
Operation cost/103 $/y392.61308.05307.85307.83307.82
TAC/103 $/y638.78516.49515.45518.45521.20
Table 3. Specific results for the tray number of the high pressure column (HPC).
Design VariablesCase 6 Case 7Case 8Case 9Case 10
NT12323232323
NT21516171819
RR10.20.20.20.20.2
RR20.70.70.70.70.7
ID1/m0.830.820.810.810.81
ID2/m0.770.760.760.760.76
RREC/kmol/h88.1383.7682.9782.7582.69
Equipment investment cost/103 $621.25618.81622.82630.15637.76
Operation cost/103 $/y320.56309.79307.85307.31307.14
TAC/103 $/y527.65516.06515.45517.36519.73
Table 4. Comparison of two technological processes.
Design VariablesWithout Heat IntegrationFull-Heat Integration
NT12123
NT22517
NF1/NFR19/1620/16
NF2169
RR1/RR20.3/0.50.20/0.70
QCON1/kW1210.361191.24
QREB1/kW1249.13
QCON2/kW1003.56
QREB2/kW1147.501373.92
Heat exchanger /kW1221.30
ID1/m0.820.81
ID2/m0.690.76
RREC/kmol/h76.4882.97
Equipment investment cost/103 $676.05622.82
Operation cost/103 $/y537.00307.85
TAC/103 $/y762.35515.45

