Concept of Designing Thermal Condition Monitoring System with ZigBee/GSM Communication Link for Distributed Energy Resources Network in Rural and Remote Applications

Abstract
1. Introduction
2. Importance of Thermal Condition Monitoring
2.1. Attributes of Thermal Condition Monitoring
2.2. Solar PV Panels
2.3. Wind Turbine Rotatory System
2.4. Distribution Cable Lines
2.5. Protection and Control Components
2.6. Storage Batteries
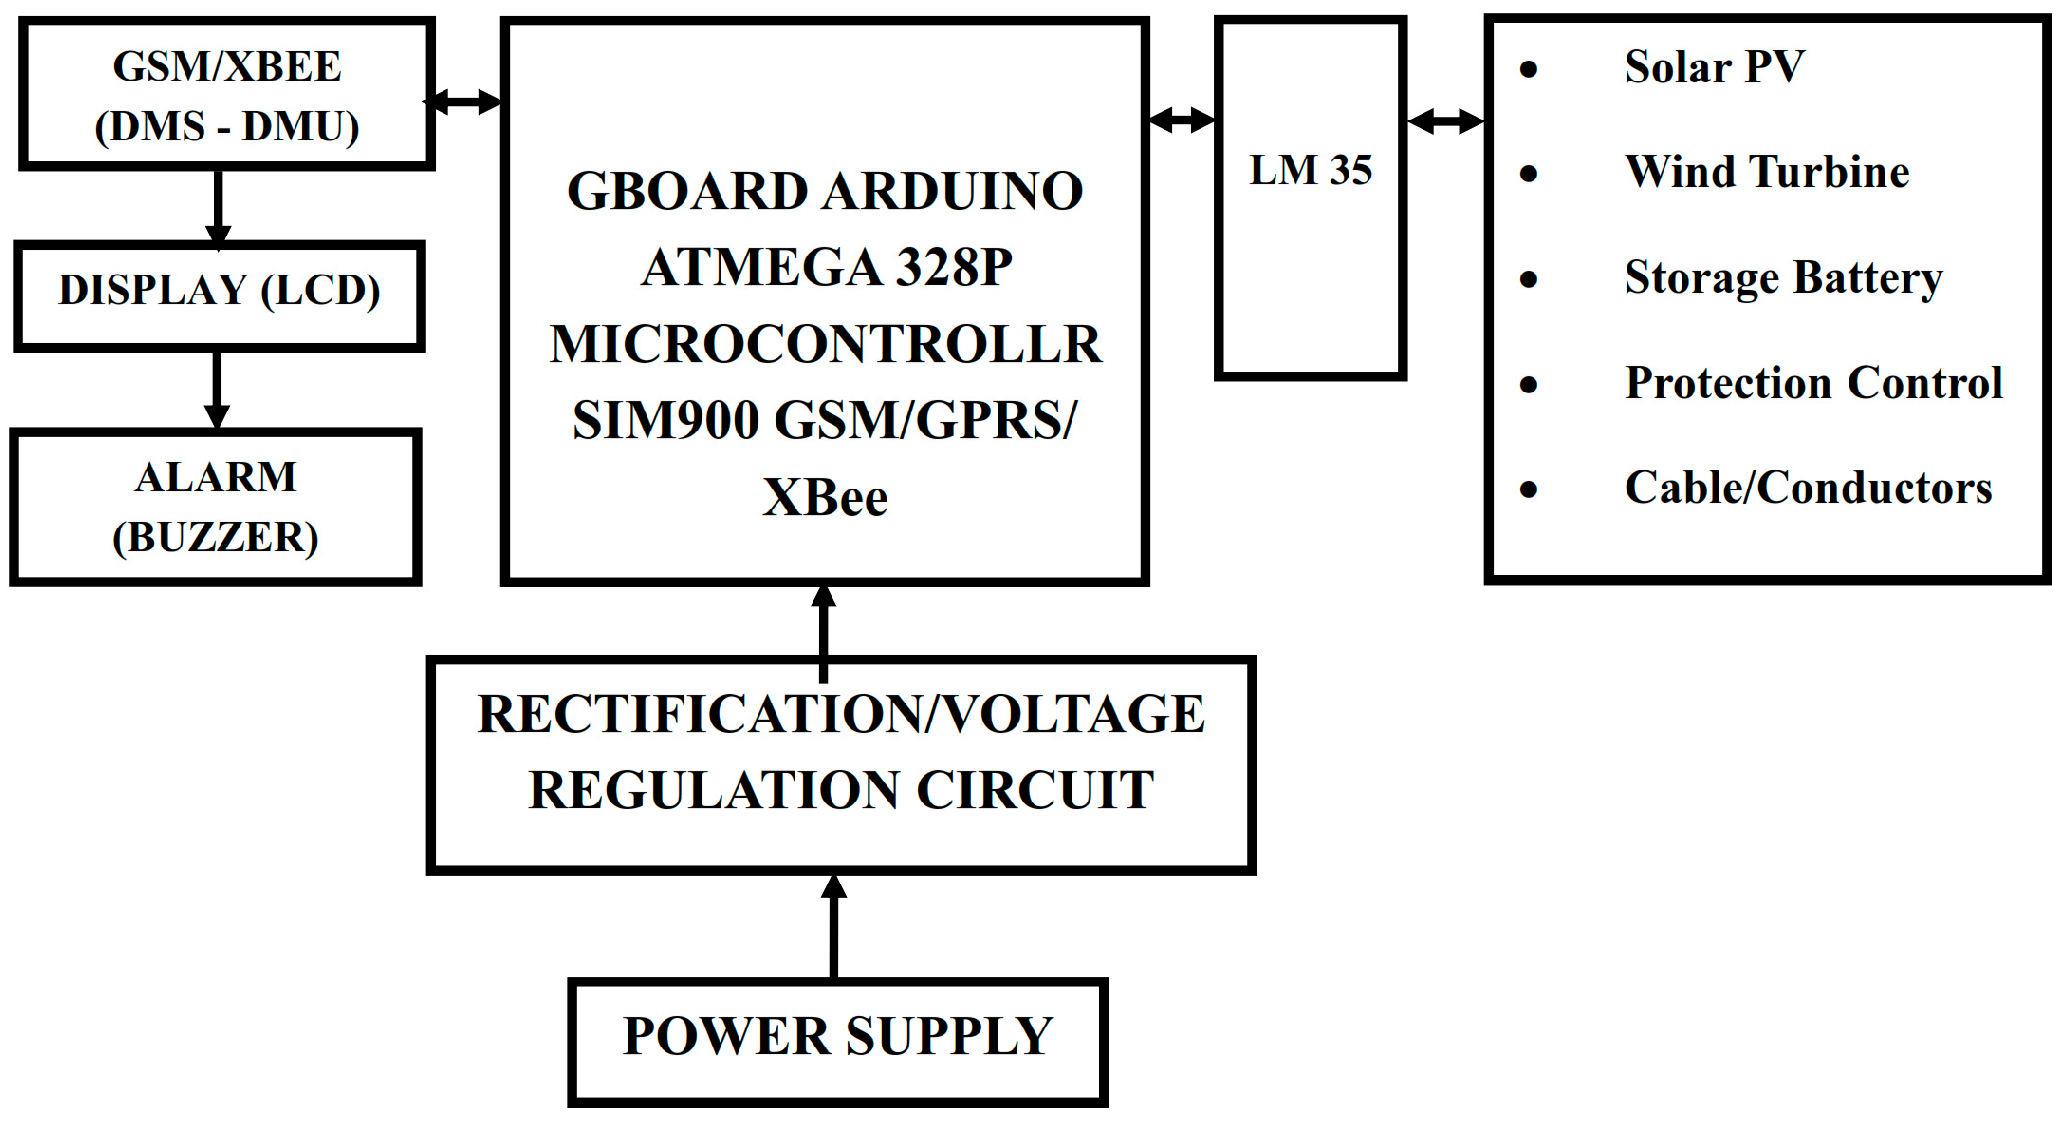
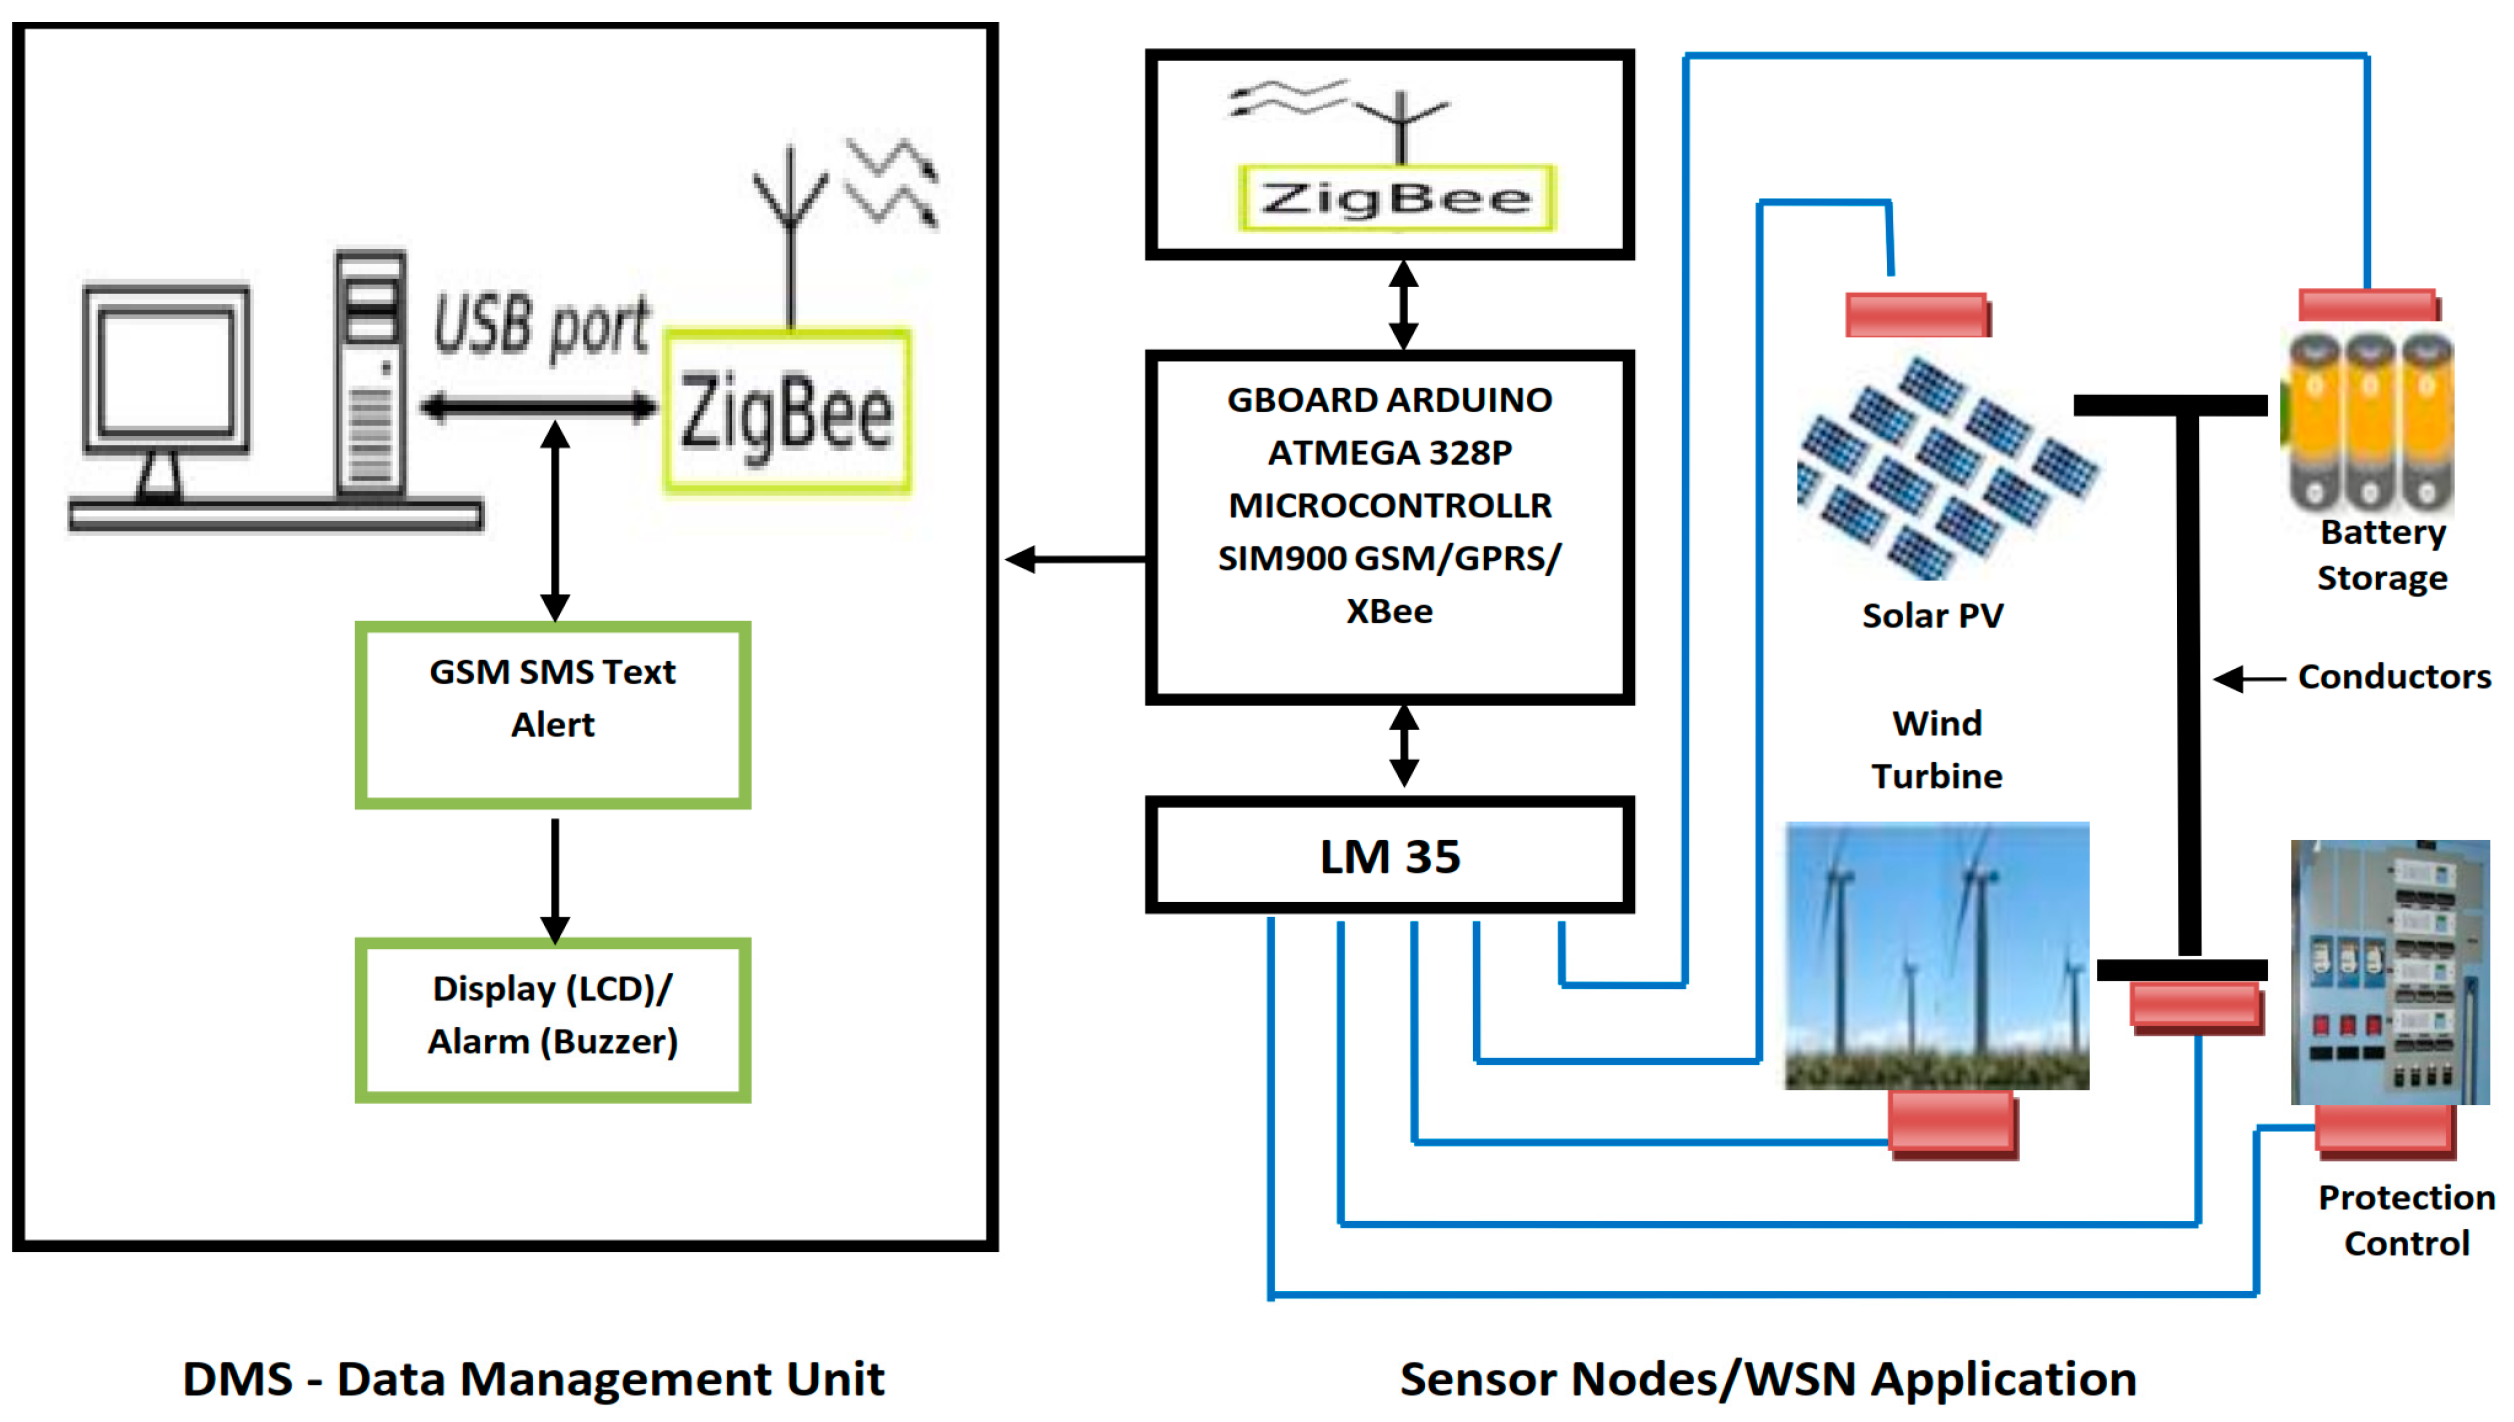
3. Development of Thermal Condition Monitoring System
3.1. Design Concept Relevance to DERs Integrated Grid
3.2. Overview of the Communication Link
3.3. Overview of WSNs and Communication Links Characteristics
3.3.1. Attribution of Emerging Wireless Communication Links
3.3.2. Payload Data Rate and Scalability
3.3.3. Real-Time and Quality of Service Characteristics
3.3.4. Deployment and Cost Implications
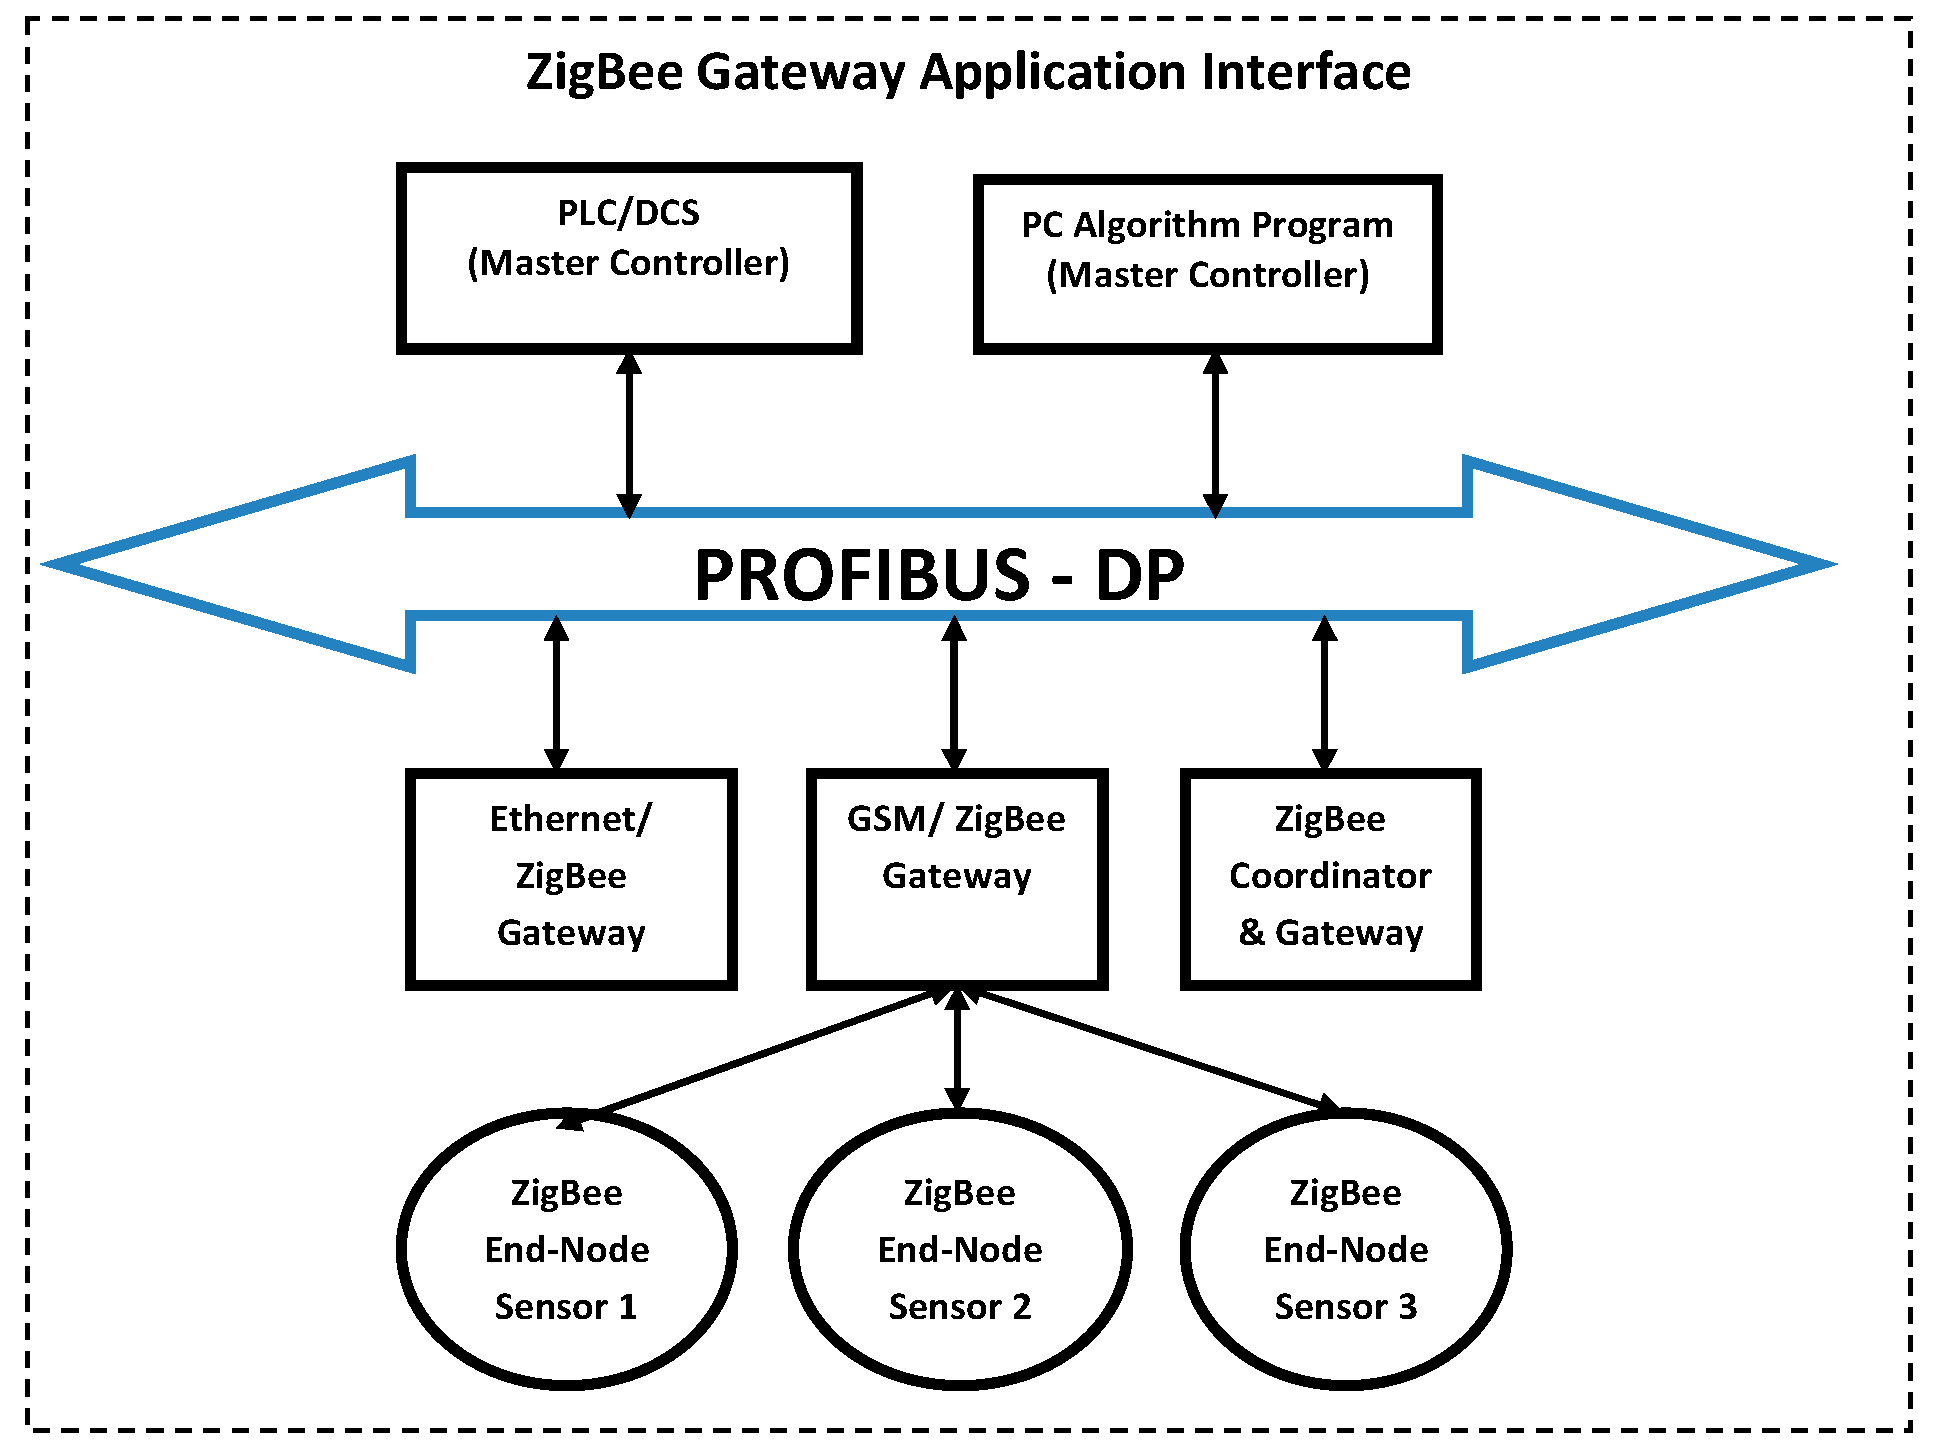
3.3.5. Gateway Application Layer Scheme
- ZigBee WSNs to compose nodes, which runs specific tasks for a local and wide network application functions.
- Low-layer interface to provide suitable network processor criteria usage to enhance the gateway to ZigBee platform.
- Formation of GAL core to promote the gateway state machine application of the system.
- Forwarding of the WSNs application functionalities for implementation by the GAL core.
- Remote procedure call (RPC) layer to present the exposed system layer applications (local and remote) to operate in current implementation state. The RPC layer mechanism is used to make the process of executing code on a remote network or machine as simple and straightforward for local functions. Thus, enhance client call procedures as execution of returned functions. This makes the network server to simply define some routines that are to be assigned for export on ready.
- The local applications of running the application and to assign the WSNs platform the convenience of managing convergence.
3.4. ZigBee and Wireless Sensor Networks Characteristics
3.5. Remedial Action for ZigBee Signal Challenges
3.5.1. Network Interference and Security
3.5.2. Line of Sight and Signal Sensitivity
3.6. Concept Development
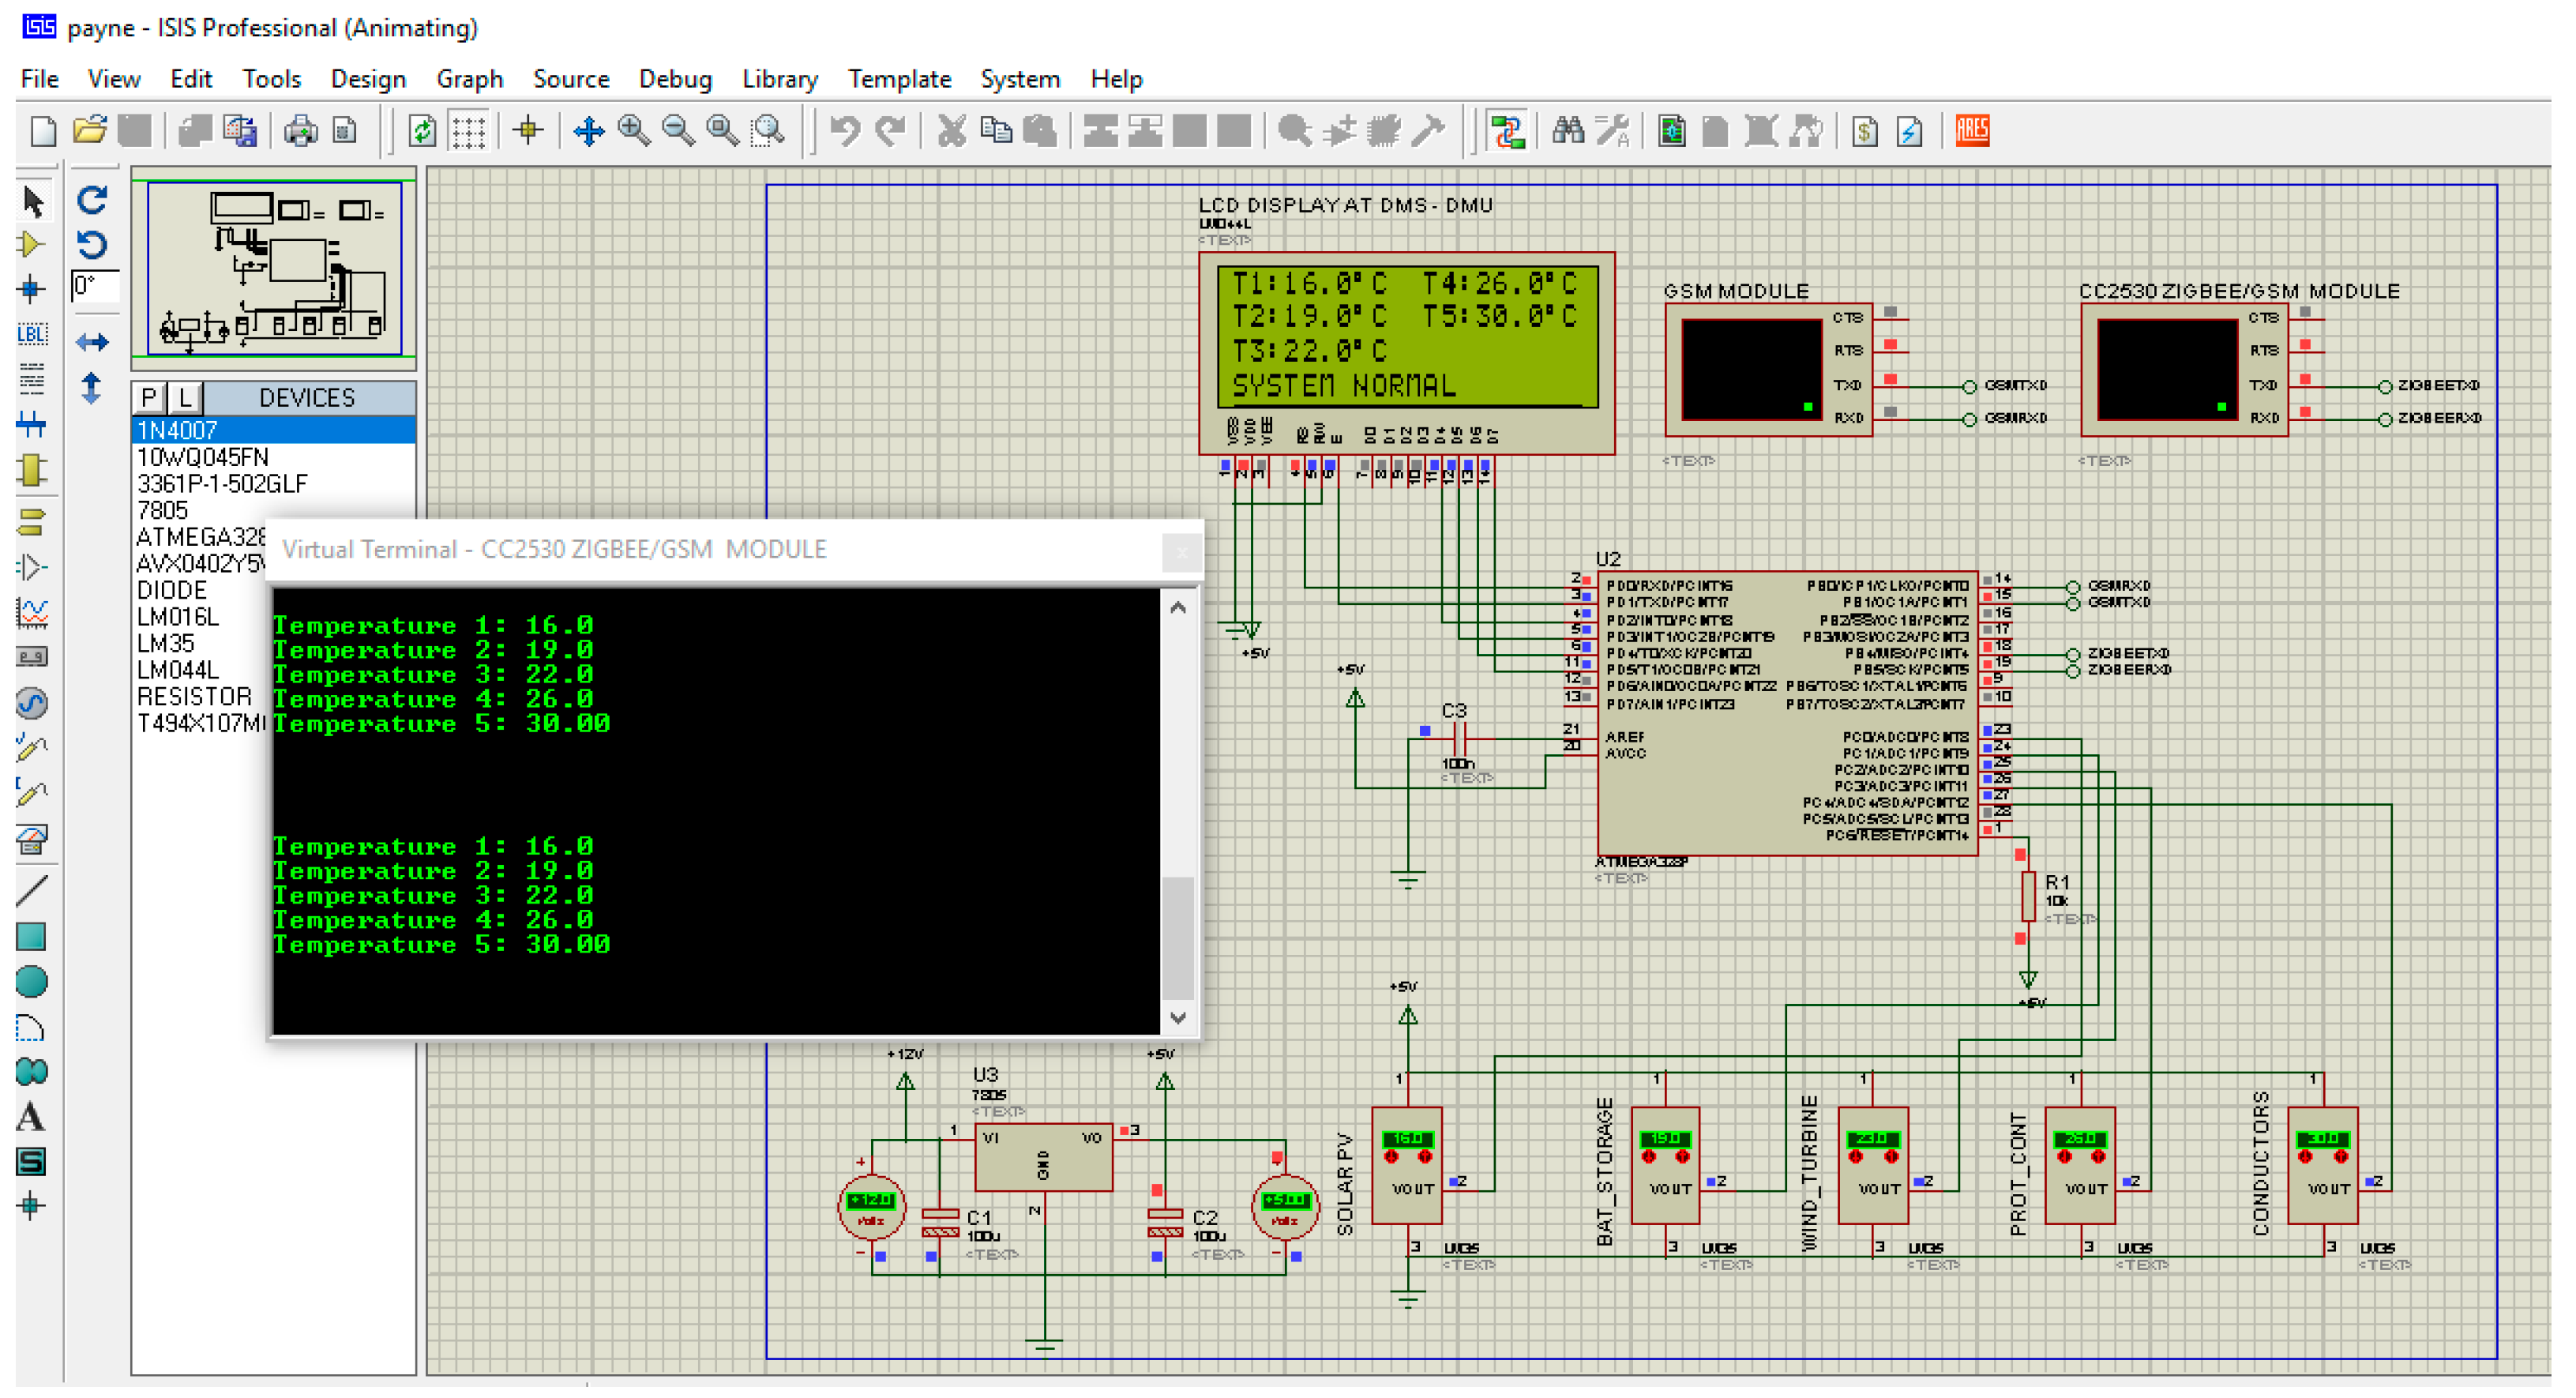
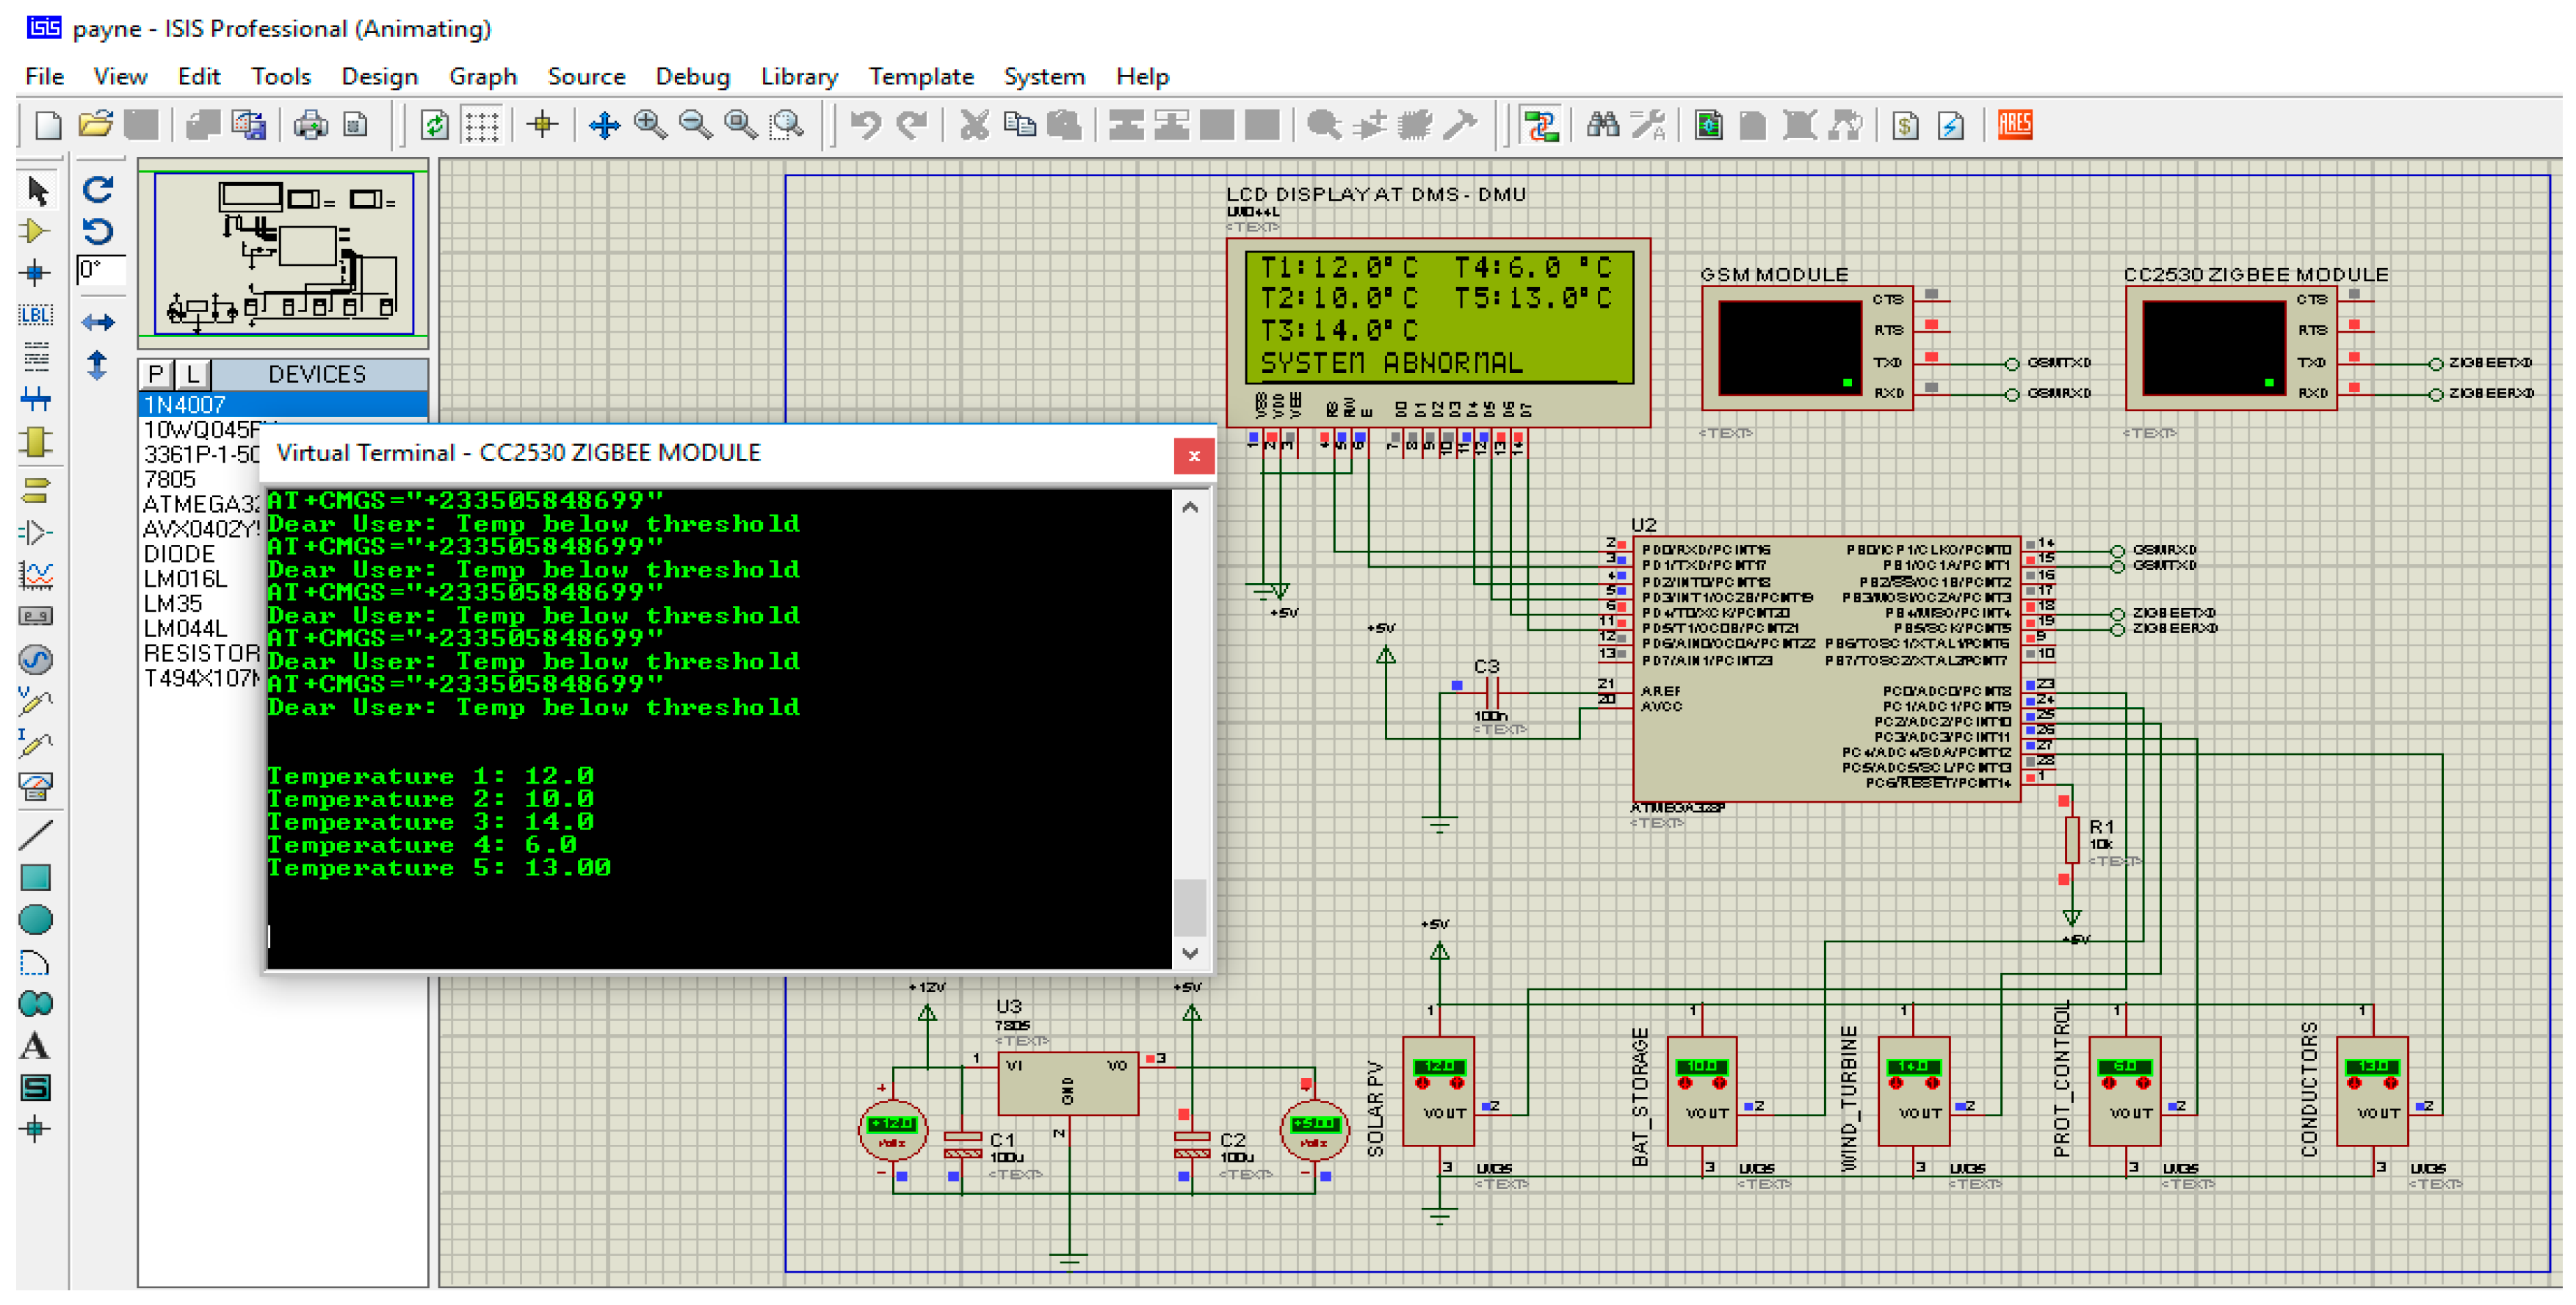
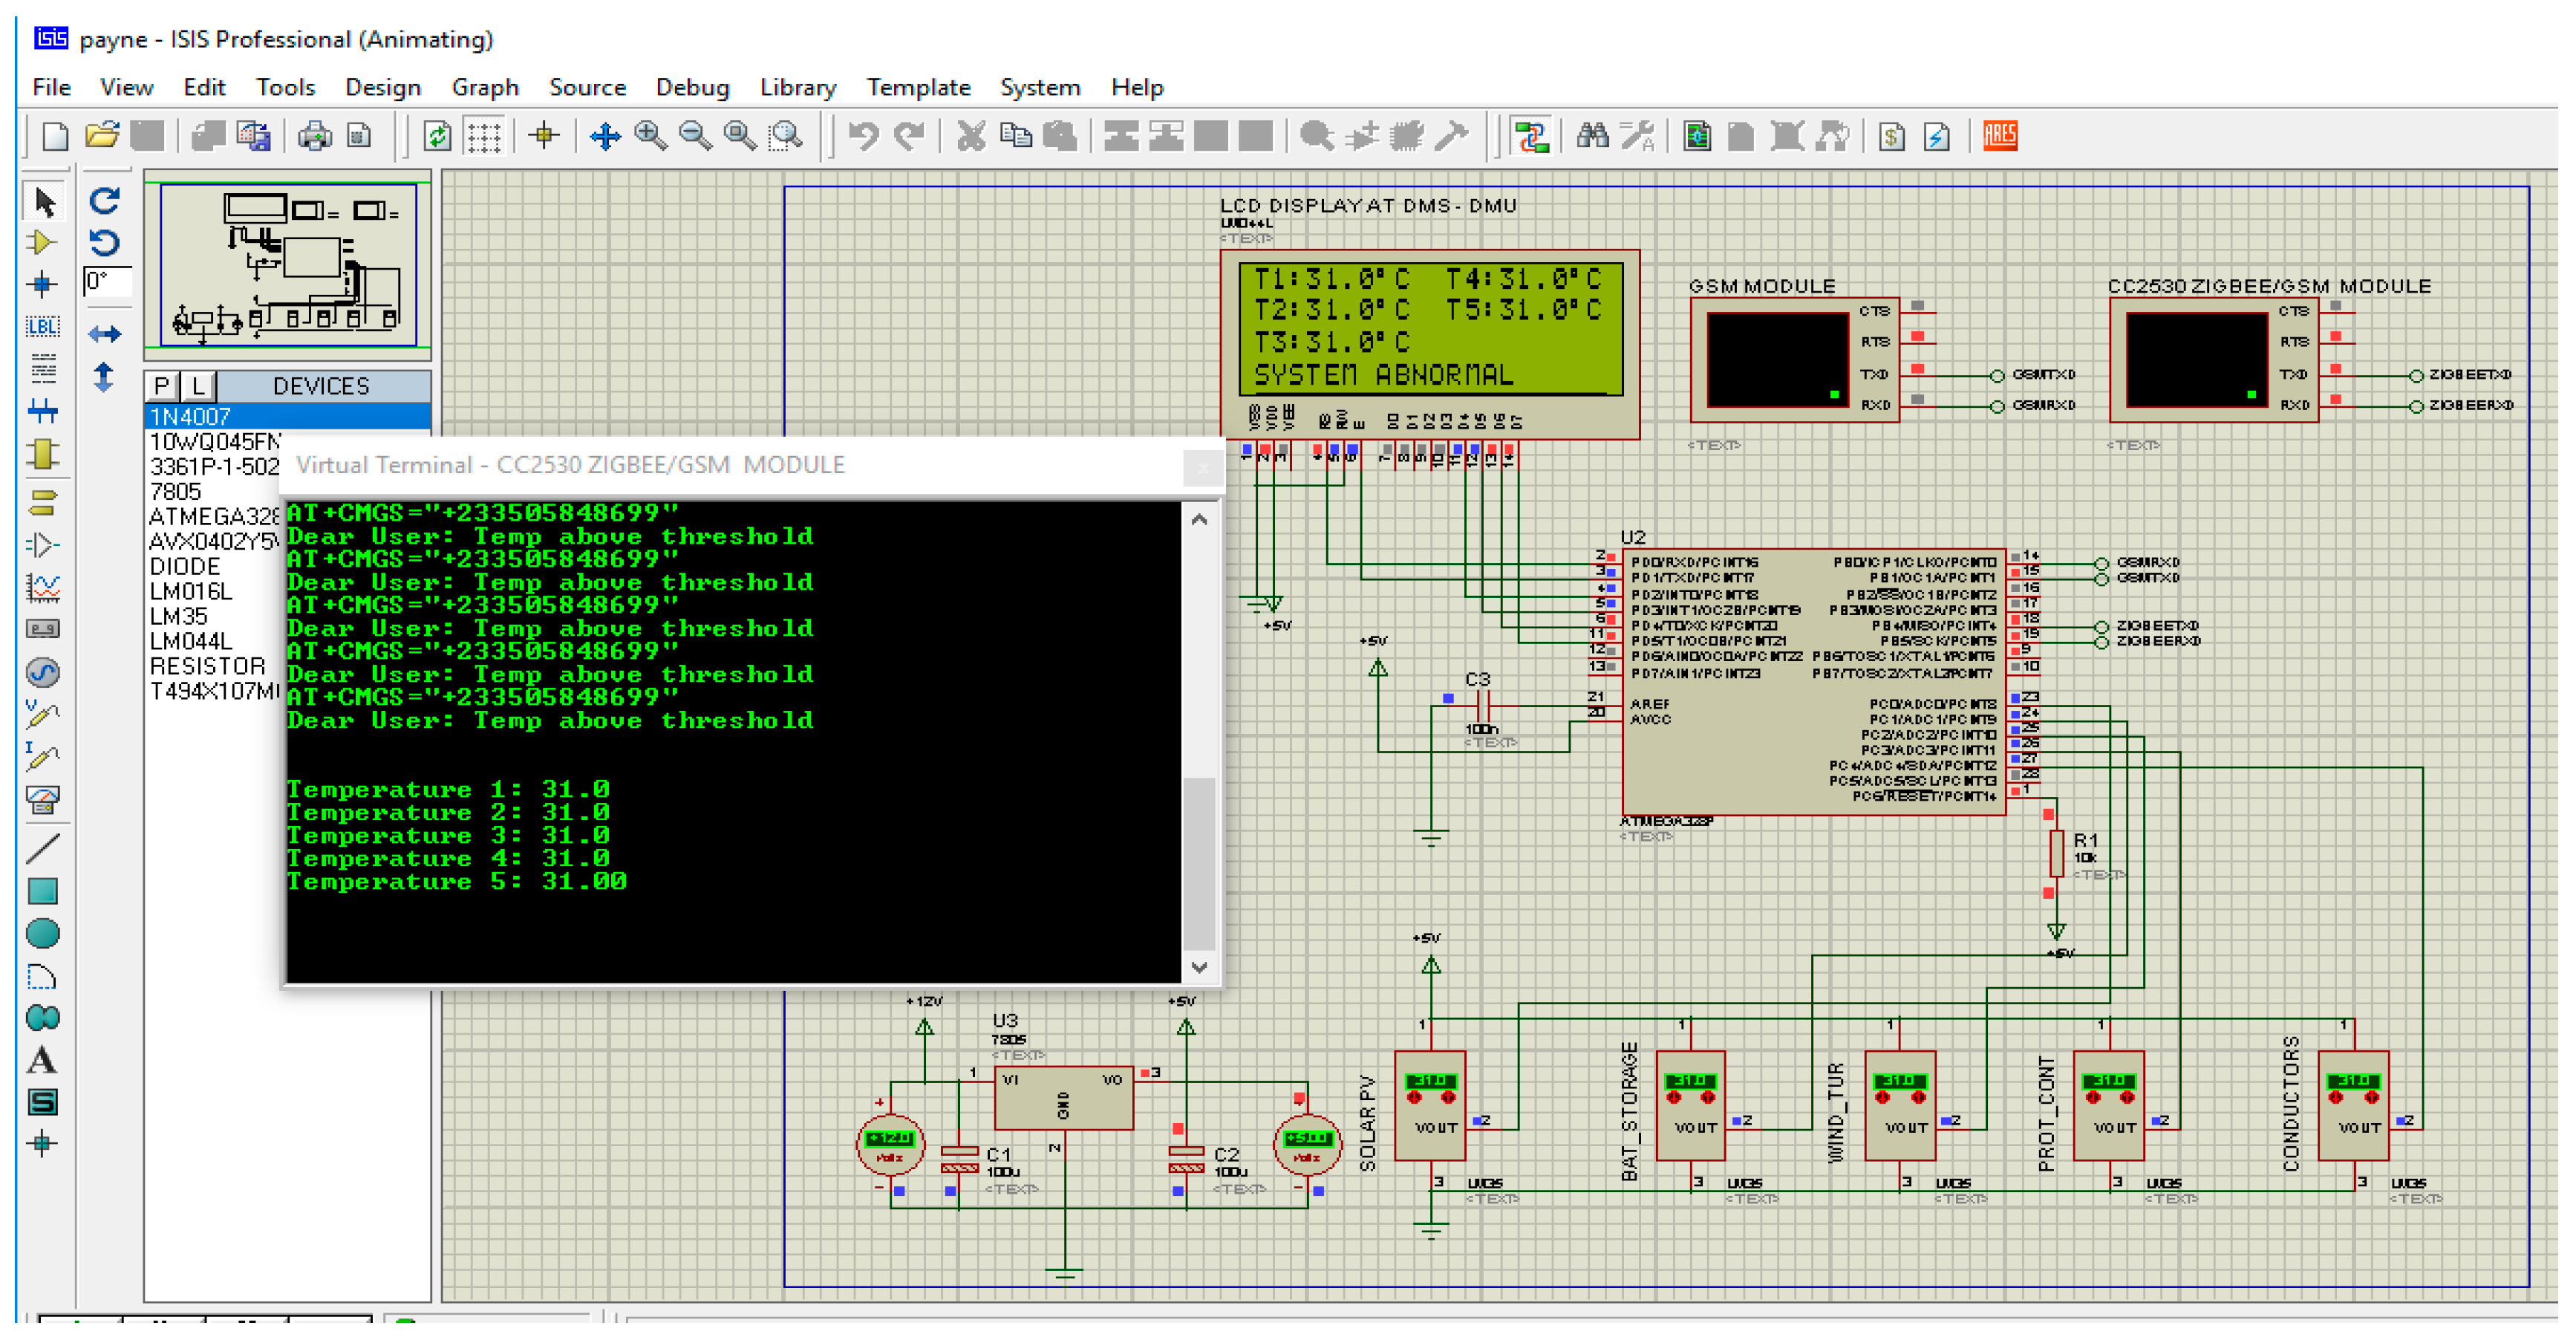
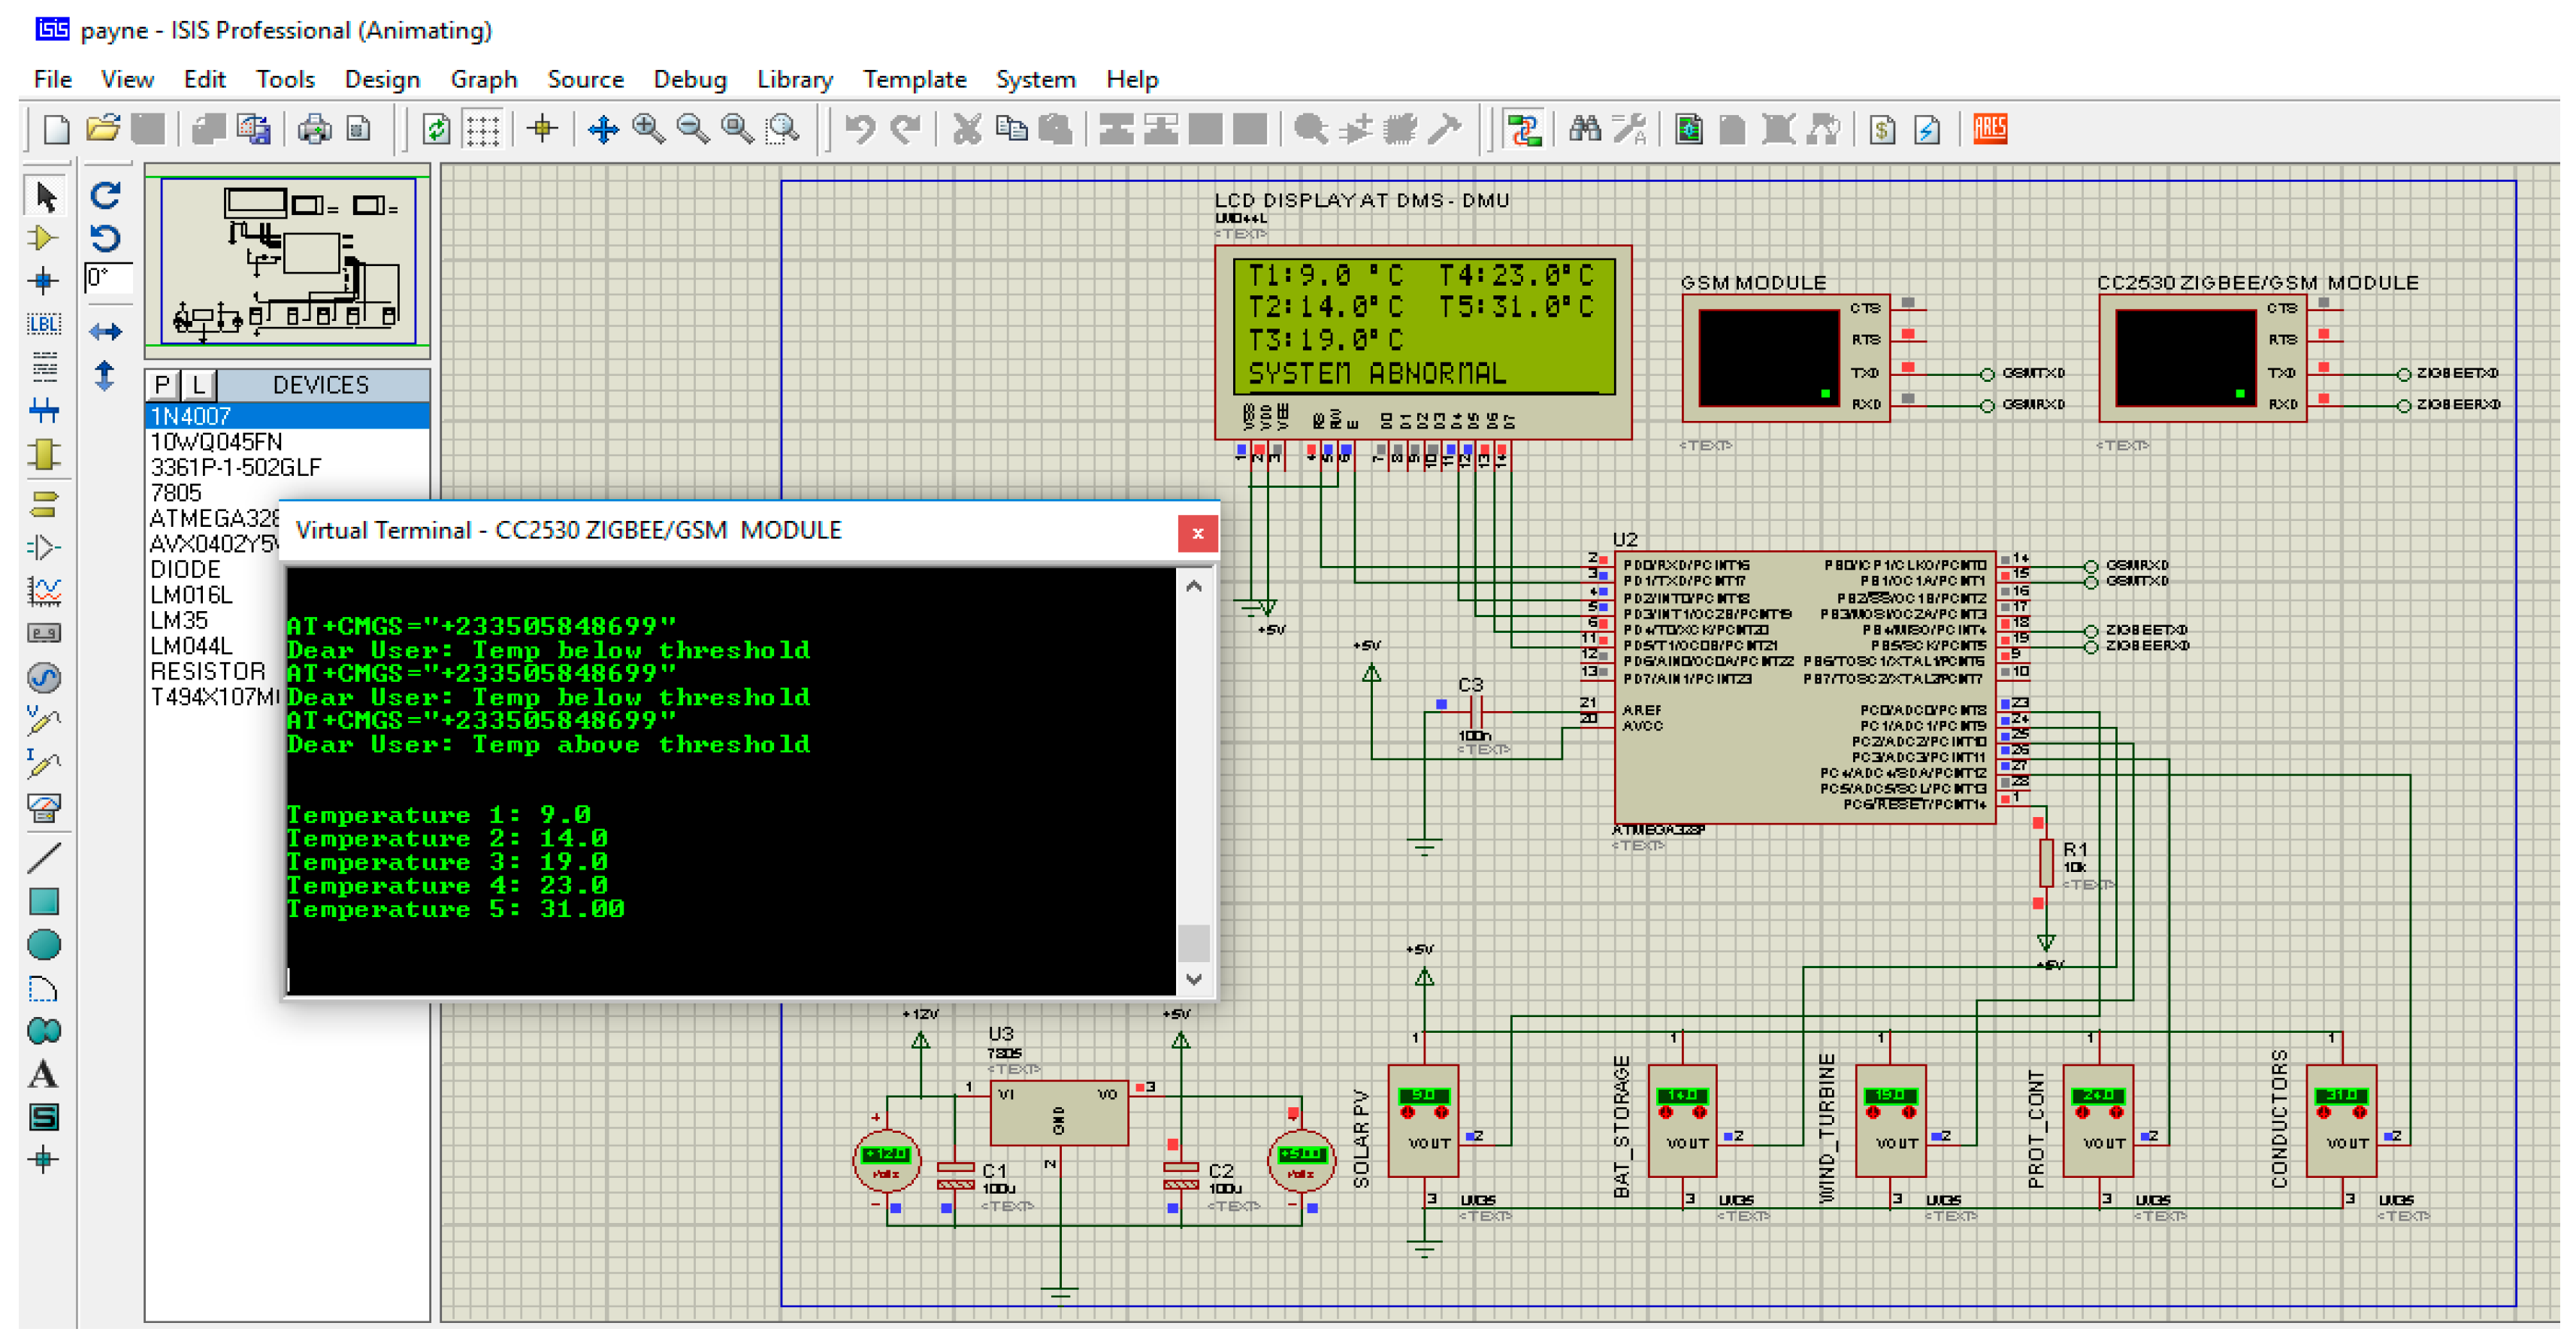
4. Discussion of System Configuration and Performance Analysis
4.1. System Configuration Performance
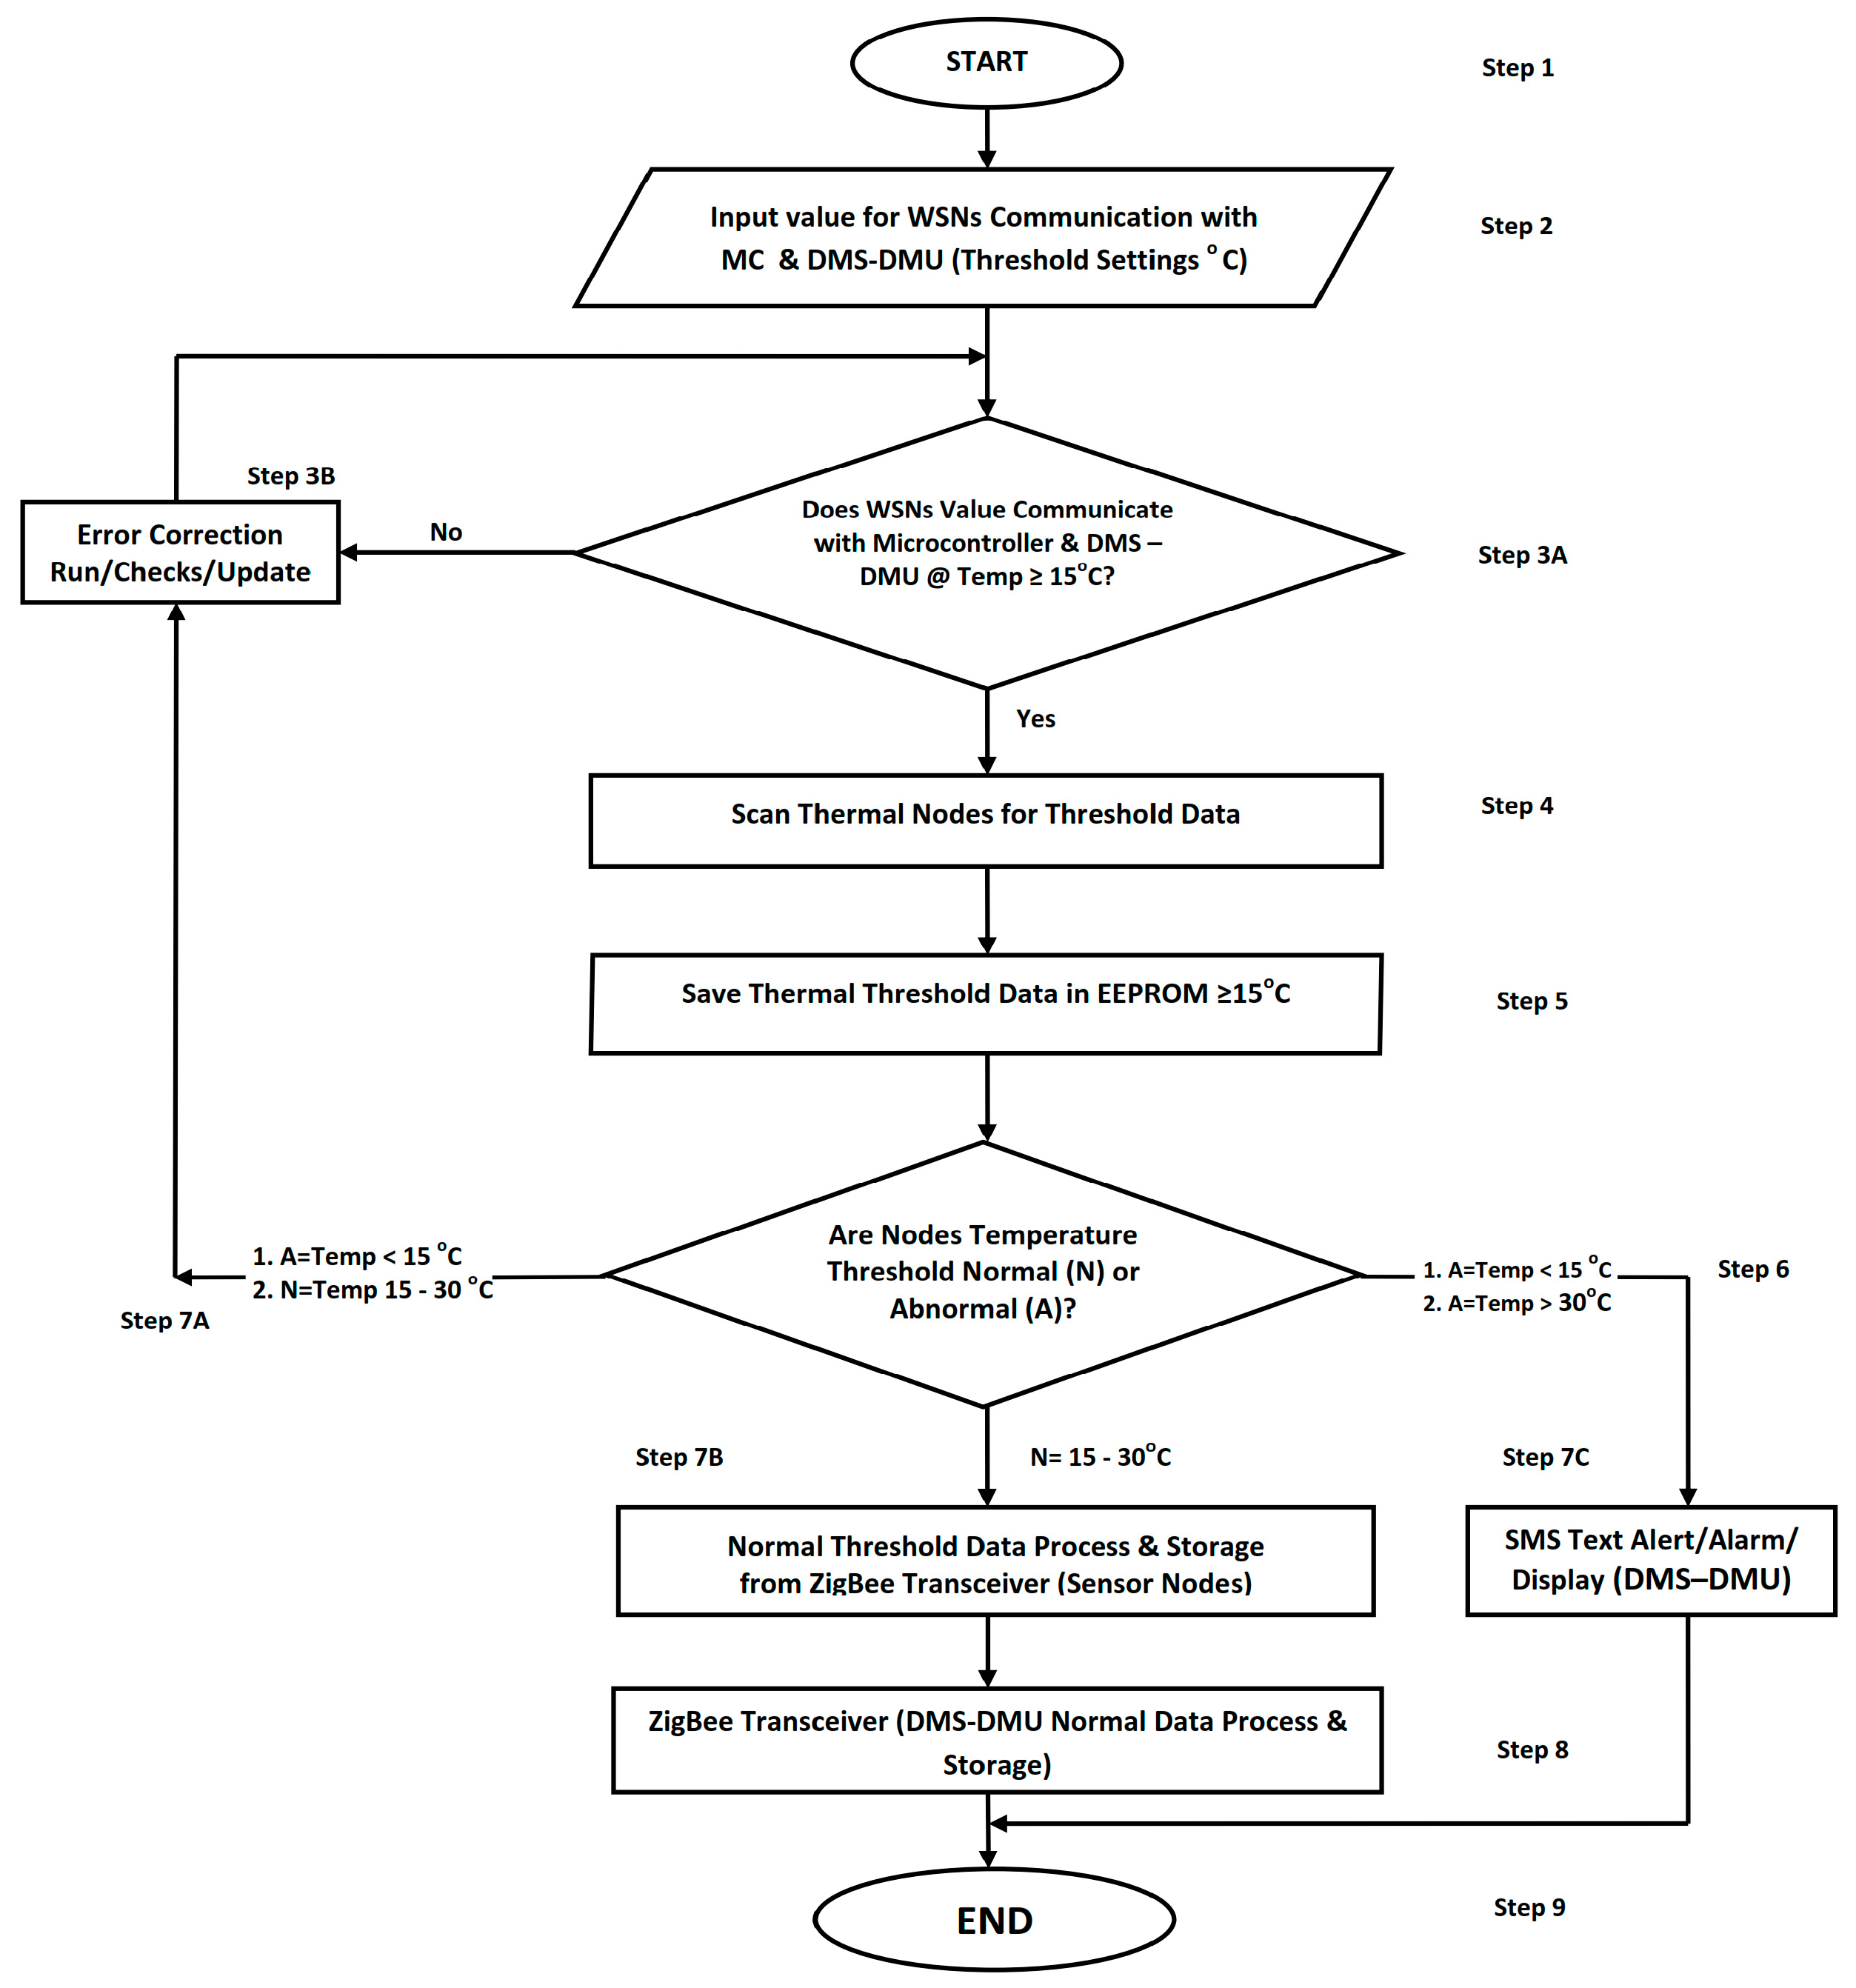
4.2. System Algorithm Development
Algorithm Simulation and Analysis
- Minimum set threshold operating temperature (temp) = 15 °C
- Maximum set thresholds operating temperature (temp) = 30 °C
- Normal operating temperature (temp) range = 15 °C–30 °C
- Critical alert minimum set temperature (temp) = below 15 °C
- Critical alert maximum set temperature (temp) = above 30 °C
4.3. Design Concept Circuit Development and Simulation
5. Conclusions
Author Contributions
Funding
Acknowledgments
Conflicts of Interest
References
- Gungor, V.C.; Korkmaz, M.K. Wireless Link-Quality Estimation in Smart Grid Environments. Int. J. Distrib. Sensor Netw. 2012, 8, 214068. [Google Scholar] [CrossRef]
- Wen, Y.J.; Agogino, A.M. Wireless Networked Lighting Systems for Optimizing Energy Savings and User Satisfaction. In Proceedings of the IEEE Wireless Hive Networks Conference, Austin, TX, USA, 7–8 August 2008. [Google Scholar]
- Corsi, S. Voltage Control and Protection in Electrical Power Systems: From System Components to Wide-Area Control; Springer: London, UK, 2015. [Google Scholar]
- Big Data Analytics, The Power and Energy Magazine, May/June 2018. Available online: www.ieee.org/power (accessed on 19 June 2019).
- Gers, J.M. Distribution System Analysis and Automation; IET: London, UK, 2014. [Google Scholar]
- Masoum, M.A.S.; Fuchs, E.F. Power Quality in Power Systems and Electrical Machines, 2nd ed.; Academic Press Publications: London, UK, 2015. [Google Scholar]
- Gabbar, H.A. Smart Energy Grid Engineering; Elsevier Inc.: London, UK, 2017. [Google Scholar]
- Katsioulis, V.; Karapidakis, E.; Hadjinicolaou, M.; Tsikalakis, A. Wireless Monitoring and Remote Control of PV Systems Based on the ZigBee Protocol. In Proceedings of the IFIP International Federation for Information Processing, IFIP AICT 349; Springer: Berlin, Germany, 2011; pp. 297–304. [Google Scholar]
- IEEE-SA Standards Board. IEEE Standard 802.15.4–2015, IEEE Standard for Low-Rate Wireless Networks. Available online: https://standards.ieee.org/standard/802_15_4-2015.html (accessed on 19 June 2019).
- Lu, J.; Zhao, X.; Yamada, S. Harmonic Balance Finite Element Method Applications in Nonlinear Electromagnetics and Power Systems; John Wiley & Sons: Singapore, 2016. [Google Scholar]
- Madeti, S.R.; Singh, S.N. Monitoring system for photovoltaic plants: A review. Renew. Sustain. Energy Rev. 2017, 67, 1180–1207. [Google Scholar] [CrossRef]
- IEEE-SA Standards Board. IEEE Standard 519-1992, IEEE Recommended Practices and Requirements for Harmonic Control in Electrical Power. Available online: https://ieeexplore.ieee.org/document/210894/similar#similar (accessed on 19 June 2019).
- Alonso, G.M.C.; Balenzategui, J.L. Estimation of photovoltaic module yearly temperature and performance based on nominal operation cell temperature calculations. Renew. Energy 2004, 29, 1997–2010. [Google Scholar]
- Hsu, C.L. Constructing transmitting interface of running parameters of small-scaled wind-power electricity generator with WSN modules. Expert Syst. Appl. 2010, 37, 3893–3909. [Google Scholar] [CrossRef]
- Payne, E.K.; Shulin, L.; Wang, Q.; Wu, L. Design Concept of Thermal Behaviour Condition Monitoring of Distributed Energy Resources Network System with ZigBee and GSM Technology in Remote and Rural Areas. In Proceedings of the 6th IEEE International Conference on Smart Energy Grid Engineering, UOIT, Oshawa, ON, Canada, 12–15 August 2018; pp. 298–302. [Google Scholar]
- Gagliarducci, M.; Lampasi, D.A.; Podestà, L. GSM-based monitoring and control of photovoltaic power generation. Measurement 2007, 40, 314–321. [Google Scholar] [CrossRef]
- Chu, D.; Lux, A. On-line monitoring of power transformers and components: A review of key parameters. In Proceedings of the Electrical Insulation Conference and Electrical Manufacturing and Coil Winding Conference (Cat. No.99CH37035), Cincinnati, OH, USA, 28 October 1999; Volume 26, pp. 669–675. [Google Scholar]
- Tian, B.; Han, S.; Liu, L.; Khadem, S.; Parvin, S. Towards enhanced key management in multiphase ZigBee network architecture. Comput. Commun. 2012, 35, 579–588. [Google Scholar] [CrossRef]
- Tavner, P.L.; Penman, J.; Sedding, H. Condition Monitoring of Rotating Electrical Machines; Institute of Engineering and Technology: London, UK, 2008; pp. 133–134. [Google Scholar]
- Kronitiris, T.; Wasserrab, A.; Balzer, G. Weather-based loading of overhead lines consideration of conductor’s heat capacity. In Proceedings of the International Symposium, 2010 Modern Electric Power Systems, Wroclaw, Poland, 20–22 September 2010. [Google Scholar]
- Genova, F.; Bellifemine, F.; Gaspardone, M. Thermal and energy management system based on low-cost Wireless Sensor Network Technology, to monitor, control and optimize energy consumption in. In Proceedings of the 4th International Telecommunication-Energy Special Conference, Vienna, Austria, 10–13 May 2009. [Google Scholar]
- Honing, N.; De Jong, E.; Bloemhof, G.; La Poutré, H. Thermal Behaviour of Low Voltage Cables in Smart Grid Related Environments. In Proceedings of the 2014 5th IEEE PES Innovative Smart Grid Technologies Europe (ISGT Europe), Istanbul, Turkey, 12–15 October 2014. [Google Scholar]
- Ryszard, P. Engineering Thermodynamics of Thermal Radiation for Solar Power Utilization; McGraw-Hill: New York, NY, USA, 2010; pp. 365–371. [Google Scholar]
- U.S. Department of Energy. A Vision for the Modern Grid; Office of Electricity Delivery and Energy Reliability, Dept of Energy: Washington, DC, USA, 2007.
- Zahurul, S.; Mariun, N.; Grozescu, I.V.; Tsuyoshi, H.; Mitani, Y.; Othman, M.L.; Hizam, H.; Abidin, I.Z. Future strategic plan analysis for integrating distributed renewable generation to smart grid through wireless sensor network: Malaysia prospect. Renew. Sustain. Energy Rev. 2016, 53, 978–992. [Google Scholar] [CrossRef]
- Hegazy, A.A. Comparative study of the performances of four photovoltaic thermal solar air collectors. Energy Convers. Manag. 2000, 41, 861–881. [Google Scholar]
- Kaplani, E.; Kaplanis, S. Thermal modelling and experimental assessment of the dependence of PV module temperature on wind velocity and direction, module orientation and inclination. Sol. Energy 2014, 107, 443–460. [Google Scholar] [CrossRef]
- Tiwari, A.; Sodha, M.S.; Chandra, A. Performance evaluation of photovoltaic thermal solar air collector for composite climate of India. Sol. Energy Mater. Sol. Cells 2007, 90, 175–189. [Google Scholar] [CrossRef]
- Tiwari, A.; Sodha, M.S. Parametric study of various configurations of hybrid PV thermal air collector: experimental validation of the theoretical model. Sol. Energy Mater. Sol. Cells 2007, 90, 9117–9128. [Google Scholar] [CrossRef]
- Ji, C.; He, Z.; Wang, Q.; Xu, G.; Wang, S.; Xu, Z.; Ji, H. Effect of operating conditions on direct liquefaction of low-lipidmicroalgae in ethanol-water co-solvent for bio-oil production. Energy Convers. Manag. 2017, 141, 155–162. [Google Scholar] [CrossRef]
- Wilson, R. Wind turbine aerodynamics. J. Ind. Aerodyn. 1980, 5, 357–372. [Google Scholar] [CrossRef]
- Hameed, Z.; Hong, Y.S.; Cho, Y.M.; Ahn, S.H.; Song, C.K. Condition monitoring and fault detection of wind turbines and related algorithms: A review. Renew. Sustain. Energy Rev. 2009, 13, 1–39. [Google Scholar] [CrossRef]
- Wang, Q.; Zhang, D.; Bai, J.; He, Z. Numerical simulation of catalysis combustion inside micro free-piston engine. Energy Convers. Manag. 2016, 113, 243–251. [Google Scholar] [CrossRef]
- Adapa, R.; Douglass, D.A. Dynamic thermal ratings: Monitors and calculation methods. In Proceedings of the Inaugural IEEE PES 2005 Conference and Exposition in Africa, Durban, South Africa, 11–15 July 2005; pp. 163–167. [Google Scholar]
- CIGRE WG 22.12. Thermal Behaviour of Overhead Conductors; Technical Brochure; Cigre: Brisbane, Australia, 2002; p. 207. [Google Scholar]
- (Cable operation parameters); Olex Australia Pty Ltd. Aerial Conductor Catalogue. Available online: https://www.olex.com.au/Australasia/2012/OLC12641 AerialCat.pdf (accessed on 19 June 2019).
- Li, D.; He, Z.; Xuan, T.; Zhong, W.; Cao, J.; Wang, Q.; Wang, P. Simultaneous capture of liquid length of spray and flame lift-off length for second-generation biodiesel/diesel blended fuel in a constant volume combustion chamber. Fuel 2017, 189, 260–269. [Google Scholar] [CrossRef]
- Berg, I.; LöbL, H.; Grossmann, S.; Golletz, F. Thermal behaviour of network components depending on outdoor weather conditions. In Proceedings of the 20th International Conference on Electricity Distribution, Prague, Czech Republic, 8–11 June 2009. Paper No. 0568. [Google Scholar]
- Lelák, J.; Váry, M.; Packa, J.; Firický, E.; Skoršepová, T. STN EN 62271-202 Manual, High-Voltage Switchgear, and Control Gear: High Voltage/Low Voltage Prefabricated Substation Part 202; ERDF: The Slovak Republic, 2007. [Google Scholar]
- Schaefer, M.; Feser, K. Thermal monitoring of large power transformers. In Proceedings of the PowerTech Budapest 99 Conference, Budapest, Hungary, 29 August–2 September 1999. [Google Scholar] [CrossRef]
- Den Bossche, P.V.; Vergels, F.; Mierlo, J.V.; Matheys, J.; Van Autenboer, W. SUBAT: An assessment of sustainable battery technology. J. Power Sources 2006, 162, 913–919. [Google Scholar] [CrossRef]
- Evans, A.; Strezov, V.; Evans, T.J. Assessment of utility energy storage options for increased renewable energy penetration. Renew. Sustain. Energy Rev. 2012, 16, 4141–4147. [Google Scholar] [CrossRef]
- Leibfried, T. Online monitors keep transformers in service. IEEE Comput. Appl. Power 1998, 11, 36–42. [Google Scholar] [CrossRef]
- IEEE-SA Standards Board. IEEE Standard 1547-2018, IEEE Standard for Interconnection and Interoperability of Distributed Energy Resources with Associated Electric Power Systems Interfaces, IEEE. Available online: https://standards.ieee.org/standard/1547-2018.html (accessed on 19 June 2019).
- Somani, N.A.; Patel, Y. Zigbee: A Low Power Wireless Technology for Industrial Application. Int. J. Control Theory Comput. Model. (IJCTCM) 2012, 2, 27–33. [Google Scholar] [CrossRef]
- Mihajlov, B.; Bogdanoski, M. Overview and Analysis of the Performances of ZigBee based Wireless Sensor Networks. Int. J. Comput. Appl. 2011, 29, 28–35. [Google Scholar]
- Moghe, R.; Lambert, F.C.; Divan, D. Smart stick sensors for the smart grid. IEEE Trans. Smart Grid 2012, 3, 241–252. [Google Scholar] [CrossRef]
- ZigBee Datasheet specification. Available online: https://www.digi.com/pdf/ds_xbee_zigbee.pdf (accessed on 19 June 2019).
- Wang, J.; Chen, J.; Xiong, X.; Lu, X.; Liao, Z.; Chen, X. Temperature safety analysis and backup protection scheme improvement for overhead transmission line in power oscillation condition. Electr. Power Syst. Res. 2019, 166, 88–98. [Google Scholar] [CrossRef]
- Paulescu, M.; Paulescu, E.; Gravila, P. Solar Radiation Measurements, Weather Modeling, and Forecasting of PV Systems Operation; Springer: London, UK, 2013. [Google Scholar]
- Fernández, E.F.; Almonacid, F.; Rodrigo, P.; Pérez-Higueras, P. Model for the prediction of the maximum power of a high concentrator photovoltaic module. Sol. Energy 2013, 97, 12–18. [Google Scholar] [CrossRef]
- Lohier, S.; Rachedi, A.; Salhi, I.; Livolant, E. Multichannel Access for Bandwidth Improvement in IEEE 802.15.4 Wireless Sensor Networks. In Proceedings of the IFIP/IEEE Wireless Days 2011 (IEEE WD’2011), Niagara Falls, ON, Canada, 10–12 October 2011. [Google Scholar]
- Karapistoli, E.; Pavlidou, F.N.; Gragopoulos, I.; Tsetsinas, I. An Overview of the IEEE 802.15.4a Standard. IEEE Commun. Mag. 2010, 48, 47–53. [Google Scholar] [CrossRef]
- Fairman, J.R.; Zimmerman, K.; Gregory, J.W.; Niemira, J.K. International Drive Distribution Automation and Protection. In Proceedings of the 55th Annual Georgia Tech Protective Relaying Conference, Atlanta, GA, USA, 2–4 May 2001. [Google Scholar]
- Schweitzer, E.O., III; Finney, D.; Mynam, M.V. Applying Radio Communication in Distribution Generation Teleprotection schemes. In Proceedings of the 65th Annual Conference for Protective Relay Engineers, College Station, TX, USA, 2–5 April 2012. [Google Scholar]
- IEEE. IEEE Standard Std 802.15.4™-2015. Available online: https://ieeexplore.ieee.org/document/7460875 (accessed on 19 June 2019). [CrossRef]
- Moxley, R.; Fodero, K. High-Speed Distribution Protection Made Easy: Communications-Assisted Protection Schemes for Distribution Applications. In Proceedings of the 31st Annual Western Protective Relay Conference, Spokane, WA, USA, 19–21 October 2004. [Google Scholar]
- Batista, N.C.; Melício, R.; Matias, J.C.O.; Catalão, J.P.S. Photovoltaic and wind energy systems monitoring and building/home energy management using ZigBee devices within a smart grid. Energy 2013, 49, 306–315. [Google Scholar] [CrossRef]
- Le, K.T. Designing a ZigBee ready IEEE 802.15.4- Compliant Radio Transceiver. Next Generation Wireless Magazine. pp. 42–50. Available online: www.rfdesign.com (accessed on 19 June 2019).
- ZigBee Data Information. Available online: https://en.wikipedia.org/wiki/XBee (accessed on 19 June 2019).
- Labiod, H.; Afifi, H.; Santis, C. Wi-Fi, Bluetooth, ZigBee, and WiMAX; Springer: Berlin, Germany, 2007. [Google Scholar]
- Borean, C.; Pastrone, C. GAL: Gateway Abstraction Layer for fast application development in ZigBee Networks. In Proceedings of the 2nd European ZigBee Developers Conference - EuZDC 2008, Munich, Germany, 24–25 June 2008. [Google Scholar]
- Benghanem, M. A low-cost wireless data acquisition system for weather station monitoring. Renew. Energy 2010, 35, 862–872. [Google Scholar] [CrossRef]
- Collotta, M.; Salerno, V.M. A real-time network based on IEEE 802.15.4/ZigBee to control home automation environment. In Proceedings of the International forum “Modern Information Society Formation Problems, Perspectives, Innovation Approaches”, St. Petersburg, Russia, 6–11 June 2010. [Google Scholar]
- Arbab-Zavar, B.; Palacios-Garcia, E.J.; Vasquez, J.C.; Guerrero, J.M. Smart Inverters for Microgrid Applications: A Review. Energies 2019, 12, 840. [Google Scholar] [CrossRef]
- Molina-Garcia, A.; Campelo, J.C.; Blanc, S.; Serrano, J.J.; Garcia-Sanchez, T.; Bueso, M.C. A Decentralized Wireless Solution to Monitor and Diagnose PV Solar Module Performance Based on Symmetrized-Shifted Gompertz Functions. Sensors 2015, 15, 18459–18479. [Google Scholar] [CrossRef]
- Gungor, V.C.; Lu, B.; Hancke, G.P. Opportunities and challenges of wireless sensor networks in smart grid. IEEE Trans. Ind. Electron. 2010, 57, 3557–3564. [Google Scholar] [CrossRef]
- Supriya, S.; Magheshwari, M.; Sree Udhyalakshmi, S.; Subhashini, R. Musthafa Smart grid technologies: Communication technologies and standards. Int. J. Appl. Eng. Res. 2015, 10, 16932–16941. [Google Scholar]
- Mekki, K.; Bajic, E.; Chaxel, F.; Meyer, F. A comparative study of LPWAN technologies for large-scale IoT deployment. ICT Express 2019, 5, 1–7. [Google Scholar] [CrossRef]
- LoraWAN Characteristics. Available online: https://www.link-labs.com/blog/what-is-lorawan (accessed on 19 June 2019).
- Chen, F.; Talanis, T.; German, R.; Dressler, F. Real time Enabled IEEE 802.15.4 Sensor Networks in Industrial Automation. In Proceedings of the IEEE Symposium on Industrial Embedded Systems (SIES 2009), Lausanne, Switzerland, 8–10 July 2009; pp. 136–139. [Google Scholar]
- Skendzic, V.; Guzma, A. Enhancing Power System Automation through the Use of Real-Time Ethernet. In Proceedings of the 2006 Power Systems Conference: Advanced Metering, Protection, Control, Communication, and Distributed Resources, Clemson, SC, USA, 14–17 March 2006. [Google Scholar]
- Hancke, G.P.; Silva, B.; Hancke, G.P., Jr. The Role of Advanced Sensing in Smart Cities. Sensors 2013, 13, 393–425. [Google Scholar] [CrossRef] [PubMed]
- Dzung, P.Q.; Dao, N.D.; Nguyen, B.A.; Le, C.H.; Hong-Hee, L. Real-time communication network solution based on ZigBee and Ethernet for photovoltaic systems. In Proceedings of the 2014 IEEE 9th Conference on Industrial Electronics and Applications (ICIEA), Hangzhou, China, 9–11 June 2014; pp. 197–202. [Google Scholar]
- Chaari, L.; Kamoun, L. IEEE 802.15.4/Zigbee Performance Analysis for Real Time Applications Using OMNET++ Simulator. In Advances in Wireless, Mobile Networks and Applications Communications, Computer and Information Science Vol. 154, Proceedings of the International Conferences WiMoA 2011 and ICCSEA 2011, Dubai, UAE, 25–27 May 2011; Springer: Berlin, Germany; pp. 54–68.
- ZigBee Signal Characteristics. Available online: https://en.wikipedia.org/wiki/Zigbee#Device_types_and_operating_modes (accessed on 19 June 2019).
- Jiang, N.; Zhu, Y. An Optimization Scheme in Wireless Temperature Measuring Sensor Network. In Proceedings of the 2015 IEEE 12th International Conference on Networking, Sensing and Control Howard Civil Service International House, Taipei, Taiwan, 9–11 April 2015; pp. 110–115. [Google Scholar]
- Remote Procedure Calls. Available online: https://en.wikipedia.org/wiki/Remote_procedure_call (accessed on 19 June 2019).
- Yang-ting, Y.; Hai-dong, L. Wireless Industrial Communication System Based on Profibus-DP and ZigBee. In Proceedings of the 11th International Conference on Computer Science & Education (ICCSE 2016), Nagoya, Japan, 23–25 August 2016; pp. 666–669. [Google Scholar]
- Persia, S.; Carciofi, C.; Faccioli, M. NB-IoT and LoRA connectivity analysis for M2M/IoT smart grids applications. In Proceedings of the AEIT International Annual Conference, Cagliari, Italy, 20–22 September 2017; pp. 1–6. [Google Scholar]
- Mukaro, R.; Carelse, X.F. A microcontroller-based data acquisition system for solar radiation and environmental monitoring. IEEE Trans. Instrum. Meas. 1999, 48, 1232–1238. [Google Scholar] [CrossRef]
- Harmah, D.J.; Payne, E.K. Telemedicine SMS-Based ECG Monitoring System. Int. J. Sci. Res. Publ. 2015, 5, 277–280. [Google Scholar]
- Datasheet. Available online: https://www.digikey.com/en/producthighlight/d/digi-intl/world-of-digi-xbee (accessed on 19 June 2019).
- Available online: https://www.digikey.com/en/articles/techzone/2011/may/unlicensed-915-mhz-band-fitsmany-applications-and-allows-higher-transmit-power (accessed on 19 June 2019).
- Nadimi, E.S.; Jørgensen, R.N.; Blanes-Vidal, V.; Christensen, S. Monitoring and classifying animal behavior using ZigBee-based mobile ad hoc wireless sensor networks and artificial neural networks. Comput. Electron. Agric. 2012, 82, 44–54. [Google Scholar] [CrossRef]
- Paredes-Parra, J.M.; Mateo-Aroca, A.; Silvente-Niñirola, G.; Bueso, M.C.; Molina-Garcia, A. PV Module Monitoring System Based on Low-Cost Solutions: Wireless Raspberry Application and Assessment. Energies 2018, 11, 3051. [Google Scholar] [CrossRef]
- Shi, G.; Li, K. Signal Interference in Wi-Fi and ZigBee Networks; Springer International Publishing AG: Cham, Switzerland, 2017. [Google Scholar]
- Sunil, J.; Priyanka, R. Enabling Coexistence of ZigBee and Wi-Fi. Commun. Appl. Electron. (CAE) 2015, 2, 28–34. [Google Scholar]
- Barnabei, A.L.; Grassi, M.; Dallago, E.; Malcovati, P.; Finarelli, D.G.; Liberale, A.; Quaglia, F. A wireless irradiance-temperature-humidity sensor for photovoltaic plant monitoring applications. In Proceedings of the 2012 IEEE SENSORS, Taipei, Taiwan, 28–31 October 2012. [Google Scholar] [CrossRef]
- Jaiswal, L.; Kaur, J.; Singh, G. Performance Analysis of Topological Variation in Personal Area Network using ZigBee Wireless Sensors I. JCST 2012, 3, 706–711. [Google Scholar]
- Vlajic, N.; Stevanovic, D.; Spanogiannopoulos, G. Strategies for improving performance of IEEE 802.15.4 ZigBee WSNs with path constrained mobile sinks. Comput. Commun. 2011, 34, 743–757. [Google Scholar] [CrossRef]
- Yuan, W.; Keshan, C.; Chao, X.; Hongjian, L. Design and Implementation for ZigBee Long distance Wireless Data Transmission System. In Proceedings of the 10th International Conference on Electronic Measurement & Instruments (ICEMI), Chengdu, China, 16–19 August 2011. [Google Scholar]
- Inam, F.; Sundar, S. Using CC2592 Front End with CC2530; Texas Instruments Application Report/Specification Manual, SWRA465A; August 2014, Revised July 2015; Texas Instruments: Dallas, TX, USA, 2015. [Google Scholar]
- ZigBee CC2530; A True System-on-Chip Solution for 2.4-GHz, IEEE 802.15.4 and ZigBee Applications Data Specification Manual. Available online: www.ti.com/lit/an/swra465a/swra465a.pdf (accessed on 19 June 2019).
- ZigBee CC2592: A 2.4-GHz Range Extender Amplifier, Data Specification Manual (SWRS159). Available online: http://www.ti.com/jp/lit/ds/symlink/cc2592.pdf (accessed on 19 June 2019).
- Skyworks. SKY65337-11: 2.4 GHz Transmit/Receive Front-End Module, Datasheet. Available online: www.skyworksinc.com (accessed on 19 June 2019).
- Silicon Laboratories. EM260 ZigBee/802.15.4 Network Processor, Datasheet. Available online: www.silabs.com (accessed on 19 June 2019).
- Pierce, L.W. An investigation of the thermal performance of oil filled transformer winding. IEEE Trans. Power Deliv. 1992, 7, 1347–1358. [Google Scholar] [CrossRef]
- Lachman, M.F.; Griffin, J.; Walter, P.; Wilson, A. Real-time dynamic loading and thermal diagnostic of power transformers. IEEE Trans. Power Deliv. 2003, 18, 142–148. [Google Scholar] [CrossRef]
- Payne, E.K.; Harmah, D.J. Multi-parametric Telemetry Patient Monitoring System. Int. J. Sci. Res. Publ. 2015, 5, 272–276. [Google Scholar]
- Kai, C.; Zhanfeng, Y.; Xiong, C. Model predictive control security economic dispatch model considering transmission line thermal inertia effect. Trans. CES 2018, 33, 1875–1883. [Google Scholar]
- Uttamchandani, D. Handbook of MEMS for Wireless and Mobile Applications; Woodhead Publishing Limited: New Delhi, India, 2013. [Google Scholar]
- Nihtianov, S.; Luque, A. Smart Sensors and MEMS Intelligent Devices and Microsystems for Industrial Applications; Woodhead Publishing Limited: New Delhi, India, 2014. [Google Scholar]
- Olukan, T.A.; Emziane, M. A Comparative Analysis of PV Module Temperature Models, 6th International Conference on Sustainability in Energy and Buildings, SEB-14. Energy Procedia 2014, 62, 694–703. [Google Scholar] [CrossRef]
- Greenwood, D.M.; Gentle, J.P.; Myers, K.S.; Davison, P.J.; West, I.J.; Bush, J.W.; Ingram, G.L.; Troffaes, M.C. A comparison of real-time thermal rating systems in the U.S. and the U.K. IEEE Trans. Power Deliv. 2014, 29, 1849–1858. [Google Scholar] [CrossRef]


| Characteristics. | XBee ZB | XBee-PRO 2B/C | XBee-PRO 868 |
|---|---|---|---|
| Indoor Range | 40 m | 90 m | 550 m |
| Line-of-Sight Range | 120 m | 1.5 km/3.2 km | 40 km |
| Radio Frequency Data Rate | 250 kbps | 250 kbps | 24 kbps |
| Frequency | 2.4 GHz | 2.4 GHz | 868 MHz |
| Transmit Power | 1.25 mW/2 mW | 10 mW/63 mW | 1 mW/315 mW |
| Encryption | 128-bit AES | 128-bit AES | 128-bit AES |
| Transmit Current | 35 mA/45 mA | 205 mA/120 mA | 500 mA |
| Receive Current | 38 mA/40 mA | 45–47 mA | 65 mA |
| Number Channels | 16 | 15 | 1 |
| Regions | Europe, Japan, Australia, UK, Canada, USA, Global | Europe, Japan, Australia, UK Canada, USA, Global | Europe |
| ZigBee Technology (XBee-Pro ZigBee {S2C}) | |
|---|---|
| Overview: Higher Signal Strength, Less Power Consumption and Longer Range. | |
| Characteristics | |
| Frequency | 2.4 GHz |
| Data rate | RF:250 kbps: Serial:1 Mbps |
| Maximum power transmit | 63 mW (18 dBm) |
| Max. current consumption (Transmitting) | 120 mA |
| Maximum receiver sensitivity | −101 dBm |
| Max. current consumption (Receiving) | 45 mA |
| Max. current consumption (sleep) | <1 μA |
| Maximum line of sight range | 3.2 km |
| Supply voltage | 2.7–3.6 VDC |
| Operating temperature | −40–+85 °C |
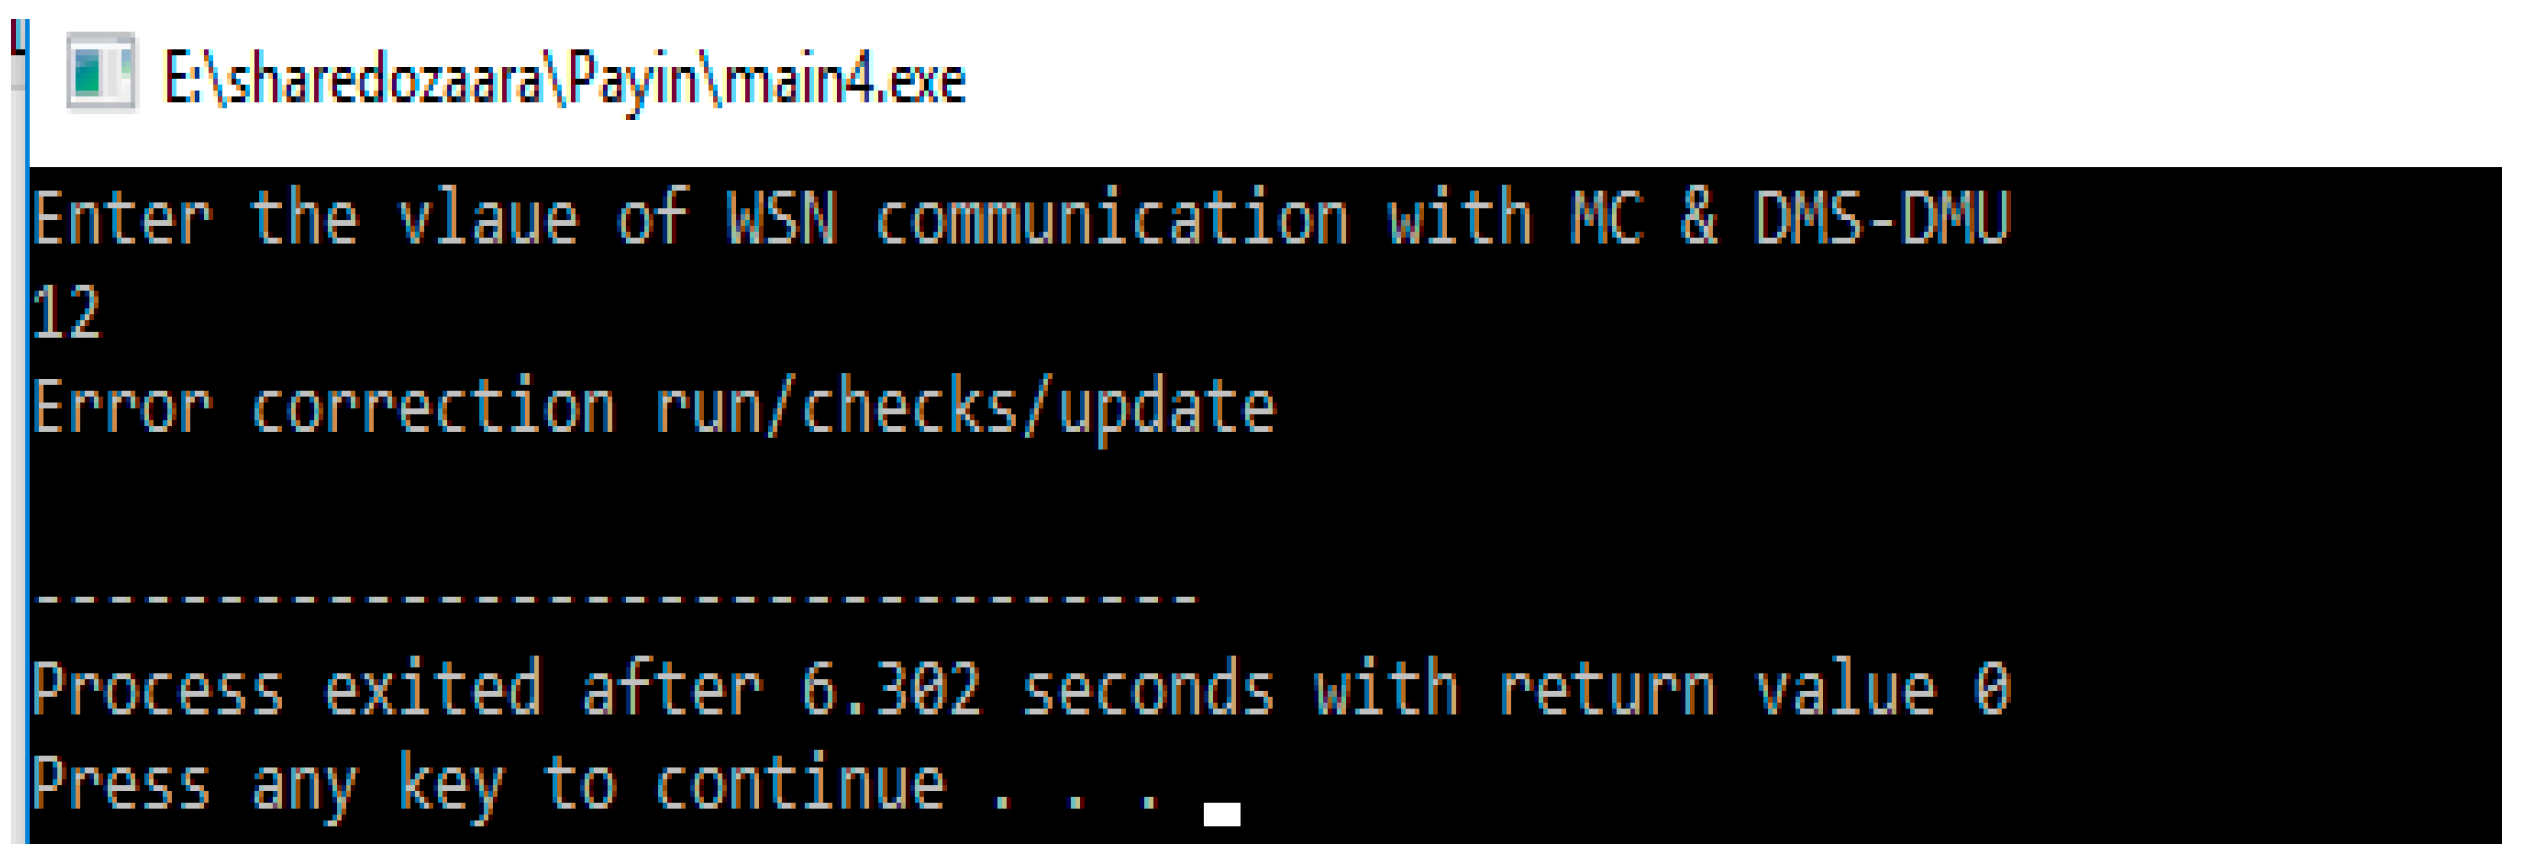
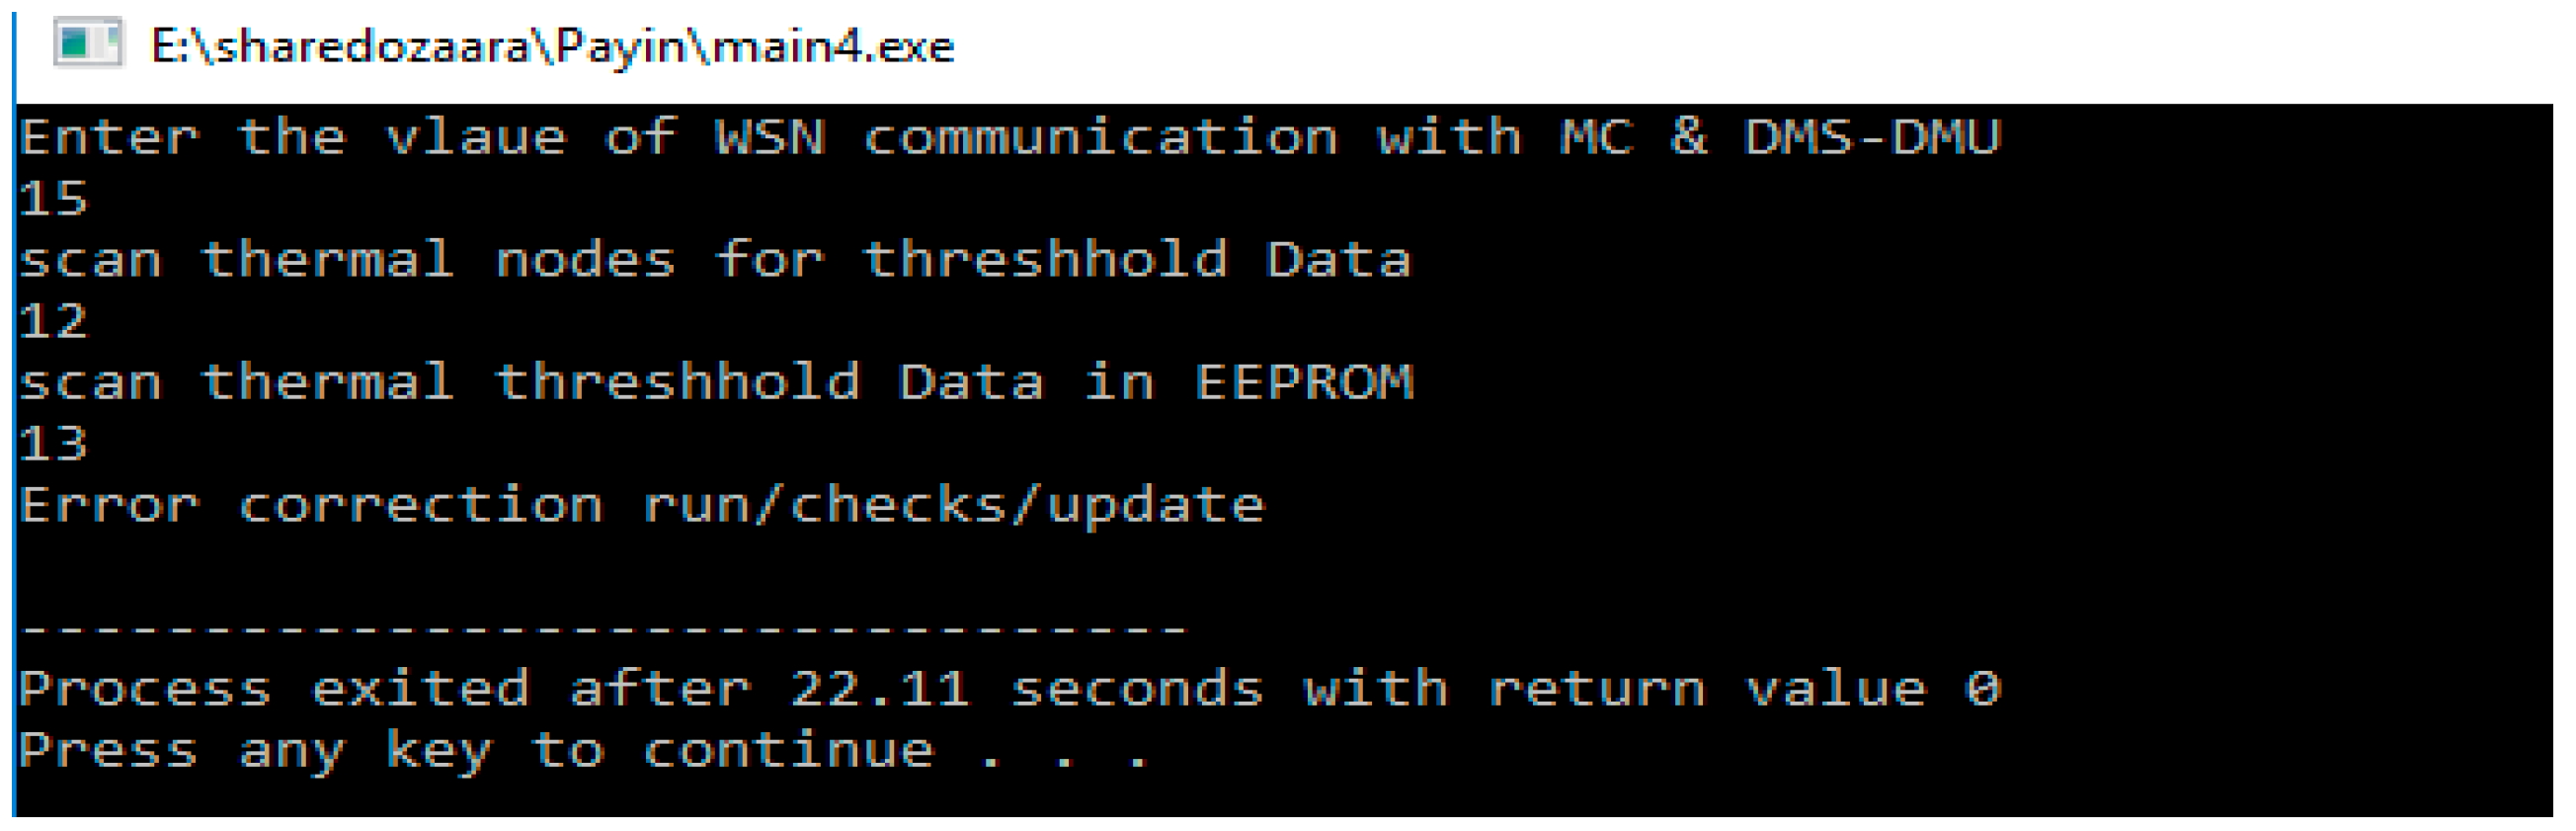
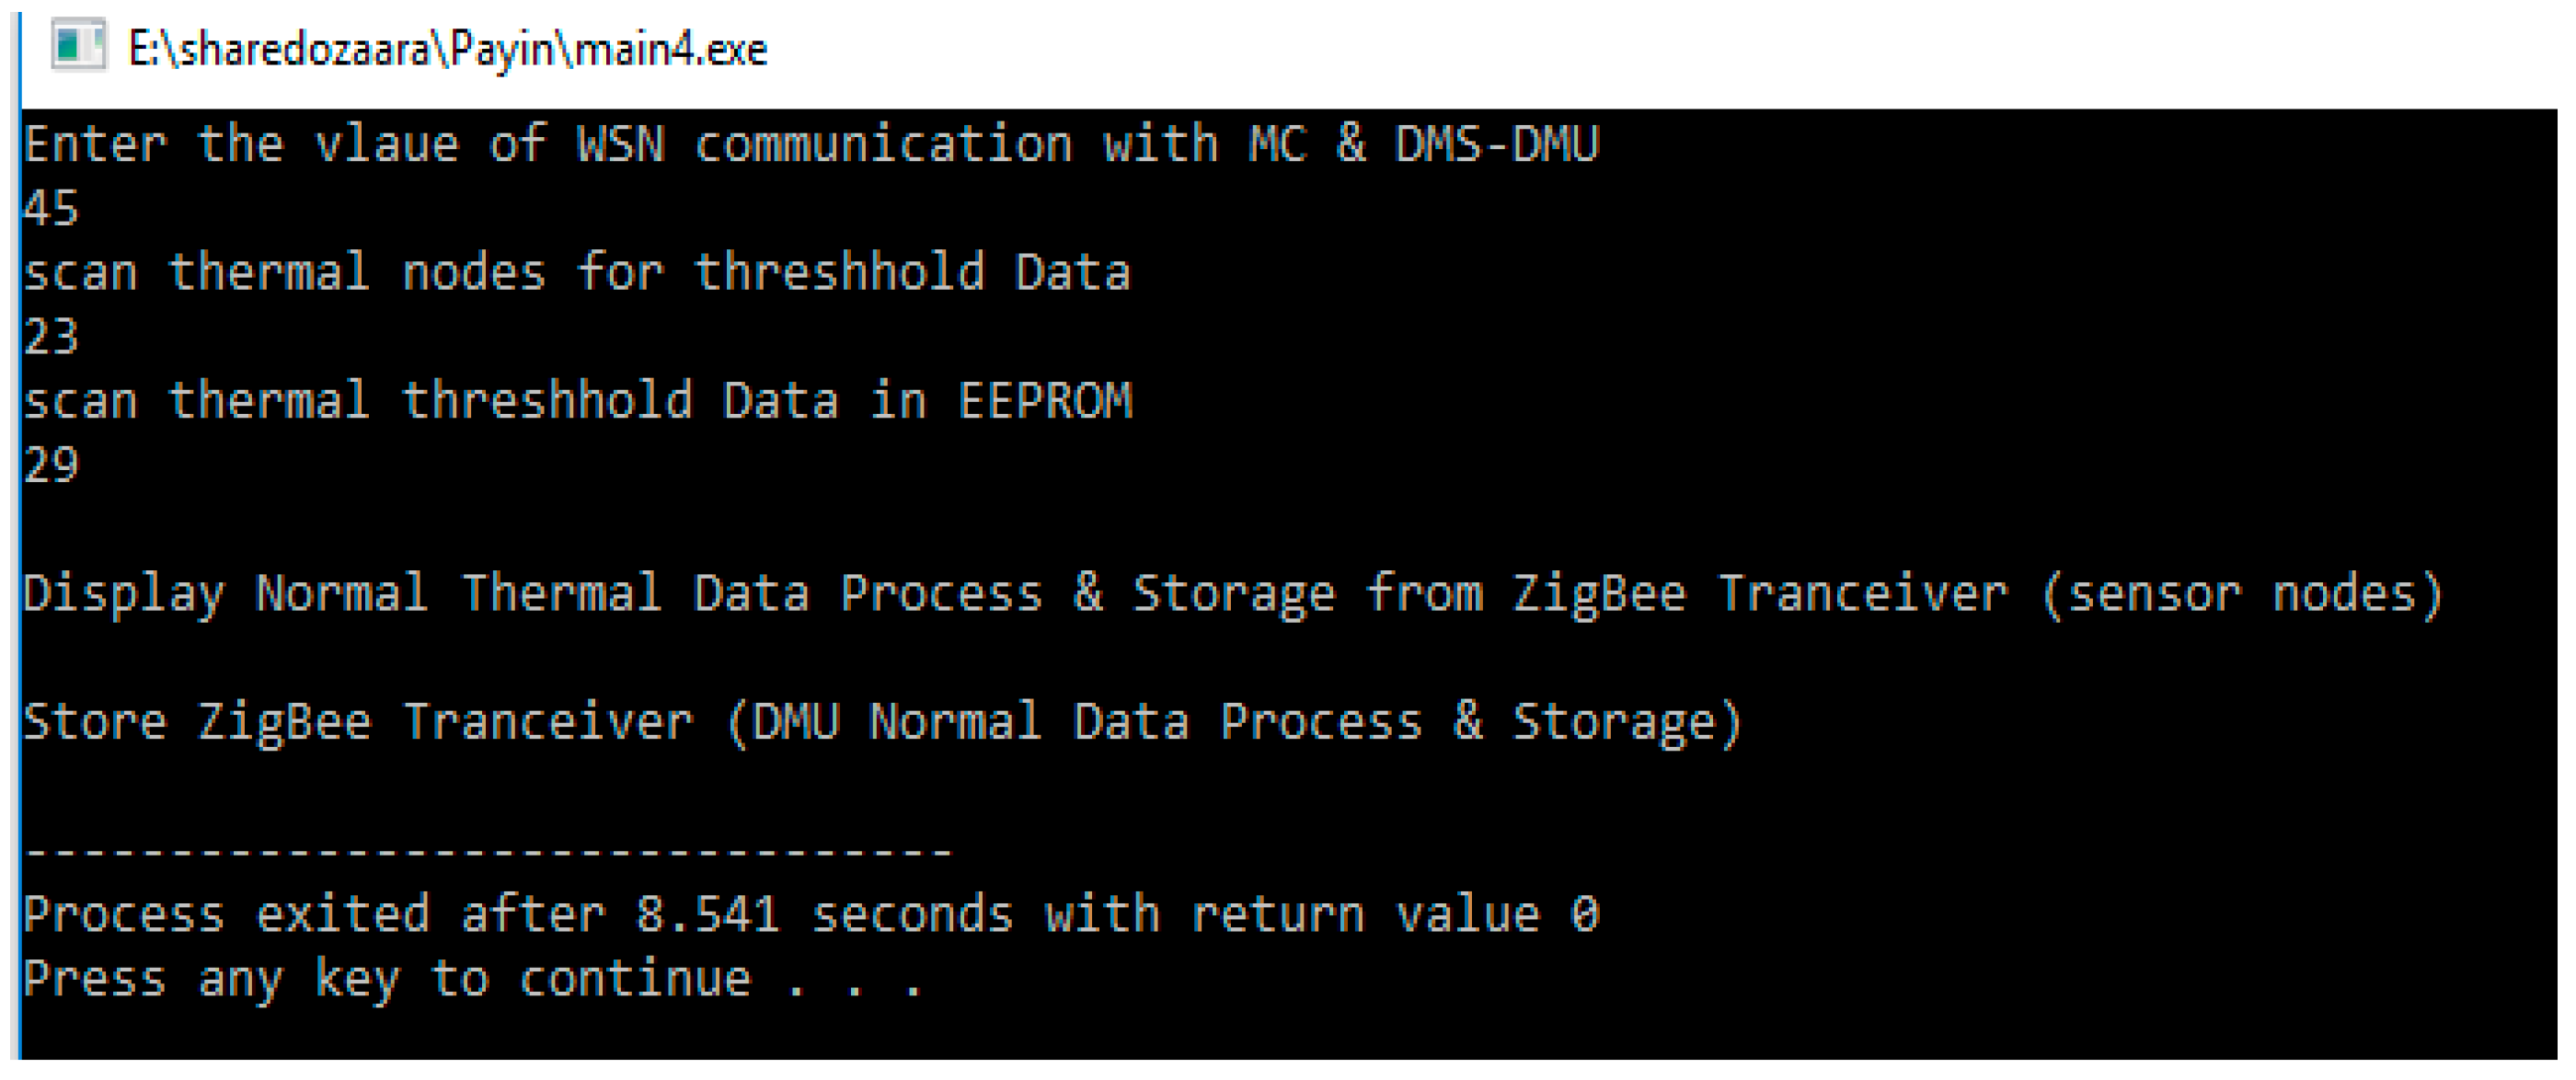
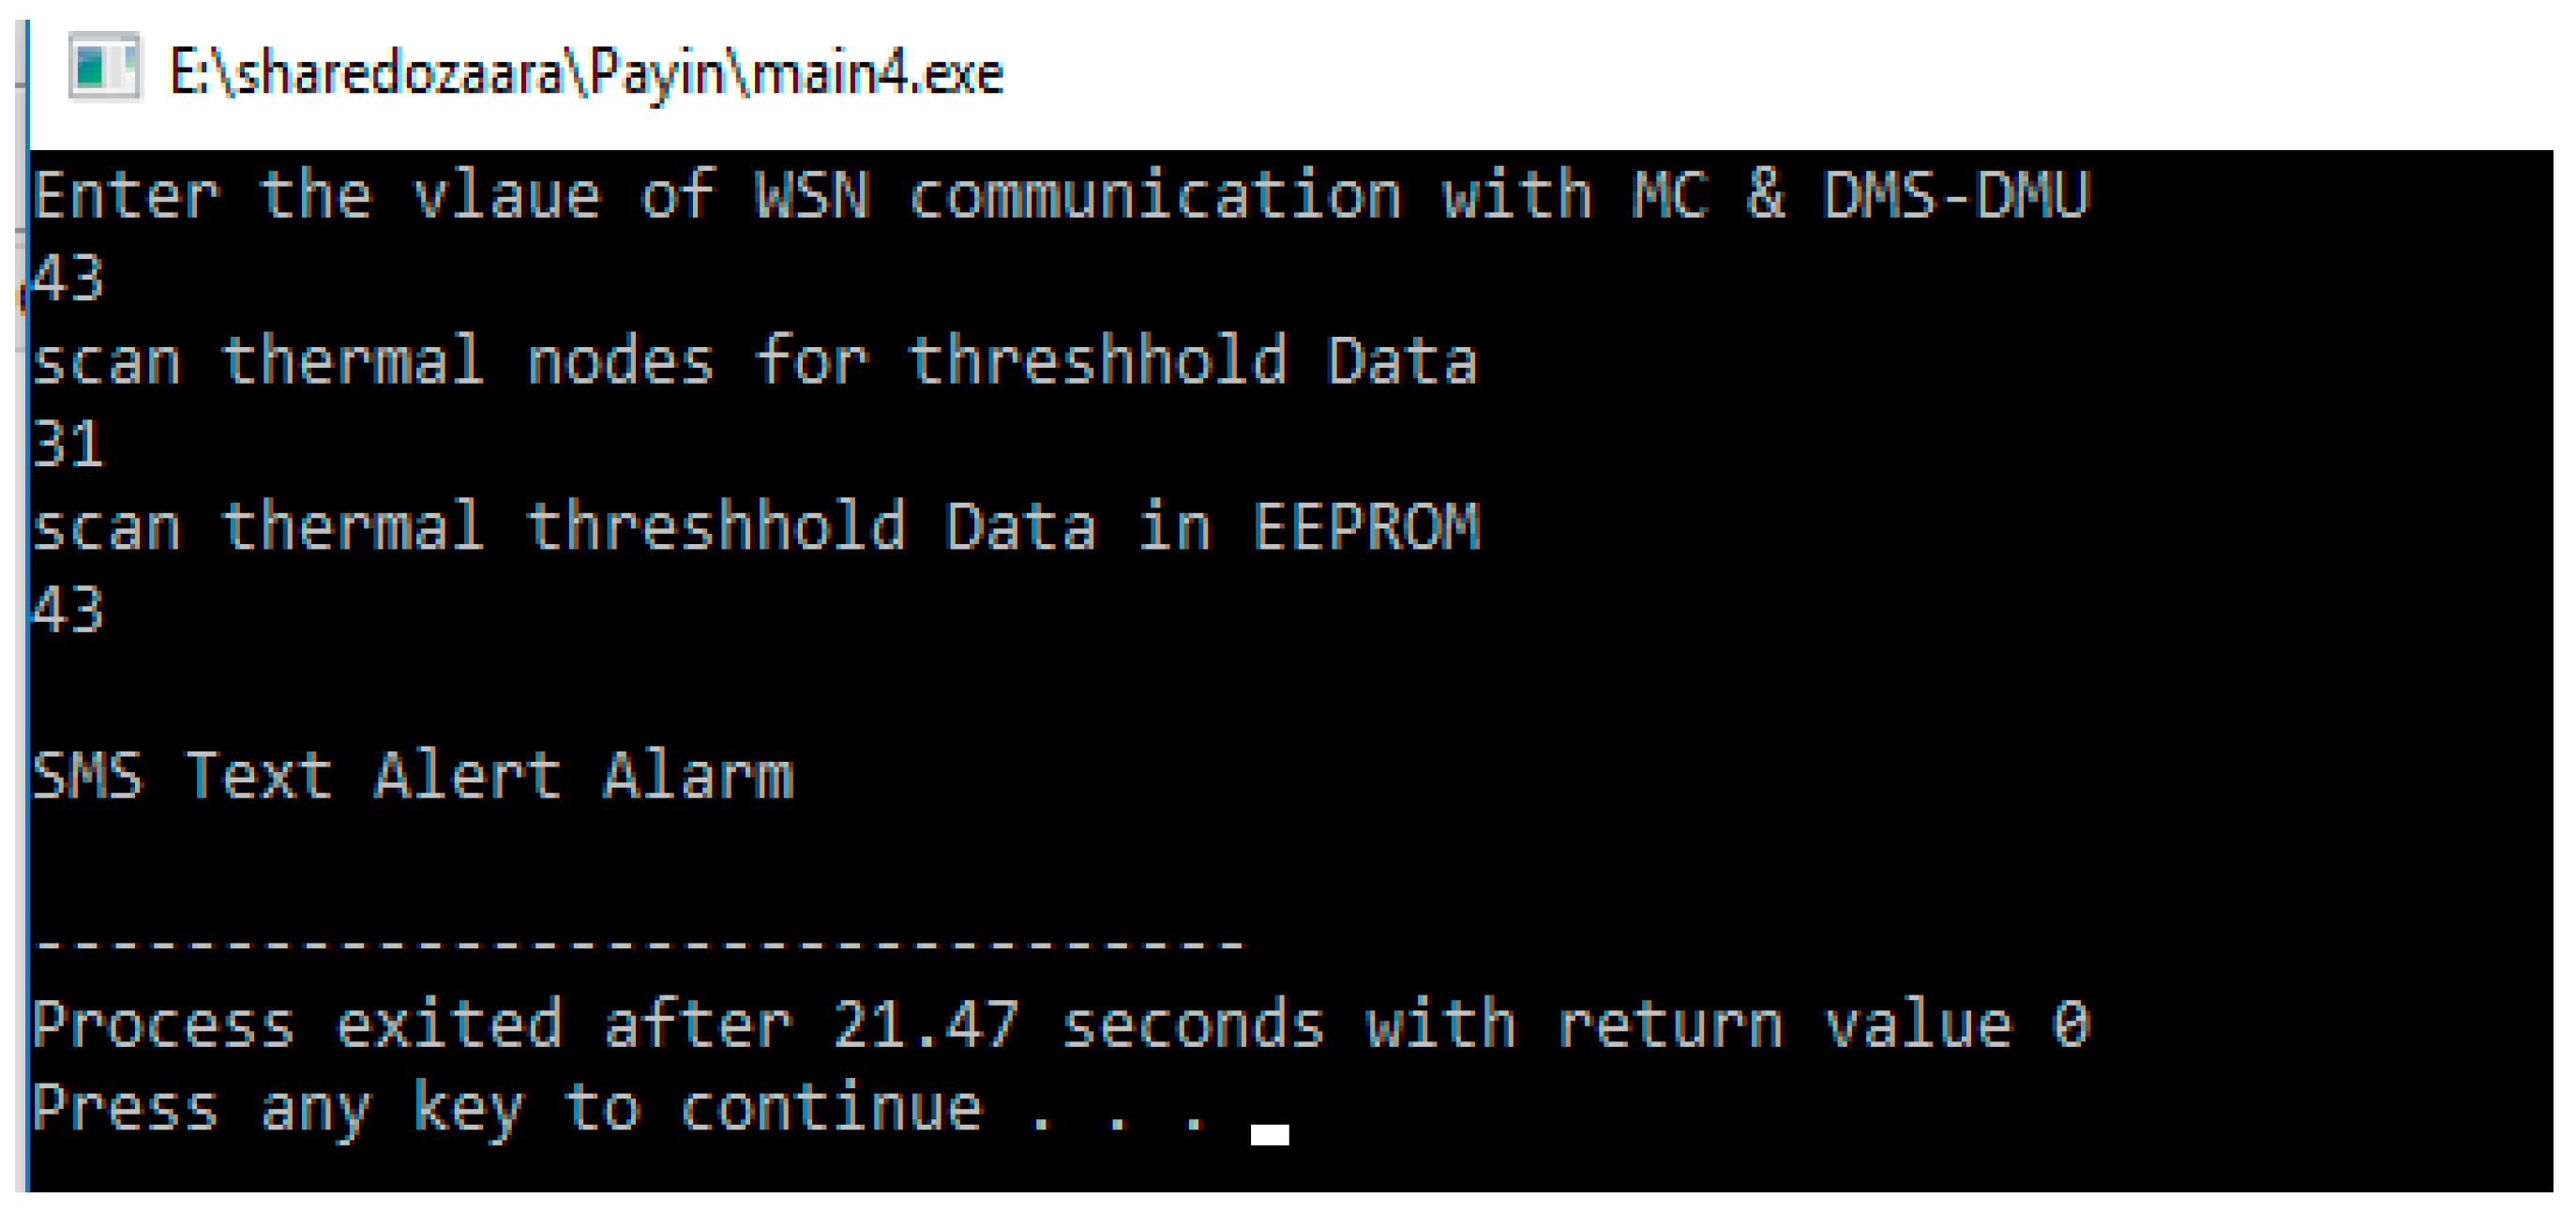
| Steps | Algorithm Functions |
|---|---|
| Step 1 | The system is powered and regularized. |
| Step 2 | Checks and confirmation of WSNs nodes communication with microcontroller and DMS–DMU system |
| Step 3A | Sensor nodes are initialized to communicate with other end devices via Arduino ATMega328P Microcontroller (MC) ZigBee WSNs/GSM through gateway interface |
| Step 3B | Error/Correction/Checks. “NO” from step 3A, system updates and confirms operations after error checked and cleared |
| Step 4 & 5 | WSNs confirm threshold data for respective sensor nodes, which should not exceed the set threshold values. The threshold values are saved in the EEPROM to avoid data loss should there be an incipient power failure |
| Step 6 & 7A | Sensor nodes threshold data compares with the set threshold. If “Normal” (re-route to step 3A for next cycle from 7A), and if “Abnormal” (process activates GSM SMS Text Alert to send the message to DMS-DMU gateway interface for end field remedial action) through step 7C |
| Step 7B | Normal threshold data processed for storage through ZigBee transceiver for archives |
| Step 7C | Data exchange at DMS-DMU for “Abnormal” triggers SMS Text alert set from step 6 on transitioning”. Abnormal” SMS Alert/Display at DMS – DMU. The abnormal alert could be configured for control solutions or remedial action. |
| Step 8 | ZigBee transceiver at DMU Normal Data Process & Storage and display) |
| Step 9 | End of program |
© 2019 by the authors. Licensee MDPI, Basel, Switzerland. This article is an open access article distributed under the terms and conditions of the Creative Commons Attribution (CC BY) license (http://creativecommons.org/licenses/by/4.0/).
Share and Cite
Payne, E.K.; Lu, S.; Wang, Q.; Wu, L. Concept of Designing Thermal Condition Monitoring System with ZigBee/GSM Communication Link for Distributed Energy Resources Network in Rural and Remote Applications. Processes 2019, 7, 383. https://doi.org/10.3390/pr7060383
Payne EK, Lu S, Wang Q, Wu L. Concept of Designing Thermal Condition Monitoring System with ZigBee/GSM Communication Link for Distributed Energy Resources Network in Rural and Remote Applications. Processes. 2019; 7(6):383. https://doi.org/10.3390/pr7060383
Chicago/Turabian StylePayne, Emmanuel Kobina, Shulin Lu, Qian Wang, and Licheng Wu. 2019. "Concept of Designing Thermal Condition Monitoring System with ZigBee/GSM Communication Link for Distributed Energy Resources Network in Rural and Remote Applications" Processes 7, no. 6: 383. https://doi.org/10.3390/pr7060383
APA StylePayne, E. K., Lu, S., Wang, Q., & Wu, L. (2019). Concept of Designing Thermal Condition Monitoring System with ZigBee/GSM Communication Link for Distributed Energy Resources Network in Rural and Remote Applications. Processes, 7(6), 383. https://doi.org/10.3390/pr7060383